
Numerical Evaluation of a HVAC System Based on a High-Performance Heat Transfer Fluid


Abstract
1. Introduction
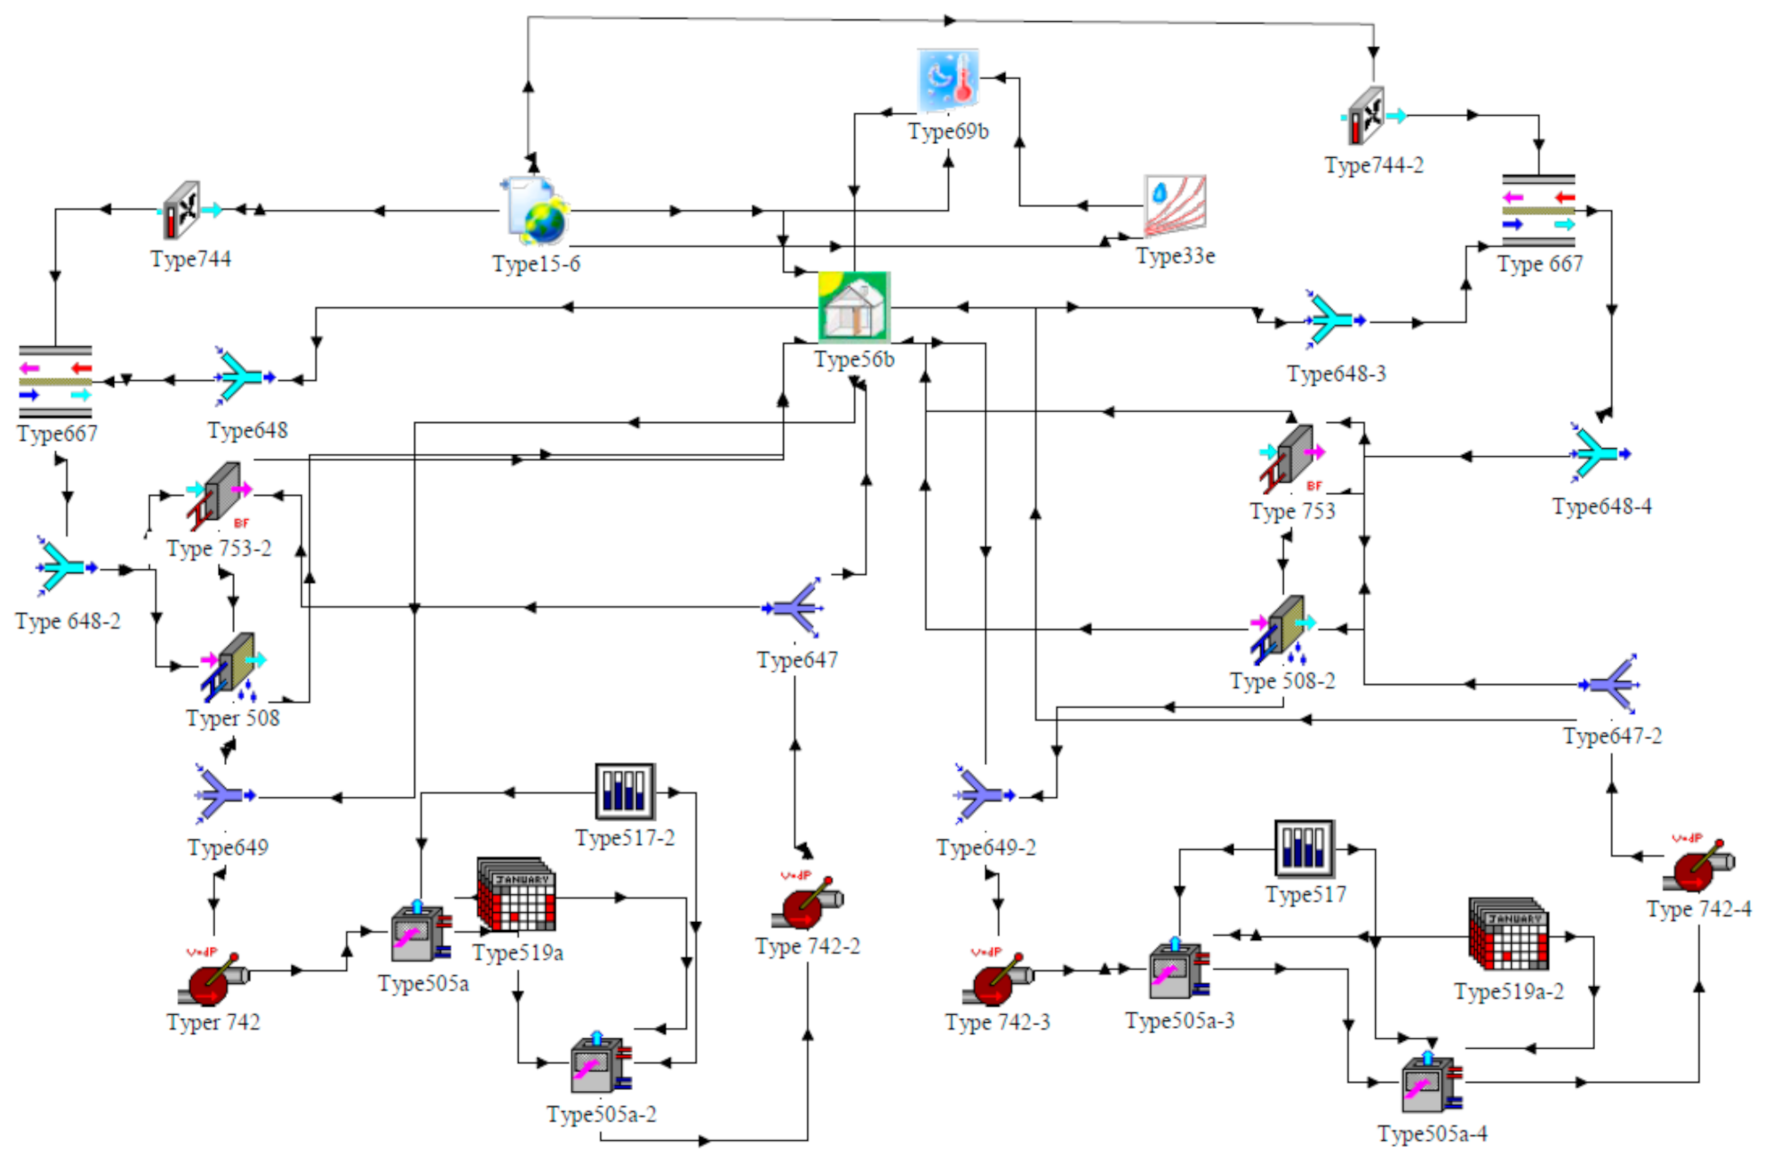
2. TRNSYS Model
2.1. Building Description
- right ground floor;
- left ground floor;
- right first floor;
- left first floor;
- right second floor;
- left second floor.
2.2. Simulation Model
2.3. Second Simulation Model
2.4. Nanofluid Characteristics
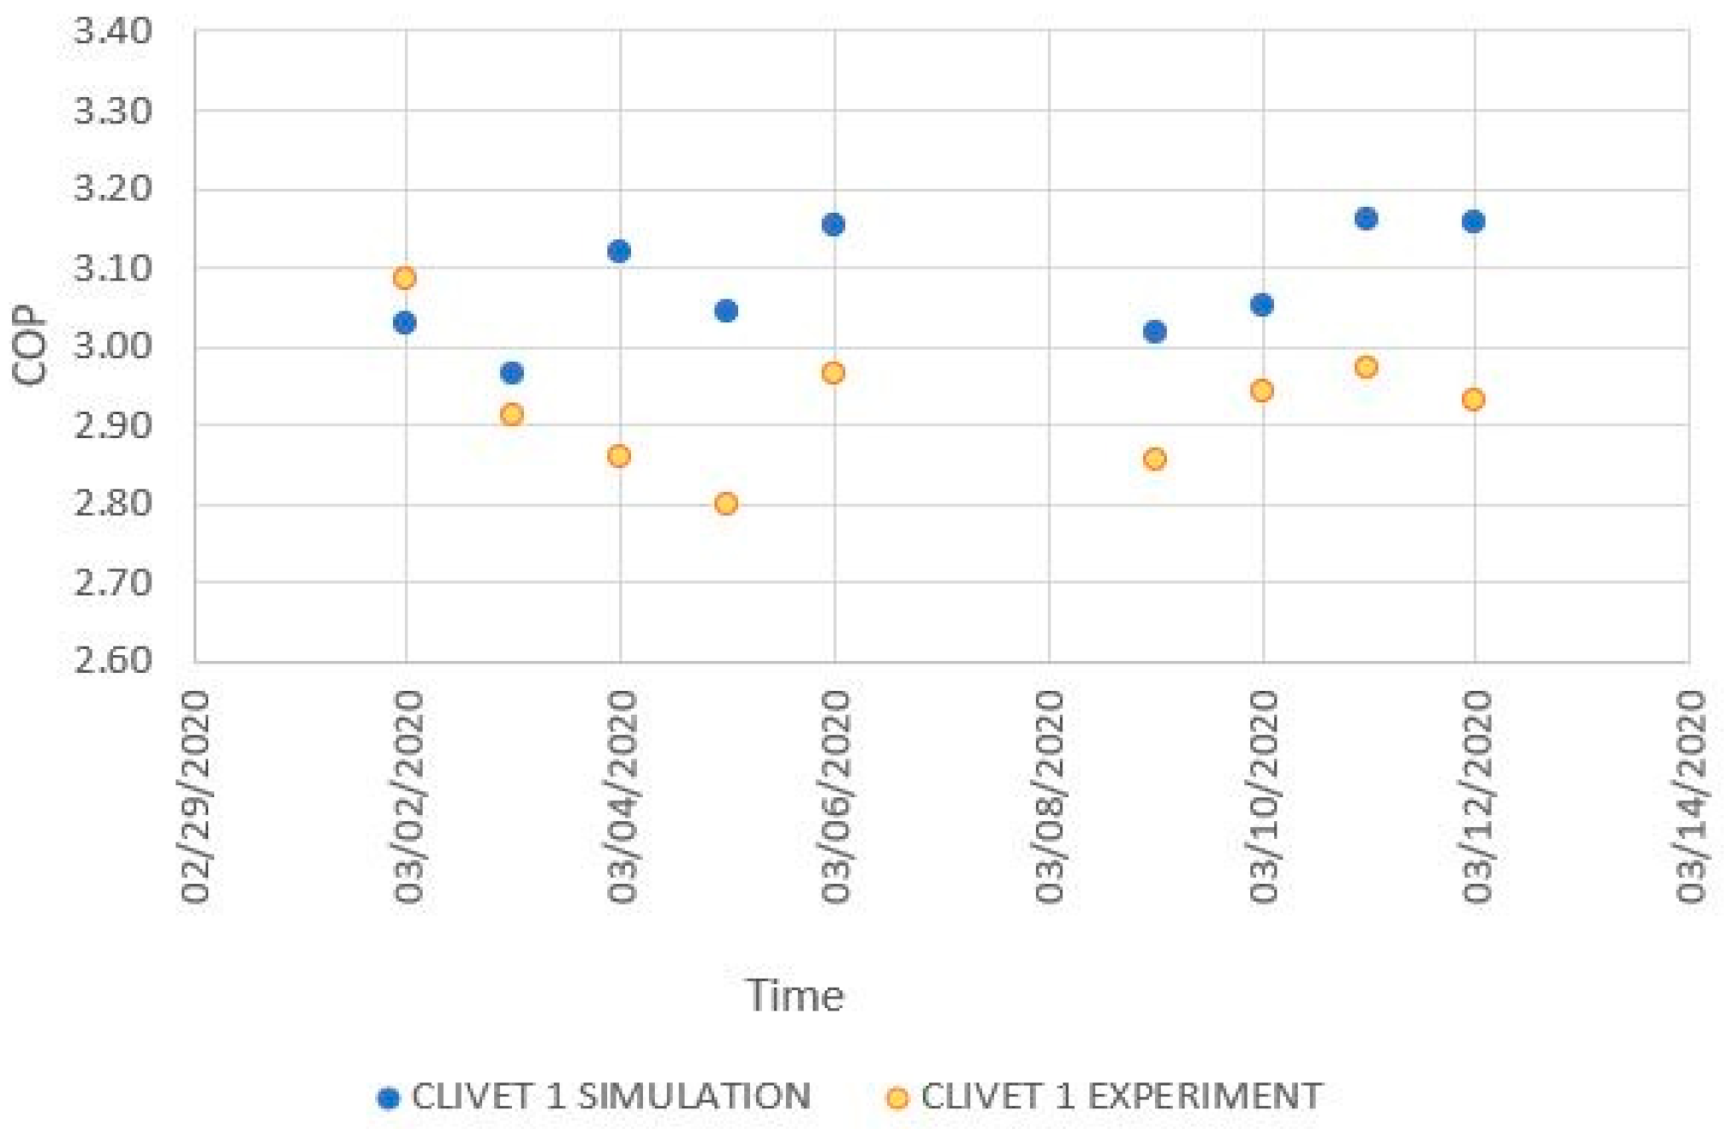
3. Model Validation
4. Results and Discussion
- -
- 1st simulation: HVAC system in standard operation (without changes to operating conditions) working with traditional heat transfer fluid (60% of water and 40% of glycol) and nanofluid;
- -
- 2nd simulation: HVAC system working by keeping the thermal power transferred to the building constant and using water-glycol first and nanofluid after;
- -
- 3rd simulation: HVAC system with external heat exchanger working with traditional heat transfer fluid and nanofluid.
Simulations
5. Conclusions
Author Contributions
Funding
Institutional Review Board Statement
Informed Consent Statement
Data Availability Statement
Conflicts of Interest
References
- Choi, S.S.; Eastman, A.A. Enhancing thermal conductivity of fluids with nanoparticles. In Proceedings of the 1995 International Mechanical Engineering Congress and Exhibition, San Francisco, CA, USA, 12–17 November 1995; pp. 99–105. [Google Scholar]
- Mukherjee, S.; Chakrabarty, S.; Mishra, P.C.; Chaudhuri, P. Transient heat transfer characteristics and process intensification with Al2O3-water and TiO2-water nanofluids: An experimental investigation. Chem. Eng. Process. Process. Intensif. 2020, 150, 107887. [Google Scholar] [CrossRef]
- Colangelo, G.; Favale, E.; Milanese, M.; Starace, G.; de Risi, A. Experimental Measurements of Al2O3 and CuO Nanofluids Interaction with Microwaves. J. Energy Eng. 2017, 143, 04016045. [Google Scholar] [CrossRef]
- Estellé, P.; López, L.H.; Buschmann, M.H. Special Issue of the 1st International Conference on Nanofluids (ICNf19). Energies 2020, 13, 2290. [Google Scholar] [CrossRef]
- Çobanoğlu, N.; Karadeniz, Z.H. Effect of nanofluid thermophysical properties on the performance prediction of single-phase natural circulation loops. Energies 2020, 13, 2523. [Google Scholar] [CrossRef]
- Oh, D.-W. Thermal property measurement of nanofluid droplets with temperature gradients. Energies 2020, 13, 244. [Google Scholar] [CrossRef]
- Lomascolo, M.; Colangelo, G.; Milanese, M.; de Risi, A. Review of heat transfer in nanofluids: Conductive, convective and radiative experimental results. Renew. Sustain. Energy Rev. 2015, 43, 1182–1198. [Google Scholar] [CrossRef]
- Das, S.K.; Putra, N.; Theisen, P.; Roetzel, W. Temperature dependence of thermal conductivity enhancement for nanofluids. J. Heat Transf. 2003, 125, 567–574. [Google Scholar] [CrossRef]
- Hamilton, R.L.; Crosser, O.K. Thermal Conductivity of Heterogeneous Two-Component Systems. Ind. Eng. Chem. Fundam. 1962, 1, 187–191. [Google Scholar] [CrossRef]
- Patel, H.E.; Das, S.K.; Sundarajan, T.; Sreekumanran, N.A.; George, B.; Pradeep, T. Thermal conductivity of naked and monolayer protected metal nanoparticle based nanofluids: Manifestation of anomalous enhancement and chemical effects. Appl. Phys. Lett. 2003, 83, 2931–2933. [Google Scholar] [CrossRef]
- Chon, C.H.; Khm, K.D.; Lee Sp Choi, S.U.S. Empirical correlation finding the role of temperature and particle size for nanofluids (Al2O3) thermal conductivity enhancement. Appl. Phys. Lett. 2005, 87, 153107. [Google Scholar] [CrossRef]
- Beck, M.P.; Yuan, Y.; Warrier, P.; Teja, A.S. The effect of particle size on the thermal conductivity of alumina nanofluids. J. Nanopart. Res. 2009, 11, 1129–1136. [Google Scholar] [CrossRef]
- Chaji, H.; Ajabshirchi, Y.; Esmaeilzadeh, E.; Heris, S.Z.; Hedayatizadeh, M.; Kahani, M. Experimental study on thermal effi-ciency of flat plate solar collector using TiO2/Water nanofluid. Appl. Sci. 2013, 7, 60–70. [Google Scholar]
- Al-Waeli, A.H.; Sopian, K.; Kazem, H.A.; Chaichan, M.T. Nanofluid based grid connected PV/T systems in Malaysia: A technoeconomical assessment. Sustain. Energy Technol. Assess. 2018, 28, 81–85. [Google Scholar] [CrossRef]
- Ghadimi, A.; Saidur, R.; Metselaar, H. A review of nanofluid stability properties and characterization in stationary conditions. Int. J. Heat Mass Transf. 2011, 54, 4051–4068. [Google Scholar] [CrossRef]
- Hwang, Y.; Lee, J.K.; Lee, C.H.; Jung, Y.M.; Cheong, S.I.; Lee, C.G.; Ku, B.C.; Jang, S.P. Stability and thermal conductivity char-acteristics of nanofluids. Thermochim. Acta 2007, 455, 70–74. [Google Scholar] [CrossRef]
- Sun, X.-H.; Yan, H.; Massoudi, M.; Chen, Z.-H.; Wu, W.-T. Numerical simulation of nanofluid suspensions in a geothermal heat exchanger. Energies 2018, 11, 919. [Google Scholar] [CrossRef]
- Ejeh, C.; Afga, I.; AlMansob, H.; Brantson, E.; Fekala, J.; Odiator, M.; Stanlet, P.; Anumah, P.; Onyekperem, C.; Boah, E. Computational fluid dynamics for ameliorating oil recovery using silicon-based nanofluids and ethanol in oil-wet reservoirs. Energy Rep. 2020, 6, 3023–3035. [Google Scholar] [CrossRef]
- Lee, J.H.; Hwang, S.G.; Lee, G.H. Efficiency Improvement of a Photovoltaic Thermal (PVT) system using nanofluids. Energies 2019, 12, 3063. [Google Scholar] [CrossRef]
- Colangelo, G.; Milanese, M.; De Risi, A. Energy simulation of a nanofluid solar cooling system in Italy. Proc. Inst. Civ. Eng. Sustain. 2019, 172, 32–39. [Google Scholar] [CrossRef]
- Colangelo, G.; Favale, E.; Miglietta, P.; de Risi, A. Innovation in flat solar thermal collectors: A review of the last ten years experimental results. Renew. Sustain. Energy Rev. 2016, 57, 1141–1159. [Google Scholar] [CrossRef]
- Colangelo, G.; Favale, E.; de Risi, A.; Laforgia, D. A new solution for reduced sedimentation flat panel solar thermal collector using nanofluids. Appl. Energy 2013, 111, 80–93. [Google Scholar] [CrossRef]
- Milanese, M.; Colangelo, G.; Cretì, A.; Lomascolo, M.; Iacobazzi, F.; de Risi, A. Optical absorption measurements of oxide nanoparticles for application as nanofluid in direct absorption solar power systems—Part I: Water-based nanofluids behavior. Sol. Energy Mater. Sol. Cells 2016, 147, 315–320. [Google Scholar] [CrossRef]
- Milanese, M.; Colangelo, G.; Cretì, A.; Lomascolo, M.; Iacobazzi, F.; De Risi, A. Optical absorption measurements of oxide nanoparticles for application as nanofluid in direct absorption solar power systems—Part II: ZnO, CeO2, Fe2O3 nanoparticles behavior. Sol. Energy Mater. Sol. Cells 2016, 147, 321–326. [Google Scholar] [CrossRef]
- De Risi, A.; Milanese, M.; Laforgia, D. Modelling and optimization of transparent parabolic trough collector based on gas phase nanofluids. Renew. Energy 2013, 58, 134–139. [Google Scholar] [CrossRef]
- Alsalame, H.A.M.; Lee, J.H.; Lee, G.H. Performance Evaluation of a Photovoltaic Thermal (PVT) system using nanofluids. Energies 2021, 14, 301. [Google Scholar] [CrossRef]
- Reddy, K.S.; Kamnapure, N.R. Optical analysis and thermal management of 2-cell strings linear concentrating photovoltaic system. In Proceedings of the 11th International Conference on Concentrator Photovoltaic Systems: Cpv-11, Aix-les-Bains, France, 13–15 April 2015; AIP Publishing: College Park, MD, USA, 2015; Volume 1679, p. 110002. [Google Scholar]
- Sardarabadi, M.; Passandideh-Fard, M.; Heris, S.Z. Experimental investigation of the effects of silica/water nanofluid on PV/T (photovoltaic thermal units). Energy 2014, 66, 264–272. [Google Scholar] [CrossRef]
- Aksoy, Y.T.; Zhu, Y.; Eneren, P.; Koos, E.; Vetrano, M.R. The impact of nanofluids on droplet/spray cooling of a heater surface: A critical review. Energies 2021, 14, 80. [Google Scholar] [CrossRef]
- Zhang, Z.D.; Zheng, W.; Su, Z.G. Study on diesel cylinder-head cooling using nanofluid coolant with jet impingement. Therm. Sci. 2015, 19, 2025–2037. [Google Scholar]
- Faizan, A.; Khan, W.A. Efficiency enhancement of an air-conditioner utilizing nanofluid: An experimental study. Energy Rep. 2021, 7, 575–583. [Google Scholar]
- Colangelo, G.; D’Andrea, G.; Franciosa, M.; Milanese, M.; De Risi, A. Dynamic simulation of a solar cooling HVAC system with nanofluid. In Proceedings of the International Conference ZEMCH2015, Lecce, Italy, 22–25 September 2015. [Google Scholar]
- Abro, K.A.; Memon, A.A.; Hussain, S.; Khan, I.; Tlili, I. Enhancement of heat transfer rate of solar energy via rotating Jeffrey nanofluids using Caputo-Fabrizio fractional operator: An Application to solar energy. Energy Rep. 2019, 5, 41–49. [Google Scholar] [CrossRef]
- Khullar, V.; Tyagi, H. Application of nanofluids as the working fluid in concentrating parabolic solar collectors. In Proceedings of the 37th National and 4th International Conference on Fluid Mechanics and Fluid Power 10-BN-06, Madras, India, 16–18 December 2010; pp. 1–9. [Google Scholar]
- Du, R.; Jiang, D.; Wang, Y. Numerical investigation of the effect of nanoparticle diameter and sphericity on the thermal performance of geothermal heat exchanger using nanofluid as heat transfer fluid. Energies 2020, 13, 1653. [Google Scholar] [CrossRef]
- Marefati, M.; Huang, W. Energy, exergy, environmental and economic comparison of various solar thermal systems using water and Thermic Oil B base fluids, and CuO and Al2O3 nanofluids. Energy Rep. 2020, 6, 2919–2947. [Google Scholar]
- Sattar, A.; Farooq, M.; Amjad, M.; Saeed, M.A.; Nawaz, S.; Mujtaba, M.; Anwar, S.; El-Sherbeeny, A.M.; Soudagar, M.E.M.; Filho, E.P.B.; et al. Performance evaluation of a direct absorption collector for solar thermal energy conversion. Energies 2020, 13, 4956. [Google Scholar] [CrossRef]
- Lee, S.; Choi, S.U.S.; Li, S.; Eastman, J.A. Measuring thermal conductivity of fluids containing oxide nanoparticles. J. Heat Transf. 1999, 121, 280–289. [Google Scholar] [CrossRef]
- Balla, H.; Abdullah, S.; Faizal, W.M.W.; Zulkifli, R.; Sopian, K. Enhancement of heat transfer coefficient multi-metallic nanofluid with ansis modeling for thermophysical properties. Therm. Sci. 2015, 9, 1613–1620. [Google Scholar] [CrossRef]
- Colangelo, G.; Favale, E.; Miglietta, P.; Milanese, M.; de Risi, A. Thermal conductivity, viscosity and stability of Al2O3-diathermic oil nanofluids for solar energy systems. Energy 2016, 95, 124–136. [Google Scholar] [CrossRef]
- Jasim, Q.K.; Saleh, N.M.; Hussein, A.M. Improving thermal performance using Al2O3-water nanofluid in a d double pipe heat exchanger filling with porous medium. Therm. Sci. 2020, 24, 4267–4275. [Google Scholar] [CrossRef]
- Kulkarni, D.P.; Das, D.K.; Vajjha, R.S. Application of nanofluids in heating building and reducing pollution. Appl. Energy 2009, 86, 2566–2573. [Google Scholar] [CrossRef]
- Cao, F.; Li, H.; Zhao, L.; Bao, T.; Guo, L. Design and simulation of the solar chimney power plants with TRNSYS. Sol. Energy 2013, 98, 23–33. [Google Scholar] [CrossRef]
- Cerezo, J.; Romero, R.J.; Ibarra, J.; Rodriguez, A.; Montero, G.; Acuña, A. Dynamic simulation of an absorption cooling system with different working mixtures. Energies 2018, 11, 259. [Google Scholar] [CrossRef]
- Dongellini, M.; Abbenante, M.; Morini, G.L. Energy performance assessment of the heating system refurbishment on a school building in Modena, Italy. Energy Procedia 2016, 101, 948–955. [Google Scholar] [CrossRef]
- Zakula, T.; Bagaric, M.; Ferdelji, N.; Milovanovic, B.; Mudrinic, S.; Ritosa, K. Comparison of dynamic simulations and the ISO 52016 standard for the assessment of building energy performance. Appl. Energy 2019, 254, 17. [Google Scholar] [CrossRef]
- Aguilar-Jiménez, J.A.; Velázquez, N.; López-Zavala, R.; González-Uribe, L.A.; Beltrán, R.; Hernández-Callejo, L. Simulation of a solar-assisted air-conditioning system applied to a remote school. Appl. Sci. 2019, 9, 3398. [Google Scholar] [CrossRef]
- Asim, M.; Dewsbury, J.; Kanan, S. TRNSYS Simulation of a solar cooling system for the hot climate of Pakistan. Energy Procedia 2016, 91, 702–706. [Google Scholar] [CrossRef]
- Hamdani, M.; Bekkouche, S.; Benouaz, T.; Belarbi, R.; Cherier, M. The study natural ventilation by using buildings windows: Case study in a hot dry climate, Ghardaïa, Algeria. Energy Procedia 2017, 139, 475–480. [Google Scholar] [CrossRef]
- Kai, L.C.; Mohd Zulkifly, A.; Mohd Azmil, I.; Mamat, H. Enhancement of nanofluid heat transfer in a mini-tube using SiO2 nanoparticles. Adv. Mater. Process. Technol. 2019, 5, 607–616. [Google Scholar] [CrossRef]
- Maxwell 2020. Available online: https://htmaterialsscience.com/images/2019/07/17/Maxwell_2020_EG_SDS.pdf (accessed on 1 December 2019).
- Arpa Puglia. Available online: www.arpa.puglia.it (accessed on 1 September 2020).
- Tiwatane, T.; Barve, S. Experimental study of waste heat recovery using heat pipe heat exchanger with Hybrid nanofluids: A review. Int. J. Mech. Ind. Technol. 2015, 3, 40–47. [Google Scholar]


| LAYER | S [m] | λ [W/m°C] | C [W/m°C] | ρ [kg/m3] | δa × 1012 [kg m s Pa] | δu × 1012 [kg m s Pa] | R [m°C/W] |
|---|---|---|---|---|---|---|---|
| EXTERNAL WALL | |||||||
| Tuff | 0.1 | 1.7 | 2300 | 0.019 | 0.021 | 0.059 | |
| Air gap 100 mm | 0.1 | 0.64 | 1 | 193 | 212.3 | 0.156 | |
| Polyurethane foam | 0.05 | 0.04 | 30 | 2.412 | 2.654 | 1.25 | |
| Tuff | 0.15 | 0.63 | 4200 | 1400 | 0.019 | 0.021 | 0.238 |
| Lime plaster | 0.01 | 0.7 | 35 | 1400 | 19.3 | 21.23 | 0.014 |
| INTERNAL WALL | |||||||
| Lime plaster | 0.01 | 0.7 | 35 | 1400 | 19.3 | 21.23 | 0.014 |
| Perforated brick 1.1.22 150 | 0.15 | 2.22 | 1800 | 193 | 212.3 | 0.45 | |
| Lime plaster | 0.01 | 0.7 | 35 | 1400 | 19.3 | 21.23 | 0.014 |
| INTERNAL FLOOR | |||||||
| Marble tiles | 0.02 | 3 | 300 | 2700 | 0.019 | 0.021 | 0.007 |
| Ordinary concrete | 0.1 | 1.28 | 2200 | 2.757 | 3.033 | 0.078 | |
| Dry sand | 0.02 | 0.6 | 1700 | 12.867 | 14.153 | 0.033 | |
| Floor block 2.1.031/1 180 | 0.25 | 3.33 | 1800 | 193 | 212.3 | 0.3 | |
| Lime or cement mortar | 0.01 | 0.9 | 1800 | 9.65 | 10.615 | 0.011 | |
| COVERING ROOF | |||||||
| Ordinary concrete | 0.02 | 1.28 | 2200 | 2.757 | 3.033 | 0.016 | |
| Exterior brick wall 800 | 0.13 | 0.41 | 800 | 38.6 | 42.46 | 0.317 | |
| Ordinary concrete | 0.04 | 1.28 | 2200 | 2.757 | 3.033 | 0.031 | |
| Synthetic foamed polyester | 0.02 | 0.04 | 20 | 4.289 | 4.718 | 0.5 | |
| Ext. wall reinforced concrete | 0.13 | 1.31 | 2000 | 3.86 | 4.246 | 0.099 | |
| Semi-rigid wood panel | 0.02 | 0.043 | 20 | 193 | 212.3 | 0.465 | |
| Lime or cement mortar | 0.02 | 0.9 | 180 | 9.65 | 10.615 | 0.022 | |
| Terracotta tiles | 0.02 | 0.72 | 1800 | 27.571 | 30.329 | 0.028 | |
| Description | Ag [m2] | Af [m2] | Lg [m] | Kg [W/m2°C] | Kf [W/m2°C] | Kl [W/m2°C] | Kw [W/m2°C] |
|---|---|---|---|---|---|---|---|
| WINDOW | |||||||
| Single window | 1.35 | 0.09 | 4.6 | 1.045 | 3 | 1.173 | |
| WINDOW GLASS | |||||||
| Single window | 1.79 | 0.45 | 5.28 | 1.045 | 3 | 1.442 | |
| Model | Air Handling Unit UTS 05 |
|---|---|
| Air flow | 6000 m3/h |
| Static pressure | 200 Pa |
| Absorbed power | 0.55 kW |
| Cold coil with chilled water | |
| Water flow | 11.8 m3/h |
| Air Temperature | In 32 °C |
| Out 13.6 °C | |
| Pressure drop | 169 Pa |
| Flow speed | 2.5 m/s |
| Water Temperature | In 7 °C |
| Out 12 °C | |
| Pressure drop | 26.5 kPa |
| Cross flow heat recovery unit with upper shutters | |
| Supply air flow | 6000 m3/h |
| Supply air temperature | −5 °C |
| Extract air flow | 5000 m3/h |
| Extract air temperature | 22 °C |
| Fresh air temperature | 8 °C |
| Total efficiency | 49.5% |
| Model | WSAN-XEE 302 |
|---|---|
| Compressor | |
| Type | 2 Scroll |
| Refrigerant circuit | 1 |
| Refrigerant charge | 8.28 L |
| Internal exchanger | |
| Water flow | 3.4 L/s |
| Maximum water flow | 5.4 L/s |
| Pressure decrease | 41.9 kPa |
| Useful pump discharge | 131 kPa |
| External exchanger | |
| Fans | 6 |
| Standard air flow | 6971 L/s |
| Installed power unit | 0.18 kW |
| Expansion case | |
| Capacity | 5 L |
| Maximum pressure on the water | 550 kPa |
| Storage tank | |
| Inertial tank | 130 L |
| Composition (% by Weight) Propylene Glycol Performance Additives Water | 37 2 61 |
| Color | White |
| Odor | Odorless |
| pH | 10 |
| Specific Weight [kg/m3] at 25 °C | 1.078 |
| Operating Range [°C] | −22 to 65 |
| Freeze Point [°C] | −22 |
| Burst Point [°C] | −51 |
| Boiling Point [°C] | 105 |
| Flash Point [°C] | 104 |
| Thermal Conductivity [W/m K] at 20 °C | 0.471 |
| Specific Heat [kJ/kg K] at 20 °C | 3.51 |
| Viscosity [mPa s] at 20 °C | 4.74 |
Publisher’s Note: MDPI stays neutral with regard to jurisdictional claims in published maps and institutional affiliations. |
© 2021 by the authors. Licensee MDPI, Basel, Switzerland. This article is an open access article distributed under the terms and conditions of the Creative Commons Attribution (CC BY) license (https://creativecommons.org/licenses/by/4.0/).
Share and Cite
Colangelo, G.; Raho, B.; Milanese, M.; de Risi, A. Numerical Evaluation of a HVAC System Based on a High-Performance Heat Transfer Fluid. Energies 2021, 14, 3298. https://doi.org/10.3390/en14113298
Colangelo G, Raho B, Milanese M, de Risi A. Numerical Evaluation of a HVAC System Based on a High-Performance Heat Transfer Fluid. Energies. 2021; 14(11):3298. https://doi.org/10.3390/en14113298
Chicago/Turabian StyleColangelo, Gianpiero, Brenda Raho, Marco Milanese, and Arturo de Risi. 2021. "Numerical Evaluation of a HVAC System Based on a High-Performance Heat Transfer Fluid" Energies 14, no. 11: 3298. https://doi.org/10.3390/en14113298
APA StyleColangelo, G., Raho, B., Milanese, M., & de Risi, A. (2021). Numerical Evaluation of a HVAC System Based on a High-Performance Heat Transfer Fluid. Energies, 14(11), 3298. https://doi.org/10.3390/en14113298