1. Introduction
The discovery of infrared radiation gave rise to the science of thermography. It was discovered in 1800 by Friedrich Wilhelm Herschel, an English astronomer. In the second half of the 19th century, the following scientists, Kirchoff, Boltzman, Wiena and Planck, whose research laid the foundation for the development of thermal imaging, deepened the knowledge of thermal imaging. The first applications were for the military, where the first infrared indicators were built in the mid-20th century. In the 1960s, the first thermal imaging device appeared, which today is a thermal imaging camera [
1,
2,
3,
4].
Thermal imaging measures an object body whose temperature is higher than zero because it emits thermal radiation. This thermal radiation is the part of the electromagnetic spectrum; its wavelength falls between 760 and 1 mm. This radiation is detected and measured by the thermal imaging device in two different ways—when the thermal detector absorbs infrared radiation completely (of any wavelength) and when the photon detector reacts only to radiation of a specific wavelength. The detector of a thermal imaging camera enables the energy of infrared radiation to be changed into an electrical signal. In the individual signal processing modules, the signal is amplified, converted into digital form and converted into the temperature value of the individual points of the image matrix. This is how a map of the distribution (thermogram) of the temperature of the object under investigation is created [
5,
6,
7,
8].
The thermal imaging camera works on the principle of converting infrared radiation that can be emitted or reflected by an object, into an electrical signal and later into an image displayed on a computer monitor. The camera is composed of an optical system, an infrared radiation detector, electronic amplification, processing and a visualization path [
9,
10].
Belt conveyors are mechanical, hydraulic or pneumatic means of transport, they operate in continuous or cyclic motion. Their purpose is to transport the excavated material over often considerable distances, with varying conveying speeds, capacities and conveyor belt lines. In underground coal mines, they are the primary form of transport [
11,
12]. The drive systems used in mining can exclude or hinder diagnostic measurements. The results which are obtained by means of various measurements can be processed by dedicated software FLIR Tools [
13]. Studies on the development of longwall conveyors are presented in works [
14,
15,
16,
17,
18,
19,
20,
21,
22]—they are part of the innovative development of machinery and equipment [
23,
24,
25,
26,
27].
The popularity of the thermal imaging method to assess the technical condition of belt conveyors in a mine has been increasing [
28]. The first experimental studies using thermal imaging cameras were described in works [
29,
30,
31,
32], whose findings and the method developed contributed to minimising failures primarily in the mines of Polish State Mining and Metallurgical Combine (KGHM). Multiple diagnostic methods are recommended for costly machines and process lines [
33,
34,
35,
36]. Control testing can prevent the occurrence of fires, which are one of the most dangerous hazards in underground mines. Excavations in closed areas are subject to natural hazards, mainly methane [
37,
38,
39,
40,
41,
42,
43,
44,
45,
46,
47] and fire [
48]. They can cause serious damage to machinery and equipment, and even pose a threat to human health and life [
49,
50,
51].
Based on the research carried out, the main causes of the thermal condition for the drive unit were defined as: belt slip in the drive, problems with optimal cooling of the drive, bearing friction, seizure of the brake system, seizure of the drive drums, and seizure of the pulleys. These causes are mainly generated in the contact zone: improper cooling of the drive unit, the drum coming into contact with the belt, or the pulley coming into contact with the belt.
The main objective of this study was to identify the thermal condition of conveyor belt component structures and to analyse the risk of critical temperature increases. The tests were focussed on the drive unit, specifically the engine, the braking system and the gearbox. In order to measure the actual temperature distribution occurring in the main haulage belt conveyors, it was necessary to analyse the operating time of the belt conveyors and determine the cause of any thermal anomaly. The analysis of the working time of the main haulage conveyors was related to one working day in this study. The results are presented in the form of measurement images. They were developed using dedicated software. The obtained characteristics for the thermal state are presented in the form of diagrams. This paper presents a real-life example of a thermal condition survey for a measuring unit using a thermal imaging camera.
2. Materials and Methods
The use of thermal imaging is a very important and useful research method because, as a method for object diagnosis, it allows fast, safe and also accurate measurements in even restrictive space [
52,
53,
54,
55,
56,
57,
58,
59,
60,
61,
62,
63,
64,
65,
66,
67,
68,
69,
70,
71]. In a deep mine environment, cameras can be used to work in smoky, dusty and dark environments. The use of the thermal imaging method in the mining industry offers a wide range of research opportunities in view of the heat production that takes place during the operation of all powered equipment. Factors such as ambient temperature, humidity, air velocity, air volume in the excavation and emissivity have a significant influence on the measurement results [
72]. Using long-wave infrared radiation in the measurements, thermal radiation is recorded. The camera captures objects, people and high-temperature sources in limited or no visibility conditions [
73,
74,
75,
76,
77,
78].
Thermal imaging cameras use energy that increases as the temperature of an object increases, and can be obtained from any object whose temperature is above zero. The measurements result in a total temperature distribution over the background of the object, which can be seen by the colour variation in the measurement image. The advantages of thermal imaging cameras are that they are non-invasive and can locate faults invisible to the naked eye. The test with a thermal imaging camera is based on measuring the temperature from the external surface, where the temperature distribution is non-uniform [
79]. In order to obtain the relevant quantities, an average is determined which forms the basis for fault finding as temperatures increase above the normal operating ones.
In industry, thermography is used to control technological processes and, more specifically, the thermal state in order to predict and prevent failures. The image taken by the thermal imaging camera reflects the temperature of the device under examination and other surfaces, allowing the technical condition to be assessed. Equipment such as power grids, main fan stations, boilers for district heating and conveyor belts, among others, are examined using thermal imaging. In order to be considered reliable, the measurement must be carried out over a longer period of time and operate to its specification, e.g., the conveyor belt must be loaded with excavated material [
80,
81,
82,
83,
84,
85,
86,
87,
88,
89,
90].
2.1. Objective and Scope of the Study
The objective of this study was to identify the thermal condition of an operational belt conveyor drive unit in an underground coal mine. The following tasks were completed:
- -
tests and measurements on the conveyor drive unit,
- -
an analysis of operating times of conveyors,
- -
determination of the causes of the thermal condition for the construction of conveyors,
- -
an analysis of the results and recommendations.
2.2. Analysed Main Haulage Conveyors
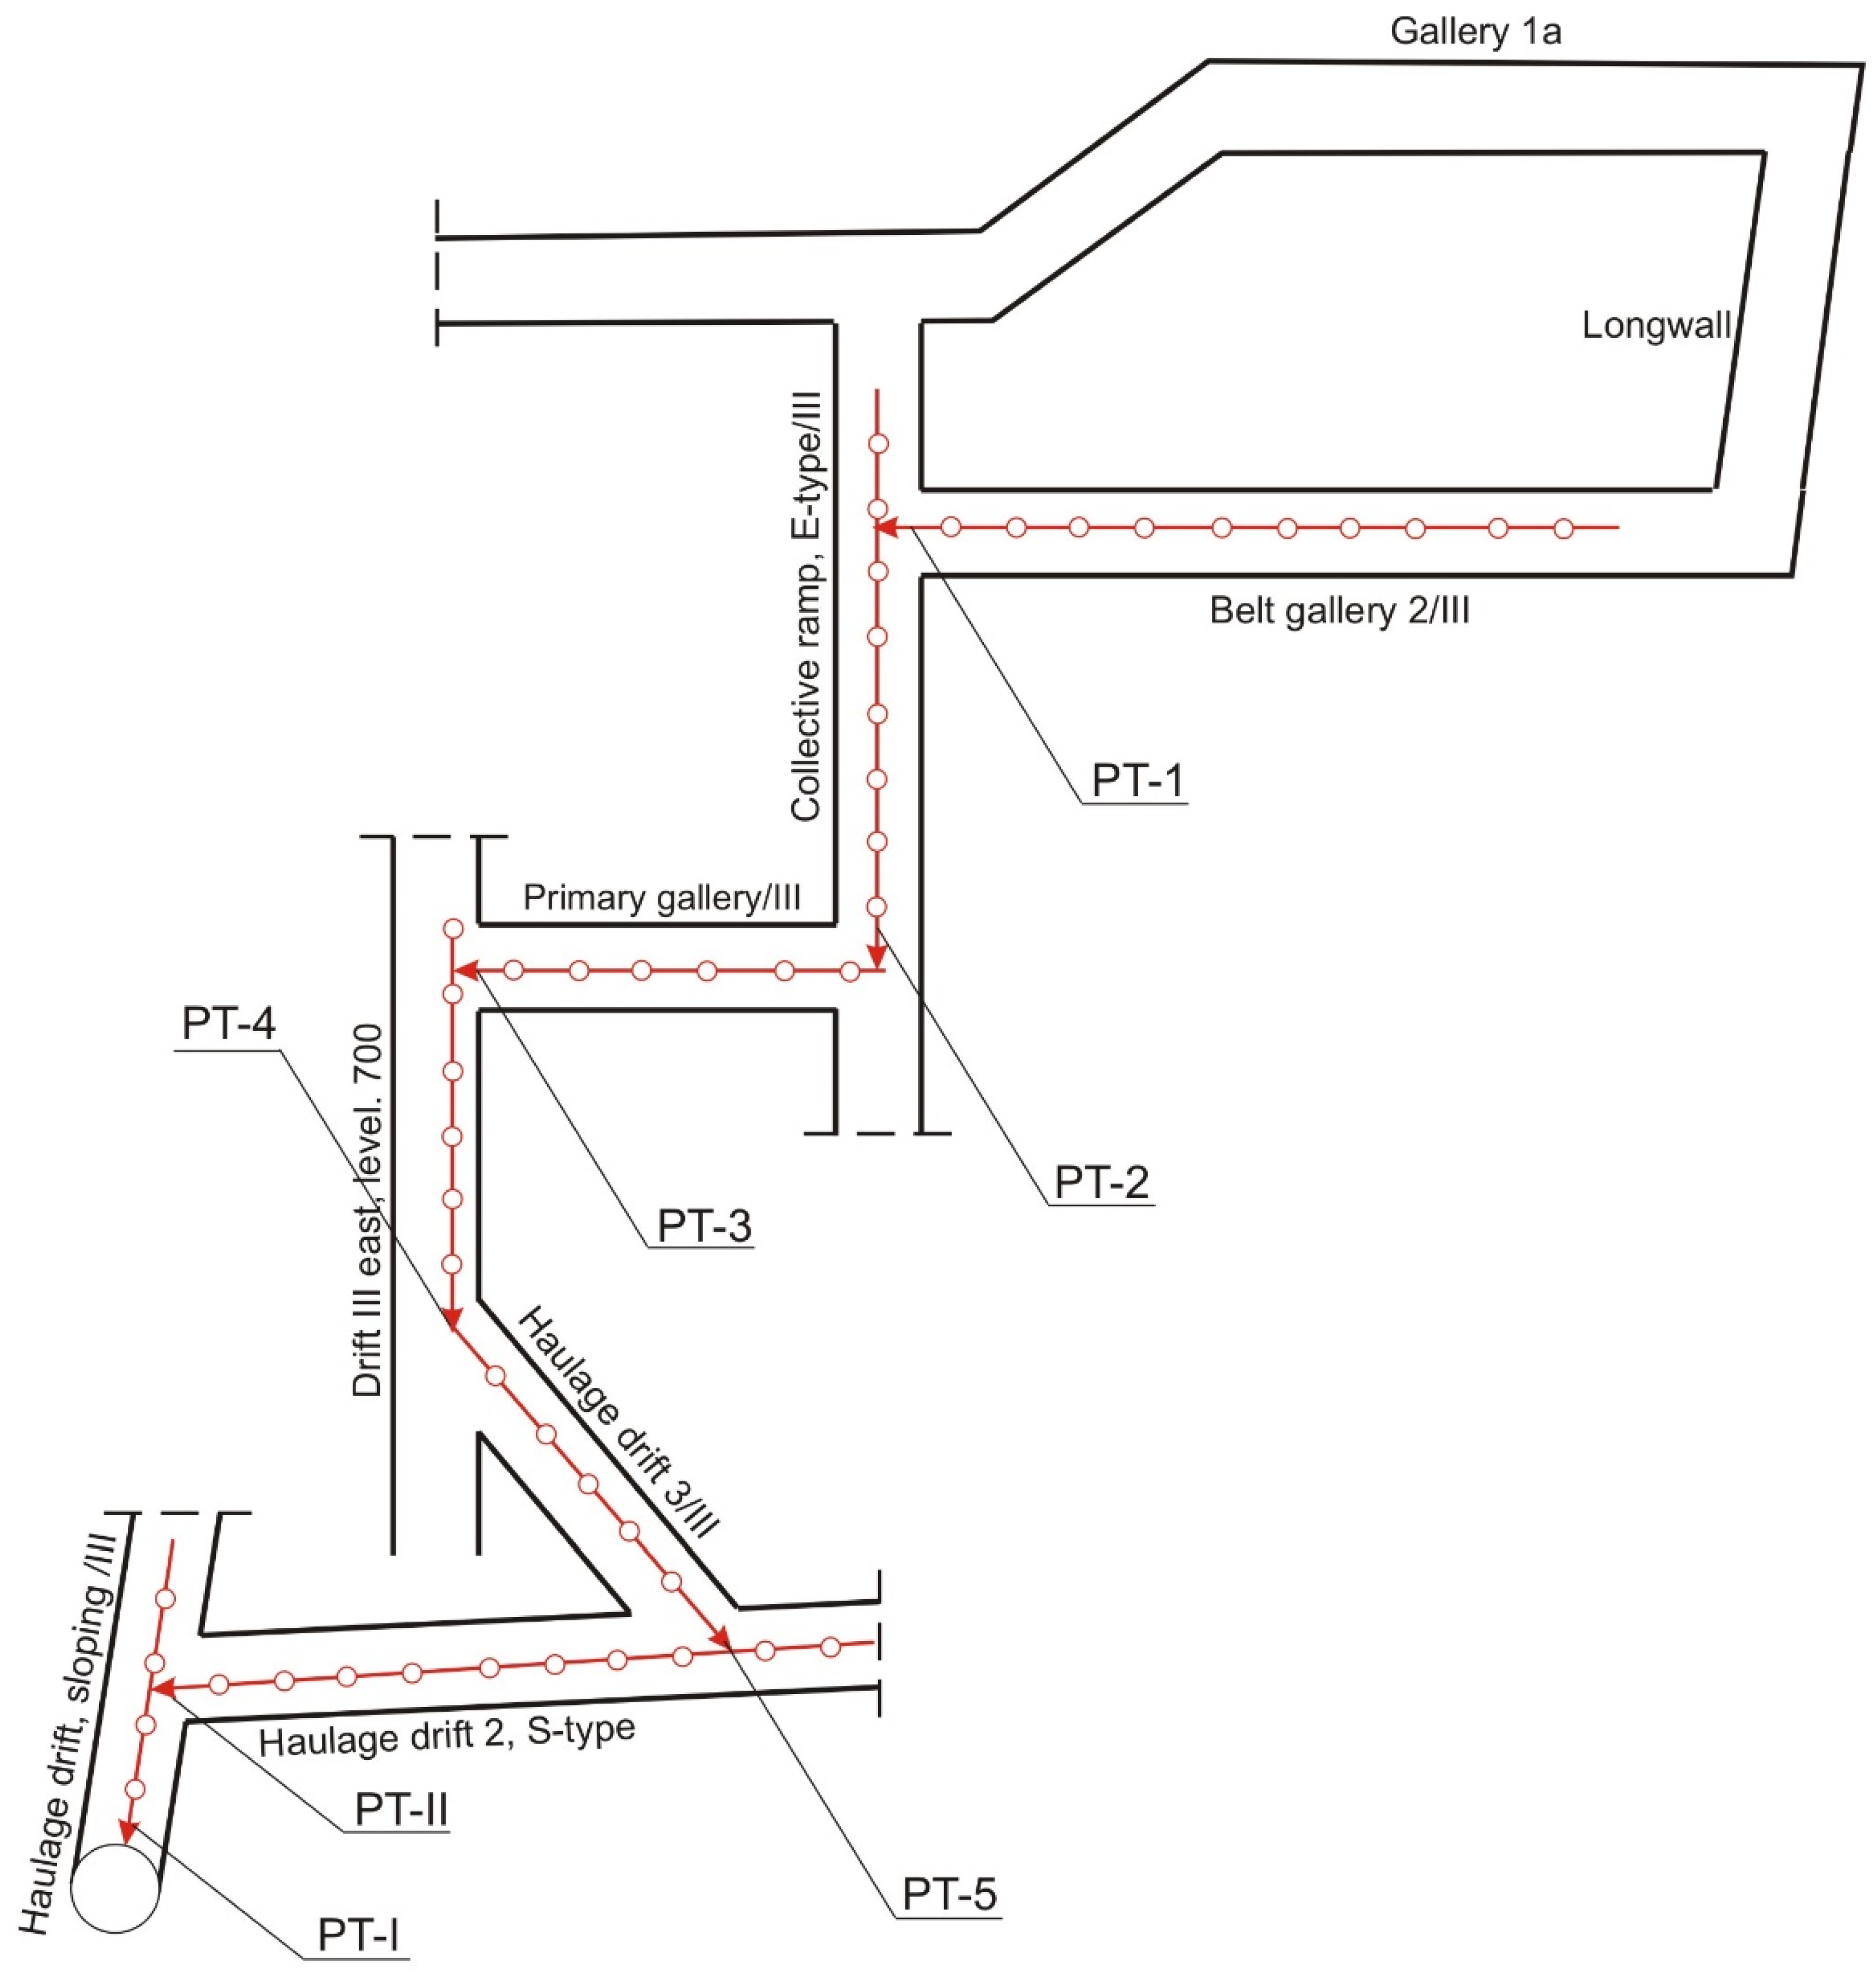
The main haulage belt conveyors used in the study transported the excavated coal from the longwall. The longwall mining was carried out conventionally with roof caving. The longwall was equipped with a powered roof support, a double-drum shearer and a scraper conveyor. The length of the longwall is 238 m and the panel length is 480 m. The thickness of the seam is between 2.5 and 3.1 m, with a slope between 23° and 25°. The main haulage system from the longwall transports the excavated material to a 1000 m
3 silo located in the mining shaft area. The analysed haulage system consists of six belt conveyors with a total length of 1846 m. The parameters of the analysed main haulage are presented in
Table 1 and their location in
Figure 1.
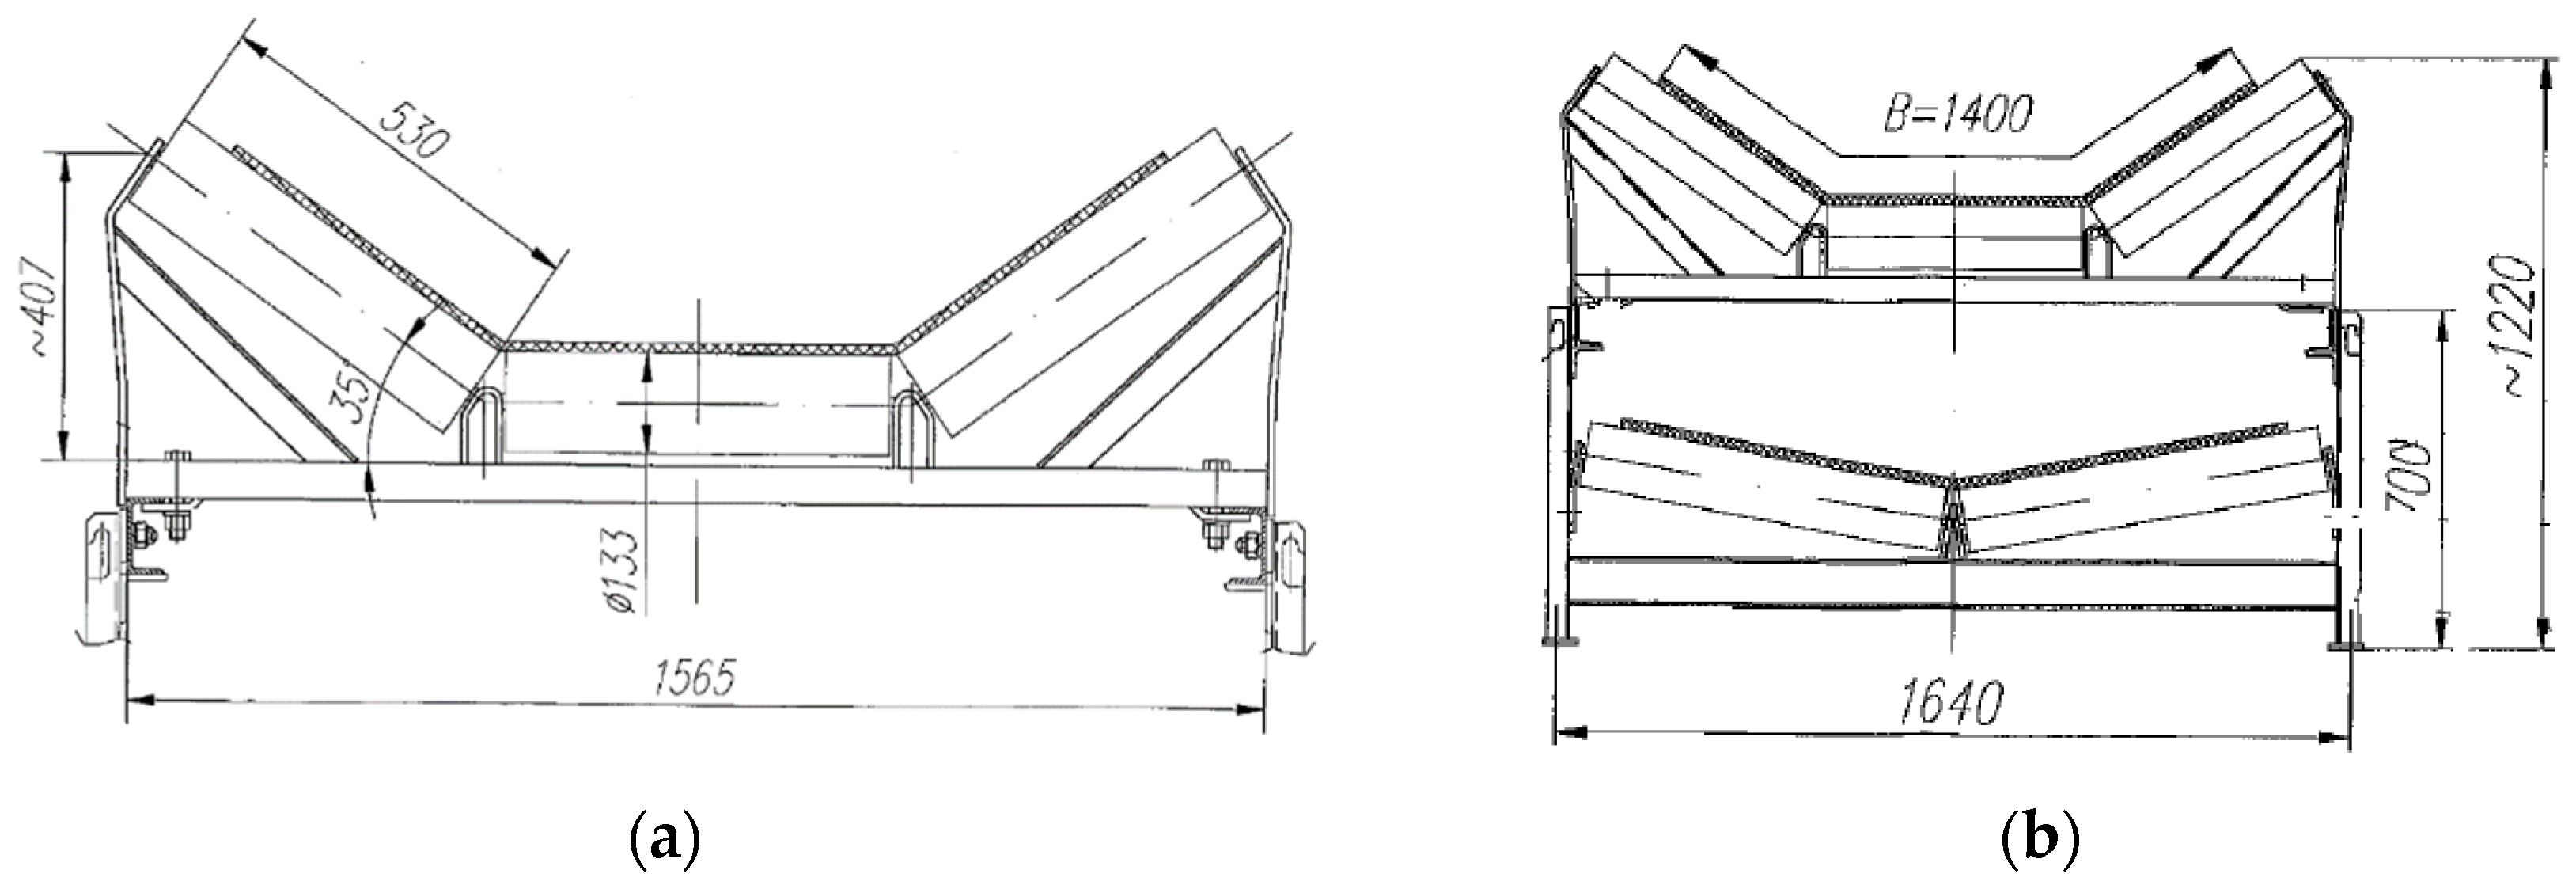
The conveyor routes are made of coils supported on lower trestles, which are spaced every 3 m and each has two Ø 133 mm pulleys (
Figure 2b), they serve to guide the lower belt in a V arrangement with a constant inclination angle of 10° and variable advance (−2°, 0°, 2°). The upper band is guided along the triangular supports to form a trough with an angle of 35° (
Figure 2a). Each of the side pulleys of the top support has an oblique 2° lead-out in the belt direction and a belt distance of 1.2 m.
2.3. Description of the Measuring Apparatus
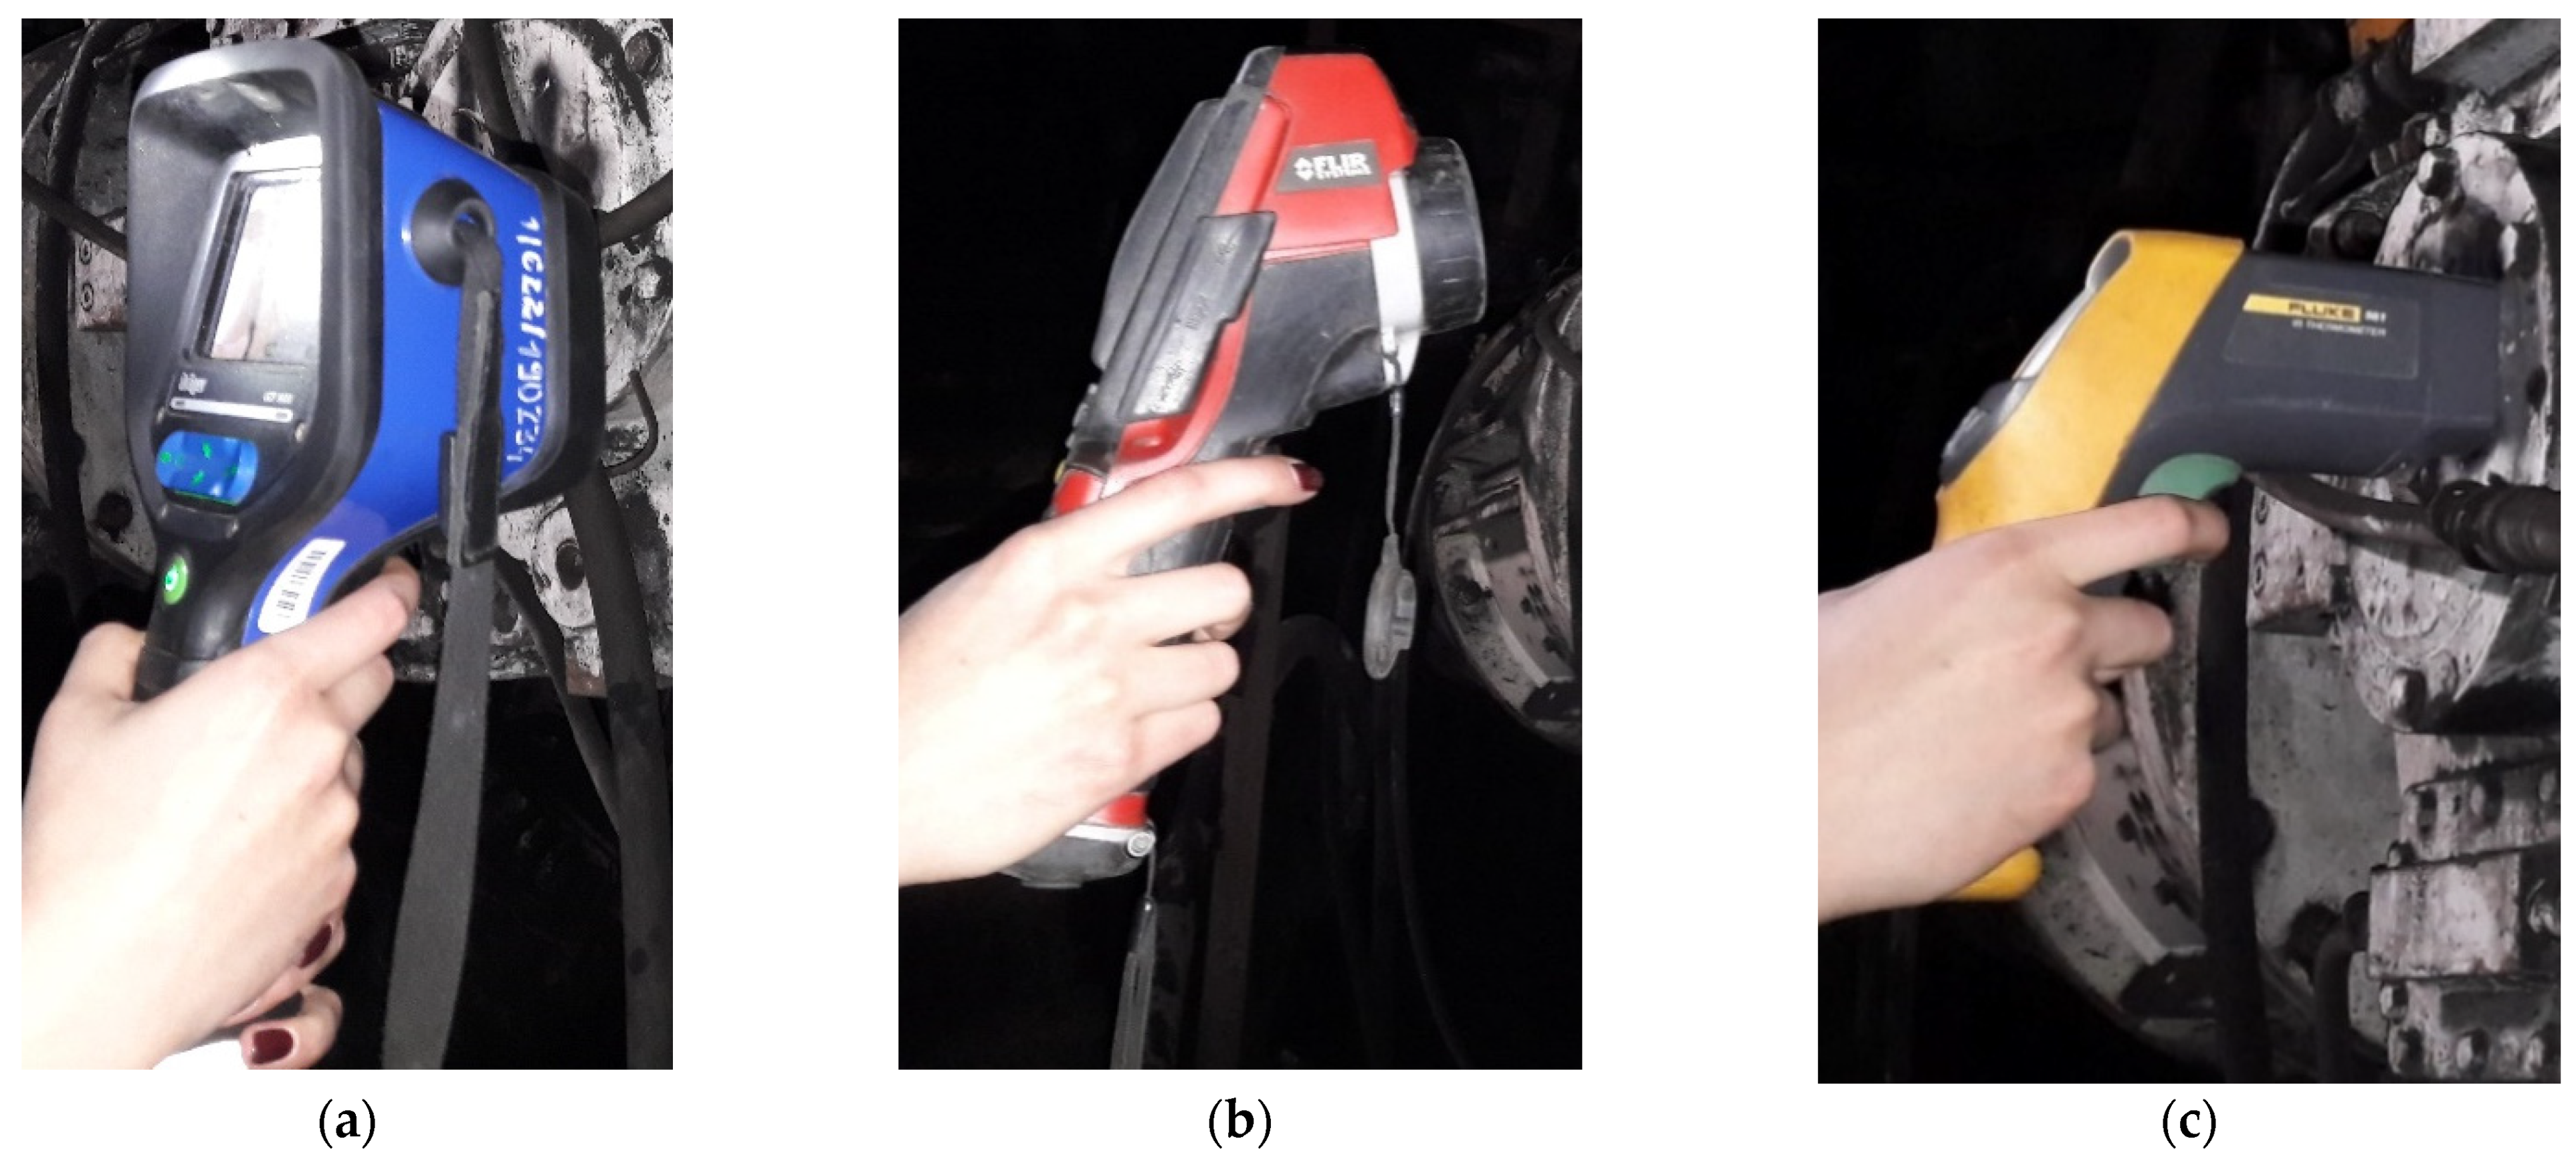
A thermal imaging camera (shown in
Figure 3a,b) works by processing infrared radiation that is emitted or reflected by objects. The resulting electrical signal is transformed into an image viewed on a monitor. The camera is built of an optical system, an infrared detector, a visualisation circuit and electronic amplification. The camera reads the measurement of any object with a temperature above zero without relative 0 °C, which is a source of infrared radiation, and its intensity depends on the temperature and surface features of a given object. The range of detection (sensing), recognition and observation identification depends mainly on three parameters: the viewing angle of the camera, thermal resolution and number of detectors in the array [
91]. The devices shown in
Figure 3 are equipped with a laser pointer that allows the temperature to be recorded at a specific point during the measurement from the object or location. A pyrometer (
Figure 3c) is used for non-contact temperature measurement. It works by analysing the thermal radiation emitted by the objects as a whole.
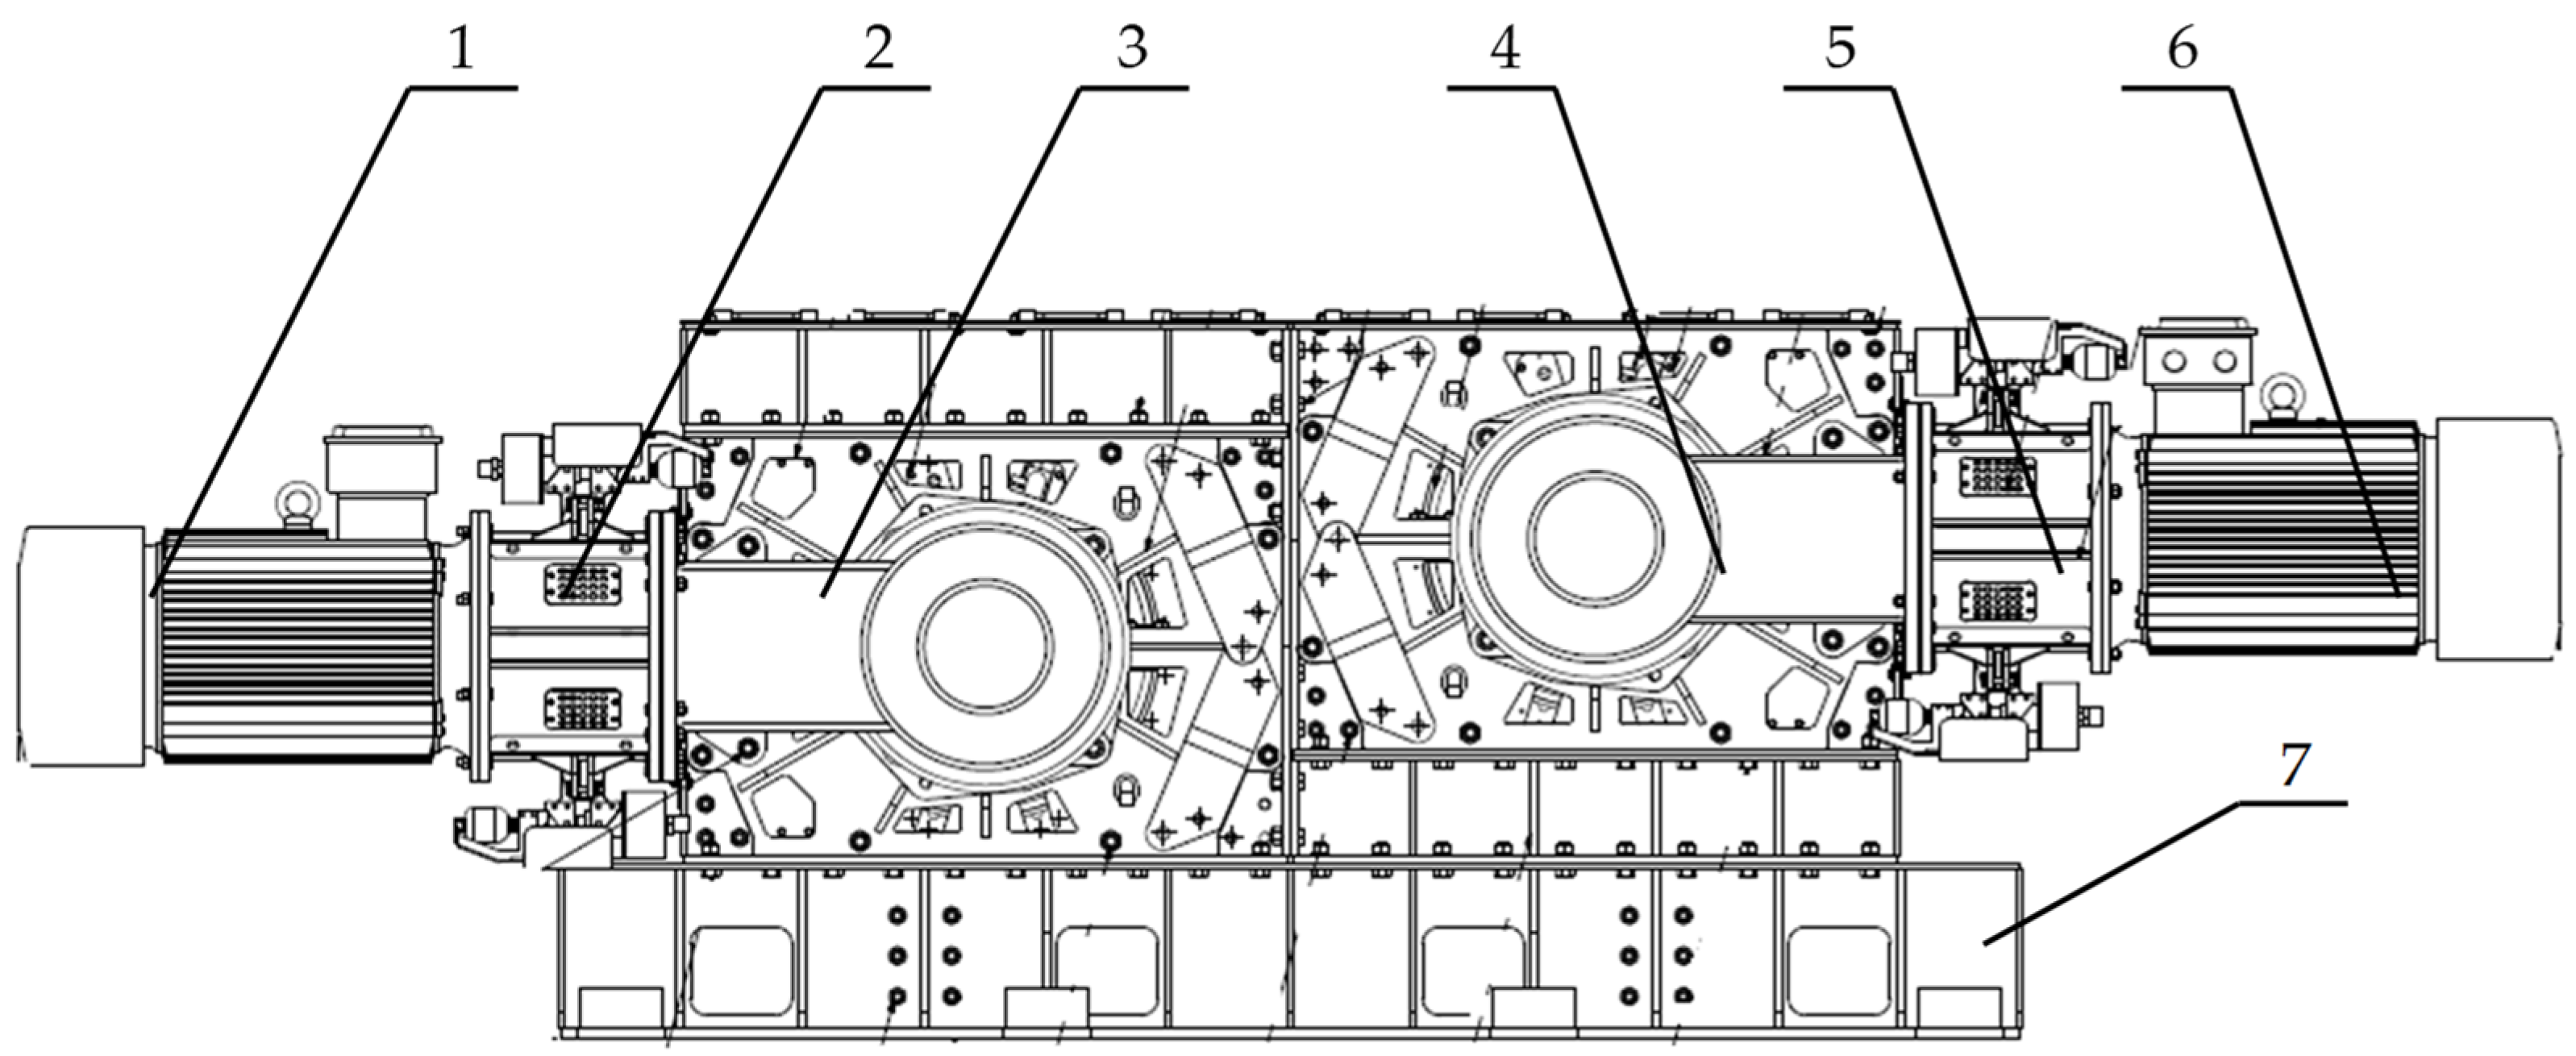
2.4. Design of the Conveyor Drive Unit
The drive unit consists of a gearbox, clutch and motor connected via the coupling case. The conveyor drive drums are driven by drive units. The transmission of the take-off torque from the gearbox to the drums is affected by means of couplings. The drive unit is built on a drive drum module. The gearbox is attached to the drive body via an intermediate plate. Drive units consisting of motors and gearboxes require water cooling.
Figure 4 shows an example of the construction of the drive unit.
3. Results
It can be quite difficult to carry out measurements using a thermal imaging camera for this purpose in an underground mine. One of the main factors that influence the result is the prevailing dust in the excavation. The correct temperature range for the drive unit is influenced by the length of the route, the variable load, and the size of the drive drums. The main problem during the research was to obtain a suitable measuring distance. Conveyor drive components such as the motor, gearbox and braking system are built into a recess due to the dimensions of the workings. For major conveyor installations, a fixed thermal imaging device could be used and data sent to a central control room for continuous monitoring. Exceeding a threshold temperature, predetermined from field data, could trigger an alarm, for example. Maintenance personnel could then be sent to the unit to investigate the temperature anomaly and conduct preventative maintenance if needed.
The following parameters were introduced to minimise measurement interference: emissivity, humidity, ambient temperature, and the distance of the camera from the object. Each of these measurements was additionally determined using a pyrometer type device. It was not possible to place the measuring equipment on a tripod due to the dimensional constraints of the excavation. The measured air temperature at the drive locations varied between 22 and 30 °C. The measurements taken were sequential, with a frequency of 5 min. The entire measurement session for a single test object lasted approximately 60 min, resulting in 12 measurements.
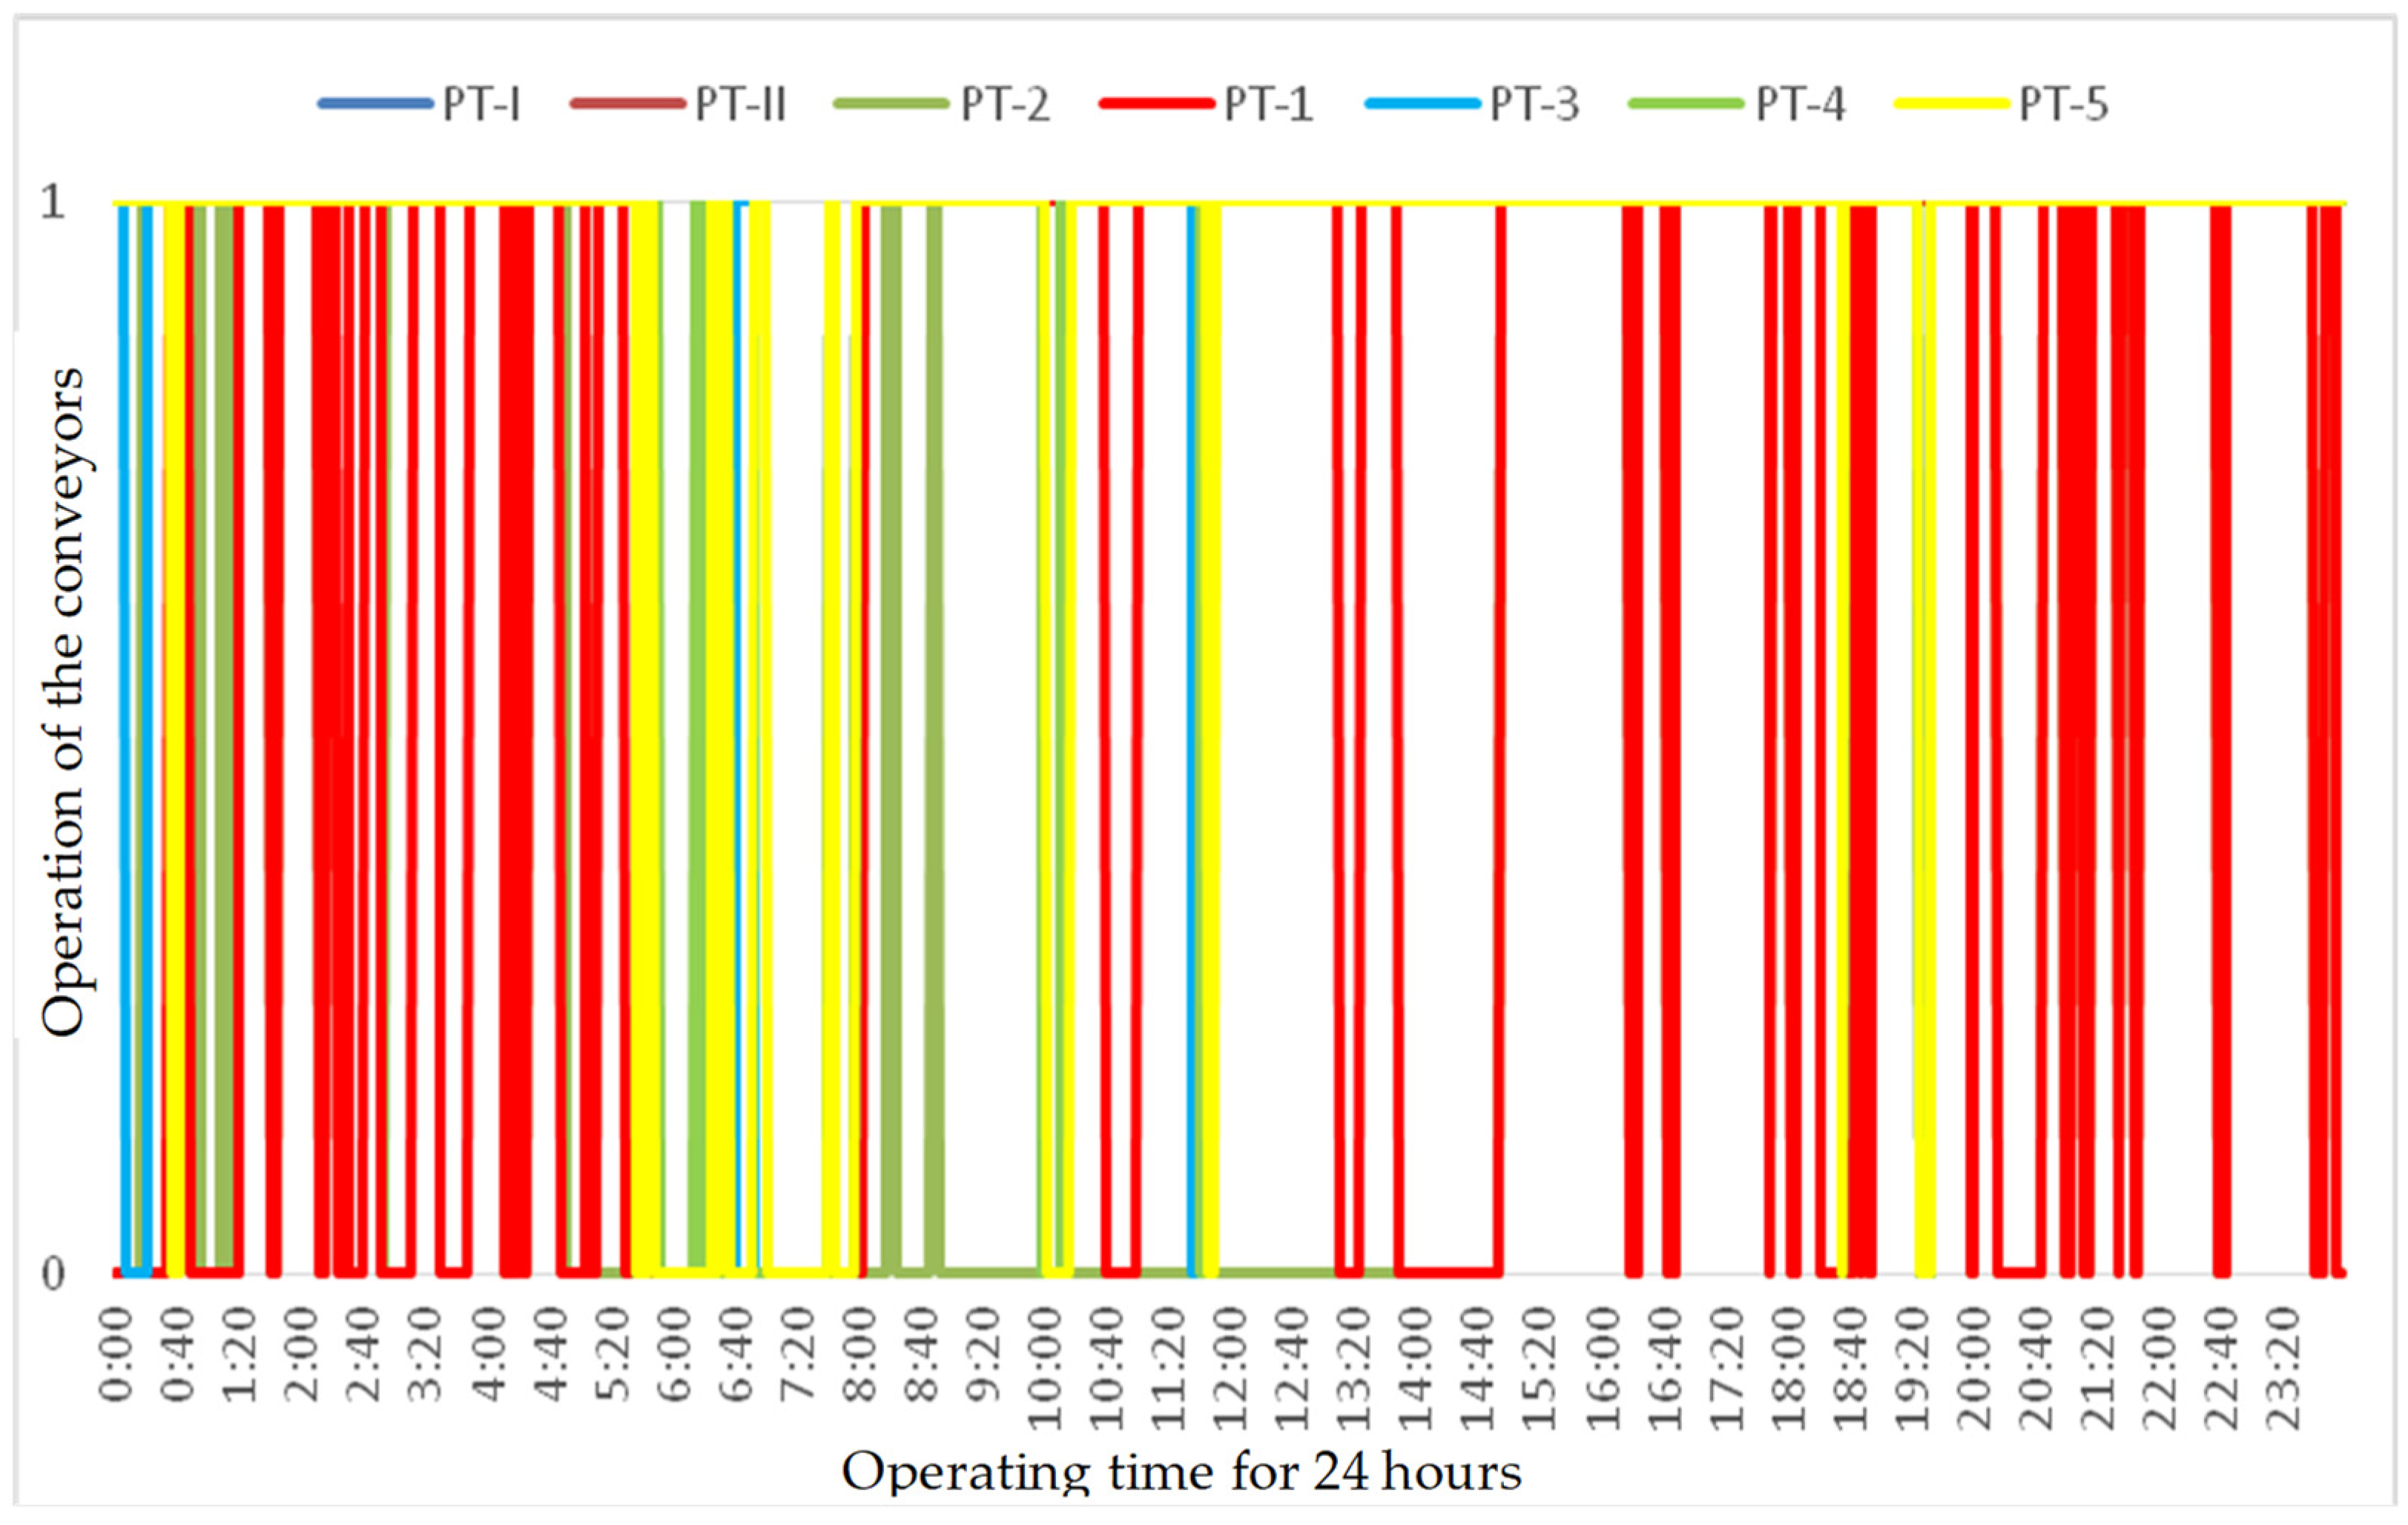
3.1. Analysis of the Working Time of the Main Conveyors
The operating time of the main haulage conveyors depends on many factors, including the mine’s operating system and planned daily tonnage. The main haulage unit under analysis operates on a five-shift system. This is characterised by four mining shifts and a fifth maintenance shift. A maintenance-related stoppage of the conveyors to perform necessary checks or repairs is made between 5:30 and 8:00 a.m. The working time of the main haulage conveyors was analysed by data collected from the ZEFIR system. This system performs the function of continuous supervision of mine operations, for the operational management, alerting, documentation and analysis of the production process.
Figure 5 shows a visualisation of the working time of the analysed main haulage conveyors, and
Table 2 presents a summary of the effective use of the working time of the analysed belt conveyors.
The diagram (
Figure 5) illustrates the operation of the main haulage belt conveyors on a daily basis. It allows us to view the stoppages that have occurred during its daily operation. The belt conveyors whose running time measurement is shown in the above diagram are explained in
Table 2.
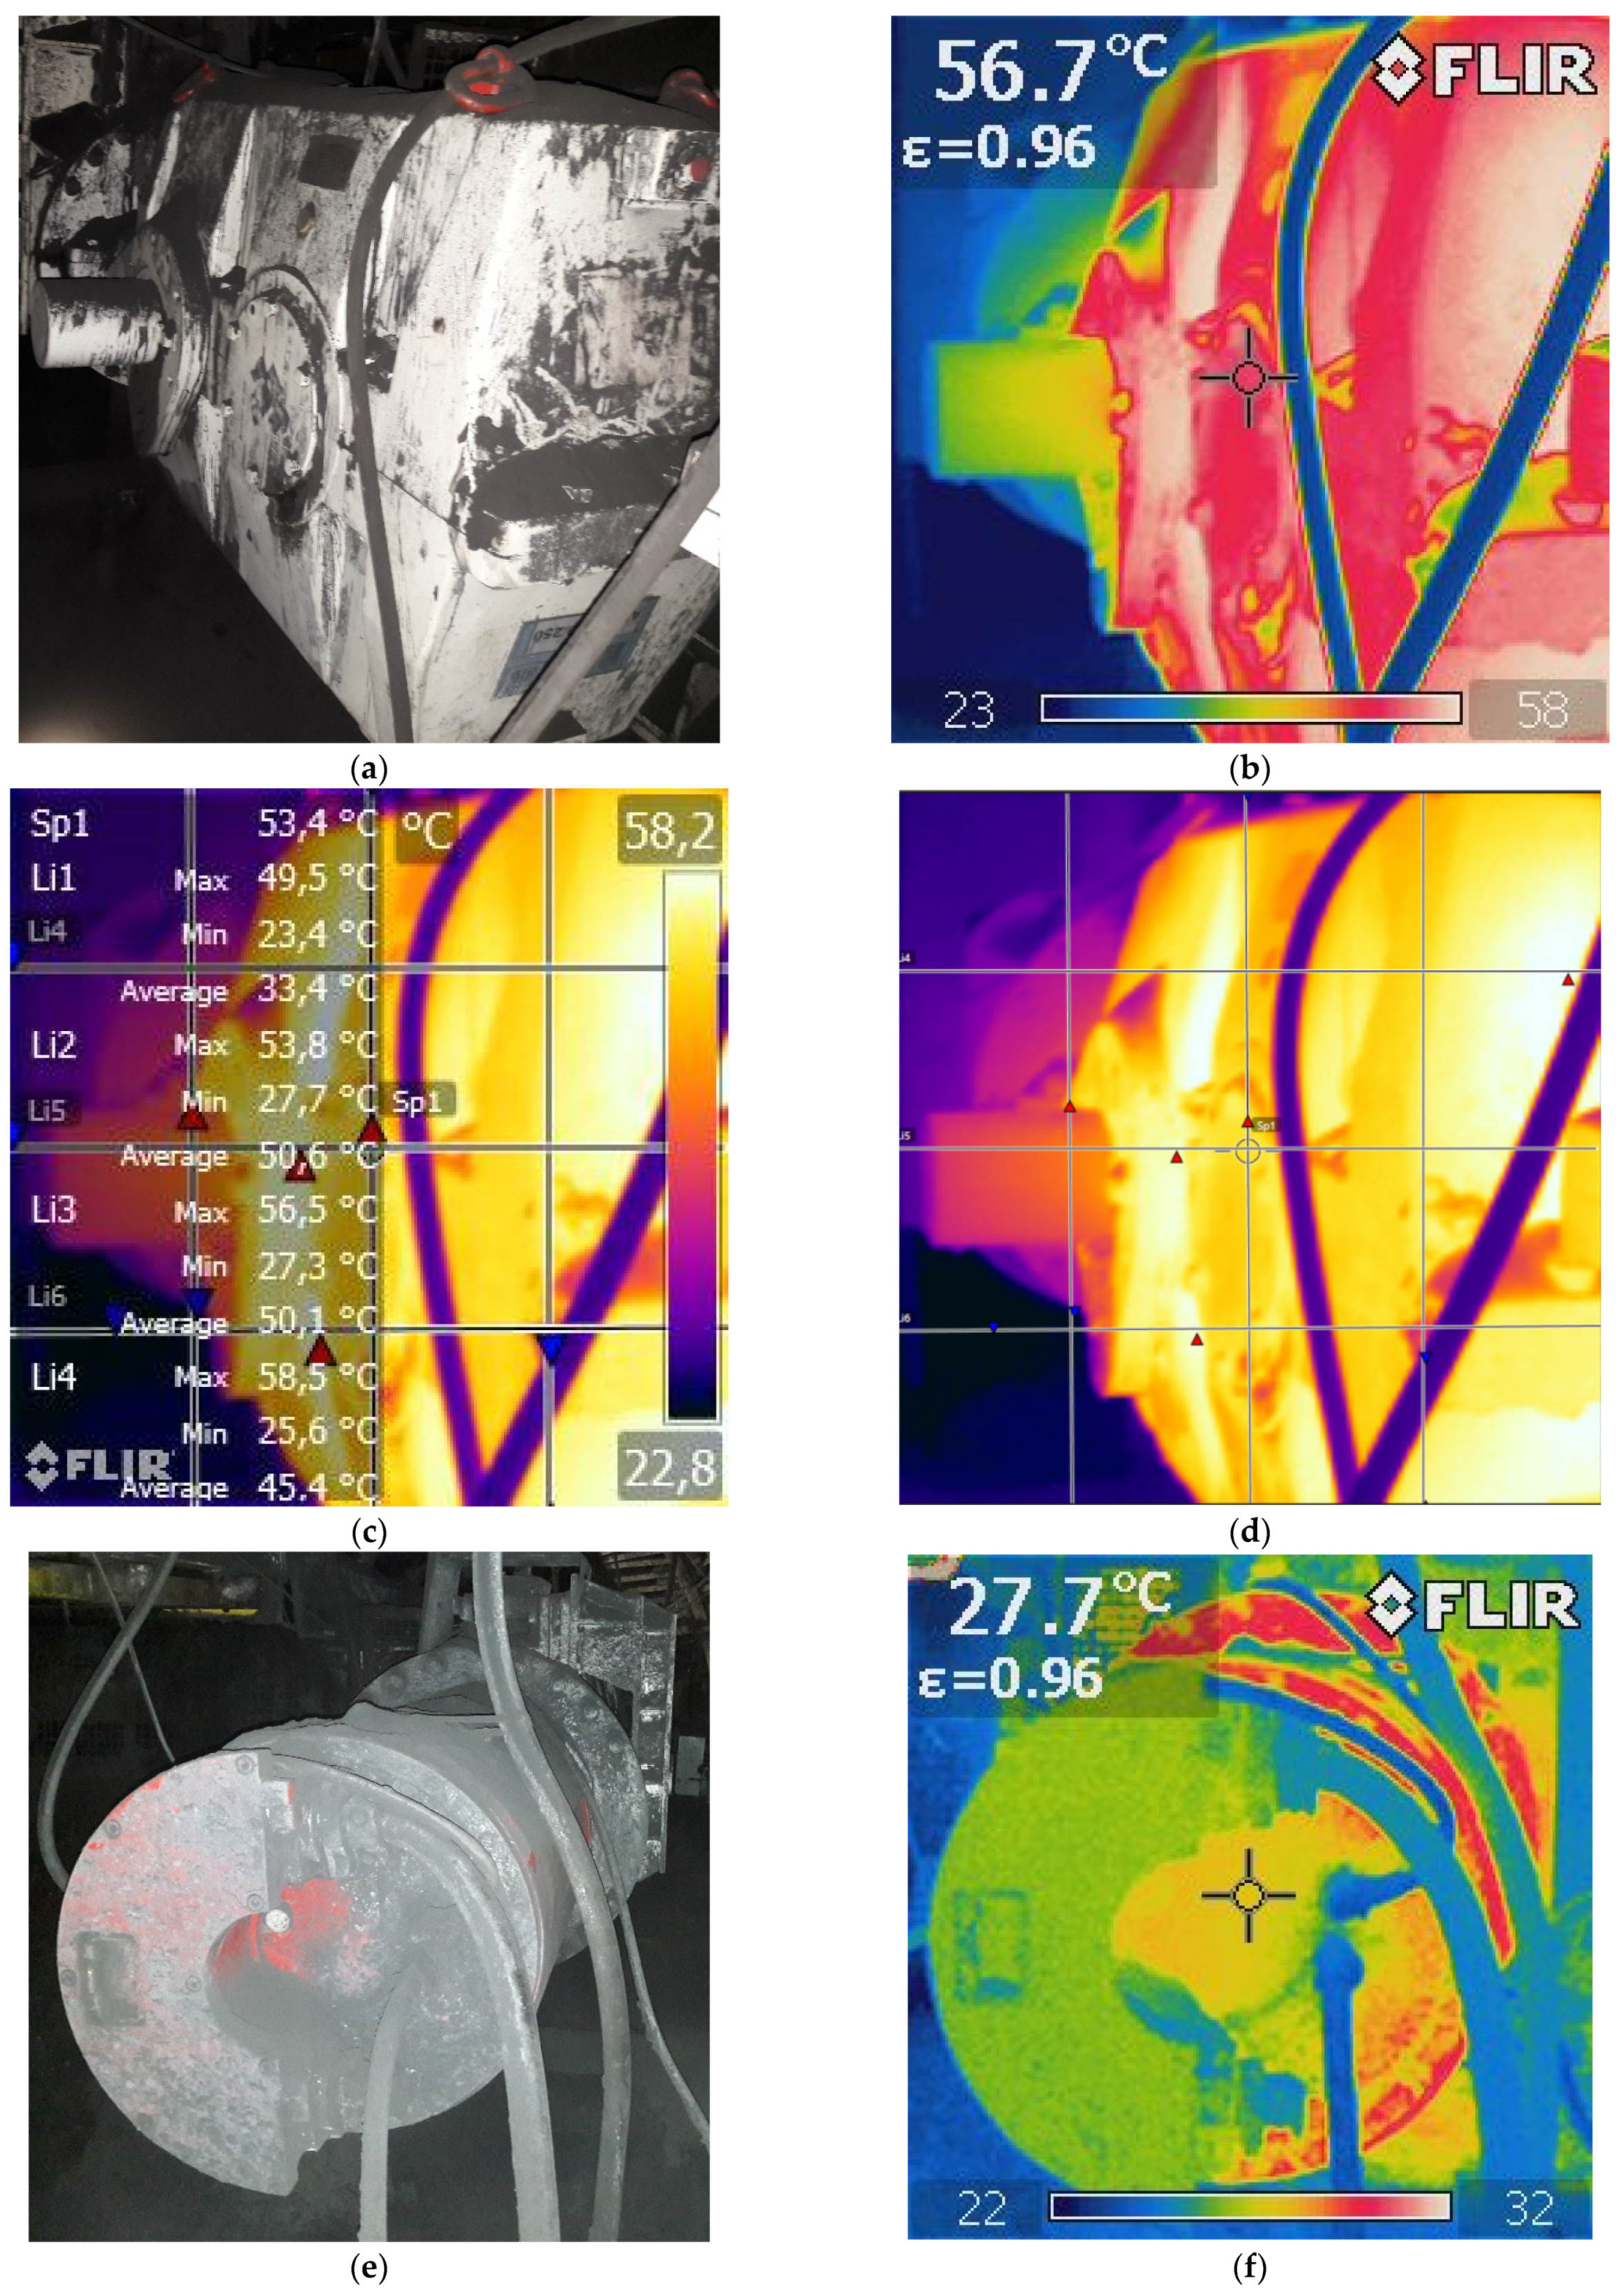
3.2. Inspection of a Conveyor Drive Unit Using a Thermal Imaging Camera
Testing of the individual drive units of the main haulage conveyors was carried out two hours after start-up of the morning shift. All conveyors tested were loaded with excavated coal material. It was assumed that the temperature value should stabilize after this time from the start up. Obtaining a series of measurement images from a single conveyor drive during sixty minutes of operation allowed us to calculate the minimum and maximum temperatures for the drive unit. The unit consists of the motor, gearbox and brake system. The construction of the drive, including the drums, was omitted from measurements. The tested constructions of the drive system consisted of two drive units, one in the left-hand version (II drive) and one in the right-hand version (I drive).
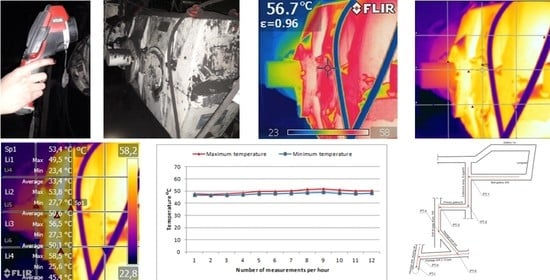
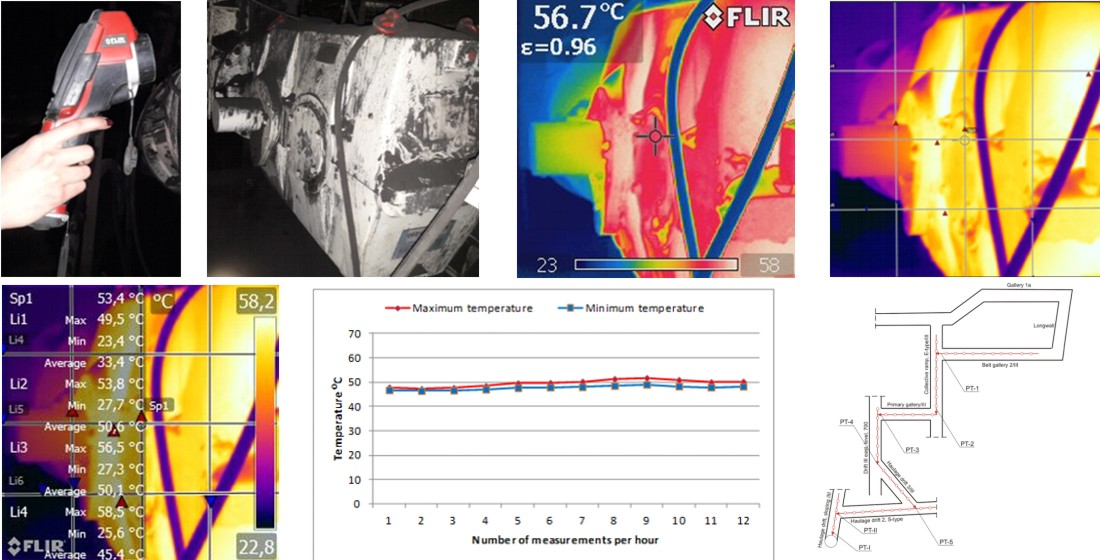
Two thermal imaging cameras—FLIR 60 and Dräger UCF 9000—were used in the study. The measurement series taken on the equipment made it possible to locate the hottest areas within the drive structure. The following thermograms (
Figure 6 and
Figure 7) show the recorded temperatures for selected drive units from the conveyors analysed.
The test results obtained (
Figure 6) were analysed using a process based on special software FLIR Tools in order to determine the temperature distribution within the test object. The software FLIR Tools uses the function of creating a line to catch points for which a black triangle is used to mark maximum temperatures (
Figure 6c,g and
Figure 7c,g,k,l). The blue triangles indicate the minimum temperatures. A series of temperature points for the gearbox and motor were thus obtained. This function greatly simplifies and shortens measurement times, as a single image provides information on the complete temperature distribution. On this basis, the average highest and lowest temperatures of the gearboxes, motors and braking systems of the belt conveyors studied were determined, which were used in the analysis of the thermal condition of the main haulage conveyor drive units.
3.3. Test Results
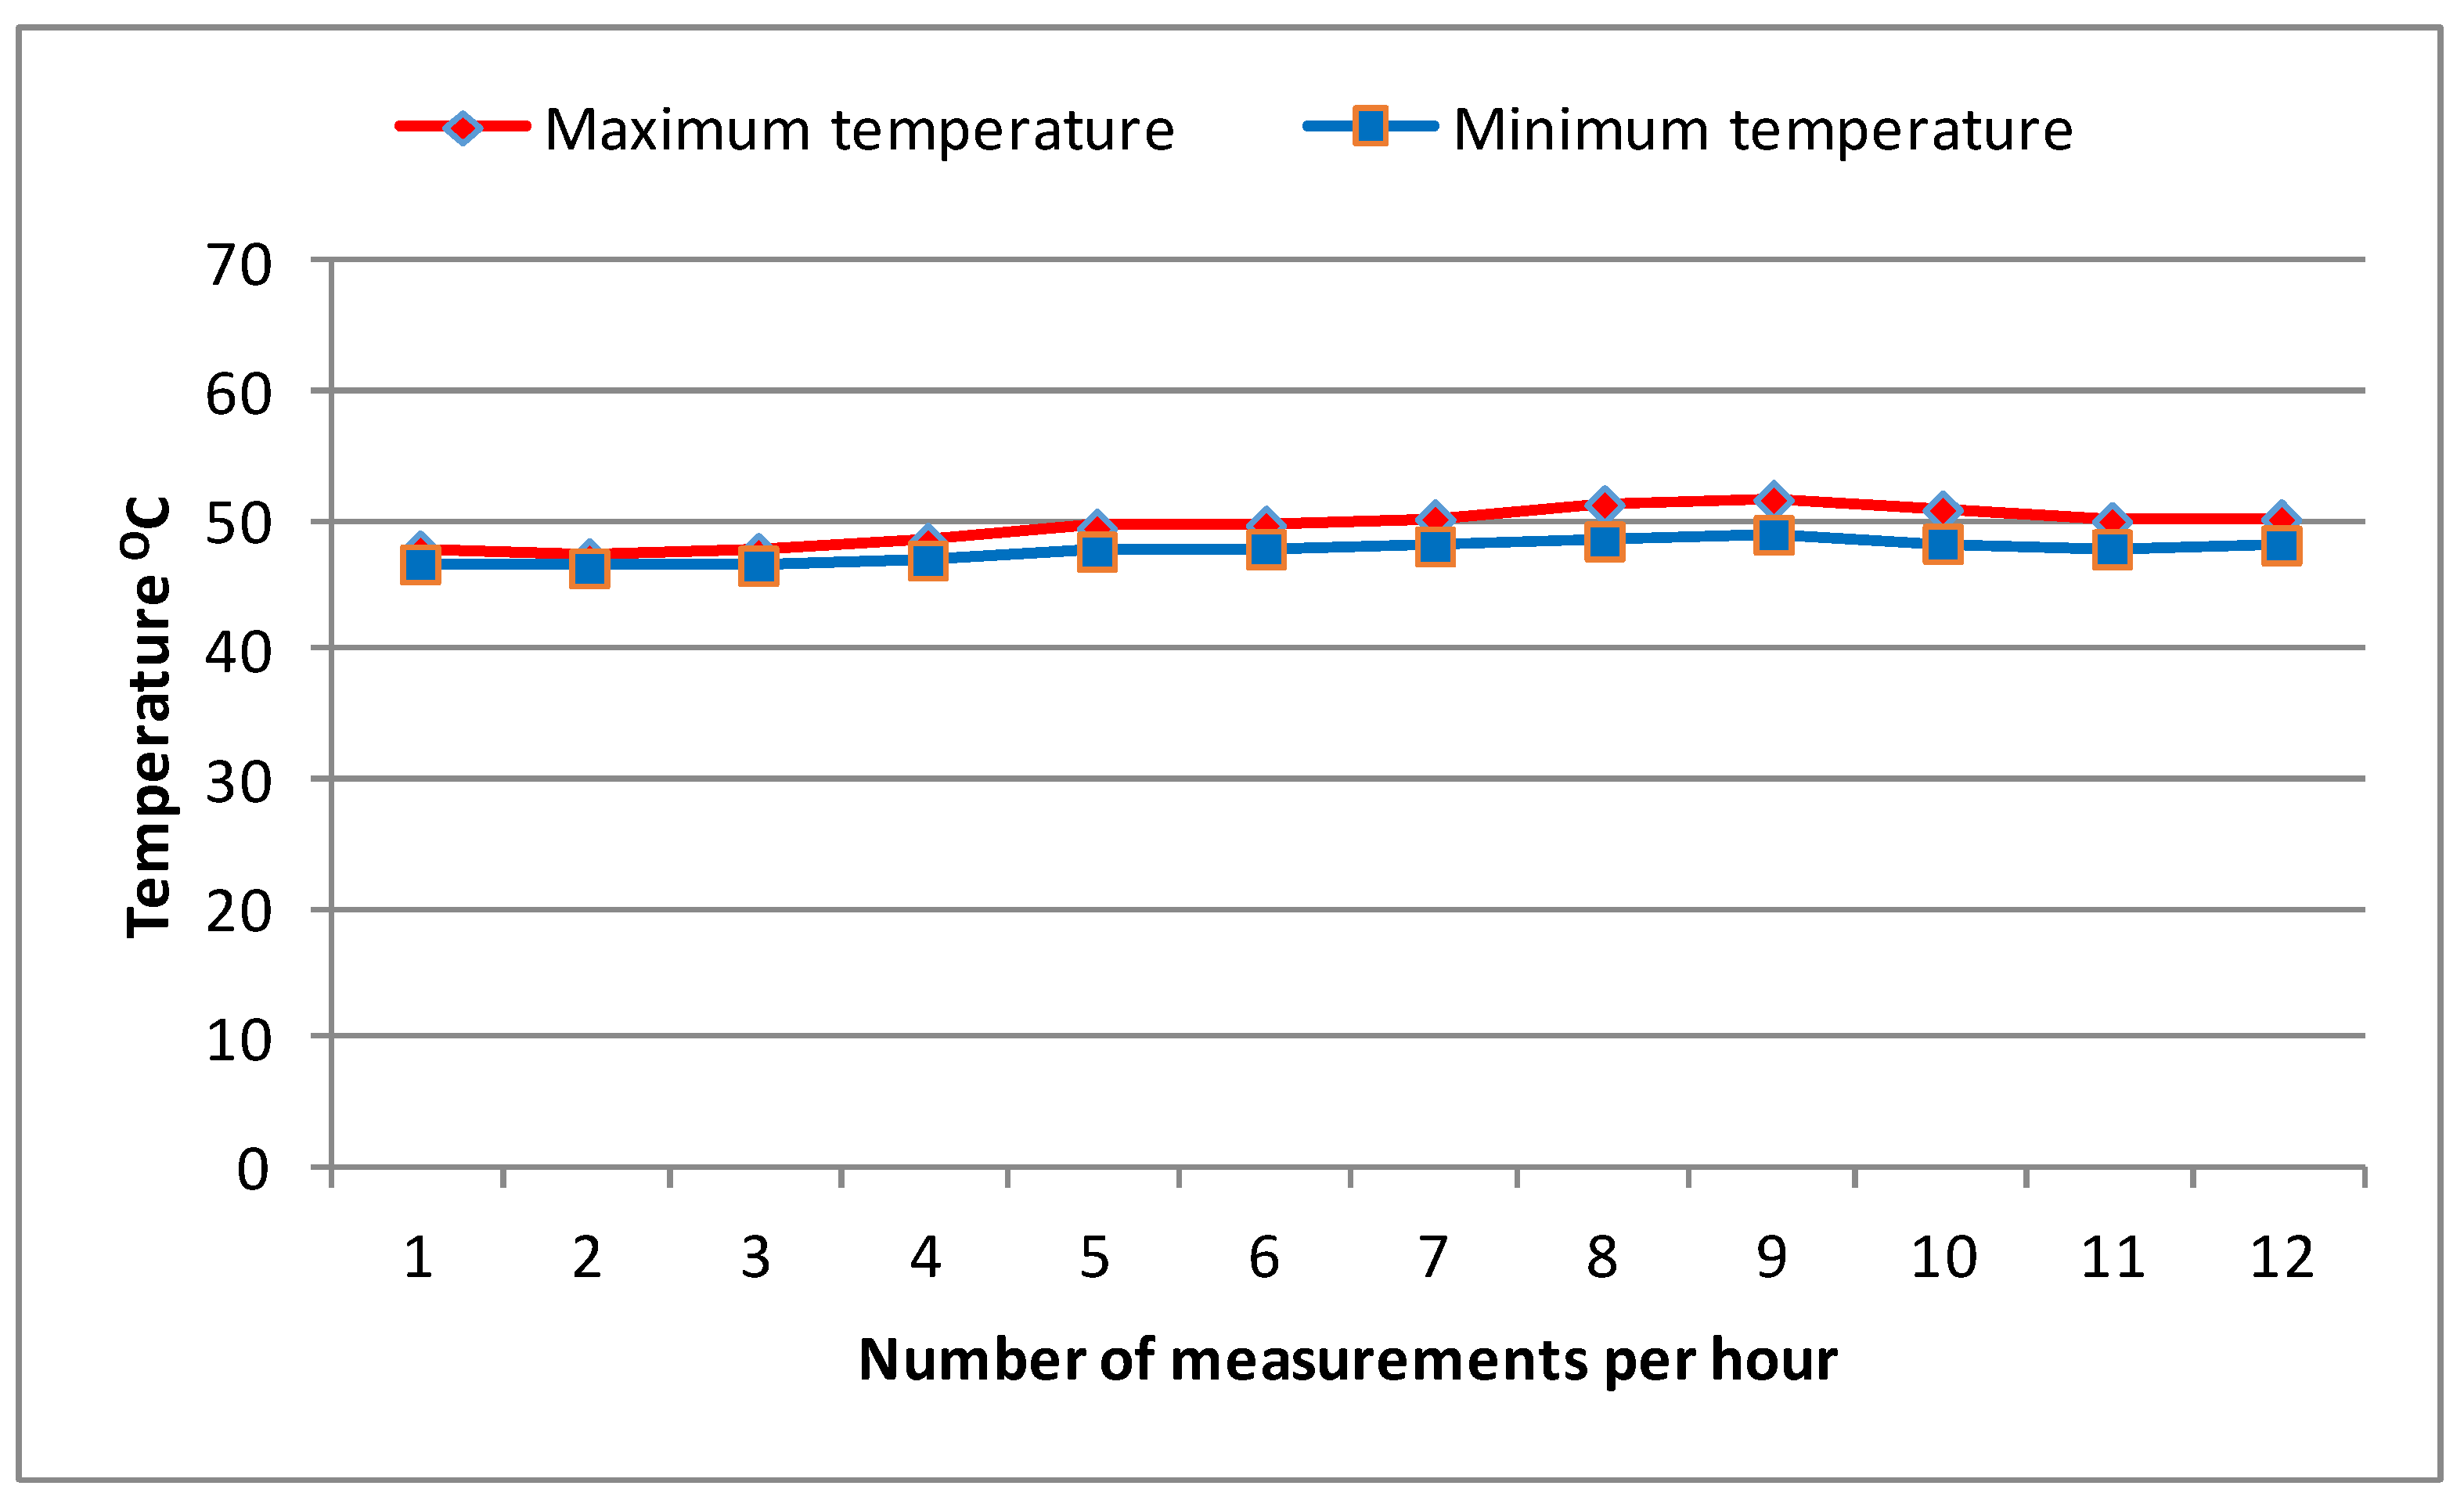
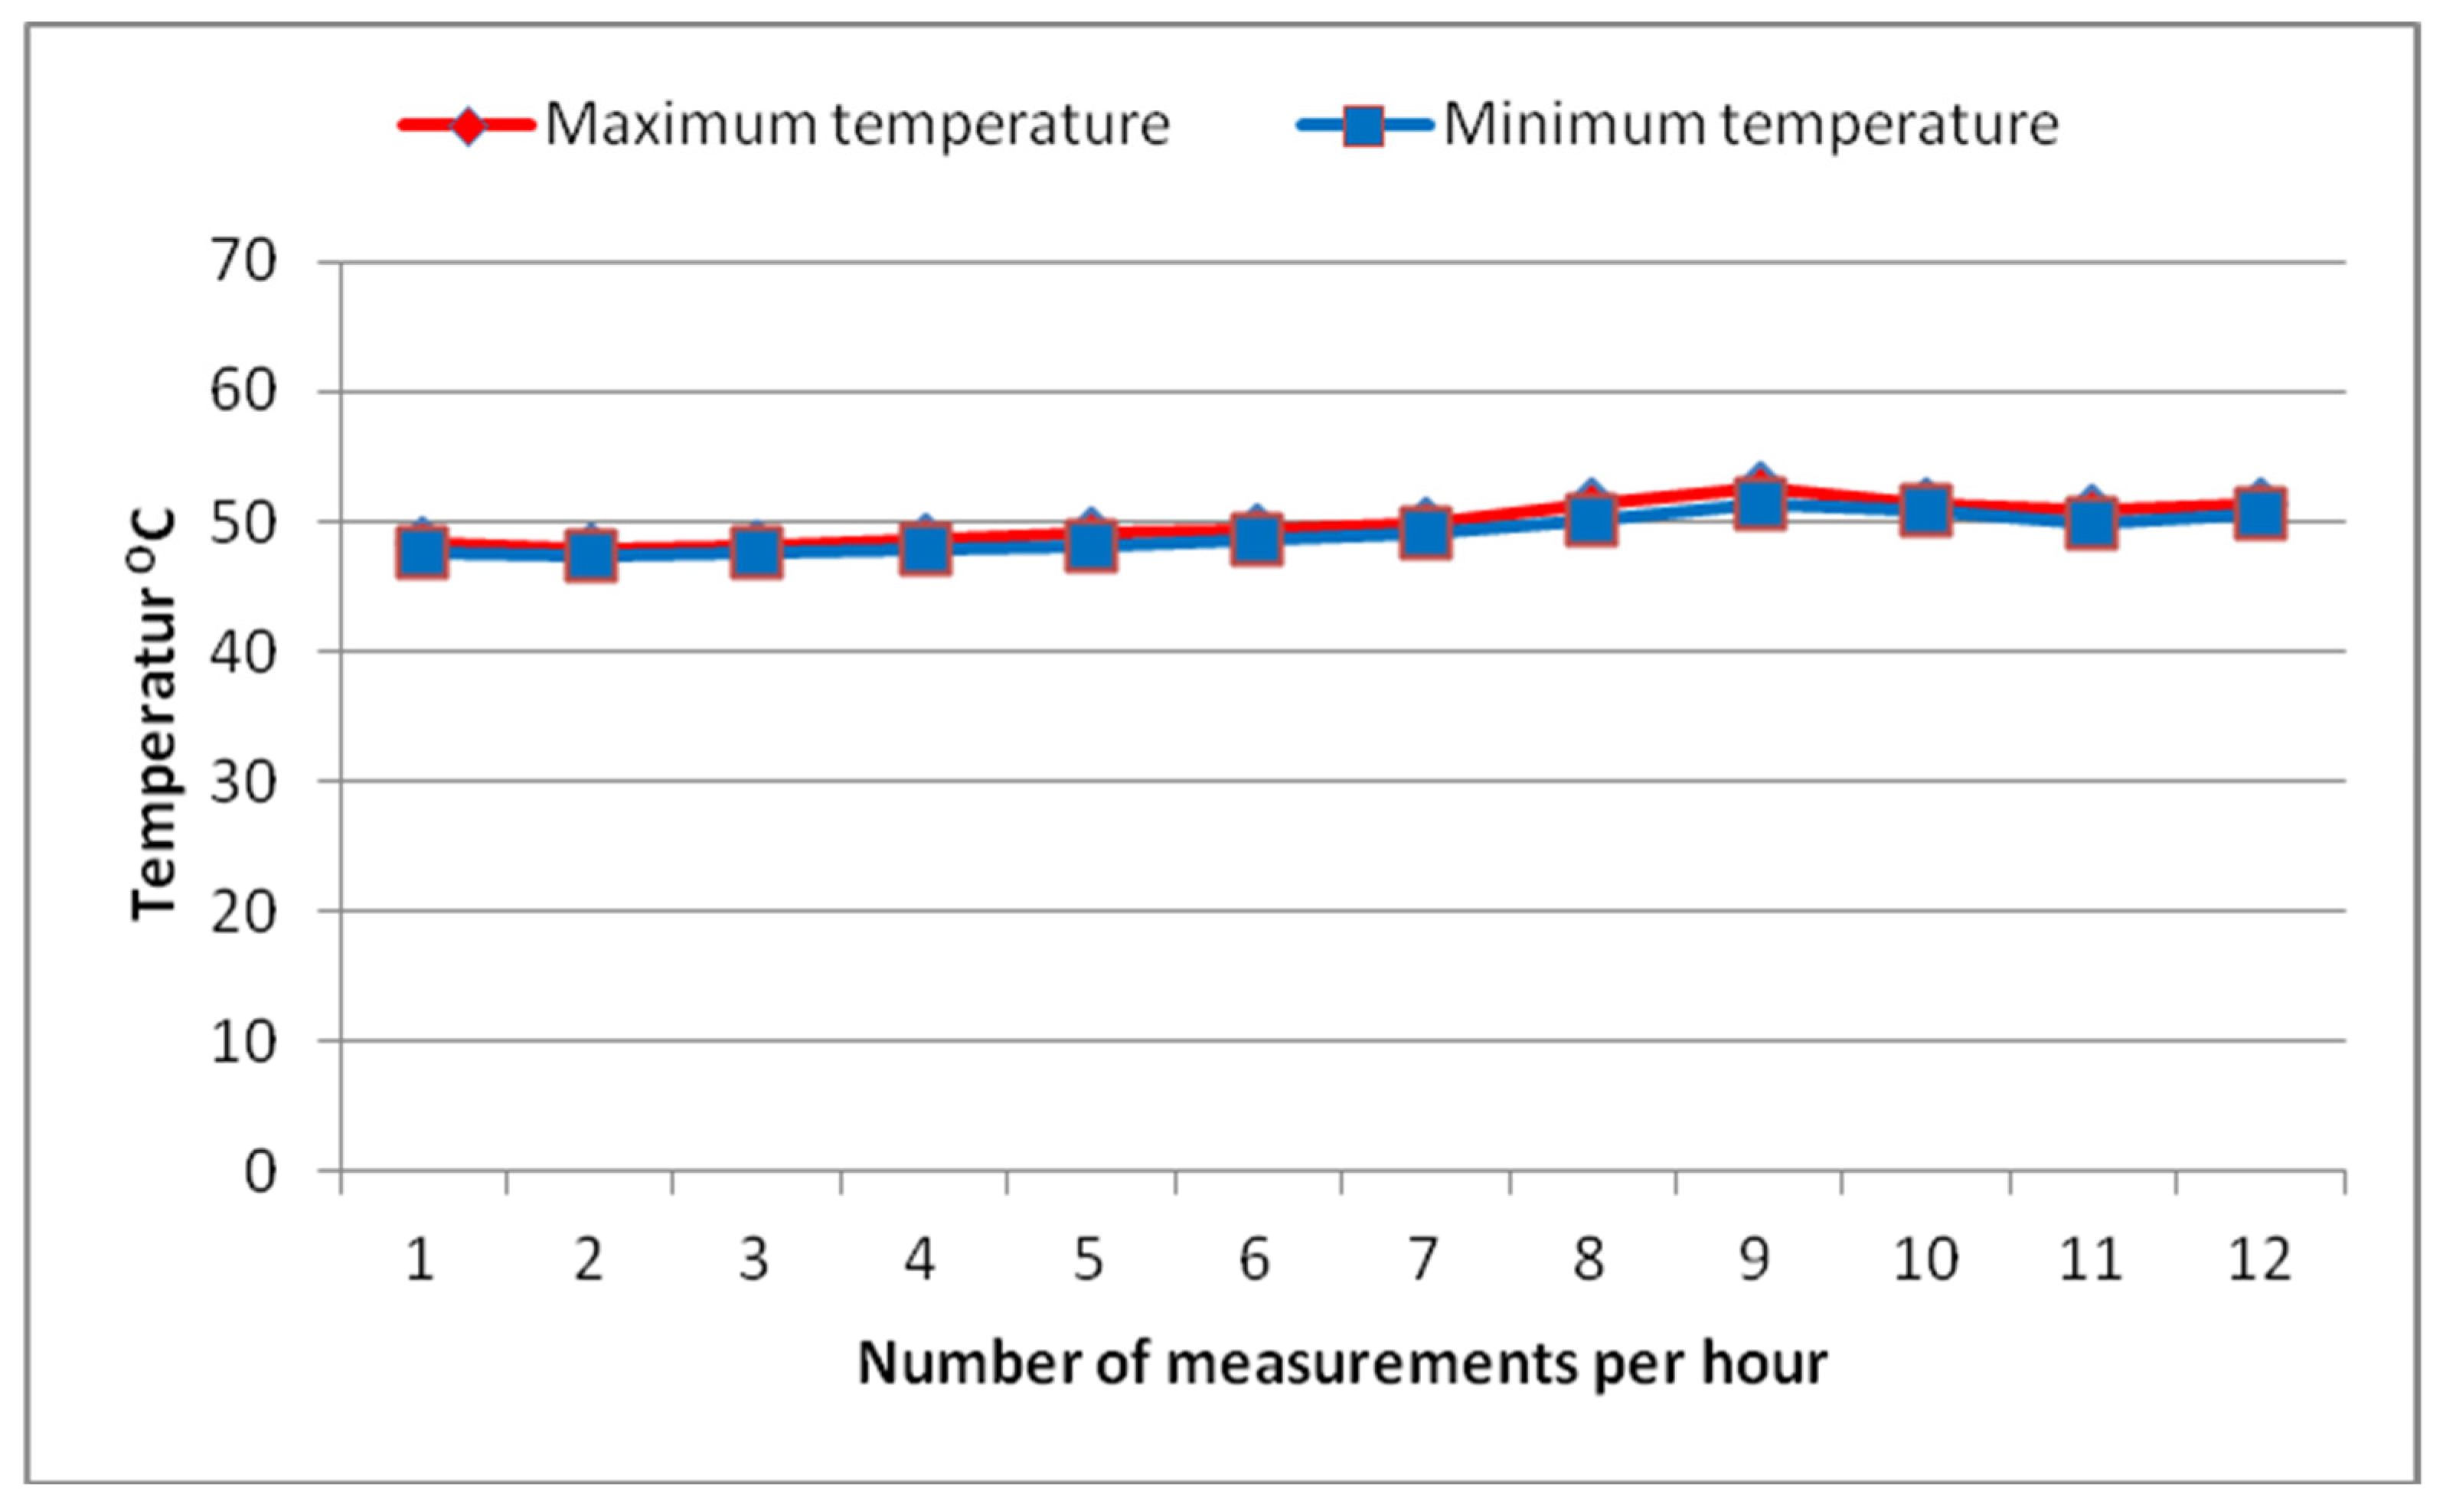
In the 60 min test interval, the graphs show minor decreases and increases in the minimum and maximum temperatures. There were no interruptions to the operation of the conveyor due to a temporary stoppage. The measured water temperature for engine and transmission cooling was around 21 °C. The water after passing through the cooling system at the discharge into the dewatering pipeline was, on average, 33 °C.
The obtained test results for the conveyor drive unit are presented in
Table 3 below, showing the thermal state characteristics for: the entire gearbox, motor, and braking system. In the following graphs (
Figure 8 and
Figure 9), the red colour indicates the values for the maximum temperature, while the blue colour indicates the values for the minimum temperature.
4. Discussion
The obtained characteristic curves of heat distribution in the form of thermograms (
Figure 6) and graphs (
Figure 7 and
Figure 8) constitute an evaluation of the thermal condition of the individual elements of the tested driving unit of the main haulage belt conveyor. The measurements made refer to stable (constant) operation. For all tested main haulage conveyors (
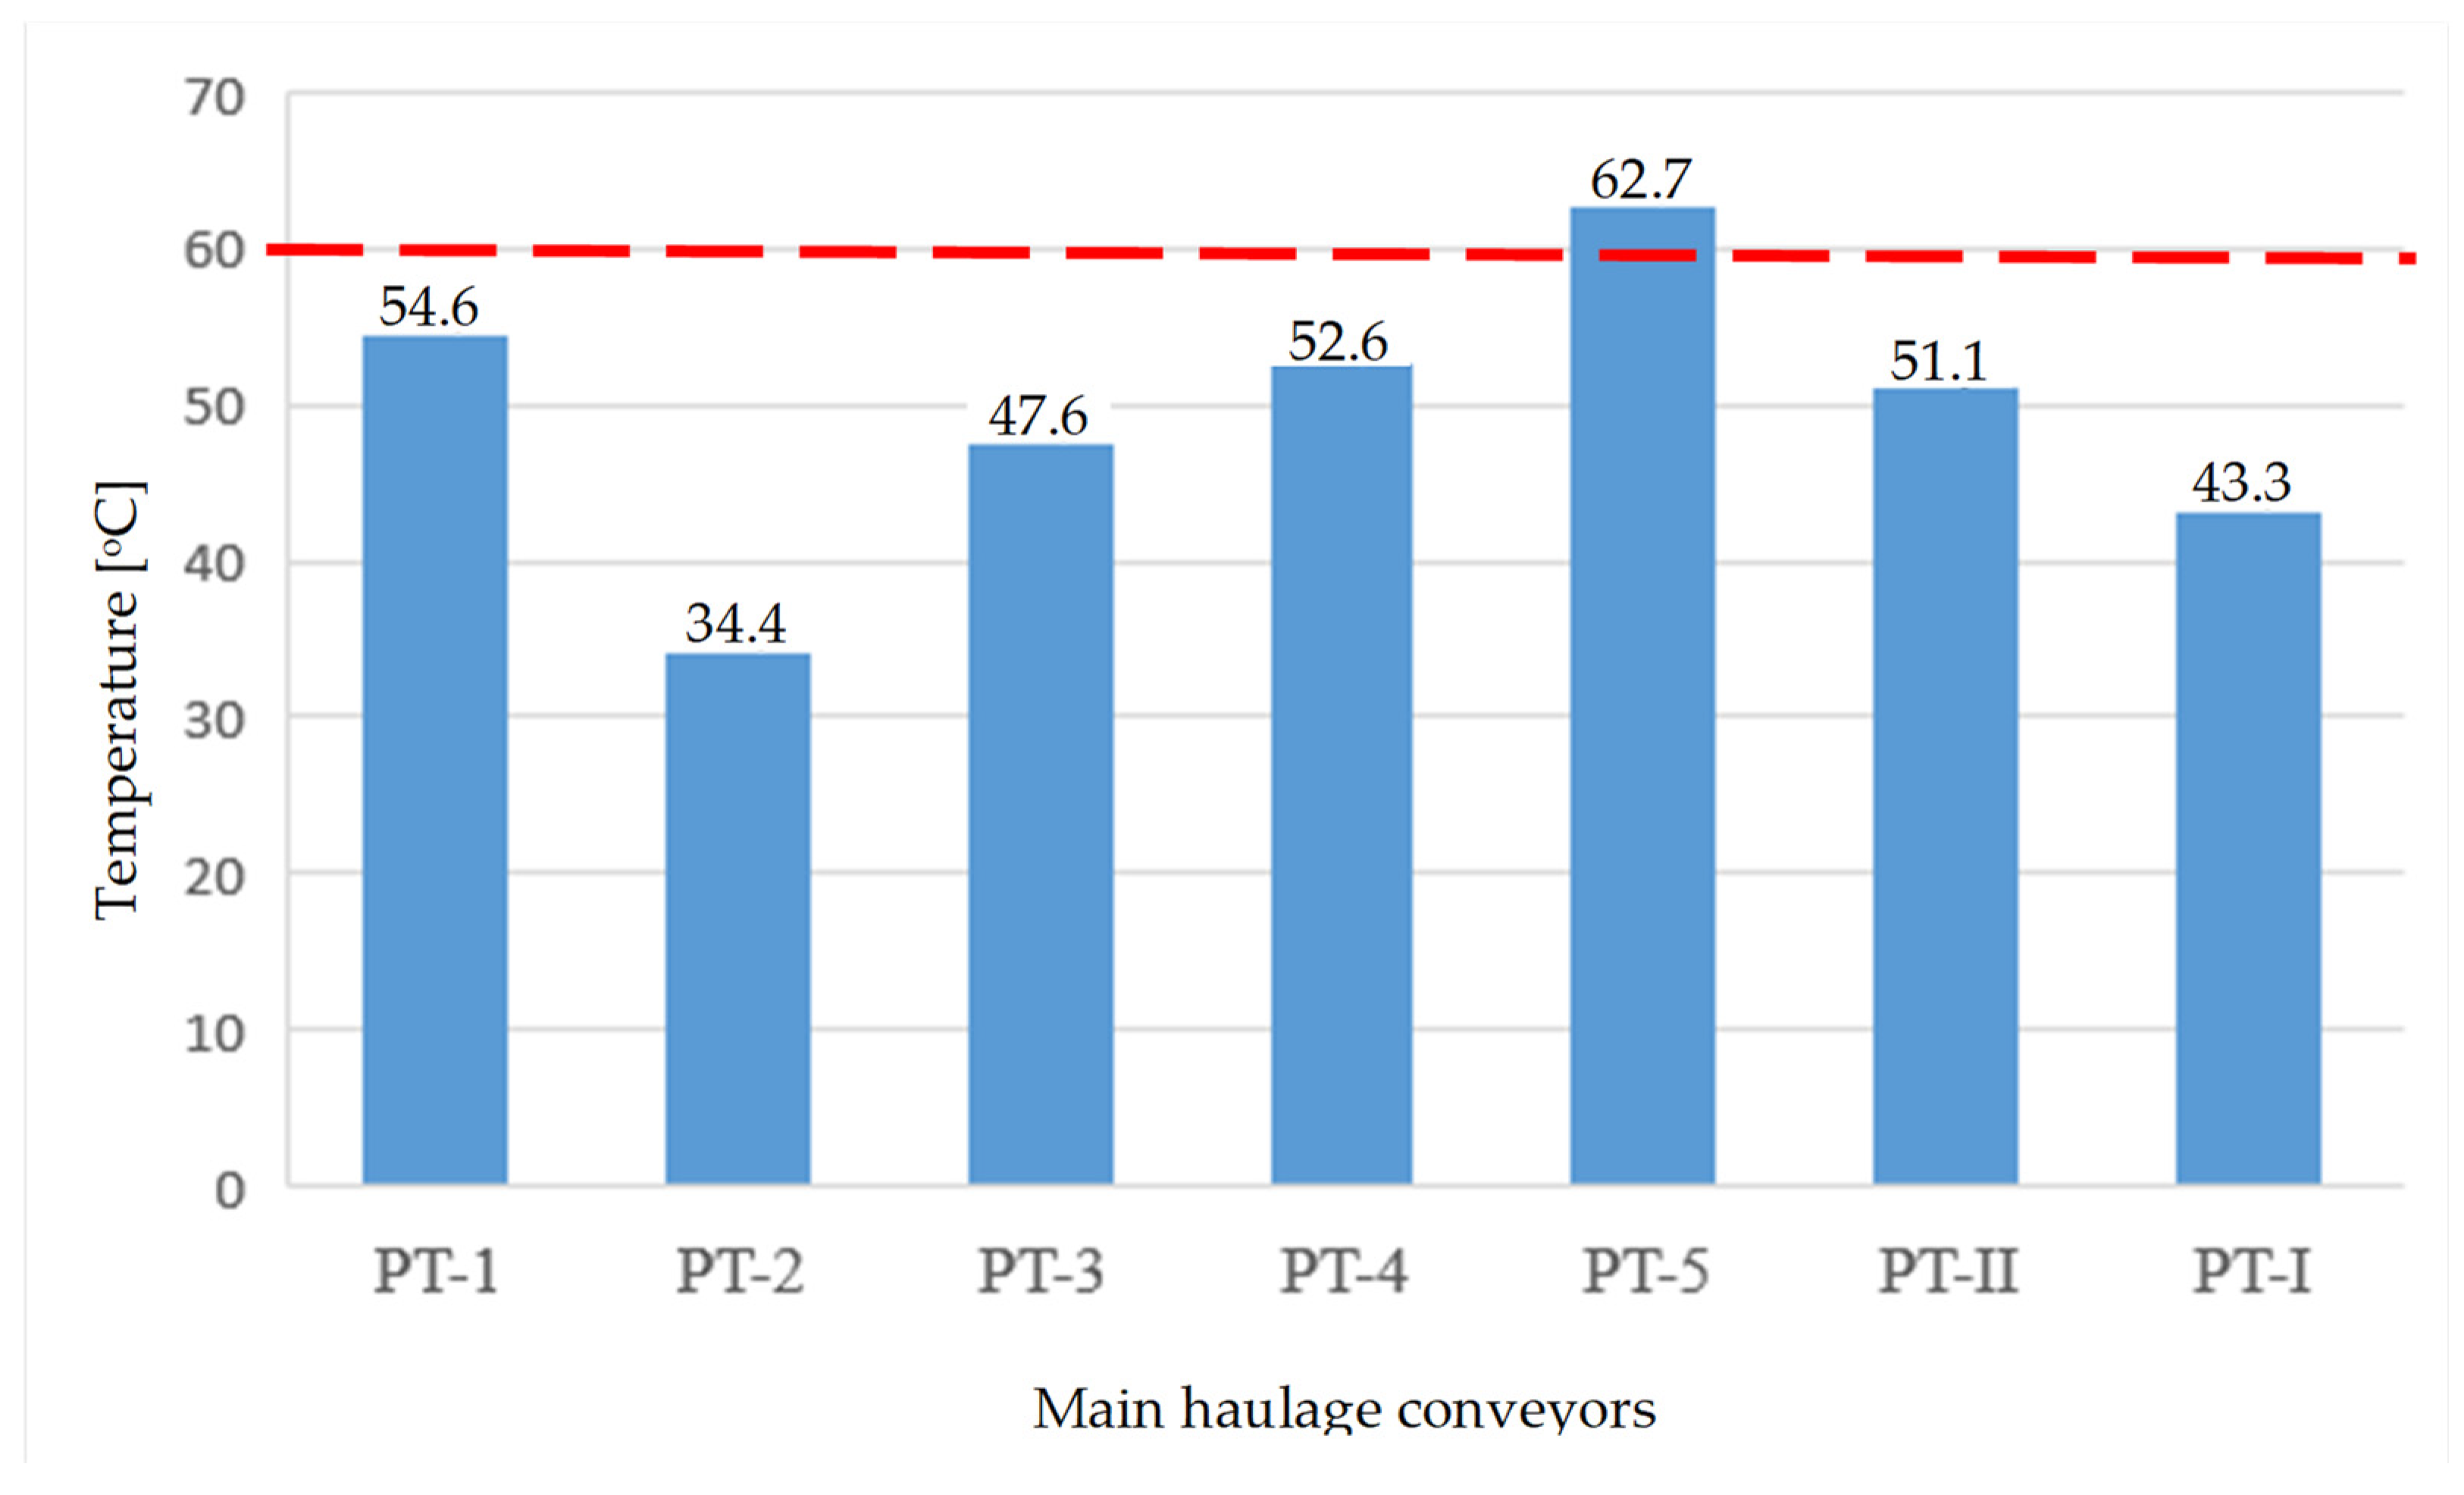
Figure 1), the highest temperatures were recorded for gearbox II and had a significant effect on the maximum temperature of the entire drive. For the PT-2 conveyor drive unit located in the collective ramp on E/III, the lowest of the maximum temperatures at around 29.9–34.2 °C. was recorded. Higher temperatures (50.1–54.6 °C) obtained from the measurements were characteristic of the PT-1 conveyor drive located in the belt gallery. In contrast, the same type of conveyor PT-3 achieved temperatures of 42.8–47.6 °C. In further measurements, temperatures remained between 47.2 and 52.6 °C for the drive unit of the PT-4 conveyor located in the eastern drift III. The presented comparison of temperatures obtained for the conveyor drive unit (
Figure 9) shows that the PT-5 conveyor drive has the highest temperatures, remaining at 62.7 °C, which means it exceeded the critical value of 60 °C. This may indicate intensive use of the conveyor. The analysed measurements for the PT-II conveyor drive were at a level of 48.3–51.0 °C, which indicates correct operation. For the PT-I conveyor, temperatures ranging from 38.0 to 43.3 °C were recorded.
A key element in the overall test procedure is to determine the values at which alarm states associated with temperatures exceeding 60 °C can be identified. The determination of these values is based on a statistical analysis of the results obtained for the main substitution tested. A summary of the measurements obtained (
Figure 10) for the main drive units are shown, with the temperature warning levels marked by a red dashed line.
The summary of obtained measurements for the presented
Figure 9, which illustrates all tested main haulage conveyors, can be the basis for searching for diagnostic changes related to improper operation. In the following discussion, based on the results obtained, the average temperature rise in relation to the ambient was determined [
92]:
where:
∆T–average temperature rise °C,
TI–temperature of the gear I °C,
TII–temperature of the gear II °C,
To–ambient temperature °C.
Table 4 shows that the effects of ambient temperature for the analysed drive units of the main haulage conveyors are different, which significantly affects the average temperature rise.
5. Conclusions
Thermal imaging is characterised by a non-invasive research method. Conducting this type of research is quite difficult in an underground mine. The use of stationary thermal condition monitoring on the main haulage can be quite difficult due to the dimensions of the workings. The application of the thermal imaging method to the monitoring of industrial processes, including underground mining, has made it possible to assess, based on the test results obtained, the thermal condition of the belt conveyor drive units (
Figure 9).
Thermal imaging technology makes it possible to solve many diagnostic problems easily and inexpensively by using a thermal imaging camera. The thermograms obtained (
Figure 6 and
Figure 7) depict the surface of the object under investigation, i.e., the areas with the highest or lowest temperature.
Based on the research and analysis carried out, the main causes of the thermal condition of the conveyor drive unit were defined. These are the location and method of installation in the excavation. The tested units were located in a hollow of the excavation, which for ventilation reasons affects the ventilation and adequate heat discharge. In order to address these issues, the design of underground workings must consider those remarks which can significantly improve the operating conditions of the machine and the quality of work for people. The relatively early identification of these causes can have a direct impact on the operational reliability of the conveyor drive unit. The relatively early detection of a thermal condition based on temperature measurements with a thermal imaging camera contributes to minimising the probability of a fire.
The thermal imaging inspections carried out allowed the thermal condition of the power unit to be determined and identified the location of intense heat generation, which may indicate the beginnings of a fault condition. The thermal imaging measurements made it possible to diagnose the thermal condition of the drive unit without stopping the belt conveyor operation. The thermal state characteristics obtained for the drive unit under test determined whether a critical temperature occurs. A key element of the entire test procedure was to determine the values at which emergency states associated with temperature exceedances above 60 °C could be visualised.
Author Contributions
Conceptualization, D.S. and M.S.; methodology, D.S. and L.S.; software, D.S., and M.S.; validation, D.S., S.Z., J.P., S.V. and M.C.; formal analysis, D.S., S.Z. and A.J.S.S.; investigation, D.S.; resources, D.S.; data curation, D.S and S.Z.; writing of the original draft preparation, D.S. and M.S.; writing of review and editing, D.S. and A.J.S.S.; visualization, D.S and A.J.S.S.; supervision, D.S.; project administration, D.S., L.S. and M.S.; funding acquisition, D.S. and S.Z. All authors have read and agreed to the published version of the manuscript.
Funding
This research received no external funding.
Institutional Review Board Statement
The study was conducted according to the guidelines of the Declaration.
Informed Consent Statement
Not applicable.
Data Availability Statement
Not applicable.
Acknowledgments
The paper was developed within the framework of Engineer’s Thesis called “Thermal imaging test for the thermal condition of conveyor belt structures”. The research task carried out as part of the student internship was courtesy of KWK ROW Ruch Chwałowice.
Conflicts of Interest
The authors declare no conflict of interest.
References
- Lucchi, E. Applications of the infrared thermography in the energy audit of buildings: A review. Renew. And Sust. Ener. Rev. 2018, 82, 3077–3090. [Google Scholar] [CrossRef]
- Lucchi, E. Non-invasive method for investigating energy and envirnomental performances in existing buildings. In Proceedings of the PLEA Conference on Passive and Low Energy Architecture, Louvain-la-Neuve, Belgium, 13–15 July 2011. [Google Scholar]
- Lucchi, E. Thermal transmittance of historical brick masonries: A comparison among standard data, analytical calculation procedures, and in situ heat flow meter measurements. Energy Build. 2017, 134, 171–184. [Google Scholar] [CrossRef]
- Lucchi, E. Thermal transmittance of historical stone masonries: A comparison among standard, calculated and measured data. Energy Build. 2017, 151, 393–405. [Google Scholar] [CrossRef]
- Minkina, W.; Klecha, D. Atmospheric transmission coefficient modeling in the infrared for termovision measurements. J. Sen. Sen. Sys. 2016, 5, 17–23. [Google Scholar] [CrossRef]
- Mazur, D.; Herbut, E.; Walczak, J. Termowizja jako metoda diagnostyczna. Rocz. Nauk. Zoot. 2006, 2, 171–181. [Google Scholar]
- Więcek, B.; De Mey, G. Termowizja w Podczerwieni, Podstawy i Zastosowania; Wydawnictwo PAK: Warsaw, Polnad, 2011. [Google Scholar]
- Minkina, W.; Dudzik, S. Infrared Thermography: Errors and Uncertainties; John Wiley & Sons: Hoboken, NJ, USA, 2009. [Google Scholar]
- Żabicki, D. Kamery termowizyjne w badaniach diagnostycznych. Elektroinstalator 2014, 1, 20–24. [Google Scholar]
- Howell, K.; Dudek, K.; Soroko, M. Thermal camera performance and image analysis repeatability in equine thermography. Infr. Phy. Technol. 2020, 110, 103447. [Google Scholar] [CrossRef]
- Więcek, B.; Pacholski, K.; Olbrycht, R.; Strąkowski, R.; Kałuża, M.; Borecki, M.; Wittchen, W. Termografia i Spektrometria w Podczerwieni, Zastosowania Przemysłowe; Wydawnictwo WNT: Warsaw, Poland, 2017. [Google Scholar]
- Michalik, P.; Zajac, J. Use of Thermovision for Monitoring Temperature Conveyor Belt of Pipe Conveyor. Appl. Mech. Mater. 2014, 68, 238–242. [Google Scholar] [CrossRef]
- Błażej, R. Ocena Stanu Technicznego Taśm Przenośnikowych z Linkami Stalowymi; Oficyna Wydawnicza Politechniki: Wrocławskiej, Poland, 2018. [Google Scholar]
- Antoniak, J. Przenośniki Taśmowe w Górnictwie Podziemnym i Odkrywkowym; Wydawnictwo Politechniki Śląskiej: Gliwice, Poland, 2010. [Google Scholar]
- Szrek, J.; Wodecki, J.; Błażej, R.; Zimroz, R. An Inspection Robot for Belt Conveyor Maintenance in Underground Mine—Infrared Thermography for Overheated Idlers Detection. Appl. Sci. 2020, 10, 4984. [Google Scholar] [CrossRef]
- Bortnowski, P.; Gladysiewicz, L.; Krol, R.; Ozdoba, M. Tests of Belt Linear Speed for Identification of Frictional Contact Phenomena. Sensors 2020, 20, 5816. [Google Scholar] [CrossRef]
- Kawalec, W.; Król, R.; Suchorab, N. Regenerative Belt Conveyor versus Haul Truck-Based Transport: Polish Open-Pit Mines Facing Sustainable Development Challenges. Sustainability 2020, 12, 9215. [Google Scholar] [CrossRef]
- Kawalec, W.; Suchorab, N.; Konieczna-Fuławka, M.; Król, R. Specific Energy Consumption of a Belt Conveyor System in a Continuous Surface Mine. Energies 2020, 13, 5214. [Google Scholar] [CrossRef]
- Bortnowski, P.; Gładysiewicz, L.; Król, R.; Ozdoba, M. Energy Efficiency Analysis of Copper Ore Ball Mill Drive Systems. Energies 2021, 14, 1786. [Google Scholar] [CrossRef]
- Bajda, M.; Hardygóra, M. Analysis of Reasons for Reduced Strength of Multiply Conveyor Belt Splices. Energies 2021, 14, 1512. [Google Scholar] [CrossRef]
- Lipinski, P.; Brzychczy, E.; Zimroz, R. Decision Tree-Based Classification for Planetary Gearboxes’ Condition Monitoring with the Use of Vibration Data in Multidimensional Symptom Space. Sensors 2020, 20, 5979. [Google Scholar] [CrossRef] [PubMed]
- Gąsior, K.; Urbańska, H.; Grzesiek, A.; Zimroz, R.; Wyłomańska, A. Identification, Decomposition and Segmentation of Impulsive Vibration Signals with Deterministic Components—A Sieving Screen Case Study. Sensors 2020, 20, 5648. [Google Scholar] [CrossRef]
- Kozłowski, T.; Wodecki, J.; Zimroz, R.; Błażej, R.; Hardygóra, M. A Diagnostics of Conveyor Belt Splices. Appl. Sci. 2020, 10, 6259. [Google Scholar] [CrossRef]
- Wodecki, J.; Góralczyk, M.; Krot, P.; Ziętek, B.; Szrek, J.; Worsa-Kozak, M.; Zimroz, R.; Śliwiński, P.; Czajkowski, A. Process Monitoring in Heavy Duty Drilling Rigs—Data Acquisition System and Cycle Identification Algorithms. Energies 2020, 13, 6748. [Google Scholar] [CrossRef]
- Góralczyk, M.; Krot, P.; Zimroz, R.; Ogonowski, S. Increasing Energy Efficiency and Productivity of the Comminution Process in Tumbling Mills by Indirect Measurements of Internal Dynamics—An Overview. Energies 2020, 13, 6735. [Google Scholar] [CrossRef]
- Hebda-Sobkowicz, J.; Zimroz, R.; Wyłomańska, A. Selection of the Informative Frequency Band in a Bearing Fault Diagnosis in the Presence of Non-Gaussian Noise—Comparison of Recently Developed Methods. Appl. Sci. 2020, 10, 2657. [Google Scholar] [CrossRef]
- Schmidt, S.; Zimroz, R.; Chaari, F.; Heyns, P.S.; Haddar, M. A Simple Condition Monitoring Method for Gearboxes Operating in Impulsive Environments. Sensors 2020, 20, 2115. [Google Scholar] [CrossRef]
- Ziętek, B.; Banasiewicz, A.; Zimroz, R.; Szrek, J.; Gola, S. A Portable Environmental Data-Monitoring System for Air Hazard Evaluation in Deep Underground Mines. Energies 2020, 13, 6331. [Google Scholar] [CrossRef]
- Borkowski, P.J. Comminution of Copper Ores with the Use of a High-Pressure Water Jet. Energies 2020, 13, 6274. [Google Scholar] [CrossRef]
- Zimroz, R. Metody Adaptacyjne w Diagnostyce Układów Napędowych Maszyn Górniczych; Oficyna Wydawnicza Politechniki: Wrocławskiej, Poland, 2010. [Google Scholar]
- Błażej, R.; Sawicki, M.; Konieczna, M.; Kozłowski, T.; Kirjanów, A. Automatic analysis of themrograms as a means for estimating technical of a gear system. Diagnostyka 2016, 2, 43–48. [Google Scholar]
- Sawicki, M.; Stefaniak, P.; Zimroz, R.; Błażej, R. Badania eksperymentalne stanu technicznego elementów przenośnika taśmowego z wykorzystaniem metody termowizyjnych, Interdyscyplinarne zagadnienia w górnictwie i geologii. Interdyscyplinarne Zagadnienia w Górnictwie i Geologii 2013, 203–211. Available online: http://diagbelt.pwr.edu.pl/Publikacje/J.Z.W.G.I.G._tomIV_2013.pdf (accessed on 28 May 2021).
- Sawicki, M.; Stefaniak, P.; Zimroz, R.; Błażej, R.; Król, R. Wykorzystanie metod termowizyjnych do badania stanu technicznego układów napędowych przenośników taśmowych w O/ZG Polkowice-Sieroszowice. Interdyscyplinarne Zagadnienia w Górnictwie i Geologii 2014, 177–183. Available online: http://labdiag.pwr.wroc.pl/radzim/papers/2014/Sawicki%20i%20inni_KDiMU’14_vO.docx (accessed on 28 May 2021).
- Zimroz, R.; Stefaniak, P.; Hardygóra, M. Wybrane zagadnienia diagnostyki procesów roboczych i stanu technicznego elementów maszyn górniczych. Inżynieria Maszyn. 2014, 19, 7–16. [Google Scholar]
- Hulewicz, A. Diagnostyka termowizyjna w elektrotechnice. Pozn. Univ. Technol. Acad. J. Electr. Eng. 2017, 89, 259–269. [Google Scholar] [CrossRef]
- Soroko, M. Termowizja w sporcie—Kontrola kontuzji siatkarzy. Acta Bio Opit. Informa. Med. 2010, 1, 46–47. [Google Scholar]
- Wittchen, W.; Mazur, A. Metoda termowizji jako narzędzie pomocnicze w procesach symulacji numerycznej. Prace IMŻ. 2012, 1, 188–191. [Google Scholar]
- Minkina, W.; Rutkowski, P.; Wild, W. Podstawy pomiarów termowizyjnych. Część II—Współczesne rozwiązania systemów termowizyjnych, błędy metody. PAK 2000, 1, 11–14. [Google Scholar]
- Bartelus, W. Diagnostyka Maszyn Górniczych: Górnictwo Odkrywkowe; Wydawnictwo Śląsk: Katowice, Poland, 1998. [Google Scholar]
- Tutak, M.; Brodny, J.; Szurgacz, D.; Sobik, L.; Zhironkin, S. The Impact of the Ventilation System on the Methane Release Hazard and Spontaneous Combustion of Coal in the Area of Exploitation—A Case Study. Energies 2020, 13, 4891. [Google Scholar] [CrossRef]
- Tutak, M. The Influence of the Permeability of the Fractures Zone Around the Heading on the Concentration and Distribution of Methane. Sustainability 2020, 12, 16. [Google Scholar] [CrossRef]
- Tutak, M.; Brodny, J. The Impact of the Strength of Roof Rocks on the Extent of the Zone with a High Risk of Spontaneous Coal Combustion for Fully Powered Longwalls Ventilated with the Y-Type System—A Case Study. Appl. Sci. 2019, 9, 5315. [Google Scholar] [CrossRef]
- Tutak, M.; Brodny, J. Forecasting Methane Emissions from Hard Coal Mines Including the Methane Drainage Process. Energies 2019, 12, 3840. [Google Scholar] [CrossRef]
- Tutak, M.; Brodny, J. Predicting Methane Concentration in Longwall Regions Using Artificial Neural Networks. Int. J. Environ. Res. Public Health 2019, 16, 1406. [Google Scholar] [CrossRef] [PubMed]
- Tutak, M.; Brodny, J. Analysis of the Impact of Auxiliary Ventilation Equipment on the Distribution and Concentration of Methane in the Tailgate. Energies 2018, 11, 3076. [Google Scholar] [CrossRef]
- Brodny, J.; Tutak, M. Analyzing Similarities between the European Union Countries in Terms of the Structure and Volume of Energy Production from Renewable Energy Sources. Energies 2020, 13, 913. [Google Scholar] [CrossRef]
- Brodny, J.; Tutak, M. Analysing the Utilisation Effectiveness of Mining Machines Using Independent Data Acquisition Systems: A Case Study. Energies 2019, 12, 2505. [Google Scholar] [CrossRef]
- Brodny, J.; Tutak, M. Exposure to Harmful Dusts on Fully Powered Longwall Coal Mines in Poland. Int. J. Environ. Res. Public Health 2018, 15, 1846. [Google Scholar] [CrossRef]
- Szurgacz, D.; Tutak, M.; Brodny, J.; Sobik, L.; Zhironkina, O. The Method of Combating Coal Spontaneous Combustion Hazard in Goafs—A Case Study. Energies 2020, 13, 4538. [Google Scholar] [CrossRef]
- Nowicki, J.; Hebda-Sobkowicz, J.; Zimroz, R.; Wylomanska, A. Local Defect Detection in Bearings in the Presence of Heavy-Tailed Noise and Spectral Overlapping of Informative and Non-Informative Impulses. Sensors 2020, 20, 6444. [Google Scholar] [CrossRef] [PubMed]
- Hebda-Sobkowicz, J.; Gola, S.; Zimroz, R.; Wyłomańska, A. Identification and Statistical Analysis of Impulse-Like Patterns of Carbon Monoxide Variation in Deep Underground Mines Associated with the Blasting Procedure. Sensors 2019, 19, 2757. [Google Scholar] [CrossRef]
- Polnik, B. Tests of a longwall shearer diagnostic system using infrared camera. Meas. Auto. Monit. 2015, 6, 249–251. [Google Scholar]
- Chajda, J.; Poloszyk, S.; Różański, L. Termowizja w diagnostyce technicznej maszyn technologicznych. Arch. Technol. Masz. Automat. 1999, 19, 65–82. [Google Scholar]
- Gabryś, R. Termografia w diagnostyce. Elektroinstalator 2017, 4, 28–32. [Google Scholar]
- Kuczyński, K. Bezkontaktowa diagnostyka urządzeń. Elektro Info 2010, 11, 46–48. [Google Scholar]
- Żabicki, D. Termowizja w diagnostyce maszyn i urządzeń elektroenergetycznych. Elektroinstalator 2016, 3, 48–51. [Google Scholar]
- Erazo-Aux, J.; Loaiza-Correa, H.; Restrepo-Giron, A.D.; Ibarra-Castanedo, C.; Maldague, X. Thermal imaging dataset from composite material academic samples inspected by pulsed thermography. Data Brief 2020, 32, 106313. [Google Scholar] [CrossRef] [PubMed]
- Paramasivam, B. Investigation on the effects of damping over the temperature distribution on internal turning bar using Infrared fusion thermal imager analysis via SmartView software. Measurement 2020, 162, 107938. [Google Scholar] [CrossRef]
- Tattersall, G.L.; Danner, R.M.; Chaves, J.A.; Levesque, D.L. Activity analysis of thermal imaging videos using a difference imaging approach. J. Ther. Biol. 2020, 91, 102611. [Google Scholar] [CrossRef]
- Carvalho, R.; Nascimento, R.; D’Angelo, T.; Delabrida, S.; Bianchi, A.G.C.; Oliveira, R.A.R.; Azpúrua, H.; Garcia, L.G.U. A UAV-Based Framework for Semi-Automated Thermographic Inspection of Belt Conveyors in the Mining Industry. Sensors 2020, 20, 2243. [Google Scholar] [CrossRef]
- Ghorbanzadeh, O.; Valizadeh Kamran, K.; Blaschke, T.; Aryal, J.; Naboureh, A.; Einali, J.; Bian, J. Spatial Prediction of Wildfire Susceptibility Using Field Survey GPS Data and Machine Learning Approaches. Fire 2019, 2, 43. [Google Scholar] [CrossRef]
- Oishi, Y.; Ishida, H.; Nakajima, T.Y.; Nakamura, R.; Matsunaga, T. The Impact of Different Support Vectors on GOSAT-2 CAI-2 L2 Cloud Discrimination. Remote Sens. 2017, 9, 1236. [Google Scholar] [CrossRef]
- Ozotta, O.; Gerla, P.J. Mapping Groundwater Seepage in a Fen Using Thermal Imaging. Geosciences 2021, 11, 29. [Google Scholar] [CrossRef]
- Resendiz-Ochoa, E.; Saucedo-Dorantes, J.J.; Benitez-Rangel, J.P.; Osornio-Rios, R.A.; Morales-Hernandez, L.A. Novel Methodology for Condition Monitoring of Gear Wear Using Supervised Learning and Infrared Thermography. Appl. Sci. 2020, 10, 506. [Google Scholar] [CrossRef]
- Milovanović, B.; Banjad Pečur, I. Review of Active IR Thermography for Detection and Characterization of Defects in Reinforced Concrete. J. Imaging 2016, 2, 11. [Google Scholar] [CrossRef]
- Clark, M.R.; McCann, D.M.; Forde, M.C. Application of infrared thermography to the non-destructive testing of concrete and masonry bridge. NDT E Int. 2003, 36, 265–275. [Google Scholar] [CrossRef]
- Meola, C.; Boccardi, S.; Carlomagno, G.M. An Excursus on Infrared Thermography Imaging. J. Imaging 2016, 2, 36. [Google Scholar] [CrossRef]
- De Finis, R.; Palumbo, D.; Galietti, U. Mechanical Behaviour of Stainless Steels under Dynamic Loading: An Investigation with Thermal Methods. J. Imaging 2016, 2, 32. [Google Scholar] [CrossRef]
- Robinson, J.B.; Shearing, P.R.; Brett, D.J.L. Thermal Imaging of Electrochemical Power Systems: A Review. J. Imaging 2016, 2, 2. [Google Scholar] [CrossRef]
- Steen, K.A.; Villa-Henriksen, A.; Therkildsen, O.R.; Green, O. Automatic Detection of Animals in Mowing Operations Using Thermal Cameras. Sensors 2012, 12, 7587–7597. [Google Scholar] [CrossRef]
- Eisele, A.; Lau, I.; Hewson, R.; Carter, D.; Wheaton, B.; Ong, C.; Cudahy, T.J.; Chabrillat, S.; Kaufmann, H. Applicability of the Thermal Infrared Spectral Region for the Prediction of Soil Properties Across Semi-Arid Agricultural Landscapes. Remote Sens. 2012, 4, 3265–3286. [Google Scholar] [CrossRef]
- Malicki, W.; Miedziński, B. Przydatność termowizji do diagnostyki technicznej urządzeń energomechanicznych w zakładach górniczych. Mechan. Automat. Górn. 2009, 7, 34–38. [Google Scholar]
- Fedorczak-Cisak, M.; Radziszewska-Zielina, E.; Orlik-Kożdoń, B.; Steidl, T.; Tatara, T. Analysis of the Thermal Retrofitting Potential of the External Walls of Podhale’s Historical Timber Buildings in the Aspect of the Non-Deterioration of Their Technical Condition. Energies 2020, 13, 4610. [Google Scholar] [CrossRef]
- Kasprzyk-Kucewicz, T.; Szurko, A.; Stanek, A.; Sieroń, K.; Morawiec, T.; Cholewka, A. Usefulness in Developing an Optimal Training Program and Distinguishing between Performance Levels of the Athlete’s Body by Using of Thermal Imaging. Int. J. Environ. Res. Public Health 2020, 17, 5698. [Google Scholar] [CrossRef] [PubMed]
- Siekański, P.; Paśko, S.; Malowany, K.; Malesa, M. Online Correction of the Mutual Miscalibration of Multimodal VIS–IR Sensors and 3D Data on a UAV Platform for Surveillance Applications. Remote Sens. 2019, 11, 2469. [Google Scholar] [CrossRef]
- Maj, M.; Ubysz, A.; Hammadeh, H.; Askifi, F. Non-Destructive Testing of Technical Conditions of RC Industrial Tall Chimneys Subjected to High Temperature. Materials 2019, 12, 2027. [Google Scholar] [CrossRef] [PubMed]
- Noszczyk, P.; Nowak, H. Inverse Contrast in Non-Destructive Materials Research by Using Active Thermography. Materials 2019, 12, 835. [Google Scholar] [CrossRef] [PubMed]
- Galla, S. A Thermographic Measurement Approach to Assess Supercapacitor Electrical Performances. Appl. Sci. 2017, 7, 1247. [Google Scholar] [CrossRef]
- Wernik, J. Investigation of Heat Loss from the Finned Housing of the Electric Motor of a Vacuum Pump. Appl. Sci. 2017, 7, 1214. [Google Scholar] [CrossRef]
- Nieoczym, A.; Longwic, R.; Lotko, W. Wstępna diagnostyka pojazdu z wykorzystaniem kamery termowizyjnej. Eksploatacja Testy 2017, 6, 981–984. [Google Scholar]
- Cheaito, R.; Gorham, C.S.; Misra, A.; Hattar, K.; Hopkins, P.E. Thermal conductivity measurements via time-domain thermoreflectance for the characterization of radiation induced damage. J. Mater. Res. 2015, 30, 1403–1412. [Google Scholar] [CrossRef]
- Dular, M.; Coutier-Delgosha, O. Thermodynamic effects during growth and collapse of a single cavitation bubble. J. Fluid Mecha. 2013, 736, 44–66. [Google Scholar] [CrossRef]
- Eriksson, P.; Andersson, J.Y.; Stemme, G. Thermal characterization of surface-micromachined silicon nitride membranes for thermal infrared detectors. J. Microele. Syst. 1997, 6, 55–61. [Google Scholar] [CrossRef]
- Krešák, J.; Peterka, P.; Kropuch, S.; Novák, L. Measurement of tight in steel ropes by a mean of thermovision. Measurement 2014, 50, 93–98. [Google Scholar] [CrossRef]
- Suszyński, Z.; Świta, R.; Łoś, J.; Zarzycka, M.B.; Kaleniecka, A.; Zarzycki, P.K. Fast assessment of planar chromatographic layers quality using pulse thermovision metod. J. Chromatogr. A 2014, 1373, 211–215. [Google Scholar] [CrossRef]
- Nadolny, K.; Plichta, J. Comparative method of thermovision temperature measurement in single-pass internal cylindrical grinding. Arch. Civ. Mech. Eng. 2006, 4, 67–74. [Google Scholar] [CrossRef]
- Ivanov, G.V.; Ivanov, V.G. Temperature and emissivity determination of small-size long-range object’s using staring Thermovision Cameras. Infrared Phys. Technol. 2013, 60, 161–165. [Google Scholar] [CrossRef]
- Sun, X.; Xu, H.; He, M.; Zhang, F. Experimental investigation of the occurrence of rockburst in a rock specimen through infrared thermography and acoustic emission. Int. J. Rock Mech. Min. Sci. 2017, 93, 250–259. [Google Scholar] [CrossRef]
- He, M.; Jia, X.; Gong, W.; Faramarzi, L. Physical modeling of an underground roadway excavation in vertically stratified rock using infrared thermography. Int. J. Rock Mech. Min. Sci. 2010, 47, 1212–1221. [Google Scholar] [CrossRef]
- Chan, W.T.; Sim, K.S.; Tso, C.P. Application of optical character recognition in thermal image processing. Infrared Phys. Technol. 2011, 54, 353–366. [Google Scholar] [CrossRef]
- Madura, H.; Sosnowski, T.; Bieszczad, G. Termowizyjne kamery obserwacyjne—Budowa, zastosowanie i krajowe możliwości realizacji. Przegl. Electrotech. 2014, 9, 5–8. [Google Scholar]
- Król, R. Metody Badań i Doboru Elementów Przenośnika Taśmowego z Uwzględnieniem Losowo Zmiennej Strugi Urobku; Wydział Geoinżynierii, Górnictwa i Geologii Politechniki: Wrocławskiej, Poland, 2018. [Google Scholar]
Figure 1.
Layout of the conveyors of the main haulage system, (PT—a belt conveyor).
Figure 1.
Layout of the conveyors of the main haulage system, (PT—a belt conveyor).
Figure 2.
Support structure of the conveyor route: (a) The upper belt forms a trough with an angle of 35°; (b) View of the upper and lower belt routing.
Figure 2.
Support structure of the conveyor route: (a) The upper belt forms a trough with an angle of 35°; (b) View of the upper and lower belt routing.
Figure 3.
The measuring equipment used in the study of the thermal condition of the belt conveyor drive unit: (a) Dräger UFC 9000 thermal imaging karma; (b) FLIR i60 thermal imaging camera; (c) FLUKE 561 pyrometer.
Figure 3.
The measuring equipment used in the study of the thermal condition of the belt conveyor drive unit: (a) Dräger UFC 9000 thermal imaging karma; (b) FLIR i60 thermal imaging camera; (c) FLUKE 561 pyrometer.
Figure 4.
Conveyor drive unit, where; 1—engine, 2—left brake system (I), 3—left gearbox (I), 4—right gearbox (II), 5—right brake system (II), 6—engine, 7—foundation.
Figure 4.
Conveyor drive unit, where; 1—engine, 2—left brake system (I), 3—left gearbox (I), 4—right gearbox (II), 5—right brake system (II), 6—engine, 7—foundation.
Figure 5.
Graph for the operating time of the main haulage belt conveyors, where: 1—the operating time (it is in motion) of the conveyor belt, 0—the idle time (the machine is halted).
Figure 5.
Graph for the operating time of the main haulage belt conveyors, where: 1—the operating time (it is in motion) of the conveyor belt, 0—the idle time (the machine is halted).
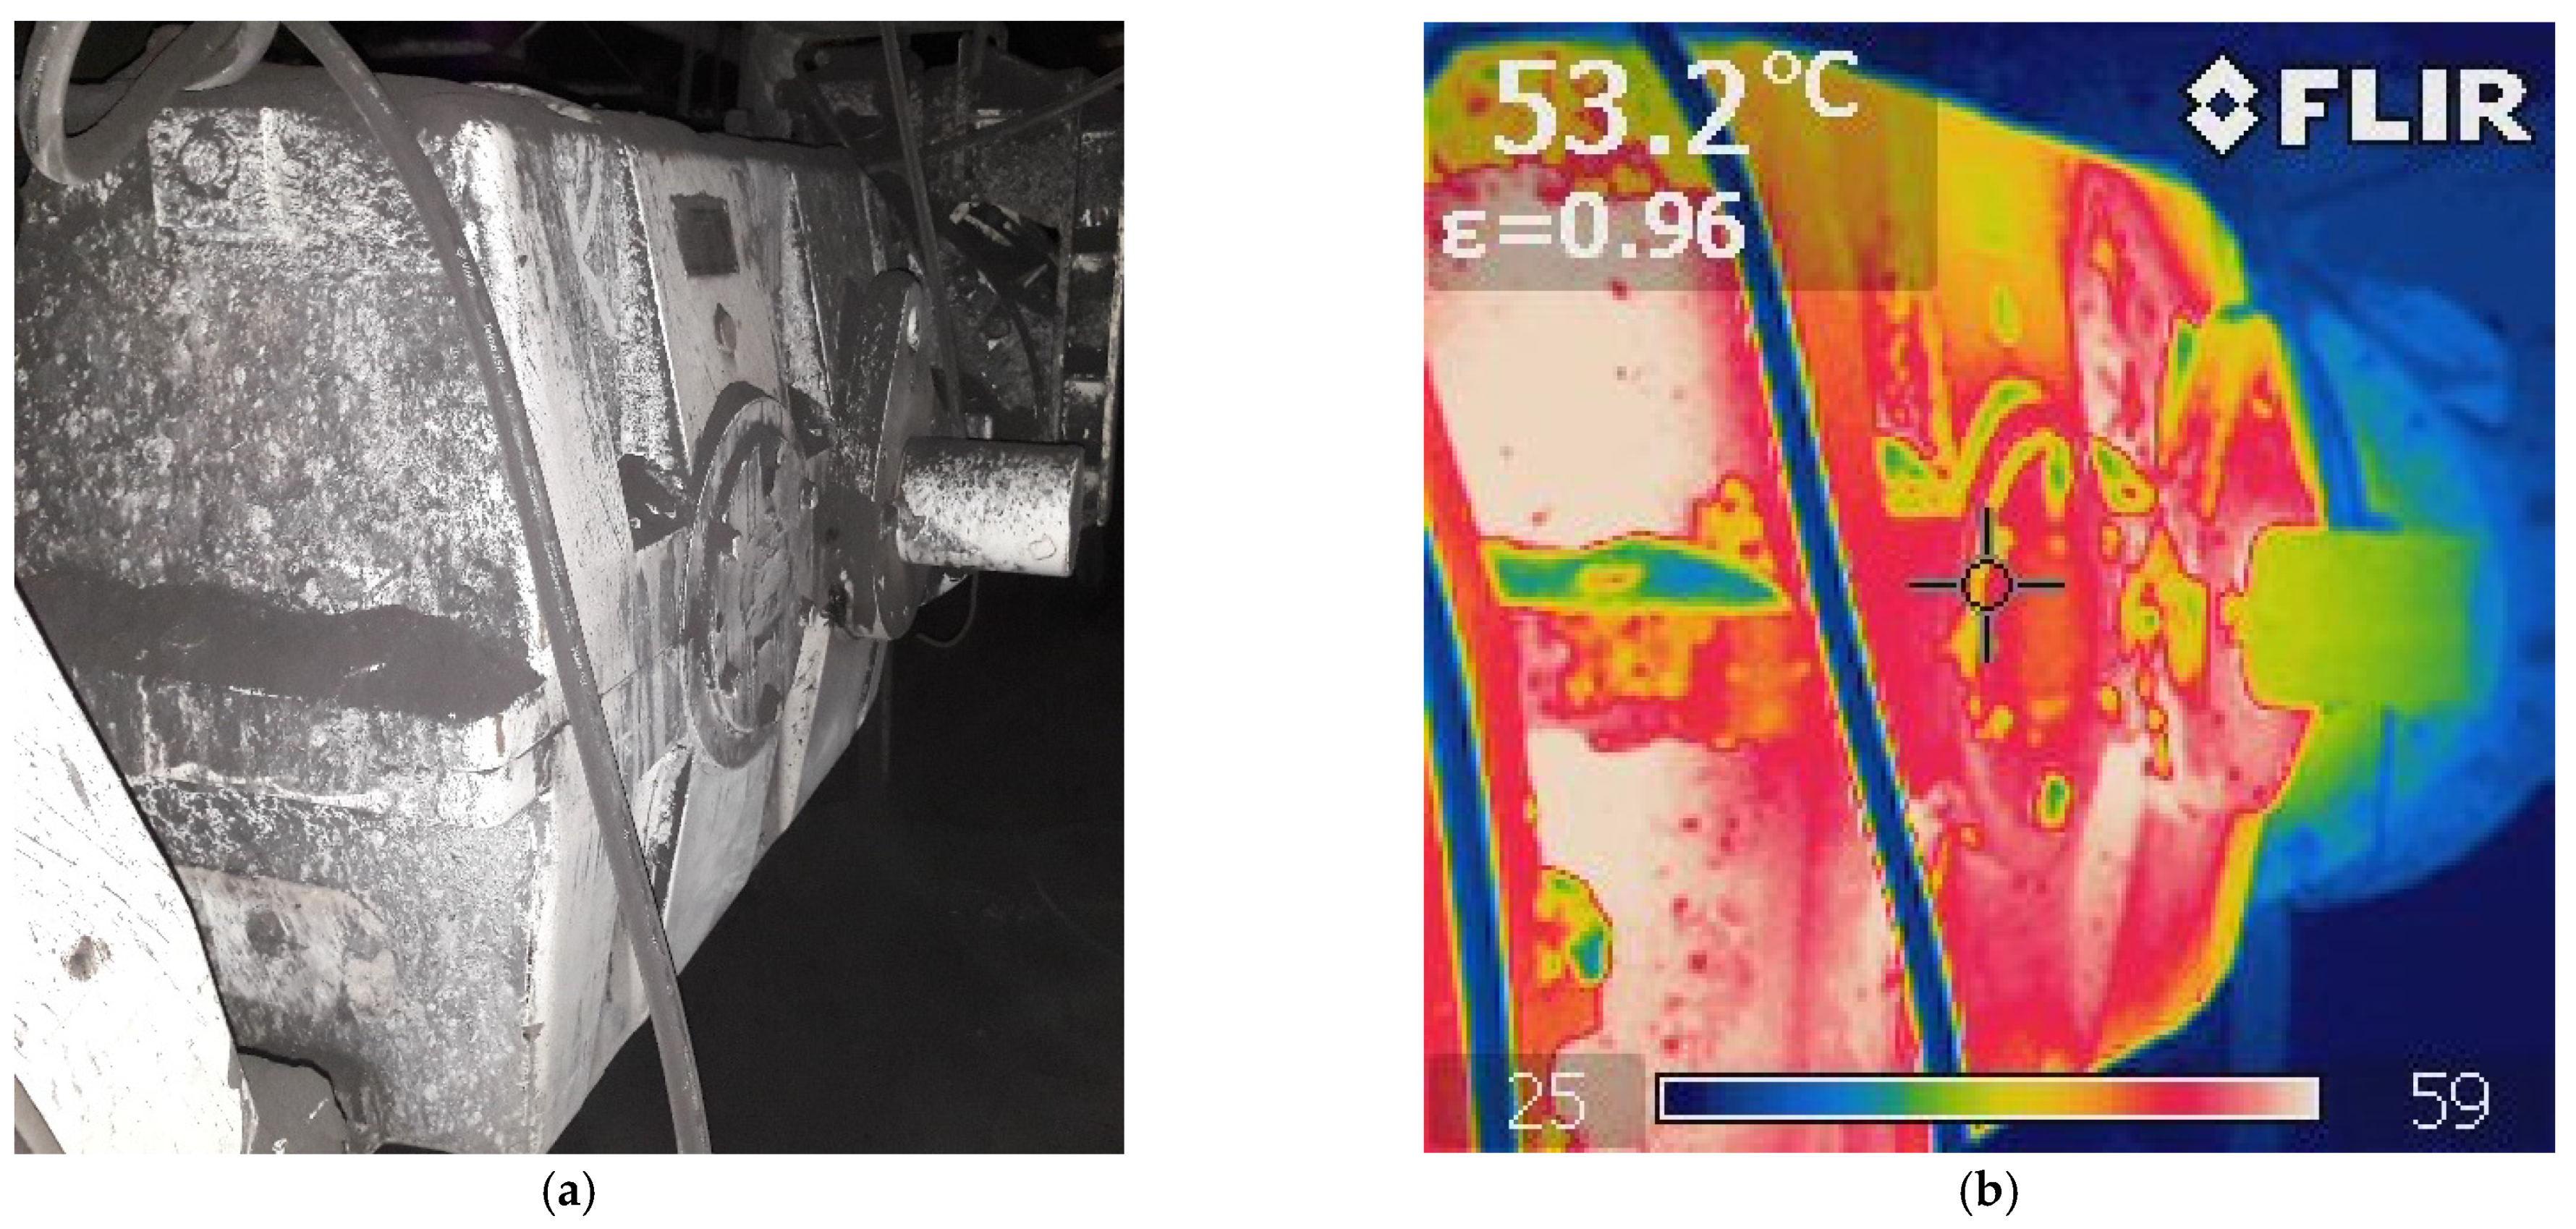
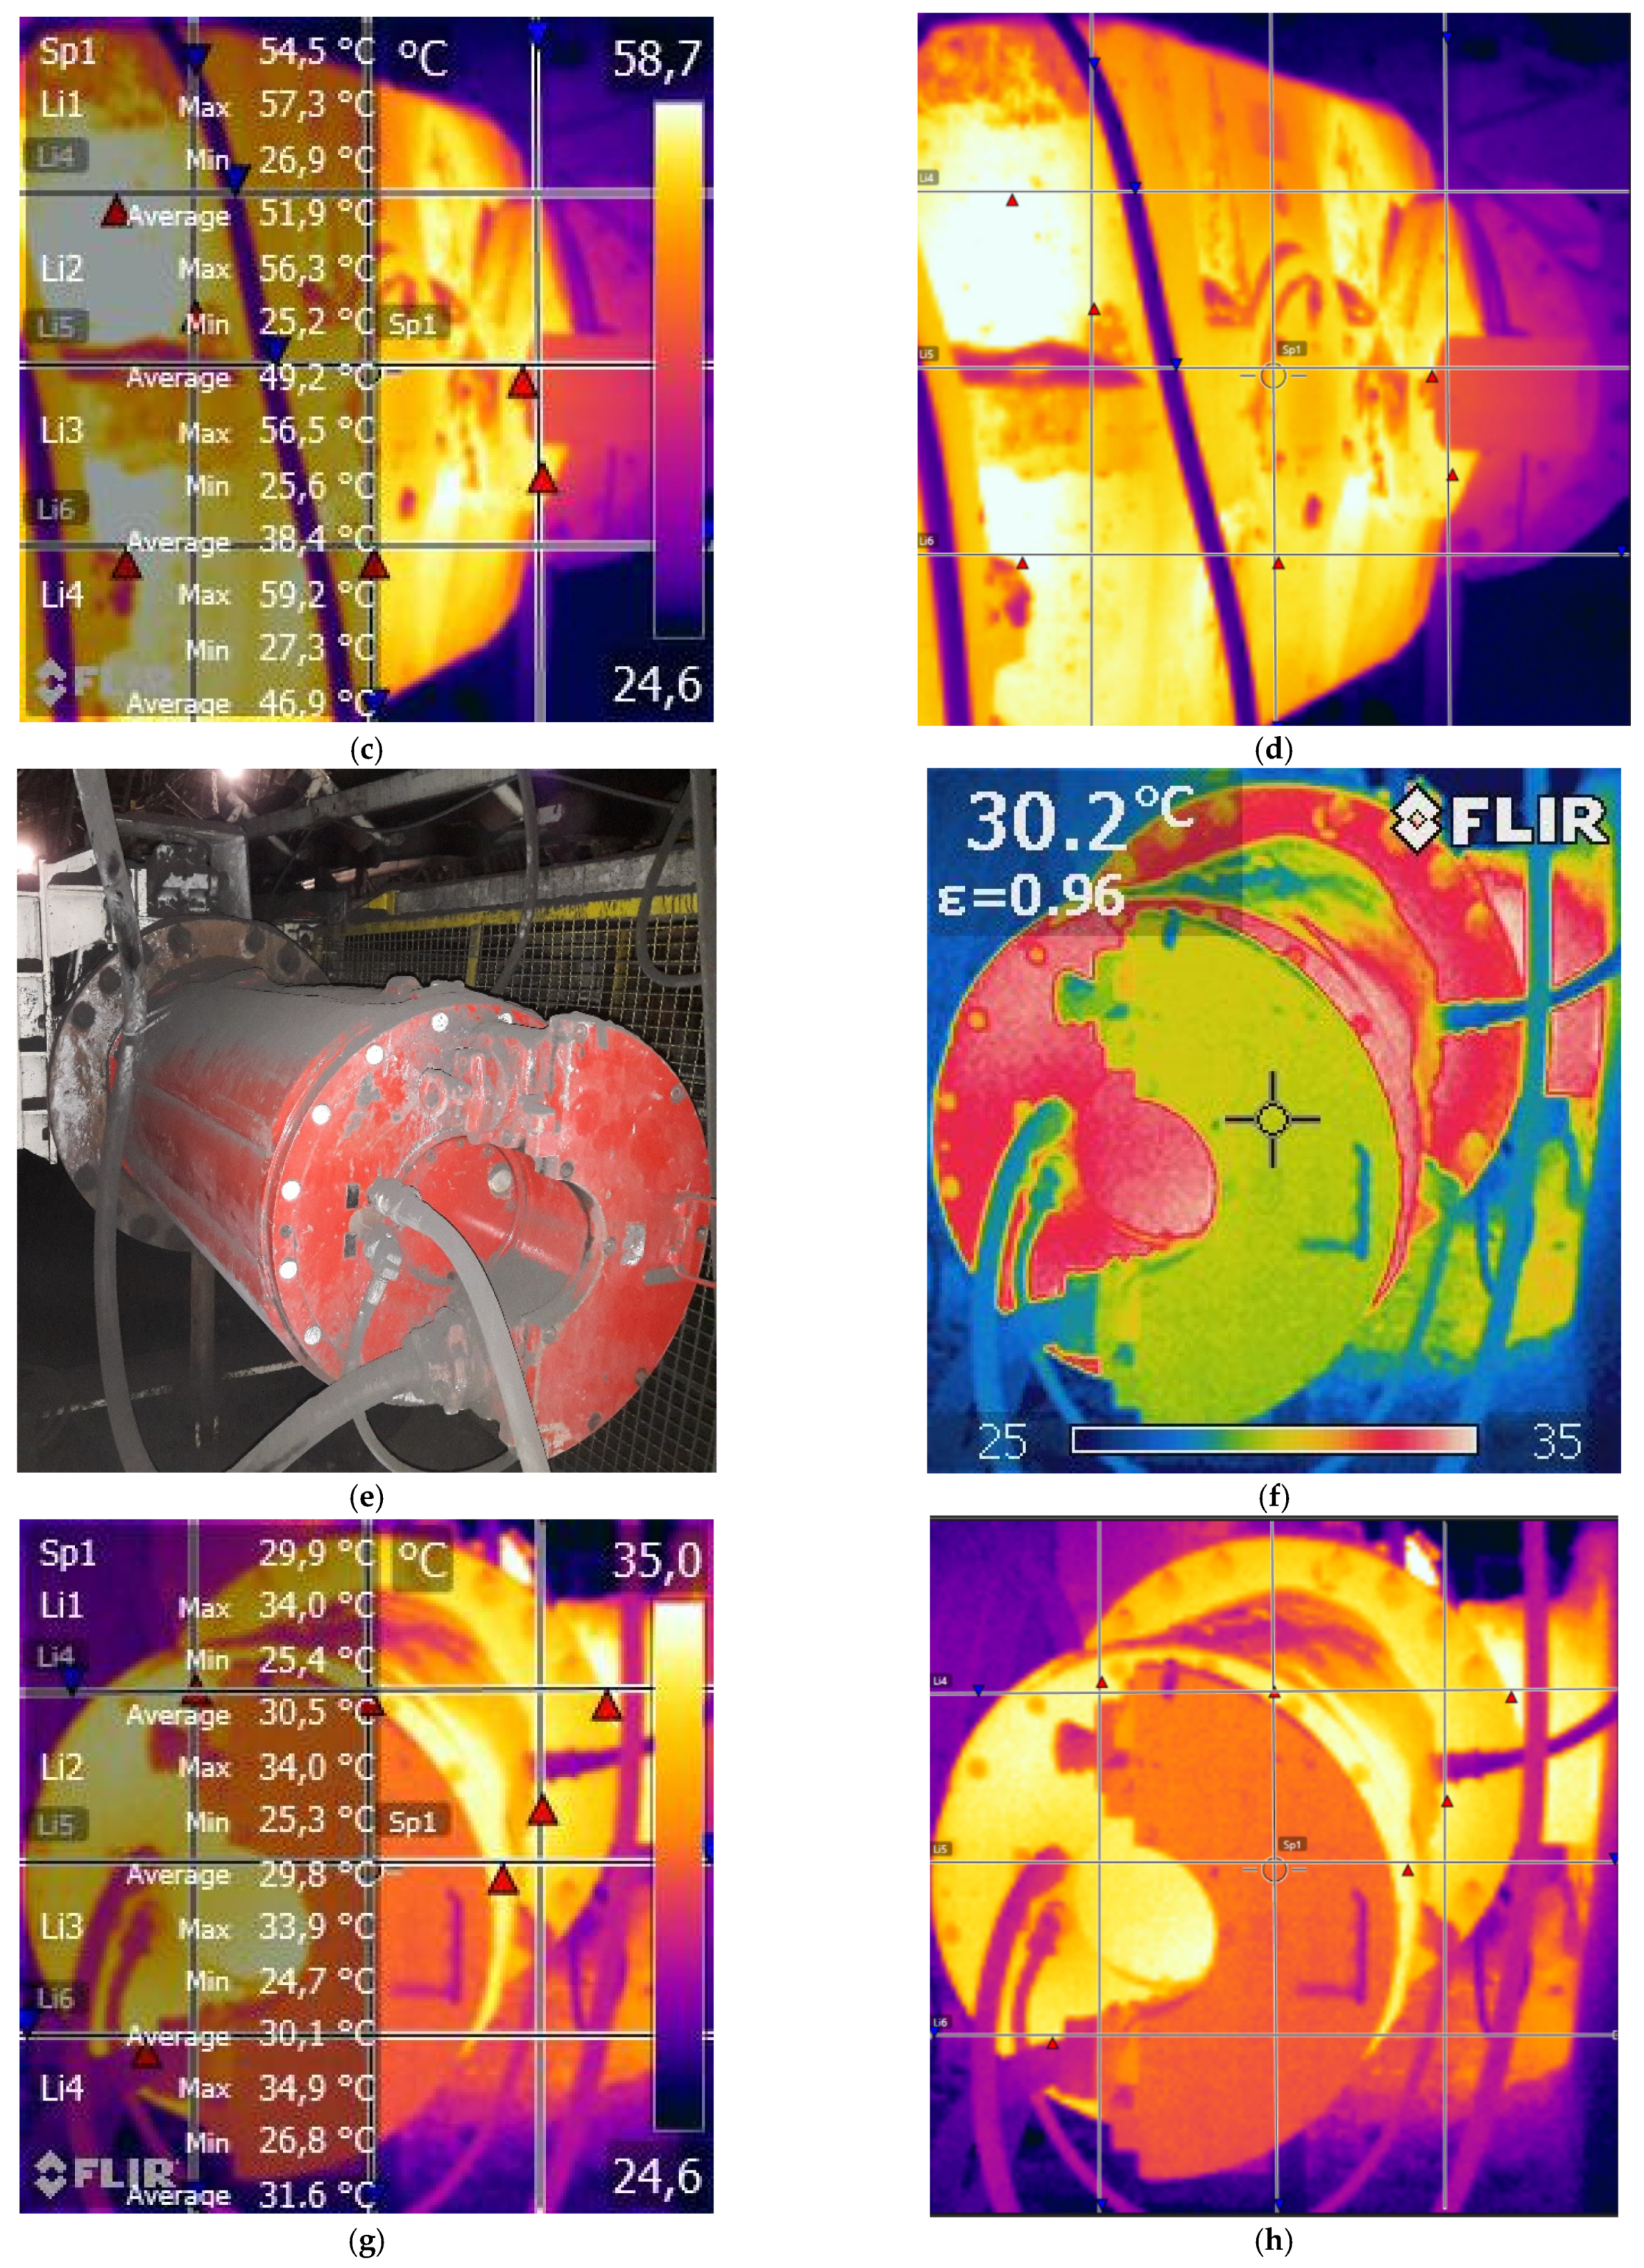
Figure 6.
A view from a measurement session made with a thermal imaging camera together with processing in the software FLIR Tools for (II) drive unit of belt conveyor PT-4 from the analysed main haulage, where heat distribution is presented for: (a) photo of the tested right gearbox (II); (b) thermogram with visible thermal effect for the right gearbox (II); (c,d) thermogram showing the heat distribution for the right gearbox (II); (e) photo of the tested right engine (II), (f) thermogram with visible thermal effect for the right engine (II); (g,h) thermogram showing the heat distribution for the right engine (II); (i,j) thermogram showing the heat distribution taken with the Dräger UFC 9000 camera.
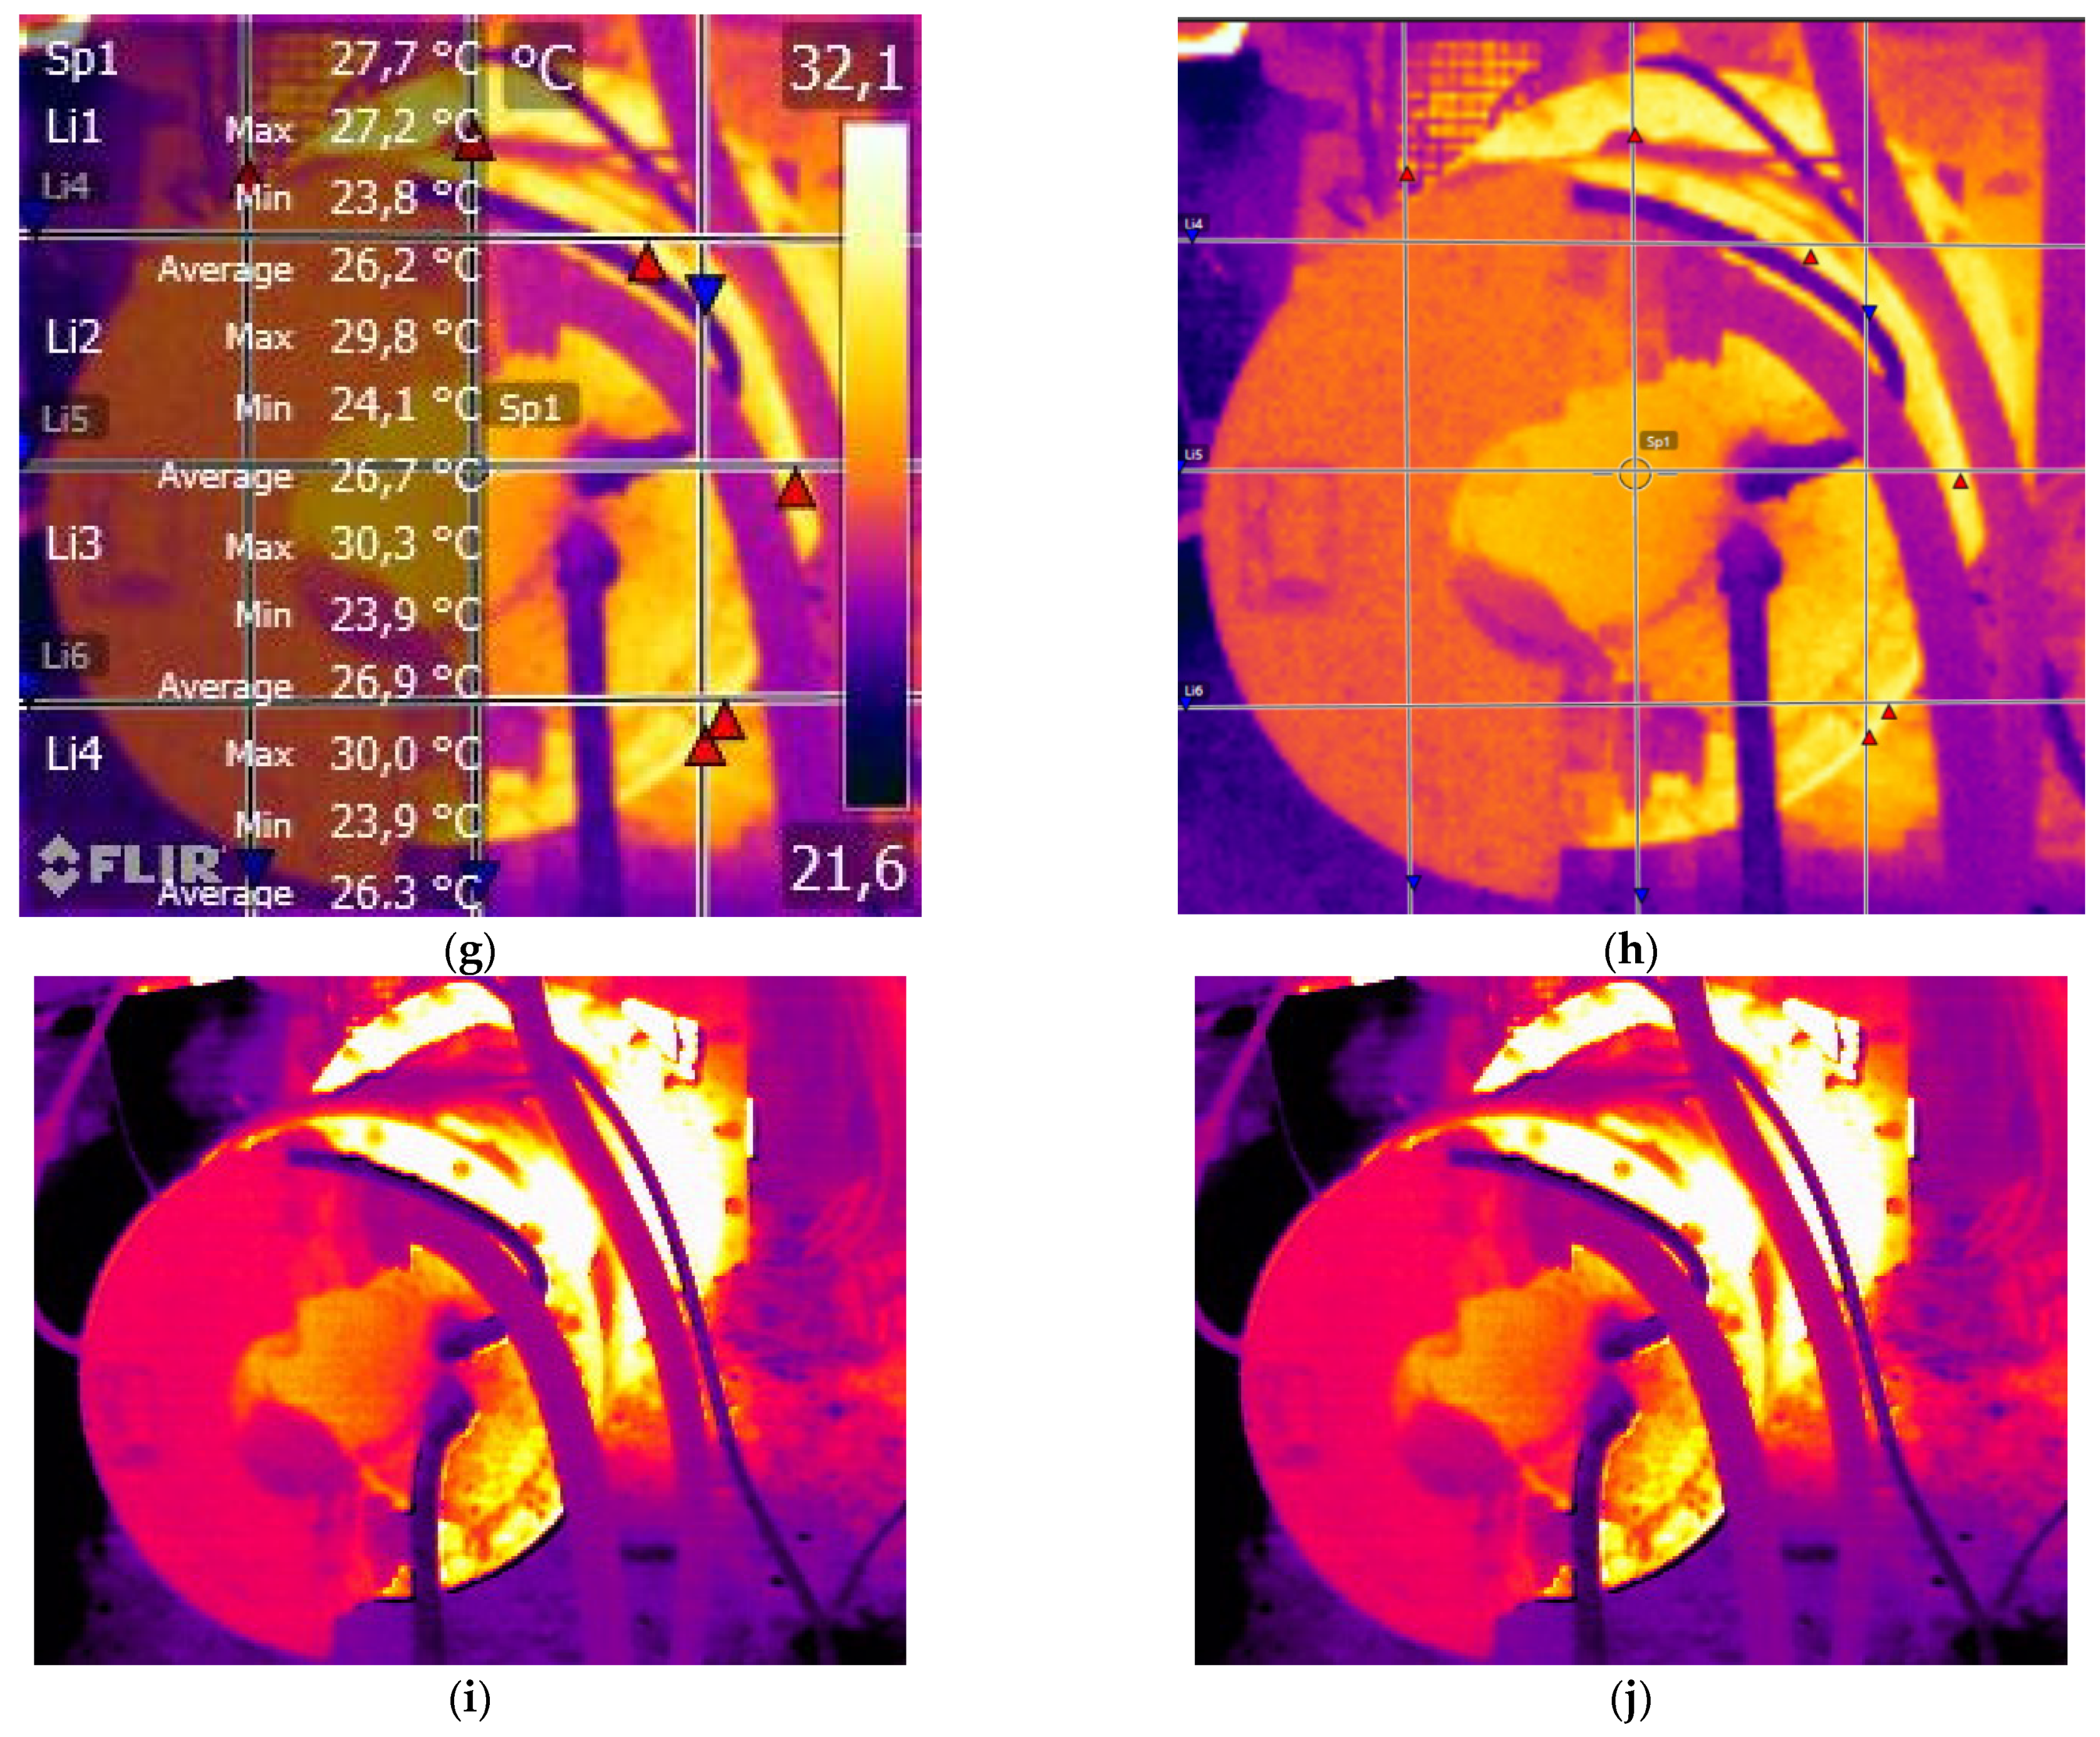
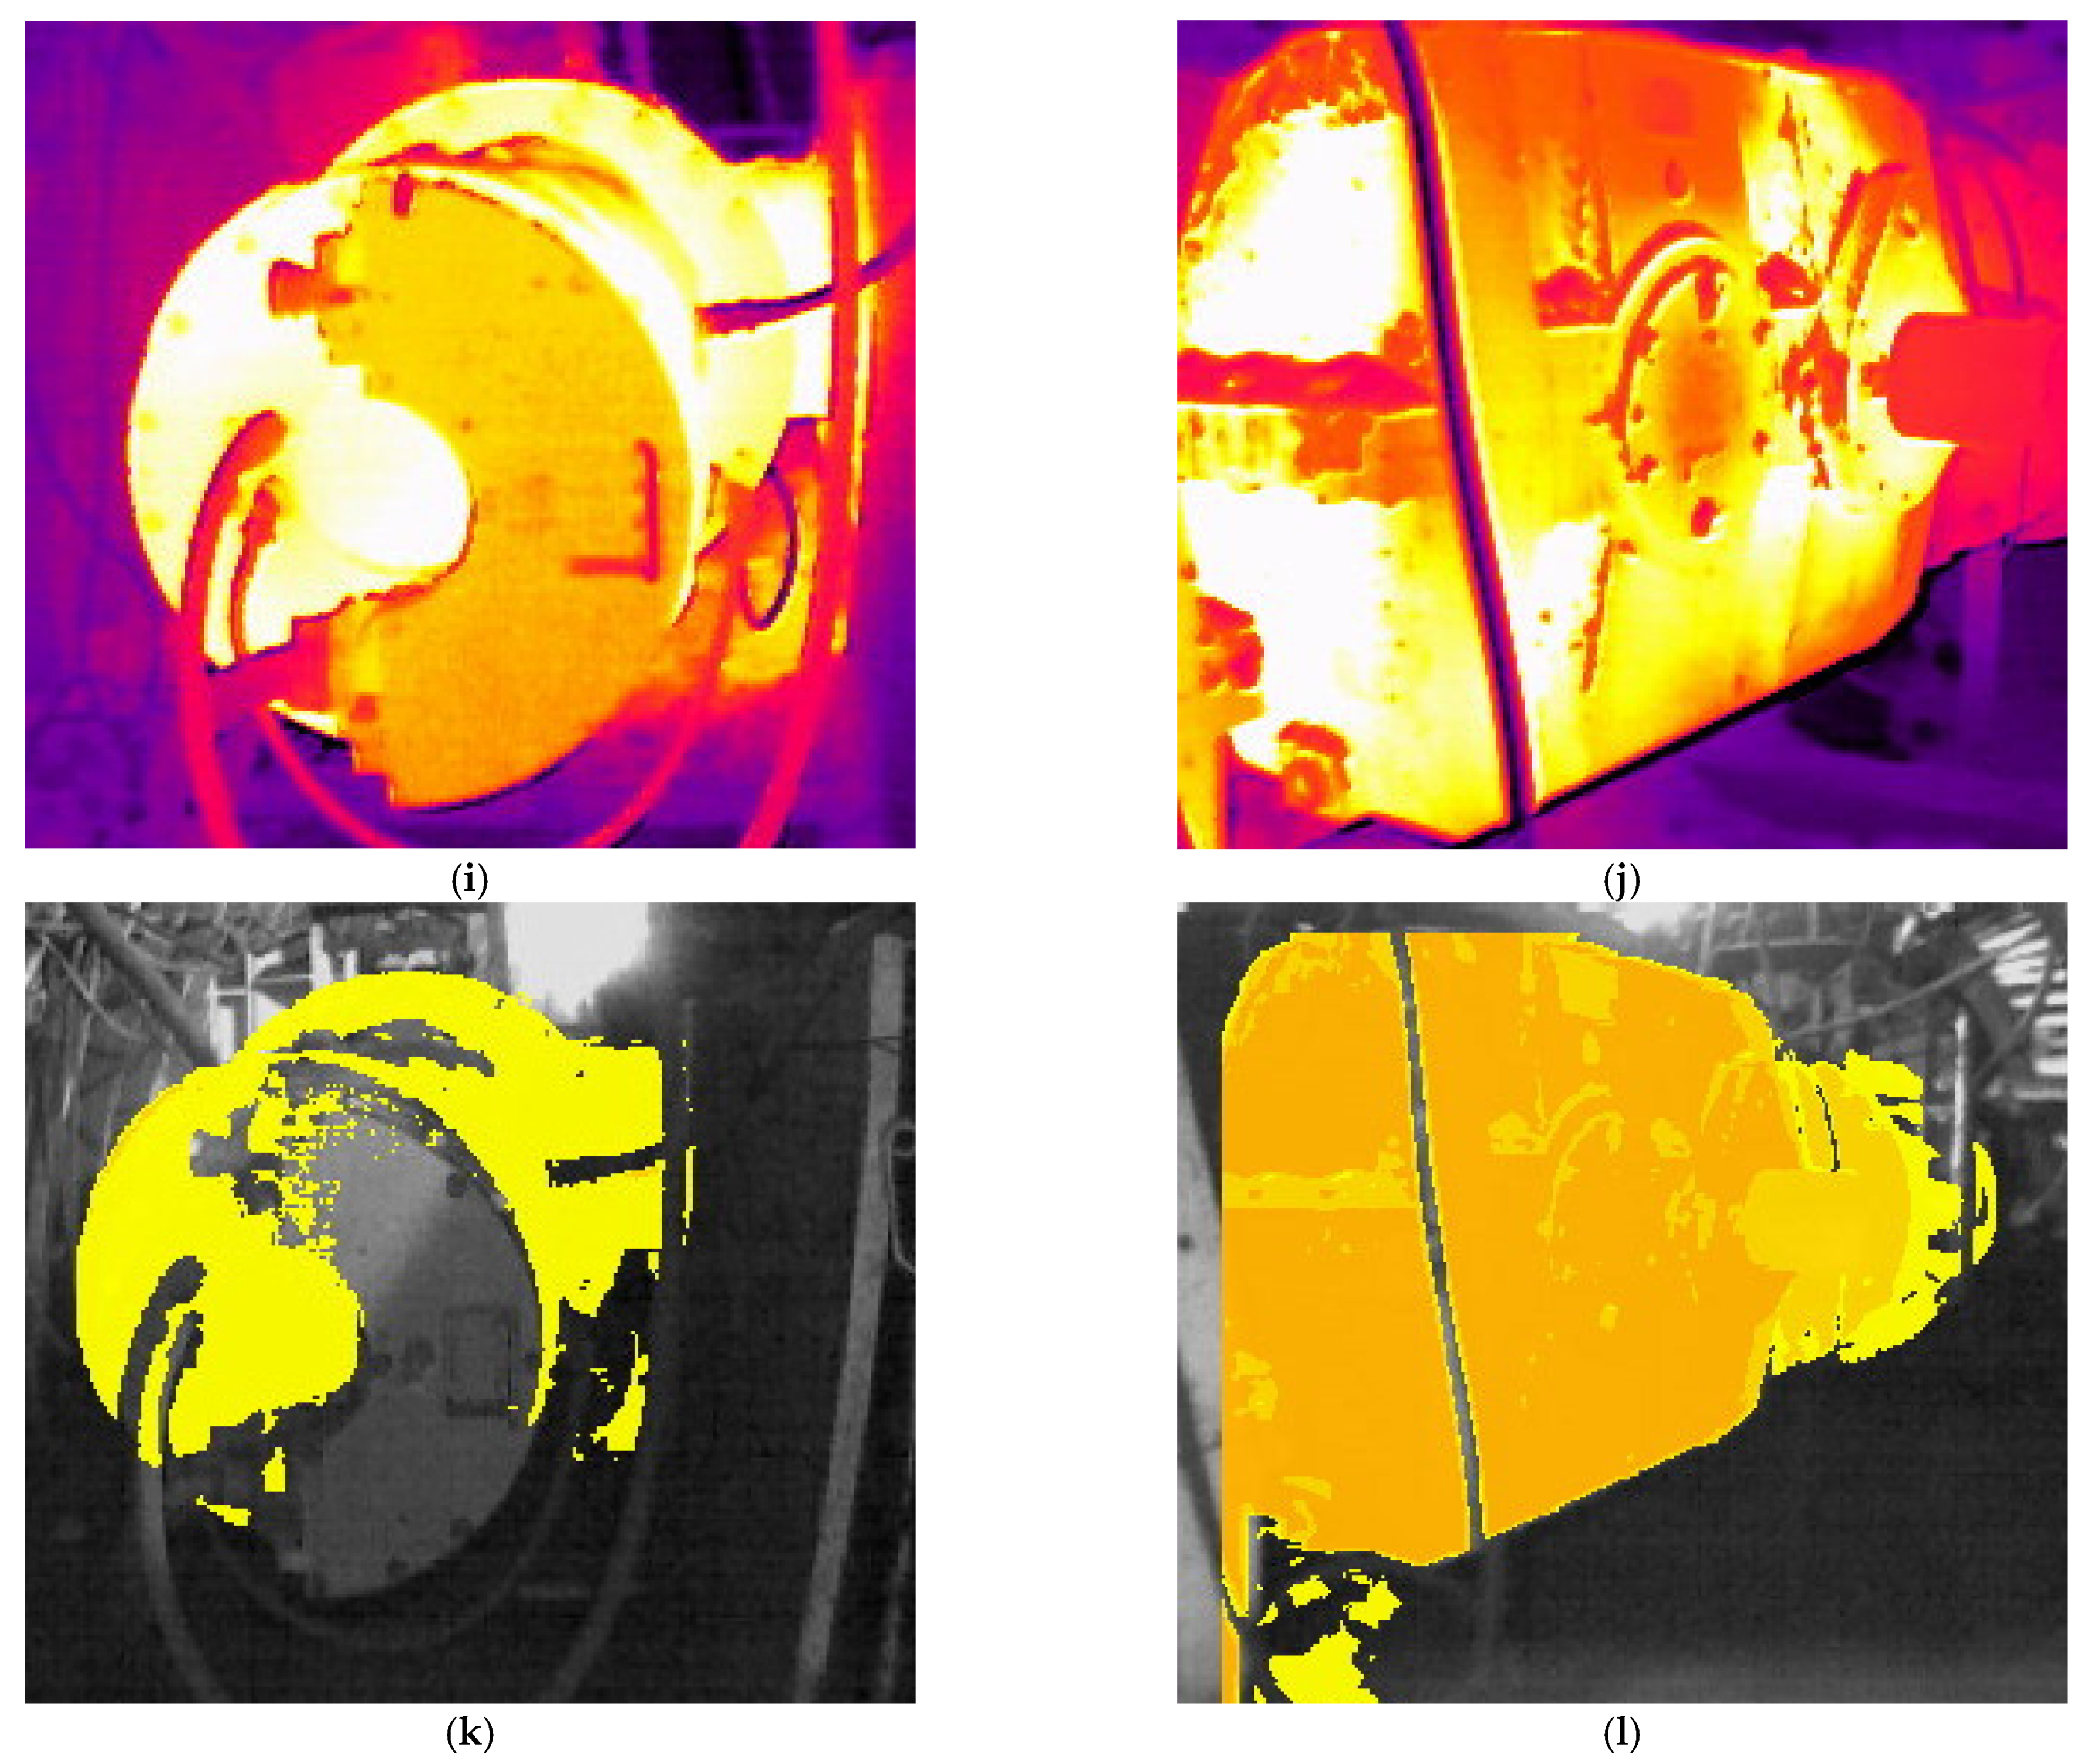
Figure 7.
A view from a measurement session made with a thermal imaging camera together with processing in the software FLIR Tools for (I) a drive unit of a belt conveyor PT-4 from the main haulage analysed, where the heat distribution is presented for: (a) photo of the tested left gearbox (I); (b) thermogram with visible thermal effect for the left gearbox (I); (c,d) thermogram showing heat distribution for the left gearbox (I); (e) photo of the tested left motor (I); (f) thermogram showing heat distribution for the left motor (I); (g,h) thermogram showing the thermal effect for the left motor (I); (i,j) thermogram showing the heat distribution with the Dräger UFC 9000 camera; (k) temperature distribution for the motor in the excavation environment; (l) temperature distribution for the gearbox in the excavation environment.
Figure 8.
Temperature variation over 60 min for gear I of conveyor PT-4.
Figure 8.
Temperature variation over 60 min for gear I of conveyor PT-4.
Figure 9.
Temperature variation over 60 min for gear II of conveyor PT-4.
Figure 9.
Temperature variation over 60 min for gear II of conveyor PT-4.
Figure 10.
Summary of test results obtained for the drive units.
Figure 10.
Summary of test results obtained for the drive units.
Table 1.
Technical parameters of the analysed main haulage system.
Table 1.
Technical parameters of the analysed main haulage system.
| Number of the Conveyor | Type of the Conveyor | Power
(kW) | Belt
Width (m) | Belt
Length (m) | Performance
Maximum (t/h) |
|---|
| PT-1 | Intermet-1200 | 2 × 250 | 1.2 | 480 | 1388 |
| PT-2 | Vacat-1400 | 3 × 315 | 1.4 | 420 | 1512 |
| PT-3 | Intermet-1200 | 2 × 160 | 1.2 | 80 | 1220 |
| PT-4 | Pioma-1200 | 2 × 250 | 1.2 | 140 | 1220 |
| PT-5 | Pioma-1200 | 2 × 250 | 1.2 | 260 | 1134 |
| PT-II | Pioma-1400 | 2 × 250 | 1.4 | 410 | 1500 |
| PT-I | Bogda-1400 | 2 × 132 | 1.4 | 56 | 1500 |
Table 2.
Measuring the running time of the main haulage belt conveyors.
Table 2.
Measuring the running time of the main haulage belt conveyors.
| No. of the Conveyor | Type | Location | Working Time
(min) | Stoppage Duration
(min) |
|---|
| PT-I | 1-400 | Haulage drift/III | 1300 | 140 |
| PT-II | 1-400 | Haulage drift 2, S-type | 1297 | 143 |
| PT-2 | 1-400 | Collective ramp, E-type/III | 698 | 742 |
| PT-1 | 1-200 | Belt gallery 2/III | 916 | 524 |
| PT-3 | 1-200 | Primary gallery/III | 1282 | 158 |
| PT-4 | 1-200 | Drift III east, level 700 | 1290 | 150 |
| PT-5 | 1-200 | Haulage drift 3/III | 1291 | 149 |
Table 3.
Temperature measurement for belt conveyor drive unit PT-4.
Table 3.
Temperature measurement for belt conveyor drive unit PT-4.
| Conveyor’s Drive Unit | Minimum Temperature °C | Maximum Temperature °C | Amplitude Temperature °C |
|---|
| gear I | 46.4 | 51.7 | 5.3 |
| gear II | 47.3 | 52.6 | 5.3 |
| motor I | 24.0 | 28.0 | 4.0 |
| motor II | 25.0 | 30.1 | 5.1 |
| braking system I | 27.2 | 32.0 | 4.8 |
| braking system II | 32.2 | 37.2 | 5.0 |
Table 4.
Data obtained from measurements carried out in the surroundings of the drive unit of the main haulage belt conveyors.
Table 4.
Data obtained from measurements carried out in the surroundings of the drive unit of the main haulage belt conveyors.
| No. of the Conveyor | PT-1 | PT-2 | PT-3 | PT-4 | PT-5 | PT-II | PT-I |
|---|
| Ambient temperature °C | 23.0 | 26.0 | 24.0 | 24.0 | 27.0 | 24.0 | 23 |
| Air temperature °C | 26.6 | 22.4 | 18.6 | 18.2 | 18.8 | 19.2 | 22.4 |
| Reflected temperature °C | 22.0 |
| Air flow (m/s) | 2.27 | 2.93 | 2.20 | 2.20 | 0.44 | 2.53 | 1.04 |
| Air volume in excavation (m3) | 0.47 | 0.78 | 0.64 | 0.64 | 0.11 | 0.67 | 0.16 |
| Humidity (%) | 85 | 77 | 79 | 85 | 80 | 74 | 79 |
| Relative humidity (%) | 50 |
| Vertical distance (m) | 1.0 |
| Emissivity | 0.96 |
| Average temperature rise ∆t | 29.10 | 9.40 | 20.55 | 28.15 | 33.35 | 25.70 | 17.65 |
| Amount of measurements | 42 | 97 | 43 | 52 | 43 | 56 | 79 |
| Publisher’s Note: MDPI stays neutral with regard to jurisdictional claims in published maps and institutional affiliations. |
© 2021 by the authors. Licensee MDPI, Basel, Switzerland. This article is an open access article distributed under the terms and conditions of the Creative Commons Attribution (CC BY) license (https://creativecommons.org/licenses/by/4.0/).


 ,
, 


_Spearing.png)


