Article

Stress Reversals near Hydraulically Fractured Wells Explained with Linear Superposition Method (LSM)

1
Center for Integrative Petroleum Research (CIPR) & Department of Petroleum Engineering, College of Petroleum Engineering and Geosciences (CPG), King Fahd University of Petroleum & Minerals (KFUPM), Dhahran 31261, Saudi Arabia
2
Department of Earth Resources and Environmental Engineering, Hanyang University, Seoul 04763, Korea
*
Author to whom correspondence should be addressed.
Energies 2021, 14(11), 3256; https://doi.org/10.3390/en14113256
Submission received: 22 April 2021 / Revised: 21 May 2021 / Accepted: 25 May 2021 / Published: 2 June 2021
(This article belongs to the Special Issue Modelings and Analysis of Hydraulic Fracturing in Reservoirs)

Abstract

:
Prior studies have noted that the principal stress orientations near the hydraulic fractures of well systems used for energy extraction may wander over time. Typically, the minimum and maximum principal stresses—in the horizontal map view—swap their respective initial directions, due to (1) fracture treatment interventions, and (2) pressure depletion resulting from production. The present analysis shows with stress trajectory visualizations, using a recently developed linear superposition method (LSM), that at least two generations of stress reversals around hydraulic fractures occur. The first generation occurs during the fracture treatment; the second occurs immediately after the onset of so-called flow-back. During each of these stress swaps in the vicinity of the hydraulic fractures, reservoir directions that were previously in compression subsequently exhibit extension, and directions previously stretching subsequently exhibit shortening. The pressure change in the hydraulic fractures—from over-pressured to under-pressured (only held open by proppant packs)—caused the neutral points that separate domains with different stress states to migrate from locations transverse to the fracture to locations beyond the fracture tips. Understanding such detailed geo-mechanical dynamics, related to the pressure evolution in energy reservoirs, is extremely important for improving both the fracture treatment and the well operation, as future hydrocarbon and geothermal energy extraction projects emerge.

1. Introduction

Stress shadowing refers to the occurrence of stress interference by the superposition of strain due to elastic displacements induced by the propagation of multiple hydraulic fractures in the payzone of subsurface energy reservoirs [1]. Hydraulic fluid is pumped down from the wellhead into isolated sections (called fracture stages) of the wellbore that are pressure-isolated by frac plugs [2], and the fractures are initiated from perforations of the wellbore placed in tight clusters at regular intervals (Figure 1a). When the spacing distance between the perforation clusters is further reduced, down to ~3.3 m (10 ft) with the latest state-of-the-art well completion engineering technology, the intensity of mutual stress and strain interference between the individual hydraulic fractures increases [3].
One of the more intriguing aspects of the stress redistribution process related to stress shadowing is that the minimum principal stress direction prior to the fracture treatment may become a maximum principal stress direction during the hydraulic fracture treatment (and vice versa). Such stress reversals have been reported by numerous authors [4,5,6,7,8,9]. Stress redistribution patterns and reversals vary greatly, depending on the native state of stress prior to fracturing, reservoir pressure waxing and waning during and after the fracture treatment, and the selected fracture spacing, as well as on whether fracture stimulation in the stages of adjacent wells occurs simultaneously, sequentially, or alternately [10].
The consequence of stress shadows affects the growth and arrest of inner fractures in the treated stage more than the outer fractures, which may continue to grow, especially near the heel end of the wellbore [11]. Theoretically, to avoid interference with the stress reversal zones of a prior fracture, the perforation spacing needs to be larger than the stress reversal zone width [12]. Even with 183 m (600 ft) fracture spacing, stress reversals may still occur, with neutral stress points building between the fractures. Any new perforations near the midway position of the two prior fractures cannot grow fractures transversely; instead, the later fractures will curve toward one of the earlier, adjacent fractures [10].
Zipper fracture treatment schedules were proposed to create more complex fracture networks [13,14], but these may be hampered by severe stress shadowing [10]. When the fracture spacing is tightened, only outer fracs can propagate relatively unconstrained by stress shadows [15,16]. Narrower fracture spacing (<7.6 m (25 ft)) results in single fractures developing, because the outer fractures coalesce [17].
As fracture treatment moves from the toe to the heel side of the well, the instantaneous shut-in pressure (ISIP) increases from one frac stage to the next [18]. The net pressure required to achieve the same fracture half-length from each subsequent perforation cluster increases with each additional fracture created, as can be inferred from the ISIP escalation. Consequently, the stress reversal zones become wider with each additional consecutive fracture [10,19]. The closure stress ramps up quickly after the first couple of fracture stages, as captured in stress escalation type curves [17]. Furthermore, simultaneous fracturing in the stages remains elusive, because fluid closer to the heel point of the well receives more hydraulic fluid due to viscous dissipation of flow toward the toe. Consequently, heel point fractures in a stage propagate faster, unless the perforation size is adjusted (reduced) to prevent heel bias.
Although the prior studies cited have drawn attention to the phenomenon of stress shadowing, until now, a simple systematic explanation for the mechanism of principal stress reversals has not been developed. This study shows, using a series of closed-form models based on the linear superposition method (LSM) first introduced by Weijermars et al. [20], how systematic changes in the principal stress trajectory patterns occur. In addition, what has not been recognized before is that, in addition to the first generation of stress reversals occurring when the fracture treatment pressure is initially elevated, a second generation of stress reversals occurs during flow-back and production-related pressure depletion, as explained later in this study.
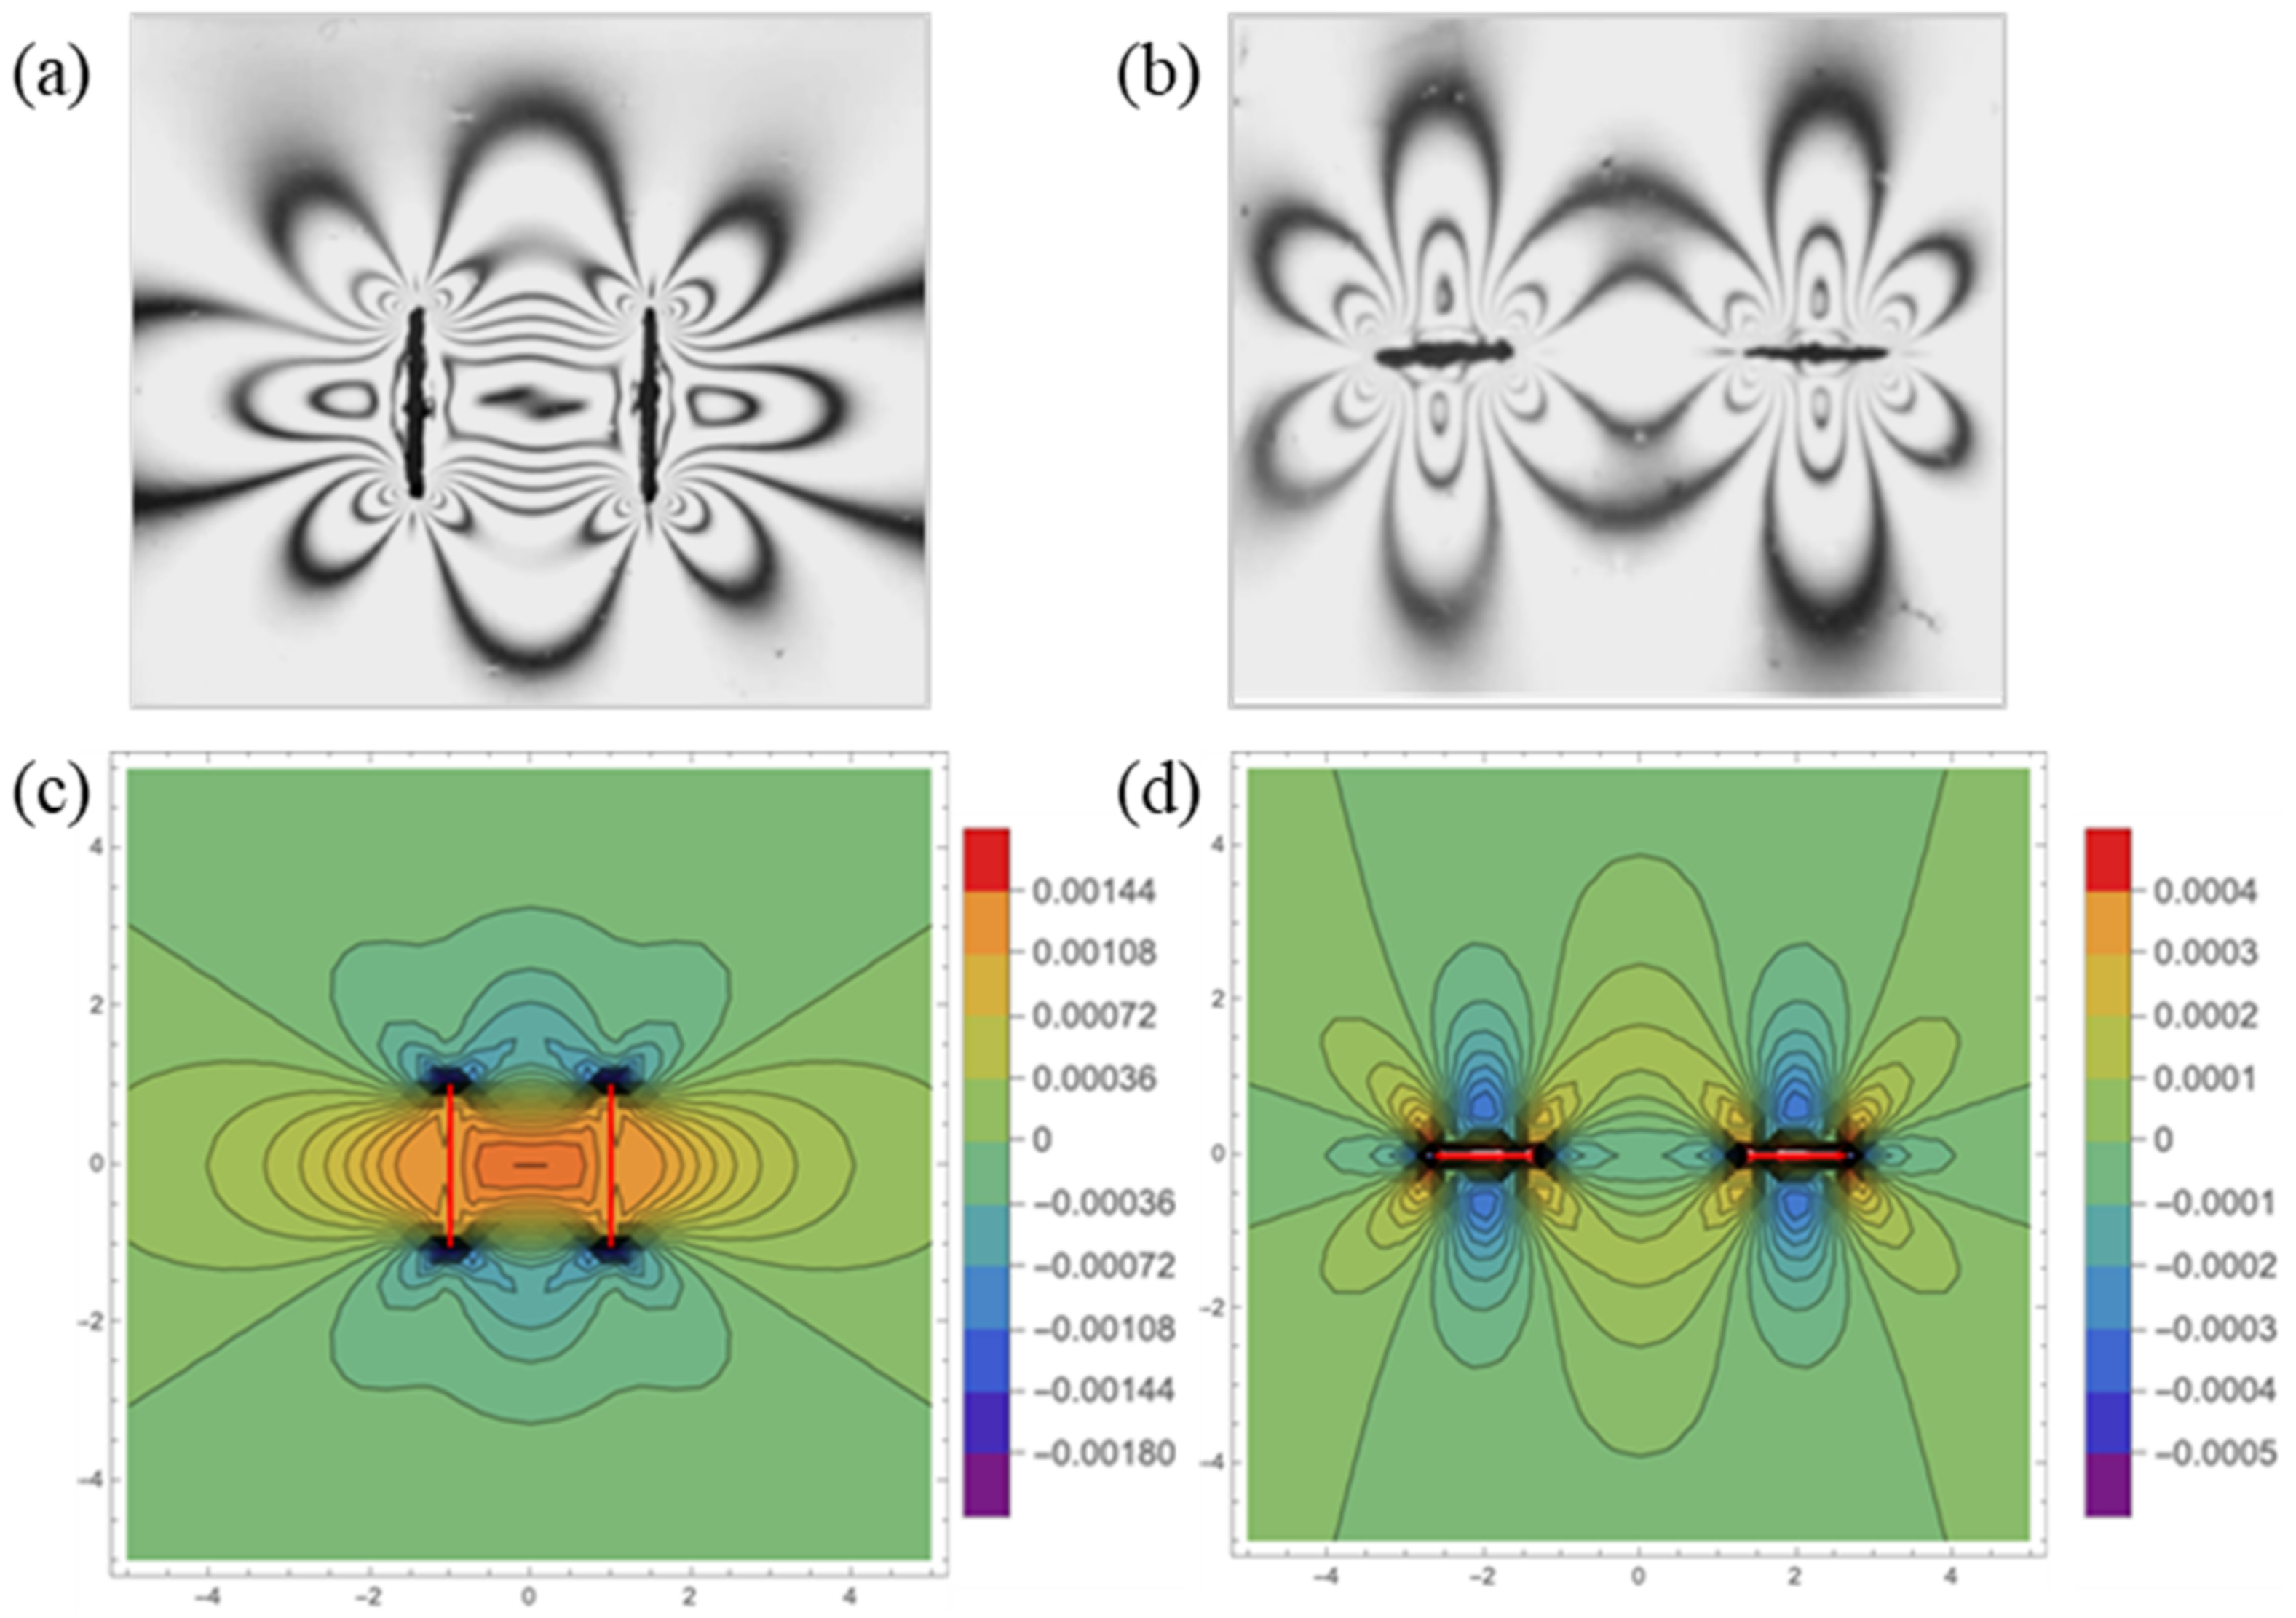
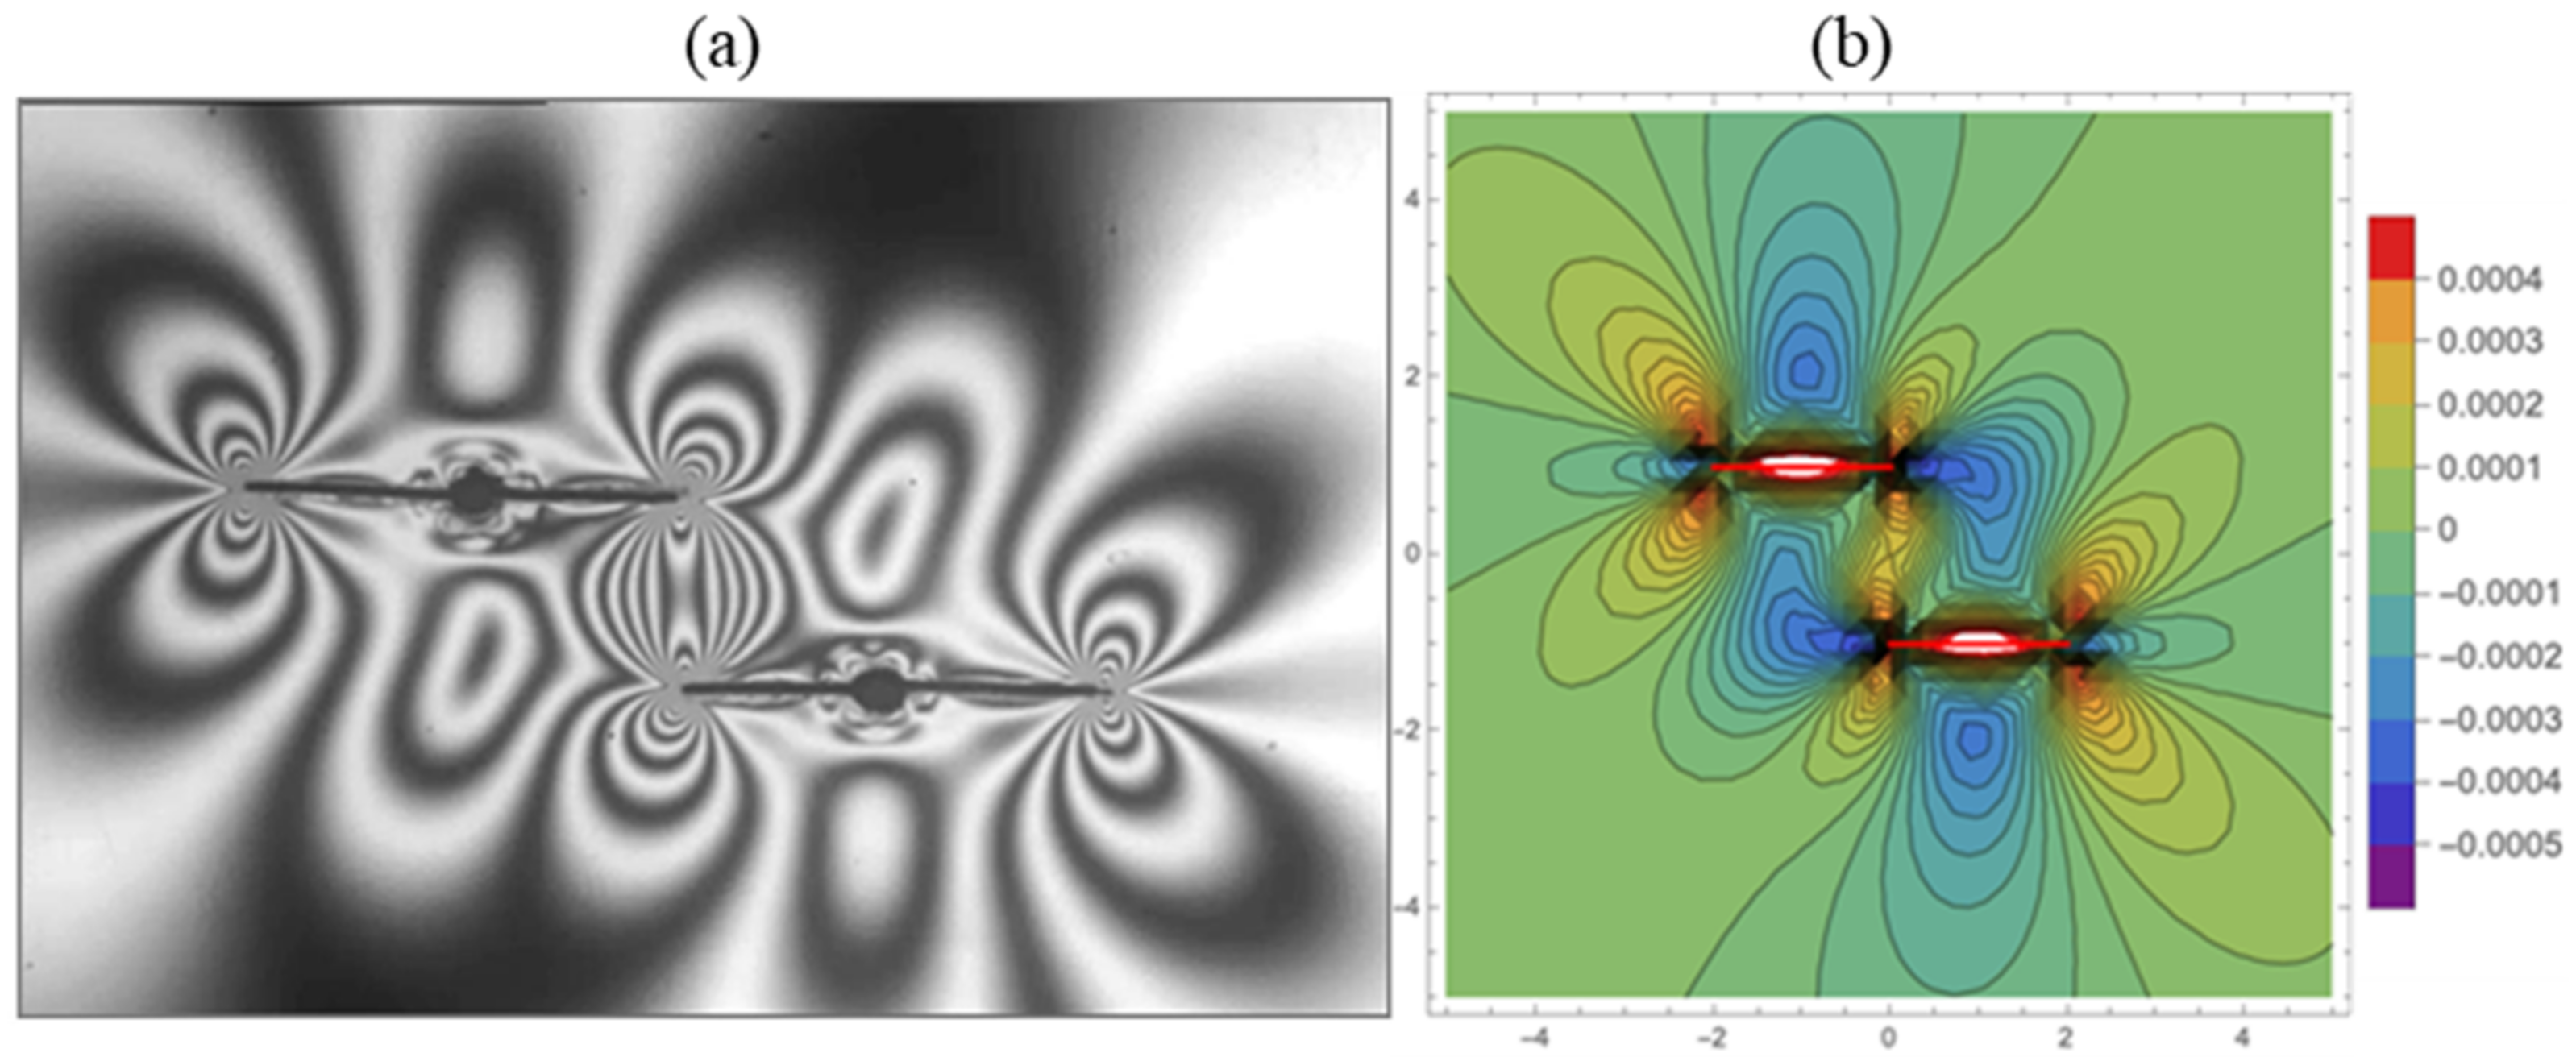
One important initial condition at the start of a fracture treatment operation is that the horizontal lateral of the well is commonly oriented in the direction of the least principal stress of the geological basin (Figure 1b). Moreover, the maximum principal stress direction in the horizontal plane is assumed transverse to the well. These base-case orientations of the principal stresses are then subsequently modified when hydraulic fractures are placed transverse to the wellbore. All stress and strain visualizations in this paper show map views of the tensor fields around the vertical hydraulic fractures at the level of the model reservoir. Wellbores are not drawn but are consistently assumed to be present (as delivery means of the fracture treatment pressures) in a direction orthogonal to the hydraulic fractures. For example, Figure 2c shows two simultaneous hydraulic fractures in a wellbore at y = 0; Figure 2d assumes two parallel wellbores, one at x = −2 and one at x = +2. Figure 3b also assumes two parallel wellbores, one at x = −2 and one at x = +2.

2. Methodology

This section explains the tools and methods used in the modeling approach. First, we explain the merits of the linear superposition method (Section 2.1) and stress trajectory visualization (Section 2.2). Then, we proceed, in the subsequent subsections (Section 2.3, Section 2.4, Section 2.5 and Section 2.6), to explain how to compute and conceptually treat the stress states and pressure changes associated with the various phases of fracture treatment intervention (fluid injection, leak-off, and flow-back) and production-induced pressure changes. Once those computational elements are in place, we proceed in Section 3 to show—for each phase of pressure change—the effect on the principal stress trajectories, and how stress reversals occur due to the interaction of the deviatoric stresses and the changes in the reservoir pressure.

2.1. Linear Superposition Method (LSM)

The method of solution applied here is based on the linear superposition method (LSM) [20]. For example, LSM can quantify the displacement field around multiple hydraulic fractures [15], using transforms of the analytical expressions by Sneddon [22] (see Section 2.4). The resulting displacement field can be computed by simple vector field addition, and then a suitable constitutive equation can quantify the strain and stress contours for specific elastic properties involved. For example, Figure 2a–d show the strain concentrations near the tips of a pair of fractures (transverse and parallel aligned) from a photo-elastic study (Figure 2a,b) that were closely matched with analytical LSM solutions (Figure 2b,c). The case of Figure 2a,c applies to a single well in the x-direction at y = 0 with transversely placed hydraulic fractures in the y-direction. The case of Figure 2b,d applies to two parallel wells in the y-direction at x = −2 and x = +2, each with single transverse fractures in stages that are mutually aligned.
Another example, first given here, focuses on the isochromatic fringe patterns visualized photo-elastically for a staggered pair of fractures (Figure 3a) subject to a far-field stretch in a direction normal to the fracture planes, which is dynamically equivalent to the case of a pressured fracture [23,24]. The fringe pattern of Figure 3a can be closely matched by an LSM solution (Figure 3b), using the approach explained in Pham and Weijermars [15]. The case of Figure 3a,b applies to two wellbores in the y-direction, one at x = −2 and one at x = +2, with staggered transverse fractures, such as those used in modified zipper fracking schedules [16]. The full set of required equations is given later in the present paper.

2.2. Principal Stress Trajectories

A new step added to our code is the mapping of the principal stress trajectory patterns. Such trajectories are everywhere tangential—in each point of the studied elastic continuum containing the fractures—to the direction of the two principal stress axes.
α 1 = 1 2 arctan 2 σ x y σ x x σ y y .
α 2 = 1 2 arctan 2 σ x y σ x x σ y y + π 2 .
The angles α 1 and α 2 refer to the positive angle between the X-axis and the direction of each of the principal stress axes ( σ 1 , σ 2 , σ 3 ), while the required inputs, σ x x , σ y y , and σ x y , for Equations (1a) and (1b), represent the magnitude of the stress tensor components in the 2D Cartesian solution space, as can be computed throughout the fractured medium using the expressions given in Section 2.3 and Section 2.4.
Examples of the stress trajectory patterns for each of the cases in Figure 2a,b and Figure 3 are given in Figure 4a–c. The trajectories stay parallel and perpendicular to the pressurized fractures, as long as the fracture inner walls remain separated, such that no shear due to friction between the walls may occur. If a shear component appears in the LSM solution, such a local shear may be subtracted by applying an interval vortex corresponding to the amount of shear displacement that needs to be removed. No such correction was necessary in the stress trajectory examples of Figure 4a–c.
The stress trajectory patterns around the pairs of hydraulic fractures, each loaded with the same internal fluid pressures (Figure 4a–c), do not change when the magnitude of the pressures in the two fractures are either increased or decreased at the same rate. However, when individual fractures are loaded with different internal pressures, the stress trajectory patterns shift as can be visualized with LSM; however, this is of less interest for the present study because, at a certain depth in a fractured reservoir, all fractures are likely loaded by similar net pressures, which may indeed vary over time.
In the next subsections, we first explain how we compute, in the LSM models, (1) the initial reservoir pressure (Section 2.3), (2) the pressure change during the fracture treatment (Section 2.4), (3) the pressure change during leak-off and flow-back (Section 2.5), and (4) production-induced pressure changes (Section 2.6). Once those computational elements are in place, we proceed in Section 3 to show—for each phase of pressure change—the effect on the principal stress trajectories, and how stress reversals occur due to the interaction of the deviatoric stresses and the changes in the reservoir pressure. It is important to understand from the outset that the fluid pressures in the hydraulic fractures and the reservoir pore space are scalar quantities, in contrast to the deviatoric stresses, which are tensor quantities that need to be computed by different means at each step of the analysis, as detailed below.

2.3. Computing Initial Stress State and Reservoir Pressure

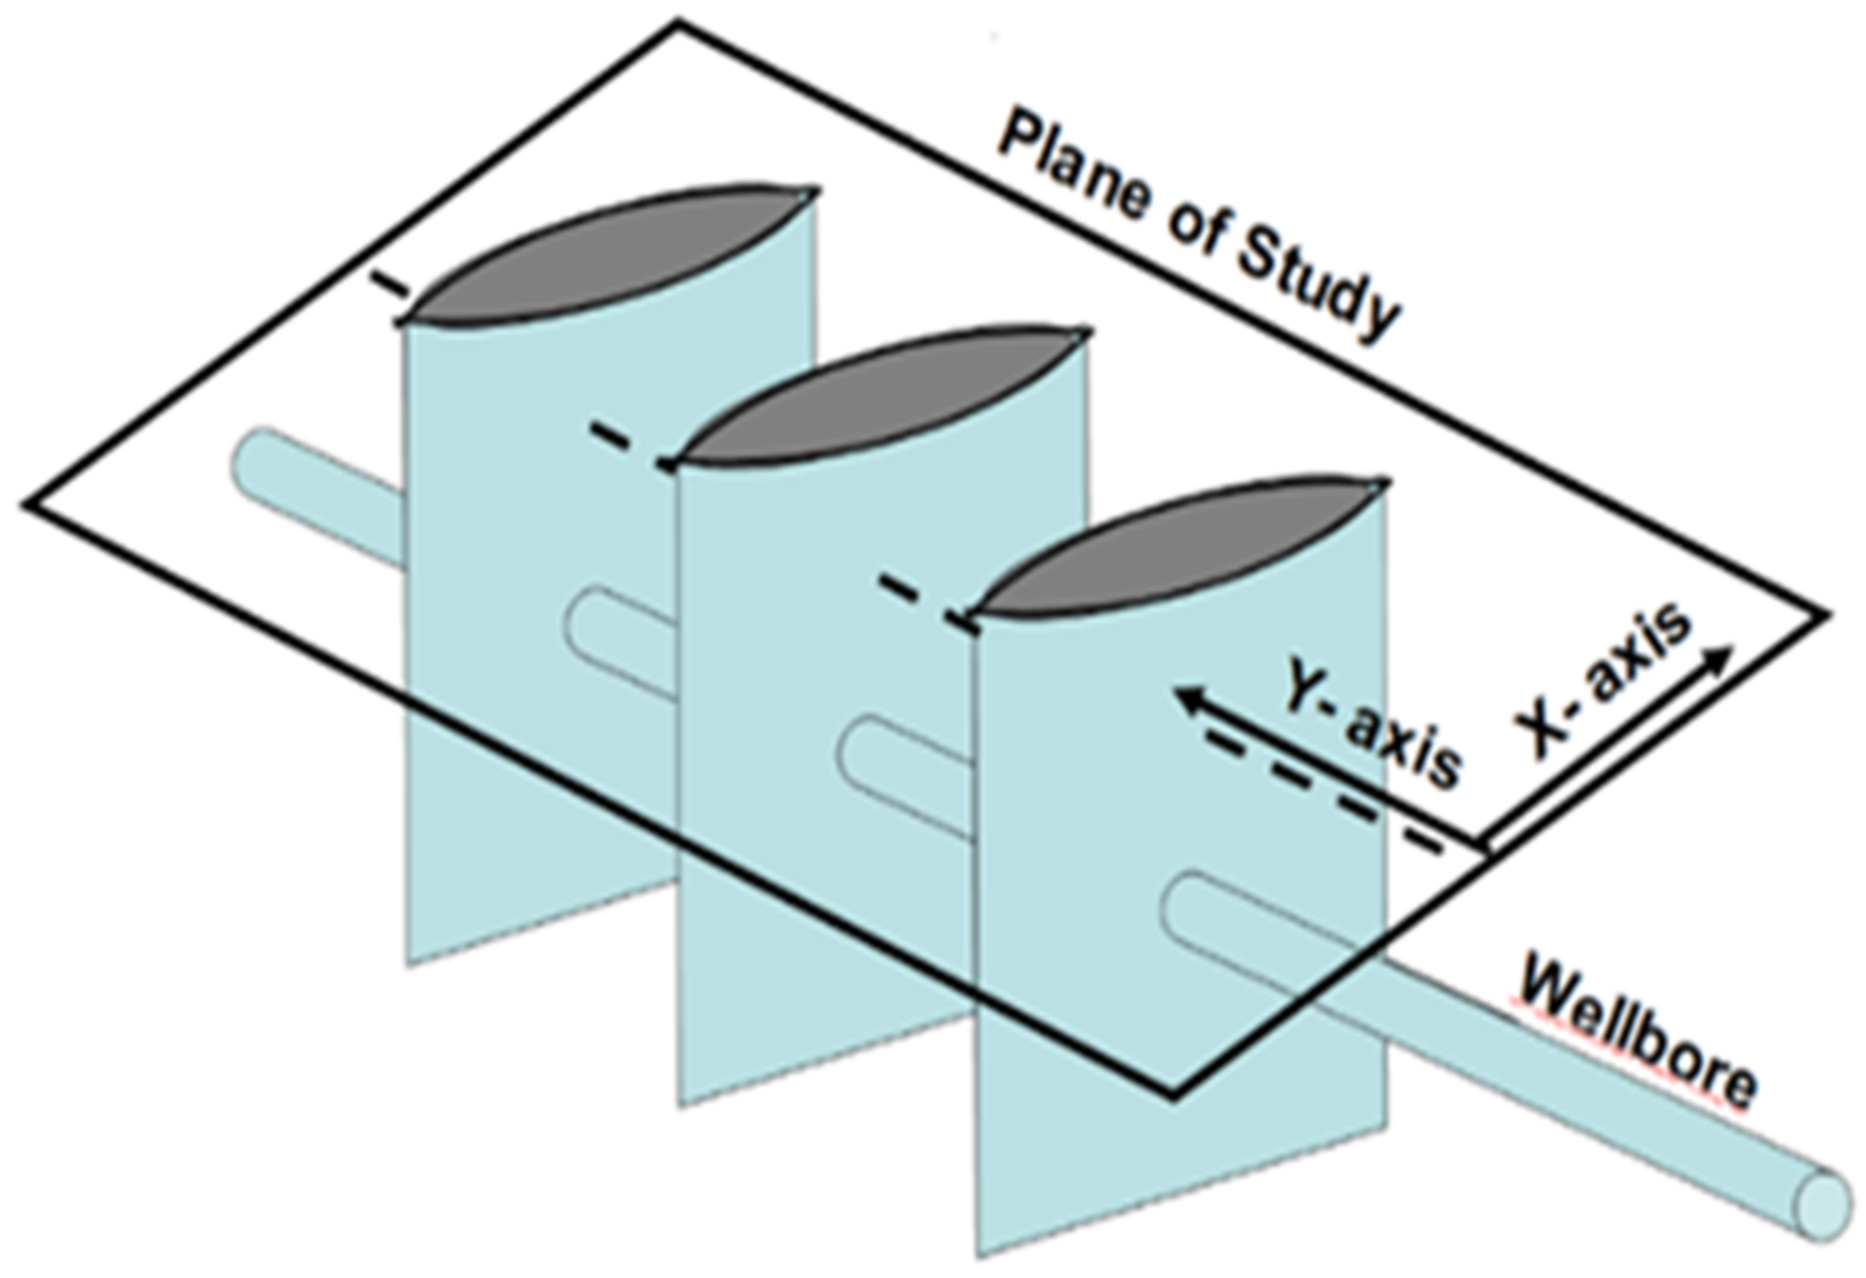
Our analysis assumes a plane strain boundary condition, which essentially renders the solution space 2D, coinciding with a horizontal plane in the target zone (Figure 2), whereas the state of stress is evaluated in 3D. The initial tectonic stress state in the reservoir in geomechanics literature is typically given as stress gradients, σ v , σ H , and σ h , as summarized in Table 1 for a typical Andersonian case of strike slip. By choosing the reference frame for Cartesian coordinates parallel to the principal native stresses ( σ x , σ y , and σ z ), their values near the hydraulically fractured wellbore (Figure 5) follow from the product of the near-wellbore depth studied and each of the stress gradients as given in Table 2. It is also practical to align the Y-axis with the wellbore, as shown in Figure 5.
The Sneddon solution, used as a starting point for modeling the state of stress around multiple hydraulic fractures [15,16], assumes a plane strain boundary condition ( ε z z = ε x z = ε y z = 0 ). A constitutive equation for isotropic linear elasticity quantifies the strain response to the applied stress, which, for the 2D case of plane strain, reduces to just three relevant strain gradient tensor components:
ε x x = 1 2 G [ σ x x ( 1 ν ) σ y y ν ] ,
ε y y = 1 2 G [ σ y y ( 1 ν ) σ x x ν ] ,
ε x y = 1 2 G σ x y .
The required input values for σ x x and σ y y in Equations (2a)–(2c) are given in Table 1. The displacements in the X-, Y-, and Z-directions of every point of the elastic continuum now follow from the 2D strain tensor elements [26].
u x = u x x x x = ε x x x ,
u y = u y y y y = ε y y y ,
u z = u z z z z = ε z z z .
The initial reservoir pressure is commonly specified as a pressure gradient. If equal to the pressure of a native water column connected all the way up to the surface, the formation pressure, Pf, is given by the product of the hydrostatic gradient, P , and depth, i.e., Pf = z P . However, if the reservoir is sealed off from the surface by the overlying strata, the burial history and tectonic stress today cause volumetric deformation of the pore space, whose pressure component is included in the information derived from geotechnical wireline logs. The initial reservoir pressure may vary and is generally classified as normally pressured (Pf = z P ), over-pressured (z P > Pf), or under-pressured (z P < Pf).

2.4. Computing Impact of Fracture Treatment on Stress State and Reservoir Pressure

The pressure load on the hydraulic fractures is assumed equal to the minimum horizontal stress. The displacement field due to fracture treatment of n fractures can be found using the Cartesian transform of the Sneddon equation [15].
u x = i = 1 n p 0 . i ( 1 ν ) E ( 1 2 ν ) r 1 , i r 2 , i cos θ 1 , i + θ 2 , i 2 r i cos θ i r i 2 r 1 , i r 2 , i sin θ i sin θ i θ 1 , i + θ 2 , i 2 ,
u y = i = 1 n p 0 . i ( 1 ν ) E ( 1 2 ν ) r 1 , i r 2 , i sin θ 1 , i + θ 2 , i 2 r i sin θ i + r i sin θ i 1 r i 2 r 1 , i r 2 , i cos θ i θ 1 , i + θ 2 , i 2 .
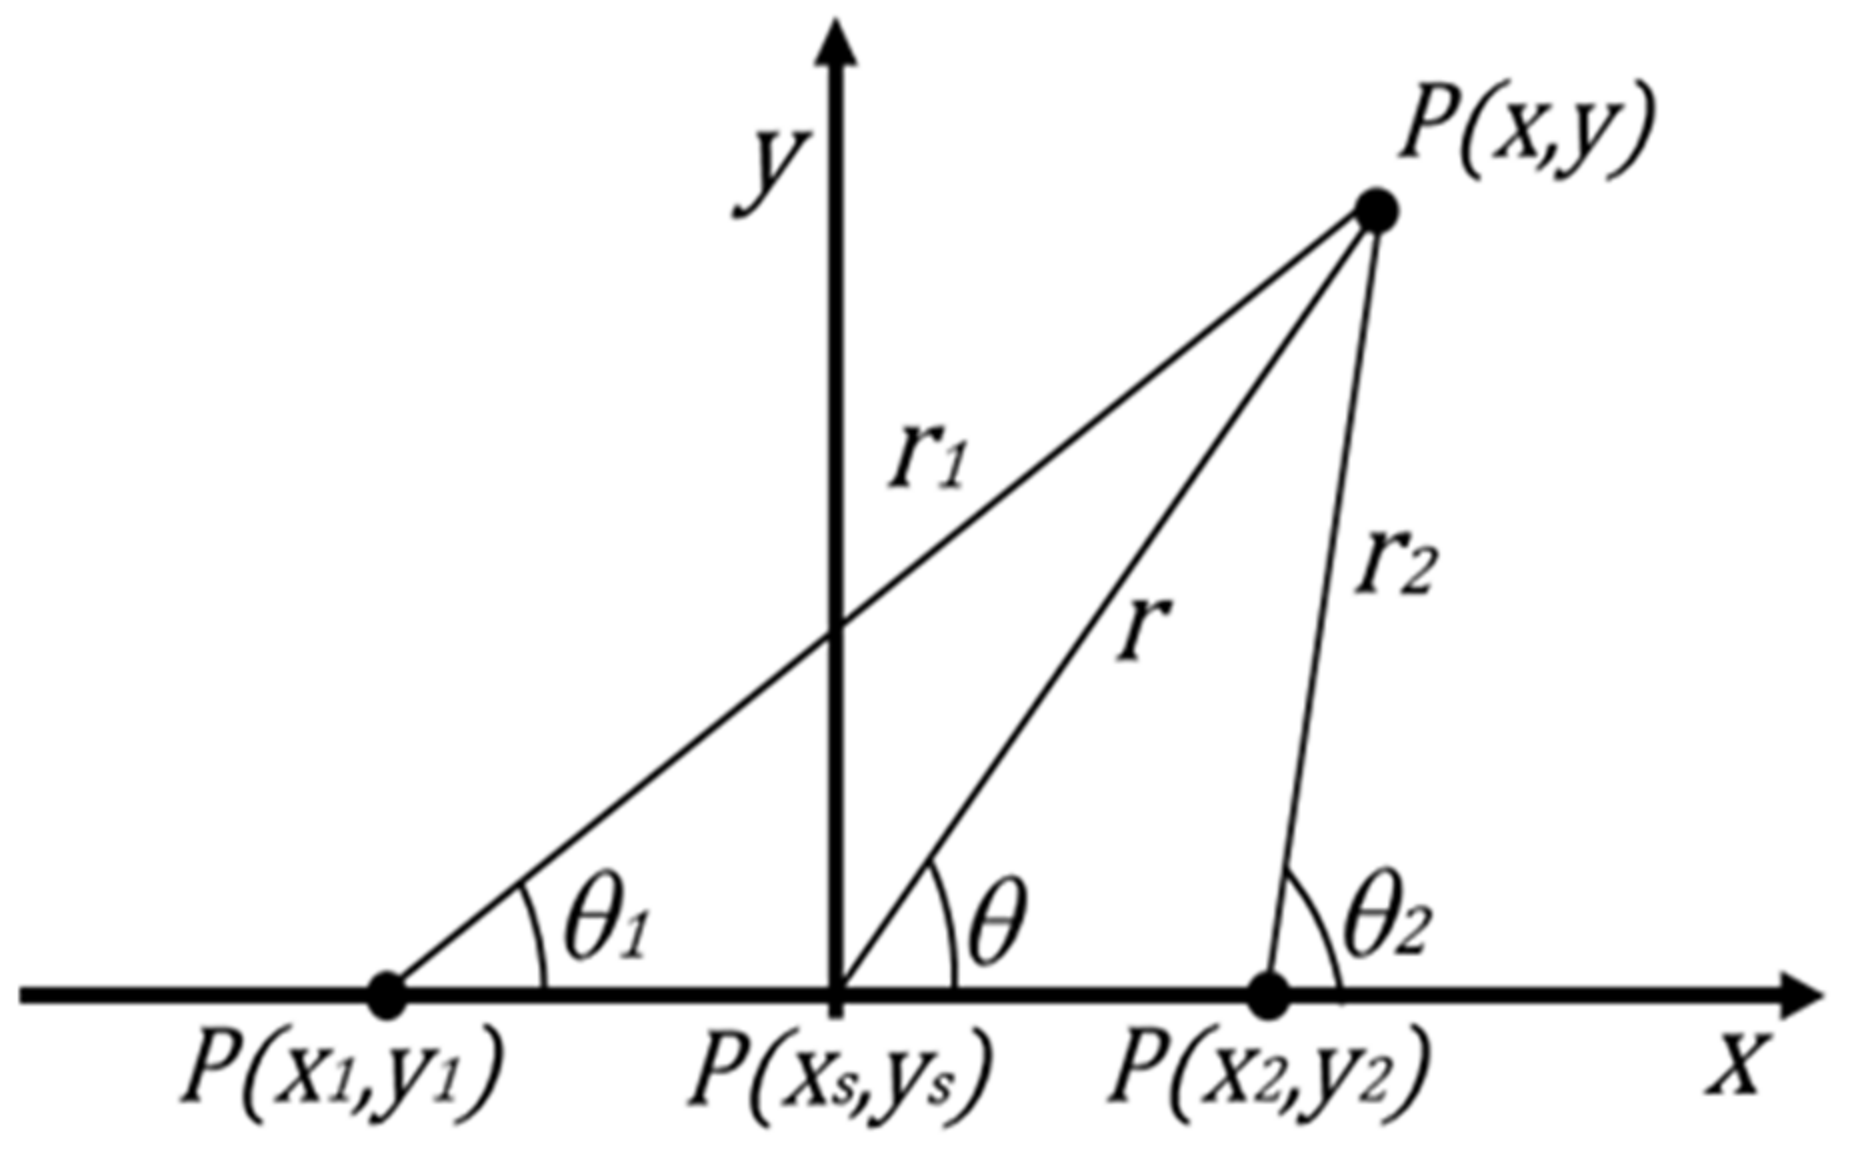
Direct inputs needed are, for each fracture i, the hydraulic net pressure, P0, the position vectors, r, r1, and r2 for the center and tips of each fracture, and their orientations, θ, θ1, and θ2 (see Figure 6). The hydraulic net pressure, P0, is the load on the hydraulic fractures due to the compressors injecting the frack fluid, net of the leak-off.
For a fracture centered at an arbitrary point, P(xs, ys)—rather than at the origin—and a fracture half-length of xf, the appropriate transformation of coordinates is as follows:
x 1 = x s x f ; y 1 = y s ,
x 2 = x s + x f ; y 2 = y s ,
x N E W = x x s ,
y N E W = y y s ,
where (xNEW, yNEW) are in the new coordinate system used for all calculations. The following equations can be derived for θ, θ1, θ2, r, r1, and r2 (Figure 6) to describe the polar angles of the intended fracture in Cartesian coordinates:
θ = arctan y y s x x s ,
θ 1 = arctan y y 1 x x 1 ,
θ 2 = arctan y y 2 x x 2 ,
r = ( x x s ) 2 + ( y y s ) 2 ,
r 1 = ( x x 1 ) 2 + ( y y 1 ) 2 ,
r 2 = ( x x 2 ) 2 + ( y y 2 ) 2 .
The atan function is the four-quadrant inverse tangent of its variables. This would mean that all θ, θ1, and θ2 are positive values.
The basic equations required to compute the elastic displacements associated with the native state of stress and the superposed elastic displacement field due to the pressure-loading by hydraulically pumping fluid into the three hydraulic fractures of interest are now specified. The initial reservoir pressure is not significantly or directly affected by the injected fluid pressure, but by the elastic response of the host rock creates stresses that can be computed from Sneddon-based displacement equations (Equations (4a) and (4b)). The total fracture treatment stresses have a deviatoric component and a pressure component. Translation of displacement gradients to stresses occurs via a constitutive equation, assuming linear elasticity (see Appendix A in [20]).

2.5. Computing Impact of Leak-Off and Flow-Back on Stress State and Pressure Changes

The excess net pressure on the hydraulic fracture walls from the mixture of frack fluid and proppants pumped into the stage, typically over a period of 30 min, falls off almost immediately after the compressor stops pumping fluid. The positive pressure gradient of the hydraulic fracture system, during hydraulic-fluid injection, becomes—during flow-back of the injection fluid—a negative pressure gradient, as required to maintain flow toward the wellhead in the production system. Leak-off is then allowed to occur, while the subsequent stages are pumped with fluid down the liner of the well. After about 2 weeks, all stages in the well will have been completed, and a period of flowback commences in the well system. Note that flowback may only occur when the pressure gradient in the production system of the hydraulically fractured well flips from positive—during the treatment of the stages—to negative at the onset of flowback. The initial production rate also briefly flows faster than the rate that would have occurred due to the initial reservoir pressure, prior to the fracture treatment.

2.6. Computing Impact of Pressure Depletion during Production

The production of fluid from the reservoir lowers the initial reservoir pressure as controlled by the well system (choke setting, pump, and diameter of production tubing). The production-induced pressure changes in the reservoir can be computed from a reservoir simulator or analytical well testing expressions; alternatively, they can be empirically based on changes in the wellhead pressure measured by the production system.

3. Results

In this section, LSM model results are presented to explain and illustrate with principal stress trajectories how stress reversals occur due to the interaction of the deviatoric stresses and the changes in the reservoir pressure during the fracture treatment phases of (a) fluid injection (Section 3.1), (b) leak-off and flow-back (Section 3.2), and (c) production (Section 3.3).

3.1. Fracture Treatment-Induced Stress Changes

In reservoirs, where the wells to be completed are not subject to any tectonic stress anisotropy prior to the fracture treatment operation, the state of stress—due to the injection of frac fluid—can be computed from the elastic displacement field Equations (4a) and (4b), adopting certain elastic constants. Examples of the pertinent stress trajectory patterns for such cases were given in Figure 4a–c. However, if elastic displacements pre-exist in the reservoir, due to the presence of a native tectonic stress anisotropy (Equations (3a)–(3d)), then the pre-existing stress state will be overprinted by the elastic displacement field of the fracture treatment operation (Equations (4a) and (4b)). For such cases, diagnostic stress trajectory patterns will develop, from which the occurrence of stress reversals immediately becomes apparent.
Figure 7a shows a typical example of the initial uniform stress state, using the parameters of Table 1. The stress trajectories form a rectangular grid, with the maximum principal stress in the horizontal direction parallel to the x-axis. For hydraulic fracturing, the well would be drilled at x = 0 in the y-direction, which is the minimum horizontal stress direction in map view. Figure 7b gives the pertinent stress trajectory pattern resulting from the fracture treatment around a single stage with two transverse hydraulic fractures. We now see that the direction orthogonal to the hydraulic fractures is in compression (Figure 7b), which is a stress reversal as compared to the local stress state prior to the fracture treatment (Figure 7a). Outside the region occupied by the hydraulic fractures, the stress reverts to the original tension in the y-direction. The stress reversal occurs in a so-called neutral point (Figure 7b).
The position of the neutral points changes with the relative magnitudes of the stress anisotropy and the net pressure on the fractures. A so-called stress cage forms around the hydraulic fractures (Figure 7c), similar to what has been documented extensively in prior studies for over-pressured wellbores [27,28,29]. Inside the elliptical stress cage zone, the largest principal stresses (compressive, blue trajectories) are in orientations transverse to the hydraulic fractures, whose direction was previously aligned with the minimum principal stress direction of tension. The position of the neutral points and the size of the stress cage domain vary with the relative magnitude of the far-field stress and the pressure load of the hydraulic fractures. For boreholes, the migration pattern of the neutral points can be systematically mapped using two qualifying parameters, the Frac number and a biaxial stress factor [28]. Here, we suffice with giving examples for an active injection case (Figure 7c), which has a lower injection pressure than used in Figure 7b. With the impact of the elastic displacements due to the fracture treatment in Figure 7c being weaker than in Figure 7b, the neutral points occur closer to the hydraulic fractures. The stress cage domain in Figure 7c is smaller than that in Figure 7b, which corresponds to what has been documented for boreholes in the studies cited.
Figure 7d gives a profile along the line through y = 0 for the case of Figure 7c, restricted to the positive part of the Y-axis. The three neutral points, marked by red dots in Figure 7c, correspond to the crossing points seen in Figure 7d. In these points, only a pressure (and no stress anisotropy) exists.

3.2. Leak-Off- and Flow-Back-Induced Stress Changes

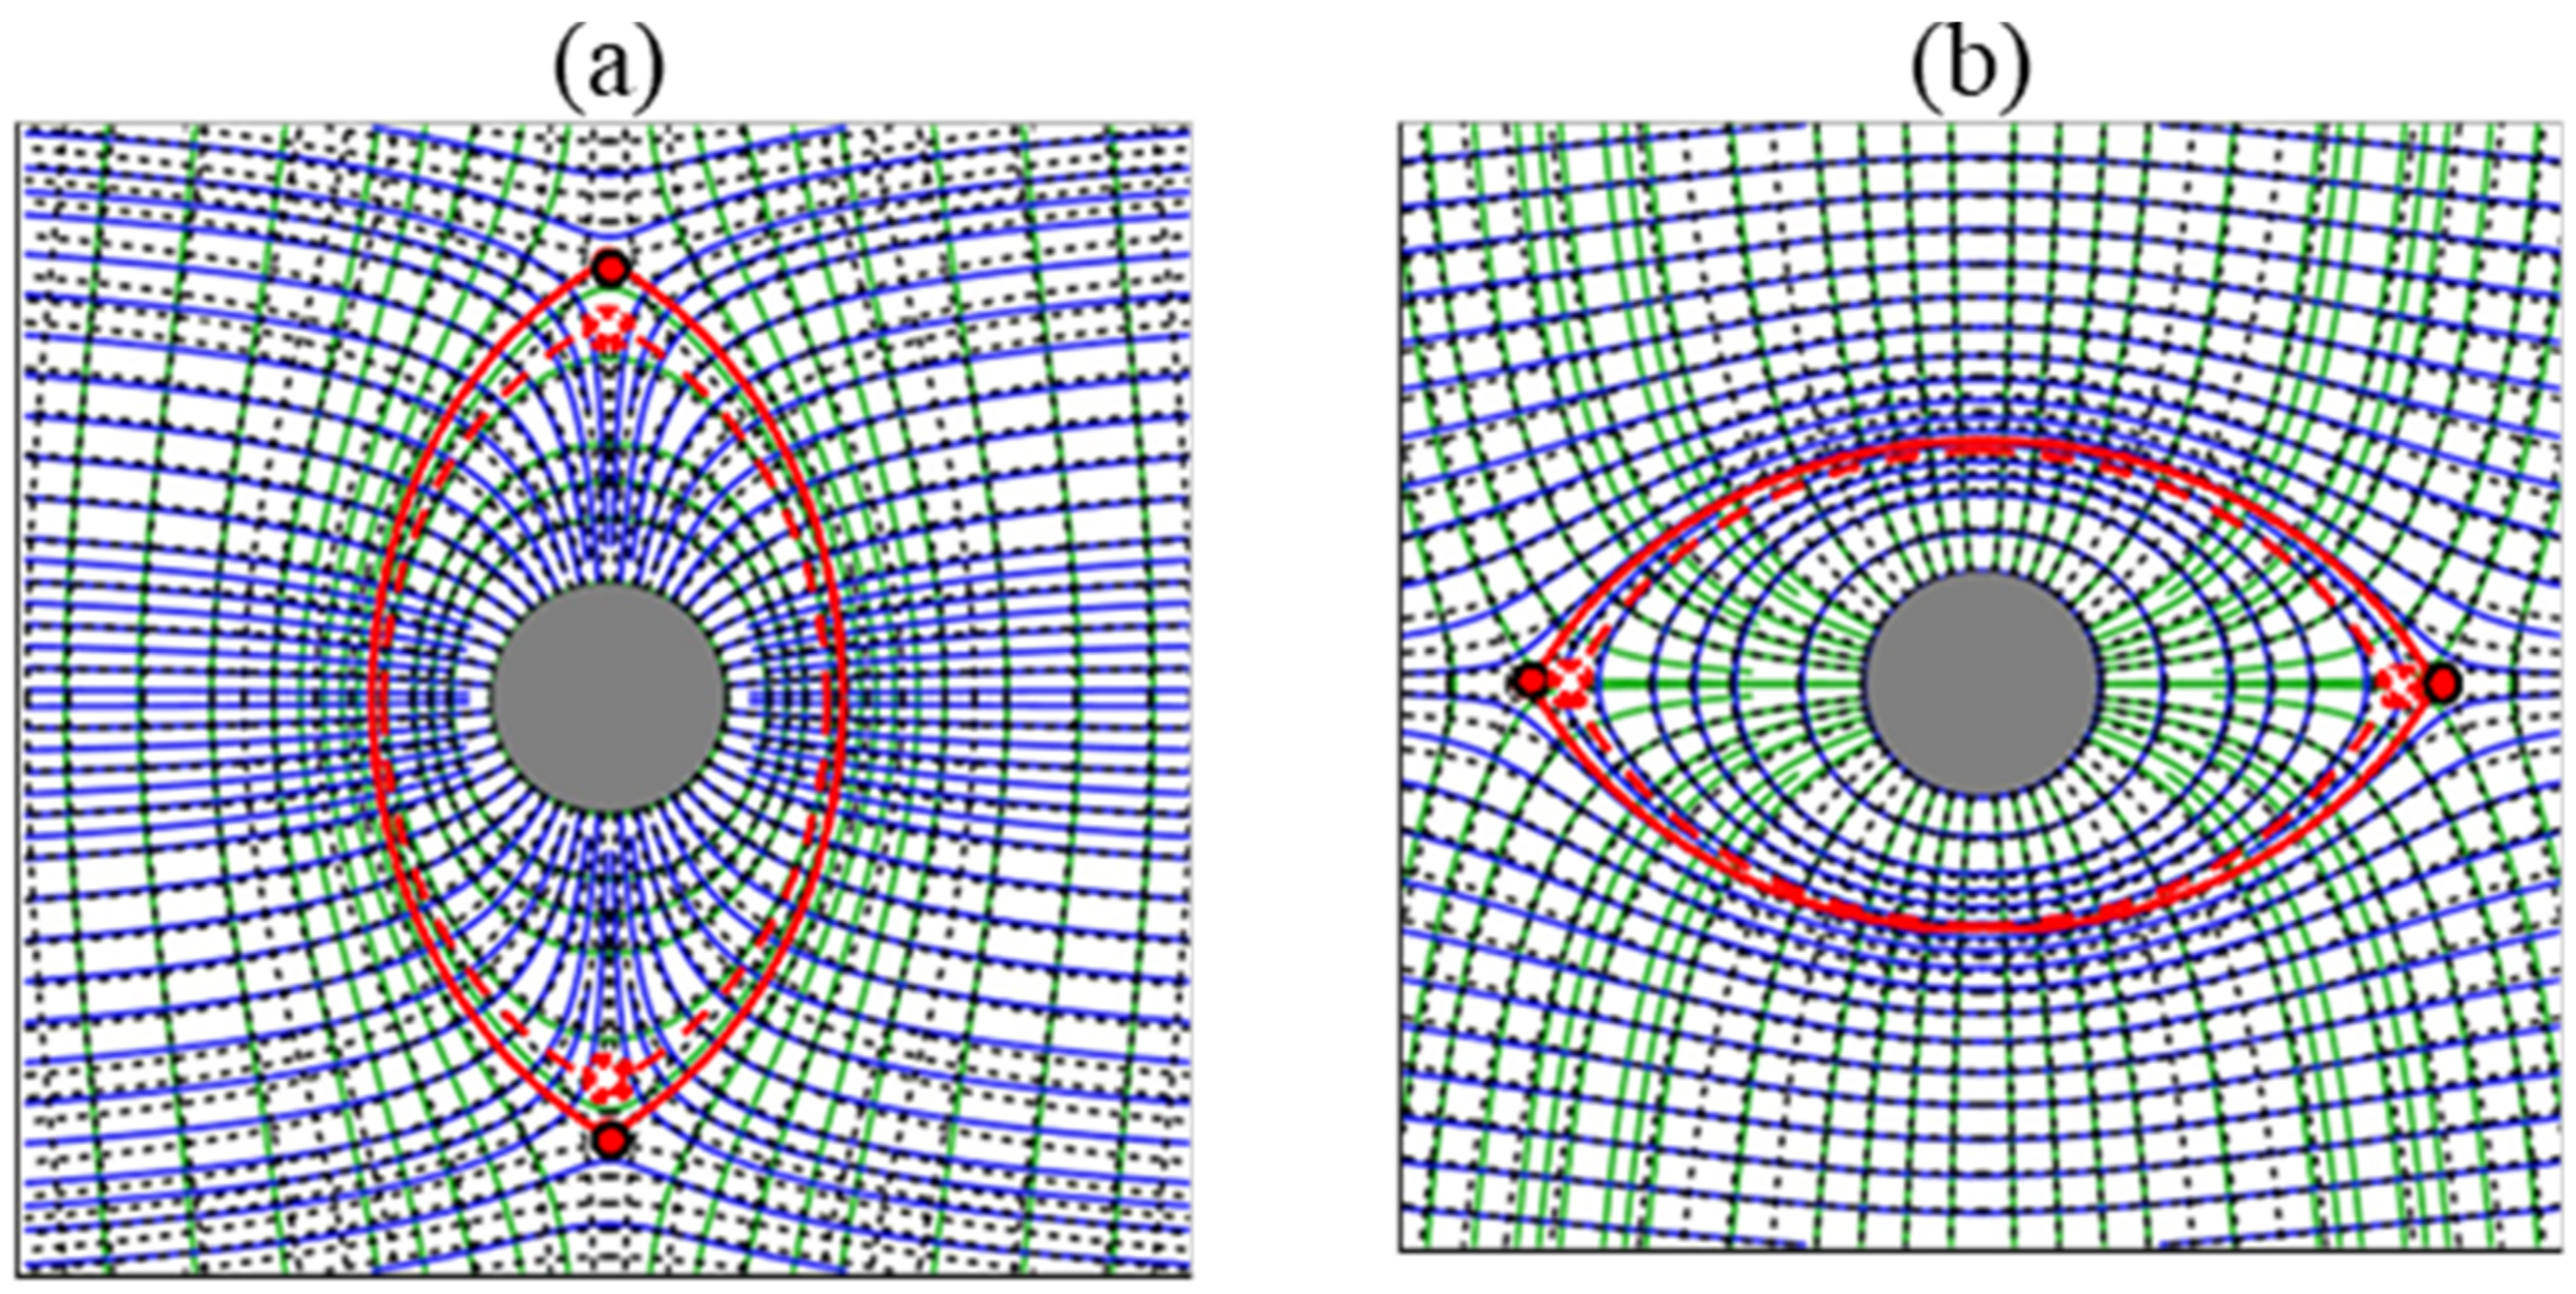
During the injection of hydraulic fluid (prior to flow-back), the pressure in the fracture is higher than the initial reservoir pressure. The excess (net) pressure is given by the difference between the fracture pressure and the initial reservoir pressure. Figure 8a shows that the largest principal stresses (compressive, blue trajectories) that were initially parallel to the orientation of the hydraulic fracture quickly turn into a direction transverse to the hydraulic fracture during the fracture treatment. This is the first generation of stress reversals. The stress reversal region typically occurs confined to an elliptical domain around the hydraulic fracture (dashed red ellipse, though the two neutral points in Figure 8a).
During leak-off, the pressure in the fracture treated stages rapidly drops. The onset of flow-back corresponds to a situation where the fluid pressure in the reservoir becomes higher than the fluid pressure in the hydraulic fractures. The difference between the initial reservoir pressure and the bottomhole pressure, in the well and its fracture system, now becomes negative. For example, assume an initial reservoir pressure of 30 MPa and a bottomhole pressure for a well on natural flow of 20 MPa; then, the initial net pressure in the well system would be close to −10 MPa. When the pressure gradient in the well system reverses from positive to negative, the flow-back period starts. The hydraulic fractures then close on the injected proppant packs.
Curiously, the profound impact of the pressure change on the elastic displacements near the hydraulic fractures during flow-back has not been emphasized before in any prior study. The prior elastic displacements, due to the injected fluid pressure rise relative to the initial reservoir pressure, will have been completely undone at flow-back time; instead, they will result in elastic displacements caused by a negative net pressure.
Figure 8b shows the stress trajectories for a flow-back case, with a net pressure of −20 MPa. We now see that the state of stress in the direction normal to the hydraulic fracture has given way, again, to extension, which is the second generation of stress reversals. The stress reversals caused by the elevated fluid pressure during the injection period (Figure 8a) have been rapidly undone. This is, in fact, no surprise. Fiberoptic observations from fracture treatment stages in the field (see discussion, in Section 4.3) confirm the occurrence of the stress regime reversals independently explained by LSM models in the present study.
The other important feature of Figure 8b is the recognition of a so-called fracture cage, i.e., an elliptical domain around the hydraulic fractures where the stress trajectories are no longer conducive for letting any natural fractures, positioned transverse to the hydraulic fracture, propagate outside the fracture cage. The phenomenon of such fracture cages was previously documented to occur around under-pressured boreholes [27,28,29,30,31,32]. Detailed comparisons of the dynamics of stress cages and fracture cages, near boreholes and hydraulic fractures, respectively, are given in Section 4.1.

3.3. Production-Induced Stress Changes

As production proceeds and the wells are placed on artificial lift, the elastic displacements caused by the negative net pressure in the production system steeply increase. For example, if the initial reservoir pressure is 30 MPa and the bottomhole pressure due to the pump is 10 MPa, the net pressure in the well system would be close to −20 MPa. Figure 8b shows the stress trajectory pattern due to the imposed net pressure of −20 MPa. The state of stress around the hydraulic fractures has now intensified into a stronger compressive stress regime in the direction normal to the hydraulic fractures. The crushing forces on the proppant packs will steeply rise—due to the transition from natural flow to artificial lift—and may cause further reduction in the conductivity of the fracture system. Field observations of micro-seismic activity during the early years of production suggest that significant settling and shifts take place during the early years of production (for a discussion, see Section 4.6).

4. Discussion

This study presented LSM models to explain how, during the various steps in field development involving hydraulic fracture treatment, the principal stress orientations near the hydraulic fractures swap the minimum and maximum principal stresses several times with respect to their initial directions, due to fracture treatment interventions and production-related pressure depletion. Until now, a simple systematic explanation for the mechanism of reversals did not exist.

4.1. Analogy between Wellbores and Hydraulic Fractures

The principal stress trajectory patterns—near hydraulic fractures—develop a first generation of stress reversal zones during the fracturing operation, when the fracture treatment pressure is initially elevated relative to the pore pressure in the reservoir space. A second generation of stress reversal zones develop when the pressure on the fracture system subsequently drops during flow-back and production-related pressure depletion. The stress trajectories around a single hydraulic fracture, induced by the pressure changes, include the shift of a stress cage pattern (Figure 8a) to a fracture cage pattern (Figure 8b). The occurrence of such stress cages and fracture cages has not been emphasized before in connection with hydraulic fracture development.
Similar transitions of a stress cage pattern (Figure 9a) to a fracture cage pattern (Figure 9b) have been recognized to develop around wellbores. Inside the stress cage (Figure 9a), the stresses radial to the (over-pressured) well are consistently compressional (blue trajectories) and tangential stresses are consistently tensional (green trajectories). For the under-pressured well (Figure 9b), the fracture cage develops, inside which the principal stresses are swapped, i.e., stresses tangential to the well are compressional (blue trajectories) and radial stresses are tensional (green trajectories).
When open hole completions are applied, the stress cage for the wellbore (Figure 9a) develops simultaneously with the stress cages around its interconnected hydraulic fractures (Figure 8a). In a dynamic sense, a hydraulic fracture is nothing but a flattened borehole, and the similarity in the dynamics of their stress responses to positive and negative net pressures on their respective walls in the presence of a regional stress anisotropy should be no surprise.
We may distinguish three conditions of boreholes and hydraulic fractures penetrating a formation; the pore pressure is (1) overbalanced, (2) balanced, or (3) underbalanced, by the pressure of the fluid pumped into the well system. The distinction between the three states is relevant for understanding better how and when stress cages and fracture cages develop. An in-depth discussion of the important physical and geo-mechanical aspects of stress cages and fracture cages is merited here.

4.2. Stress Cages and Fracture Cages around Wellbores

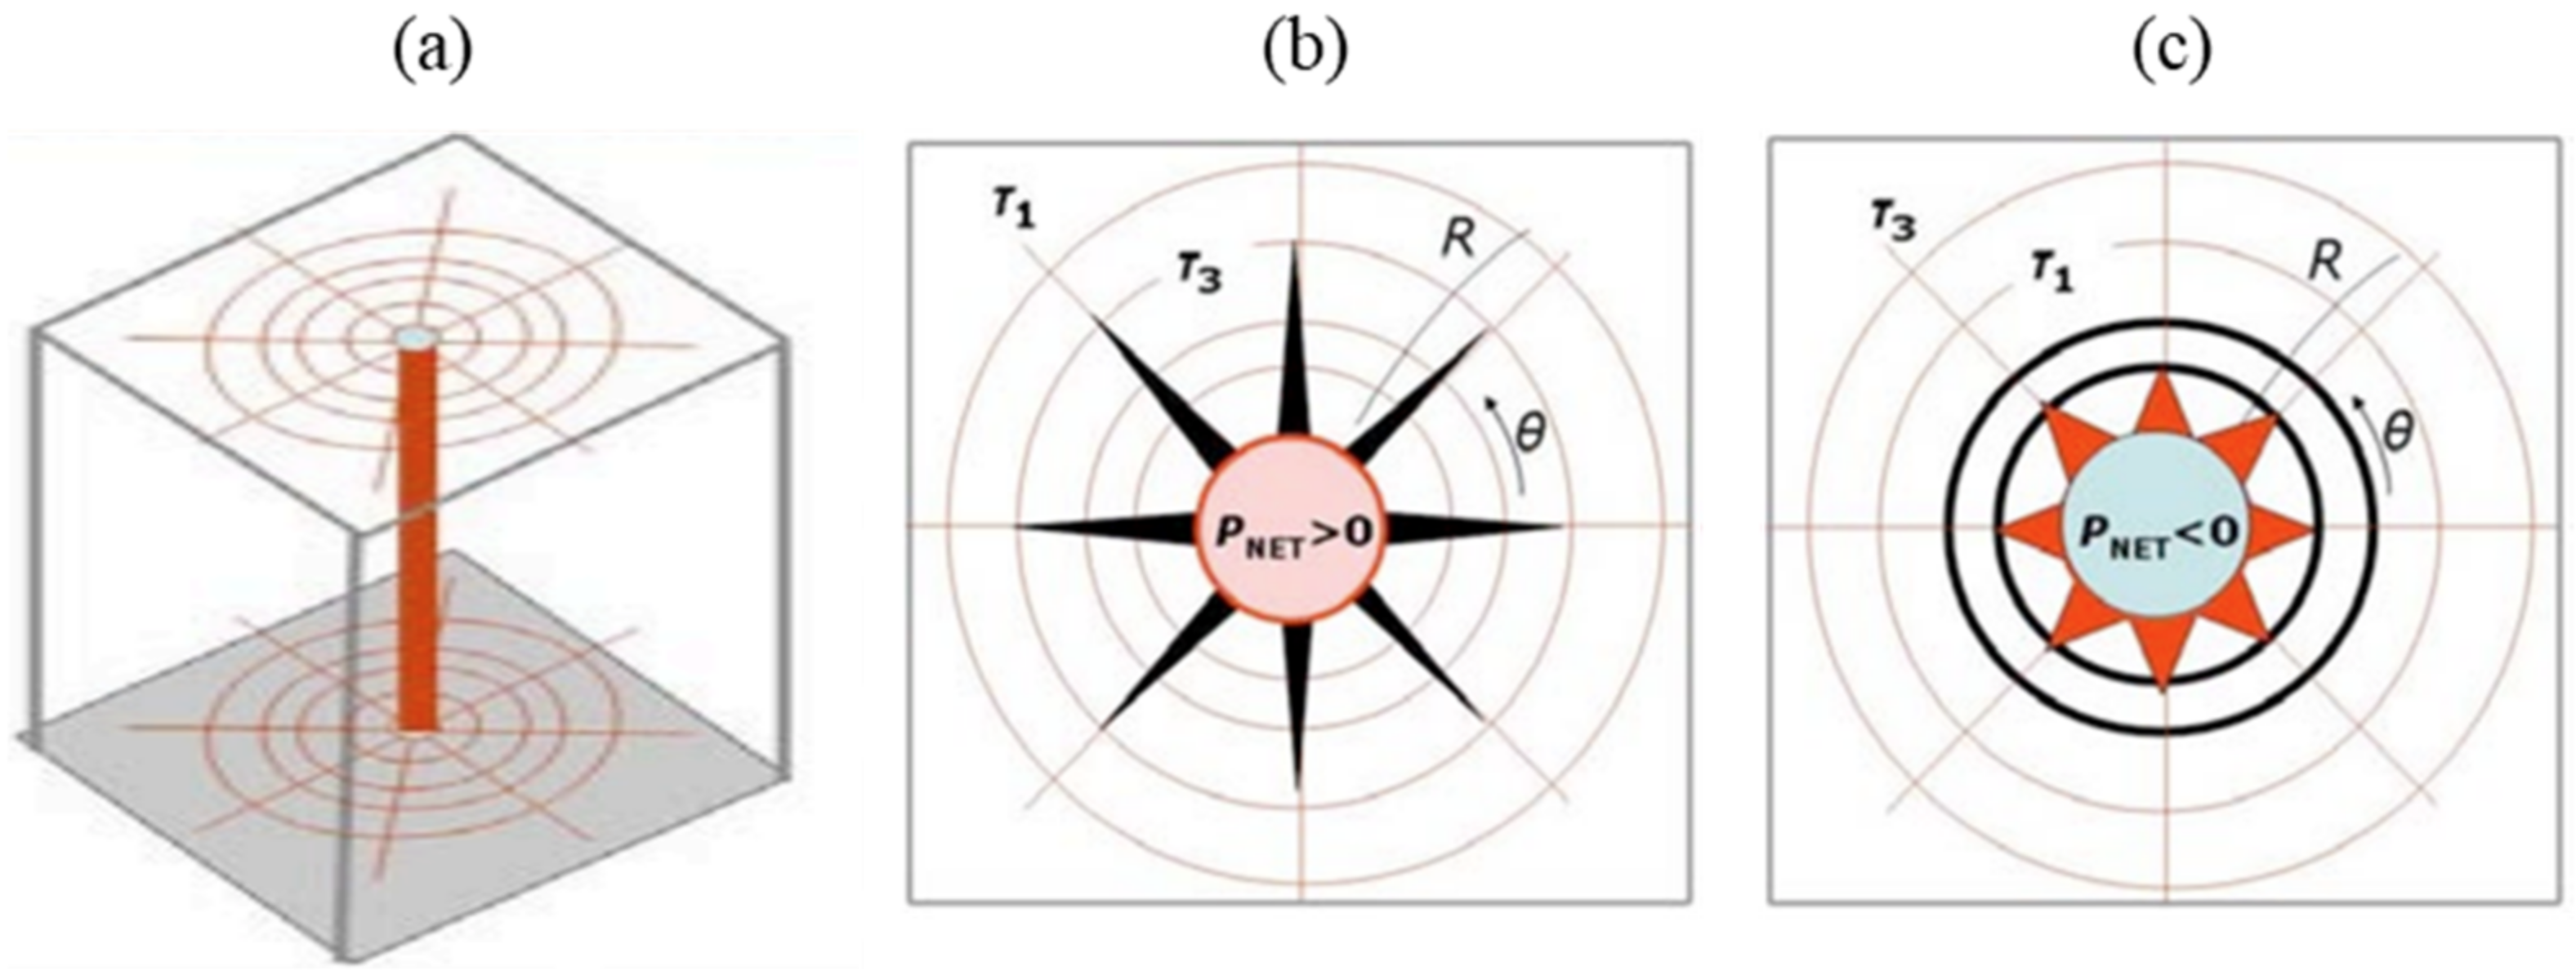
The simplest cases to consider are wellbores penetrating strata without any regional stress anisotropy (Figure 10a). For such cases, the stress trajectory patterns around a vertical wellbore are restricted to spiderweb patterns, with three distinct cases. When the formation fluid pressure and the pressure due to the weight of the mud column in the wellbore are perfectly balanced, no deviatoric stresses result. The scalar pressure in the wellbore is exactly the same as in the pores of the formation. Such cases have no residual principal stress and no stress trajectories exist. Two more cases remain to be discussed: the overbalanced well with PNET > 0 (Figure 10b) and the underbalanced well with PNET < 0 (Figure 10c). The special circumstance of underbalanced wells is that spalling and breakouts may occur, but hydraulic fractures cannot develop under such conditions.
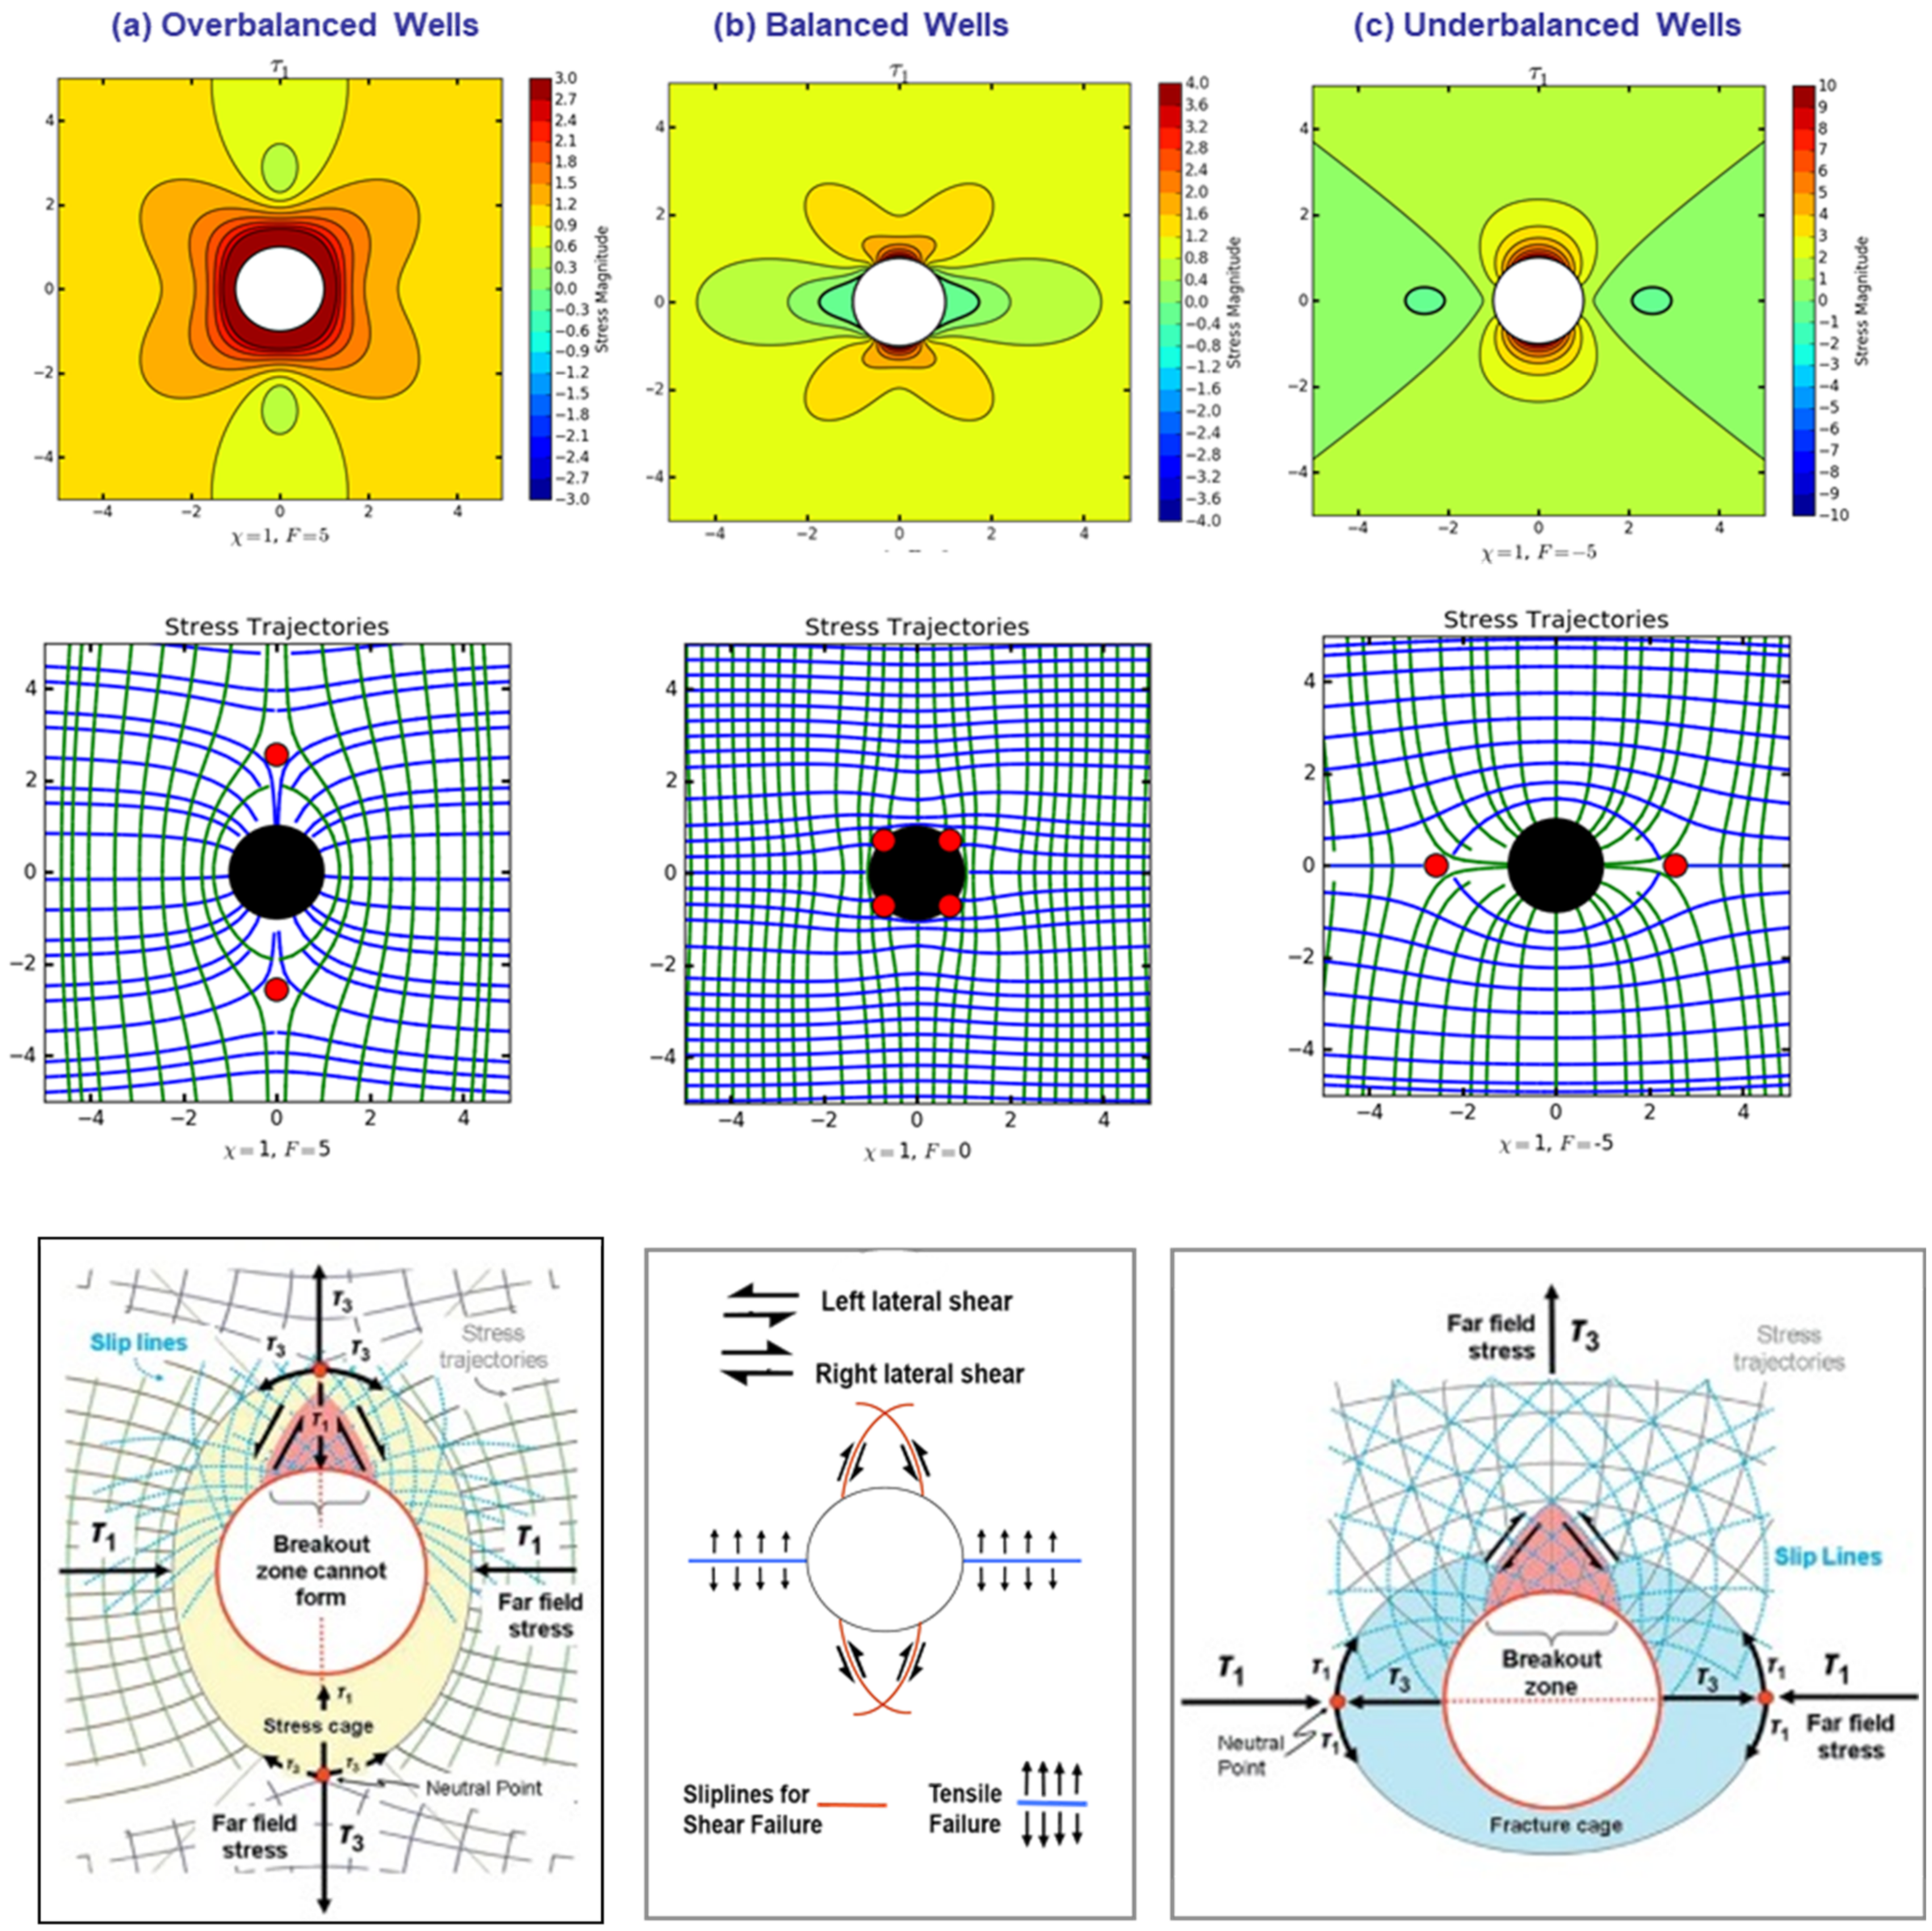
Next, consider the case of wells penetrating layers with a biaxial regional stress anisotropy as is commonly the case in geological basins [28,30]. In such cases, all overbalanced wellbores develop stress trajectory patterns outlining a so-called stress cage (Figure 11a). Breakouts are less likely to occur due to the potential slip directions in the breakout zones being incompatible with available space. In contrast, the underbalanced well section develops stress trajectory patterns near the wellbore with an elliptical region through the neutral points outlining a so-called fracture cage (Figure 11c), with the elliptical region through the neutral points rotated 90° with respect to the stress cage of Figure 11a. The potential breakout zones for the case of underbalanced well sections are compatible with the available space. Rock mass fracturing in the break-out zone can freely move (or collapse) into the wellbore.
The rare case of a perfectly balanced wellbore (Figure 11b) occurs when the pressure due to the weight of the drilling mud precisely matches the pore pressure in the penetrated formation. Such wellbore sections develop four neutral points, located at the wellbore rim; neither a fracture cage nor a stress cage develops. The balanced well is the transition stage between the overbalanced and underbalanced states. Such balanced wellbore sections still develop local stress concentrations (column b, top image in Figure 11). Breakouts are likely to develop around the balanced wellbore (Figure 11b, bottom row central image), as is also the case when fracture cages develop in the underbalanced wellbore (Figure 11c). Slip directions in the potential breakout zones of both balanced and underbalanced wellbore sections are not constrained by space compatibility limitations and, thus, such breakouts may readily form. The corresponding stress magnitude contours and stress concentrations at the wellbore for all cases are included in Figure 11 (top row).
In-depth analyses and discussions of wellbores with fracture and stress cages and the conditions that lead to balanced, overbalanced, and underbalanced wellbores were given in our prior studies for isotropic cases [27,28,29,31,32], as well as for anisotropic cases [33,34]. It should be emphasized here that fracture cages were named for their condition whereby any hydraulic fracture cannot escape the cage but will start to curve in tangential directions around the wellbore (see [32,35]). The fracture cage is marked in Figure 11c by the elliptical region. In addition, fracture cage stress configurations are conducive for breakout development and spalling, with runaway conditions, especially in unconsolidated mud volcano source layers.

4.3. Stress Cages and Fracture Cages around Hydraulic Fractures

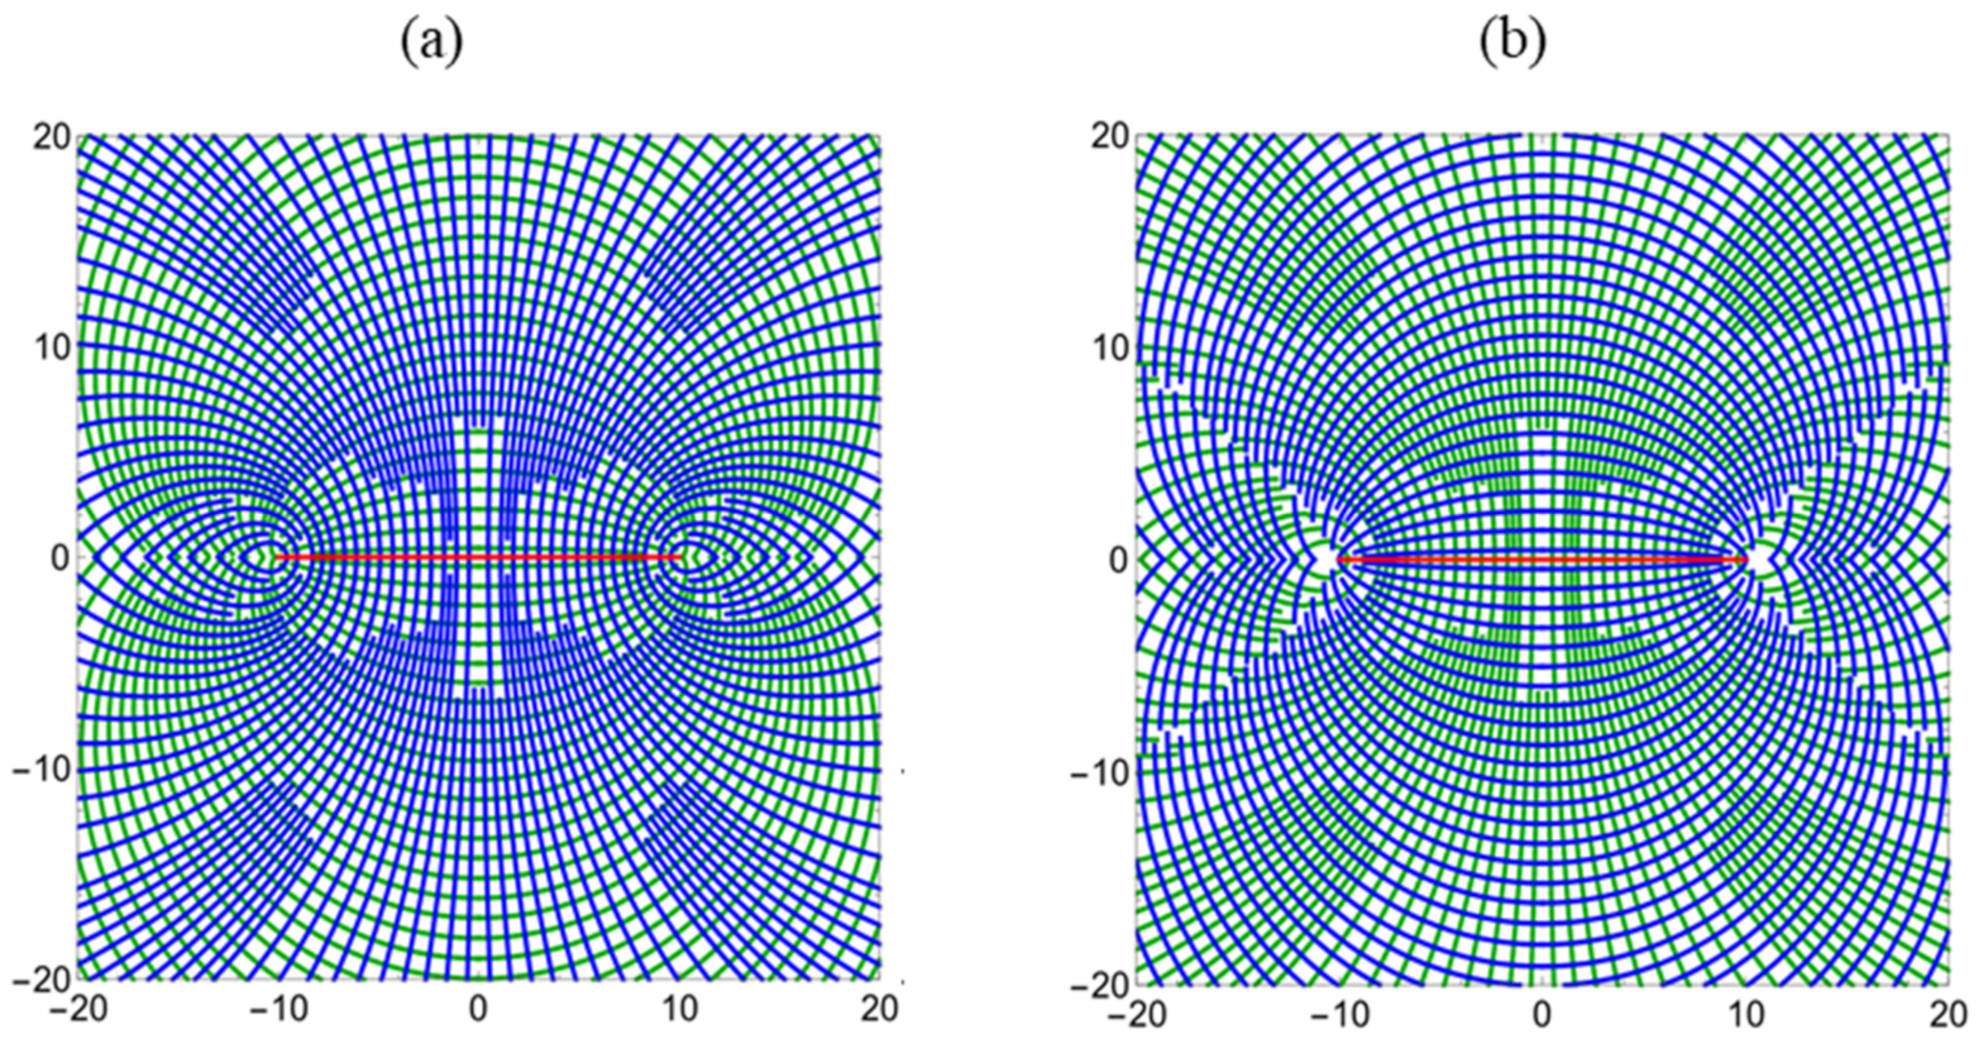
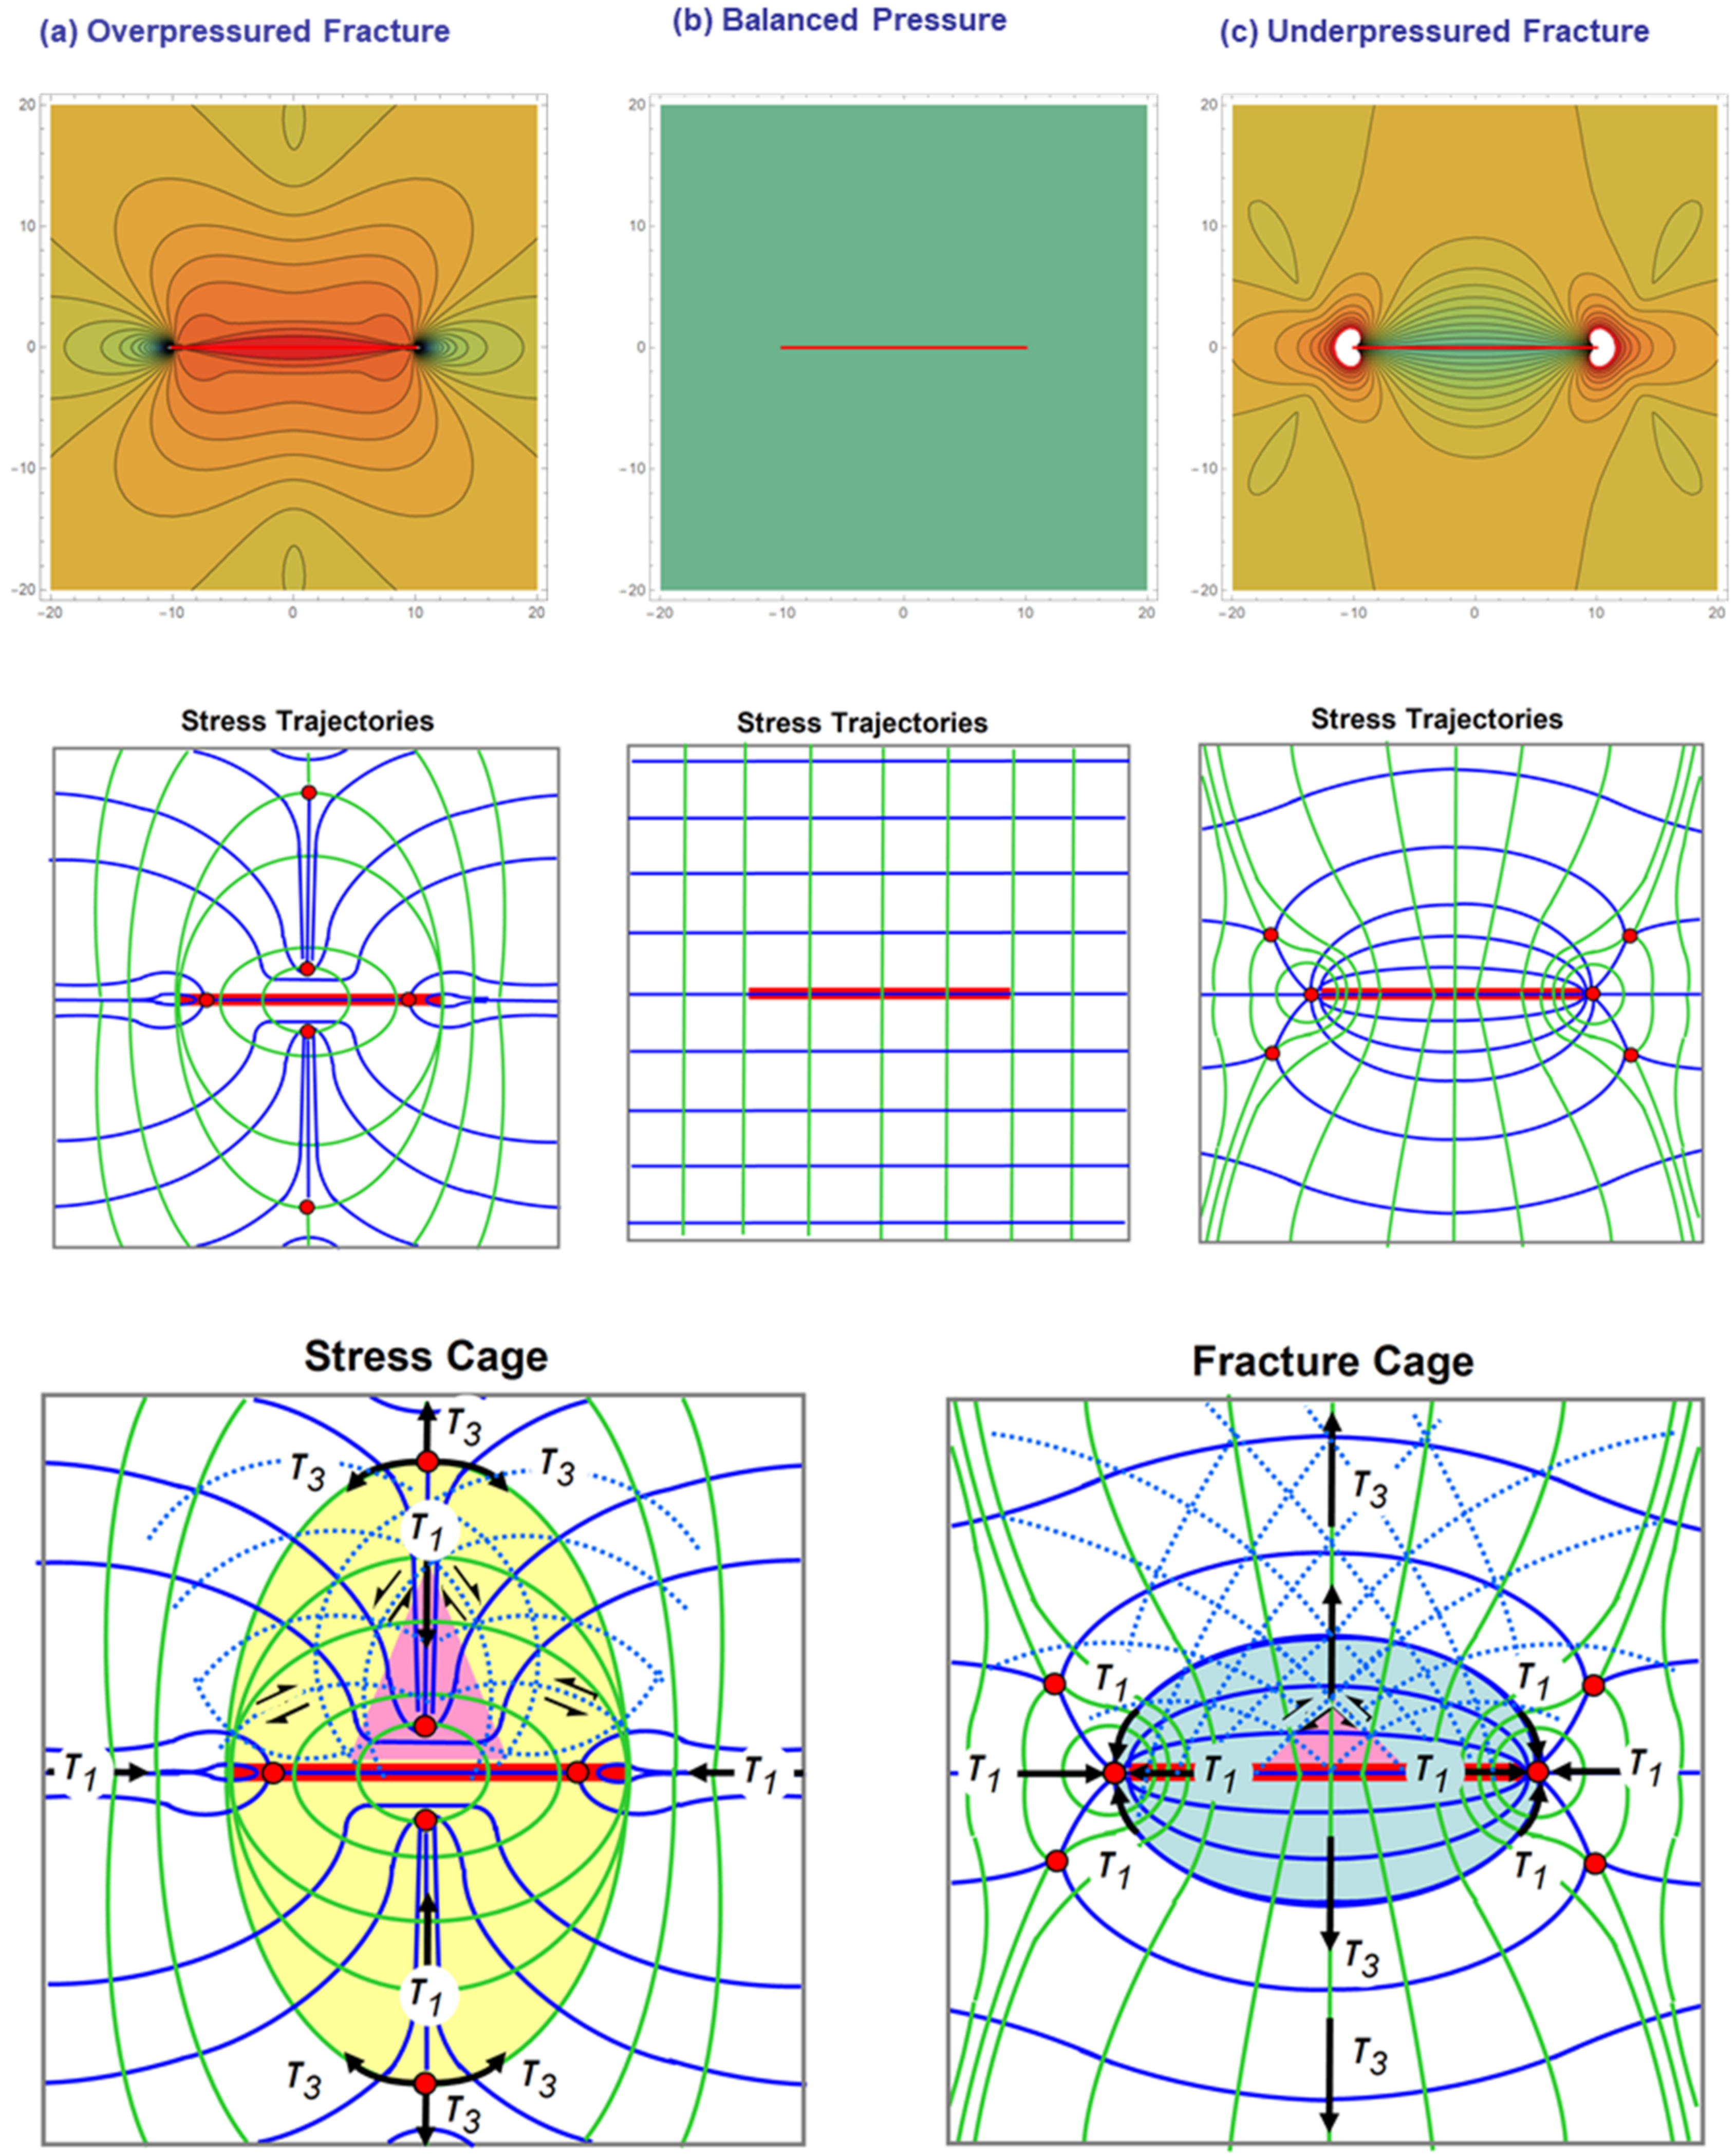
Next, consider the stress trajectory patterns around a single hydraulic fracture in a region without any regional far-field stress. For such cases, the trajectory patterns around the hydraulic fractures that are over-pressured, as occurs during the fracture treatment, are given in Figure 12a. The trajectories for the under-pressured case, as occurs during flow-back and subsequent production from the well system tied in with the hydraulic fractures, are given in Figure 12b. Both cases have the same patterns, but differ in that the directions of the principal stress axes are swapped, as marked by the swapping of the blue and green trajectories in Figure 12a,b. In Figure 12a, the largest compressive stress is normal to the fracture (blue trajectories), while, in Figure 12b, the direction transverse to the fracture is in tension (green trajectories).
When regional stress is present, as is the case in most energy resource reservoirs, the patterns of Figure 12a,b are superposed on the pre-existing stress field. The resulting stress trajectory patterns for the over-pressured and under-pressured fractures are given in Figure 13 (middle row, left and right images, respectively).
As in the case of overbalanced wellbores (Figure 11a), the over-pressured hydraulic factures develop a stress cage pattern (Figure 13a, lowermost image). The slip lines (dashed blue curves) indicate potential directions of shear failure, but the directions of slip are incompatible with actual movement. In contrast, the fracture cage developing in under-pressured hydraulic fractures during flow-back and subsequent production (Figure 13b, lowermost image) is considered conducive for shear failure such that angular rock cavings may move into the fracture space.

4.4. Stress Regime Reversals

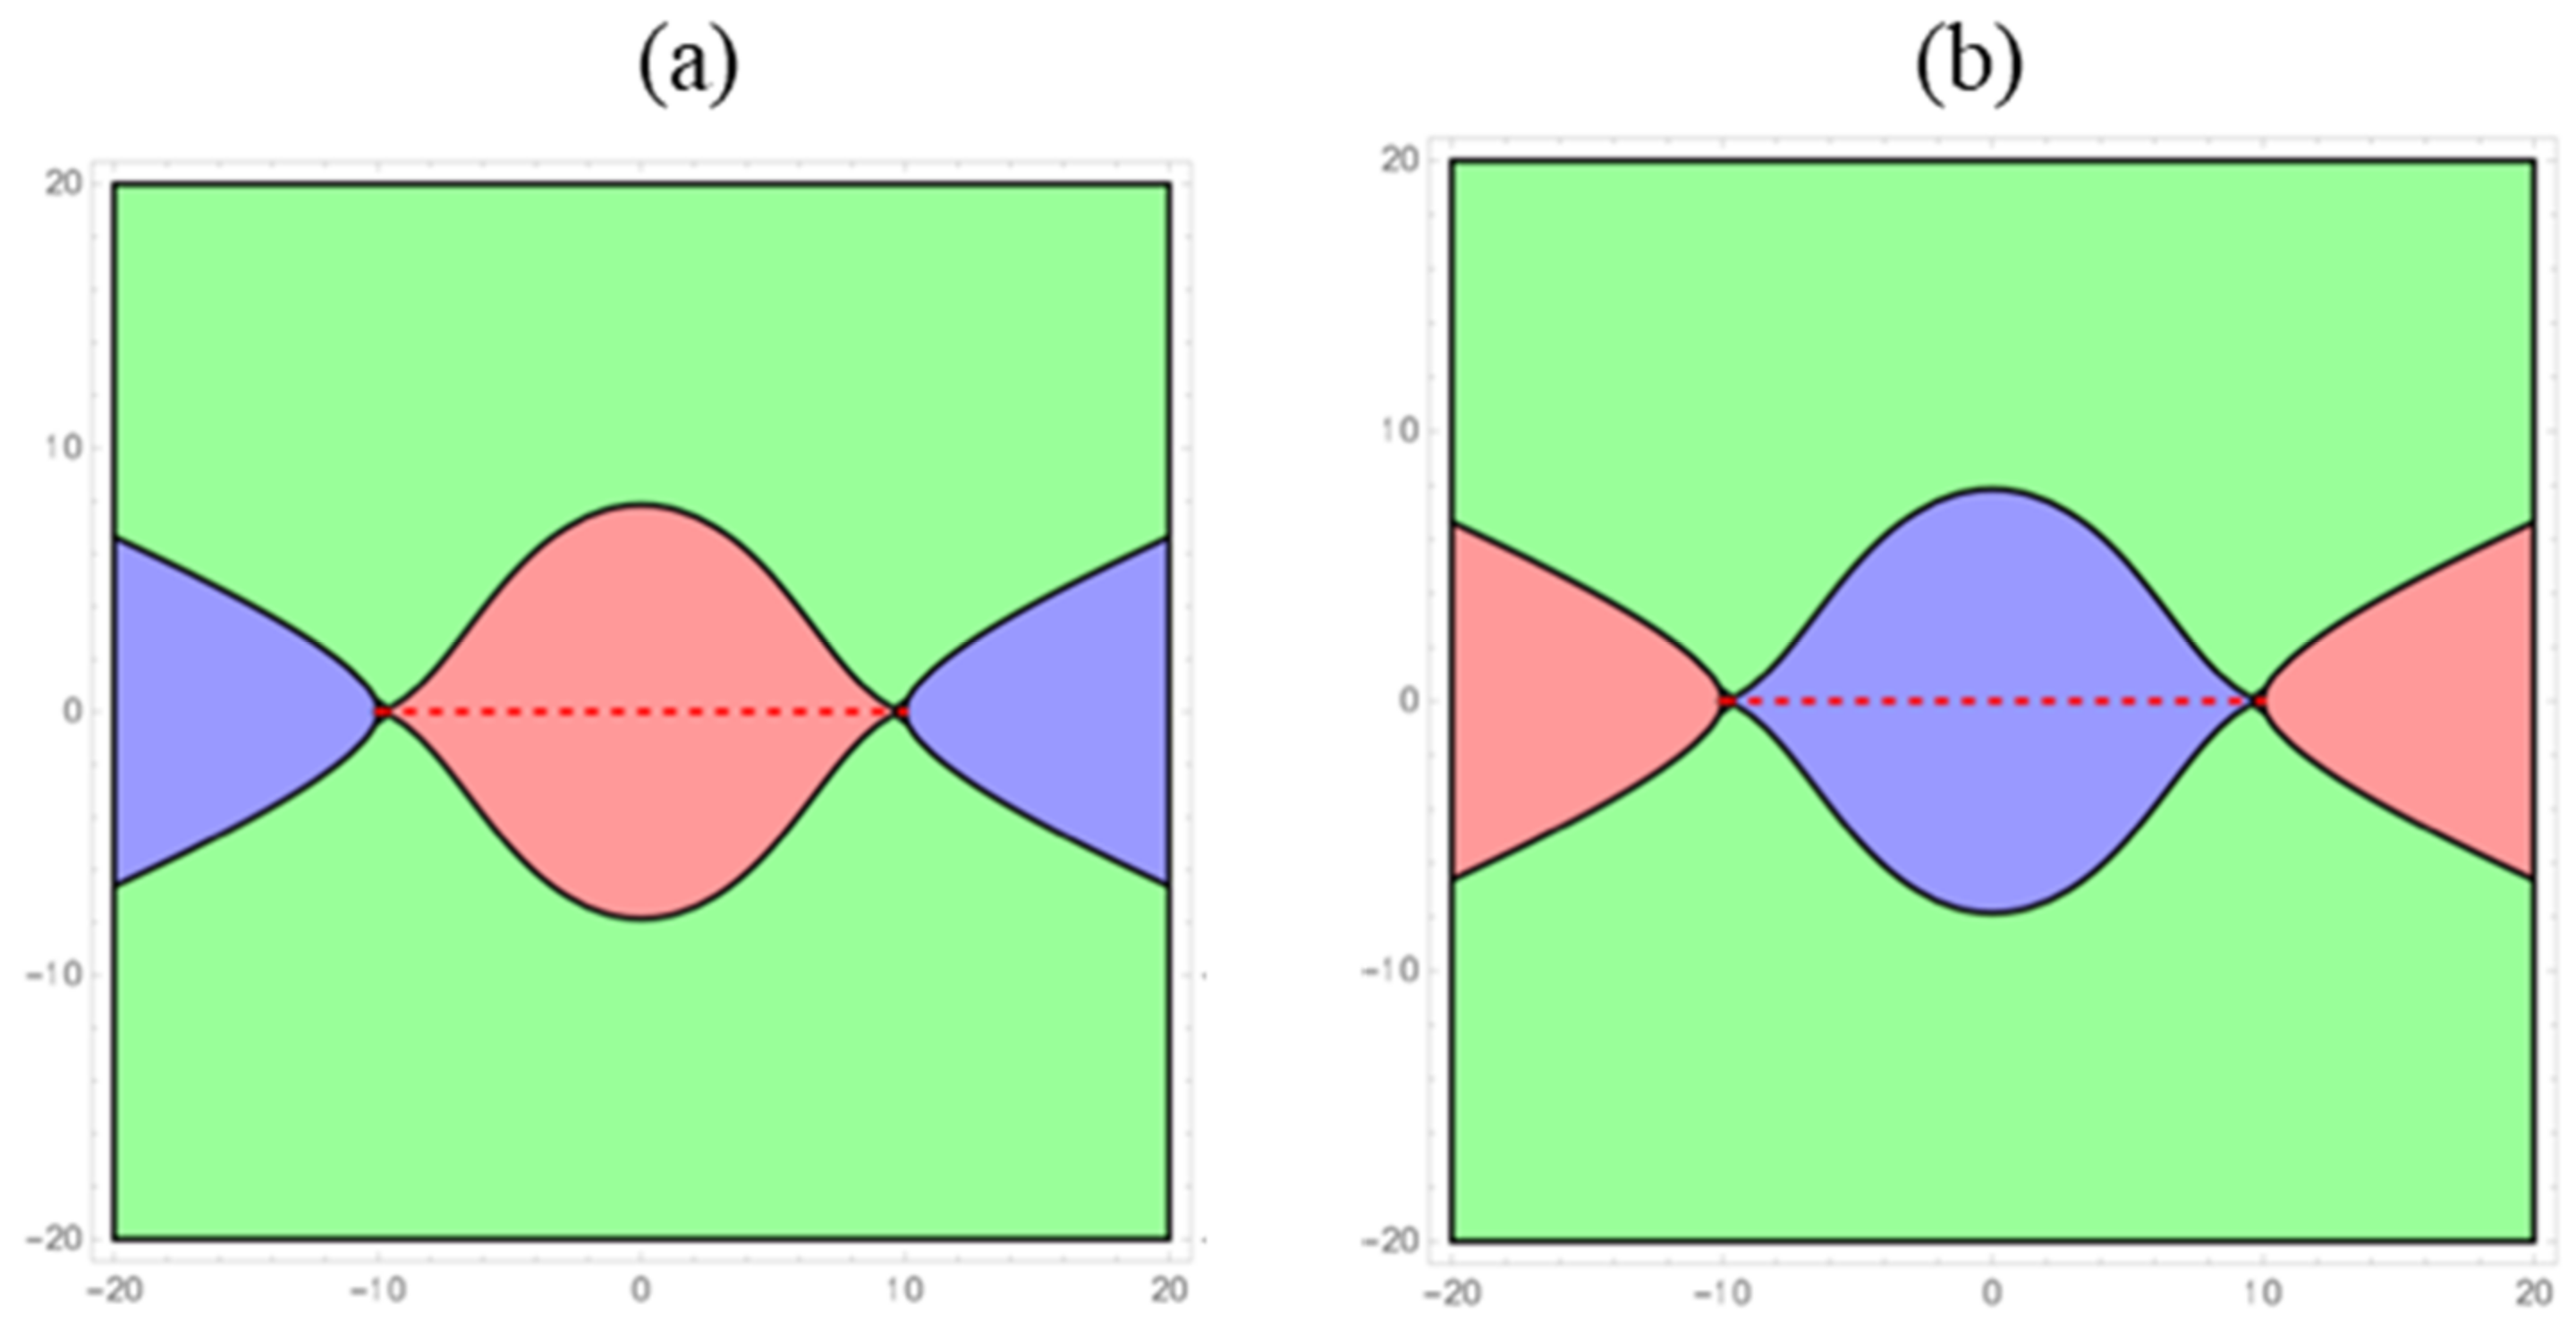
During the creation of stress cages and fracture cages around hydraulic fractures, the stress regime near the hydraulic fractures changes as follows: initially, a reservoir with a native state of stress anisotropy typically has deviatoric Terzaghi stresses with one horizontal direction in compression and the other horizontal direction in tension. This would be a uniform green field, which during and after fracture treatment would be disturbed by respectively a first generation (Figure 14a) and a second generation (Figure 14b) of stress reversals.
During the first generation of stress reversals in the vicinity of the hydraulic fracture, over-pressure in the fractures exists when they are opened during the fracture treatment pumping phase (Figure 14a). Compressive stresses occur in the transverse direction to the hydraulic fractures (red zone) for as long as the stress cage exists (Figure 14a); tension (blue zone) occurs at the fracture tips.
When flow-back and pressure depletion start in the well and its hydraulic fracture system, the stress cage ceases to exist. A fracture cage then develops, where all the principal stresses in the vicinity of the hydraulic fractures are reversed (Figure 14b). The compressive stress regime transverse to the fracture now becomes a tensional regime. At the fracture tips (which can now no longer grow), the stress reverts to a compressional regime.

4.5. Field Observations of Stress Regime Changes during Fracture Treatment

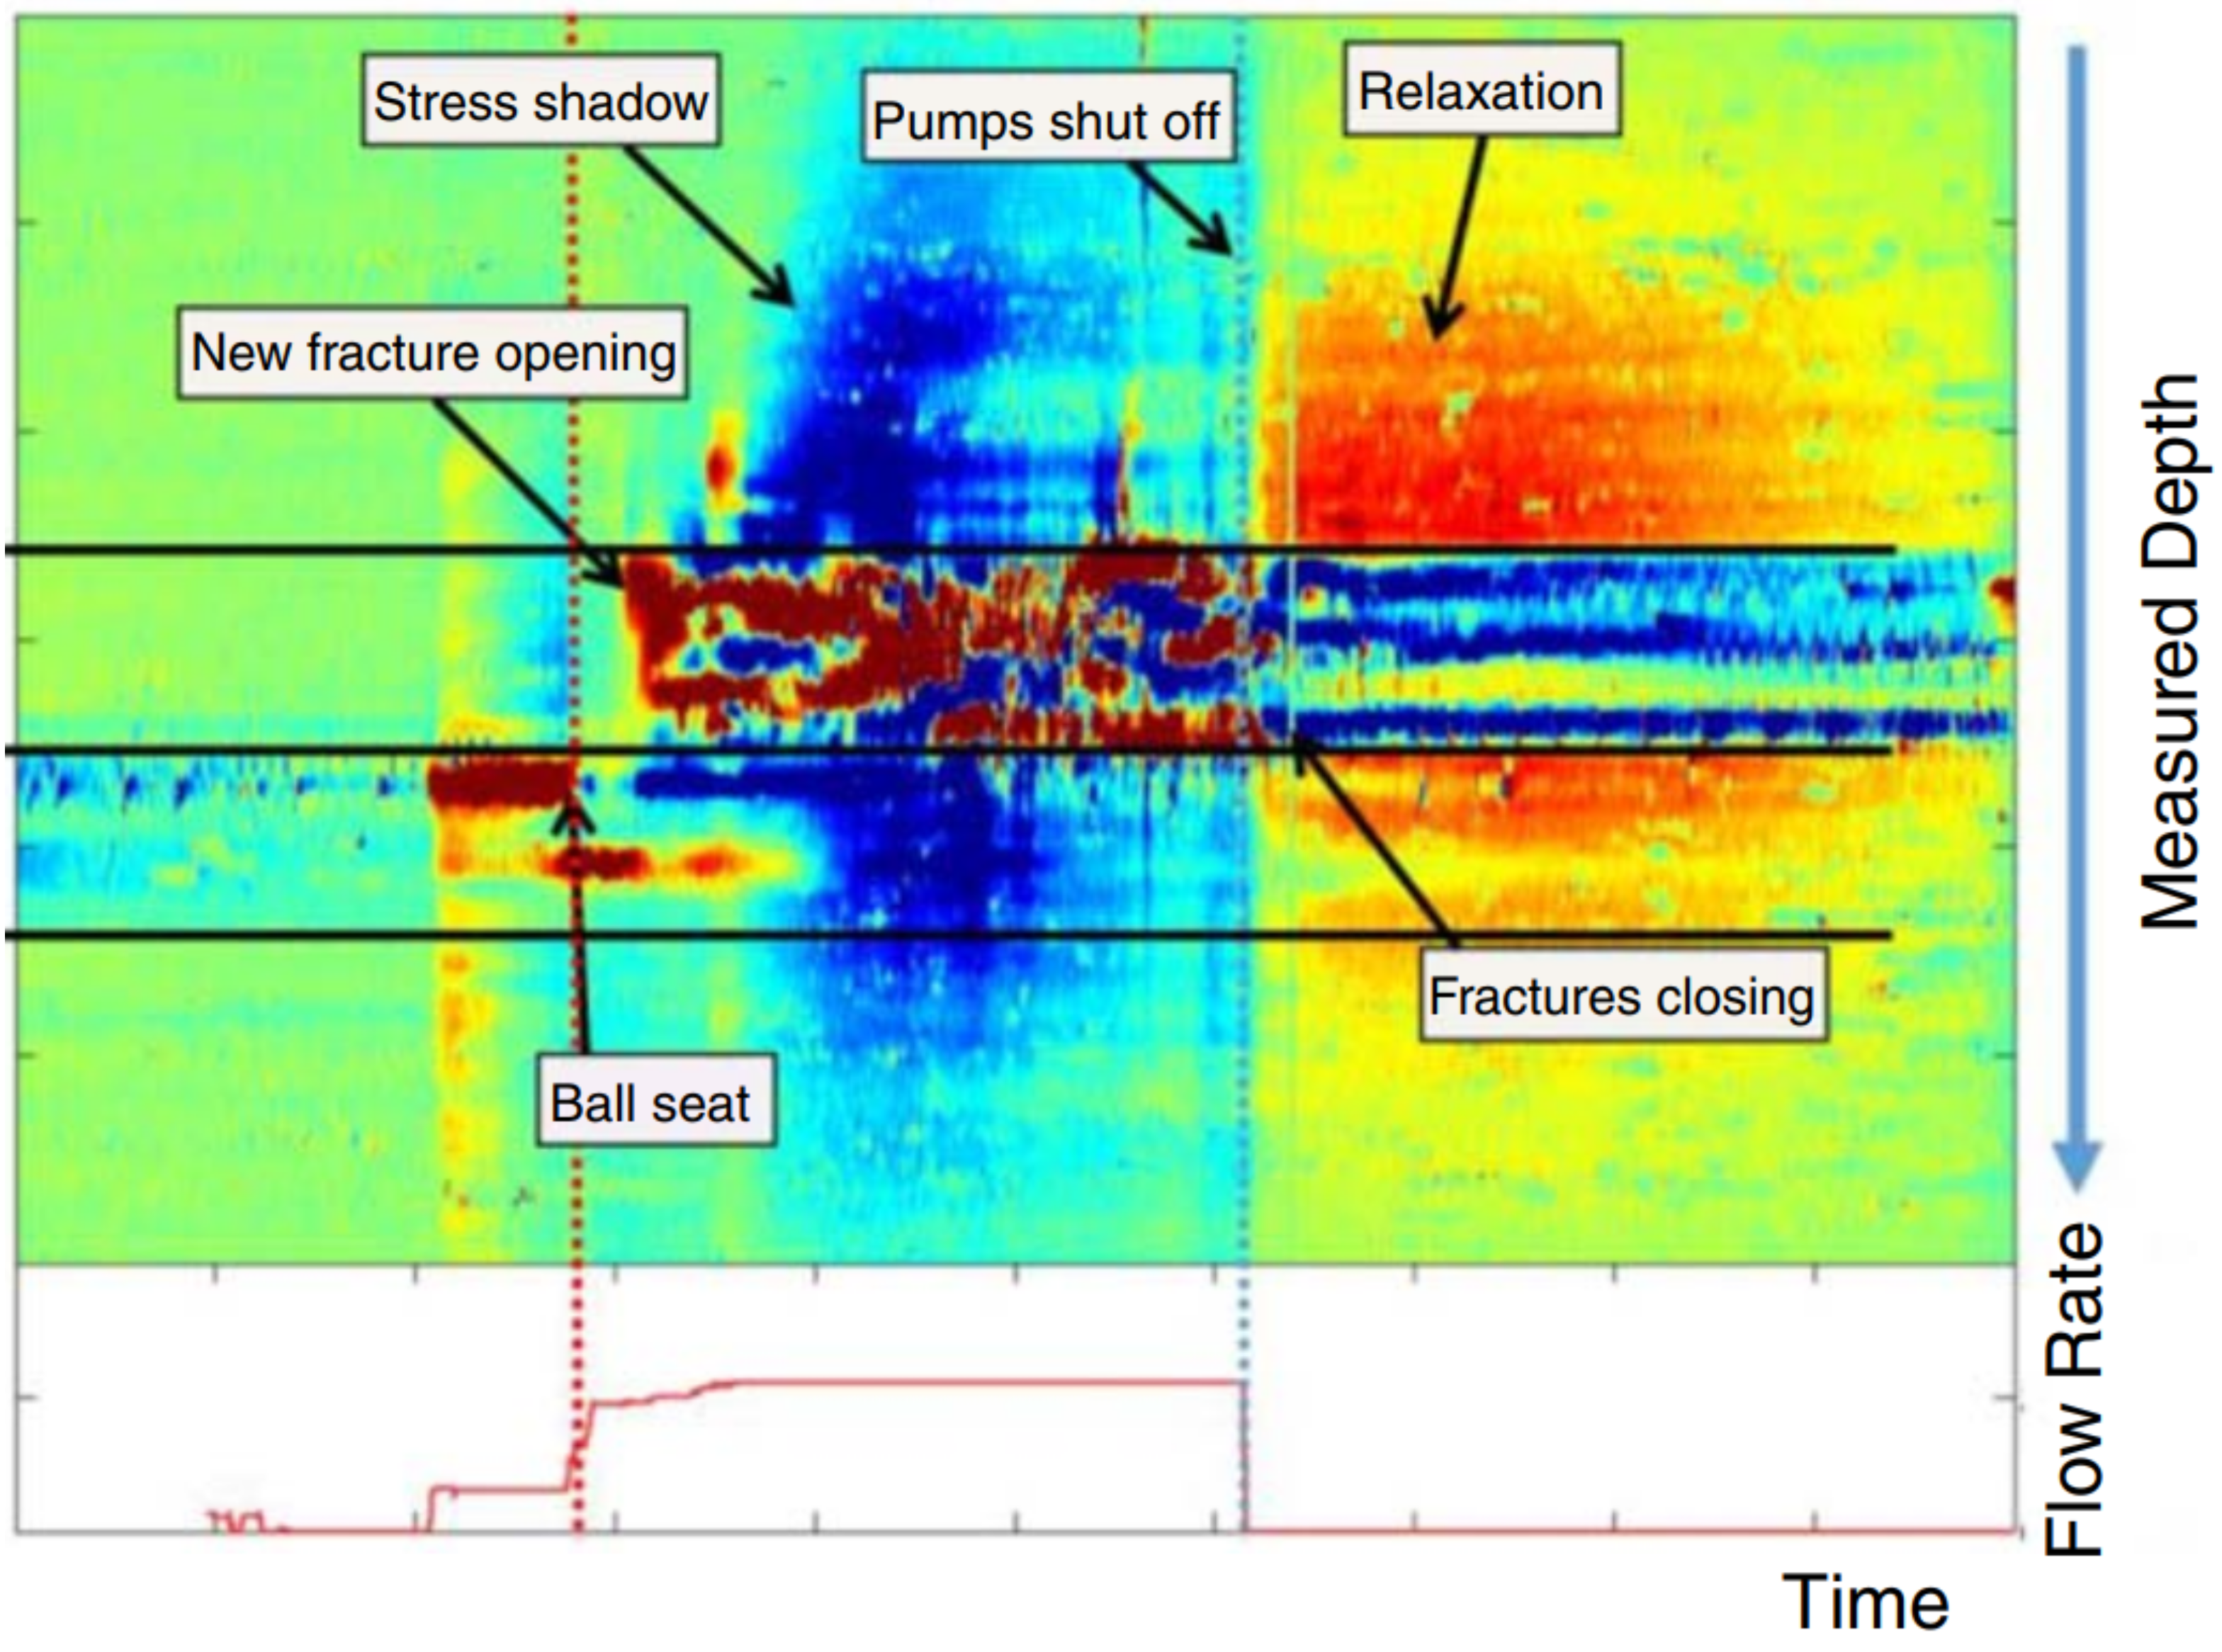
Real-time monitoring of dilations during fracture treatment is possible with optical fiber technology provided by certain service companies. An example of such a result is given in Figure 15 for a well completed in the Eagle Ford formation, South Texas [36]. The recorded field data confirm that rapid stress reversals occur, as predicted by the LSM models in our study. What the optical fiber in the monitoring well next to the active fracture stage shows initially during the fluid injection is the extension at the tip of the propagating fracture. When the pumps shut off, the fracture has reached its maximum extent, and the region transverse to the fracture is in compression as in Figure 14a.
One may take note of two issues related to Figure 15: (1) the color schedule that was used by the author of the field study [36] is opposite to ours used in Figure 14; (2) the stress state next to the active stage is due to the optical fiber first responding by peripheral shortening when the active stage stretches the fiber, and the reverse happens when the active stage compresses the fiber.
The LSM models presented in the present paper explain that the stress reversals occur when the original tectonic stress regime—characterized by a rectangular stress trajectory pattern with compression parallel to the wellbore (Figure 7a)—switches for the active stage to a stress trajectory pattern characterized by the development of stress cages with the principal stresses reversed (Figure 7b,c).

4.6. Field Observations of Stress Regime Changes during Production

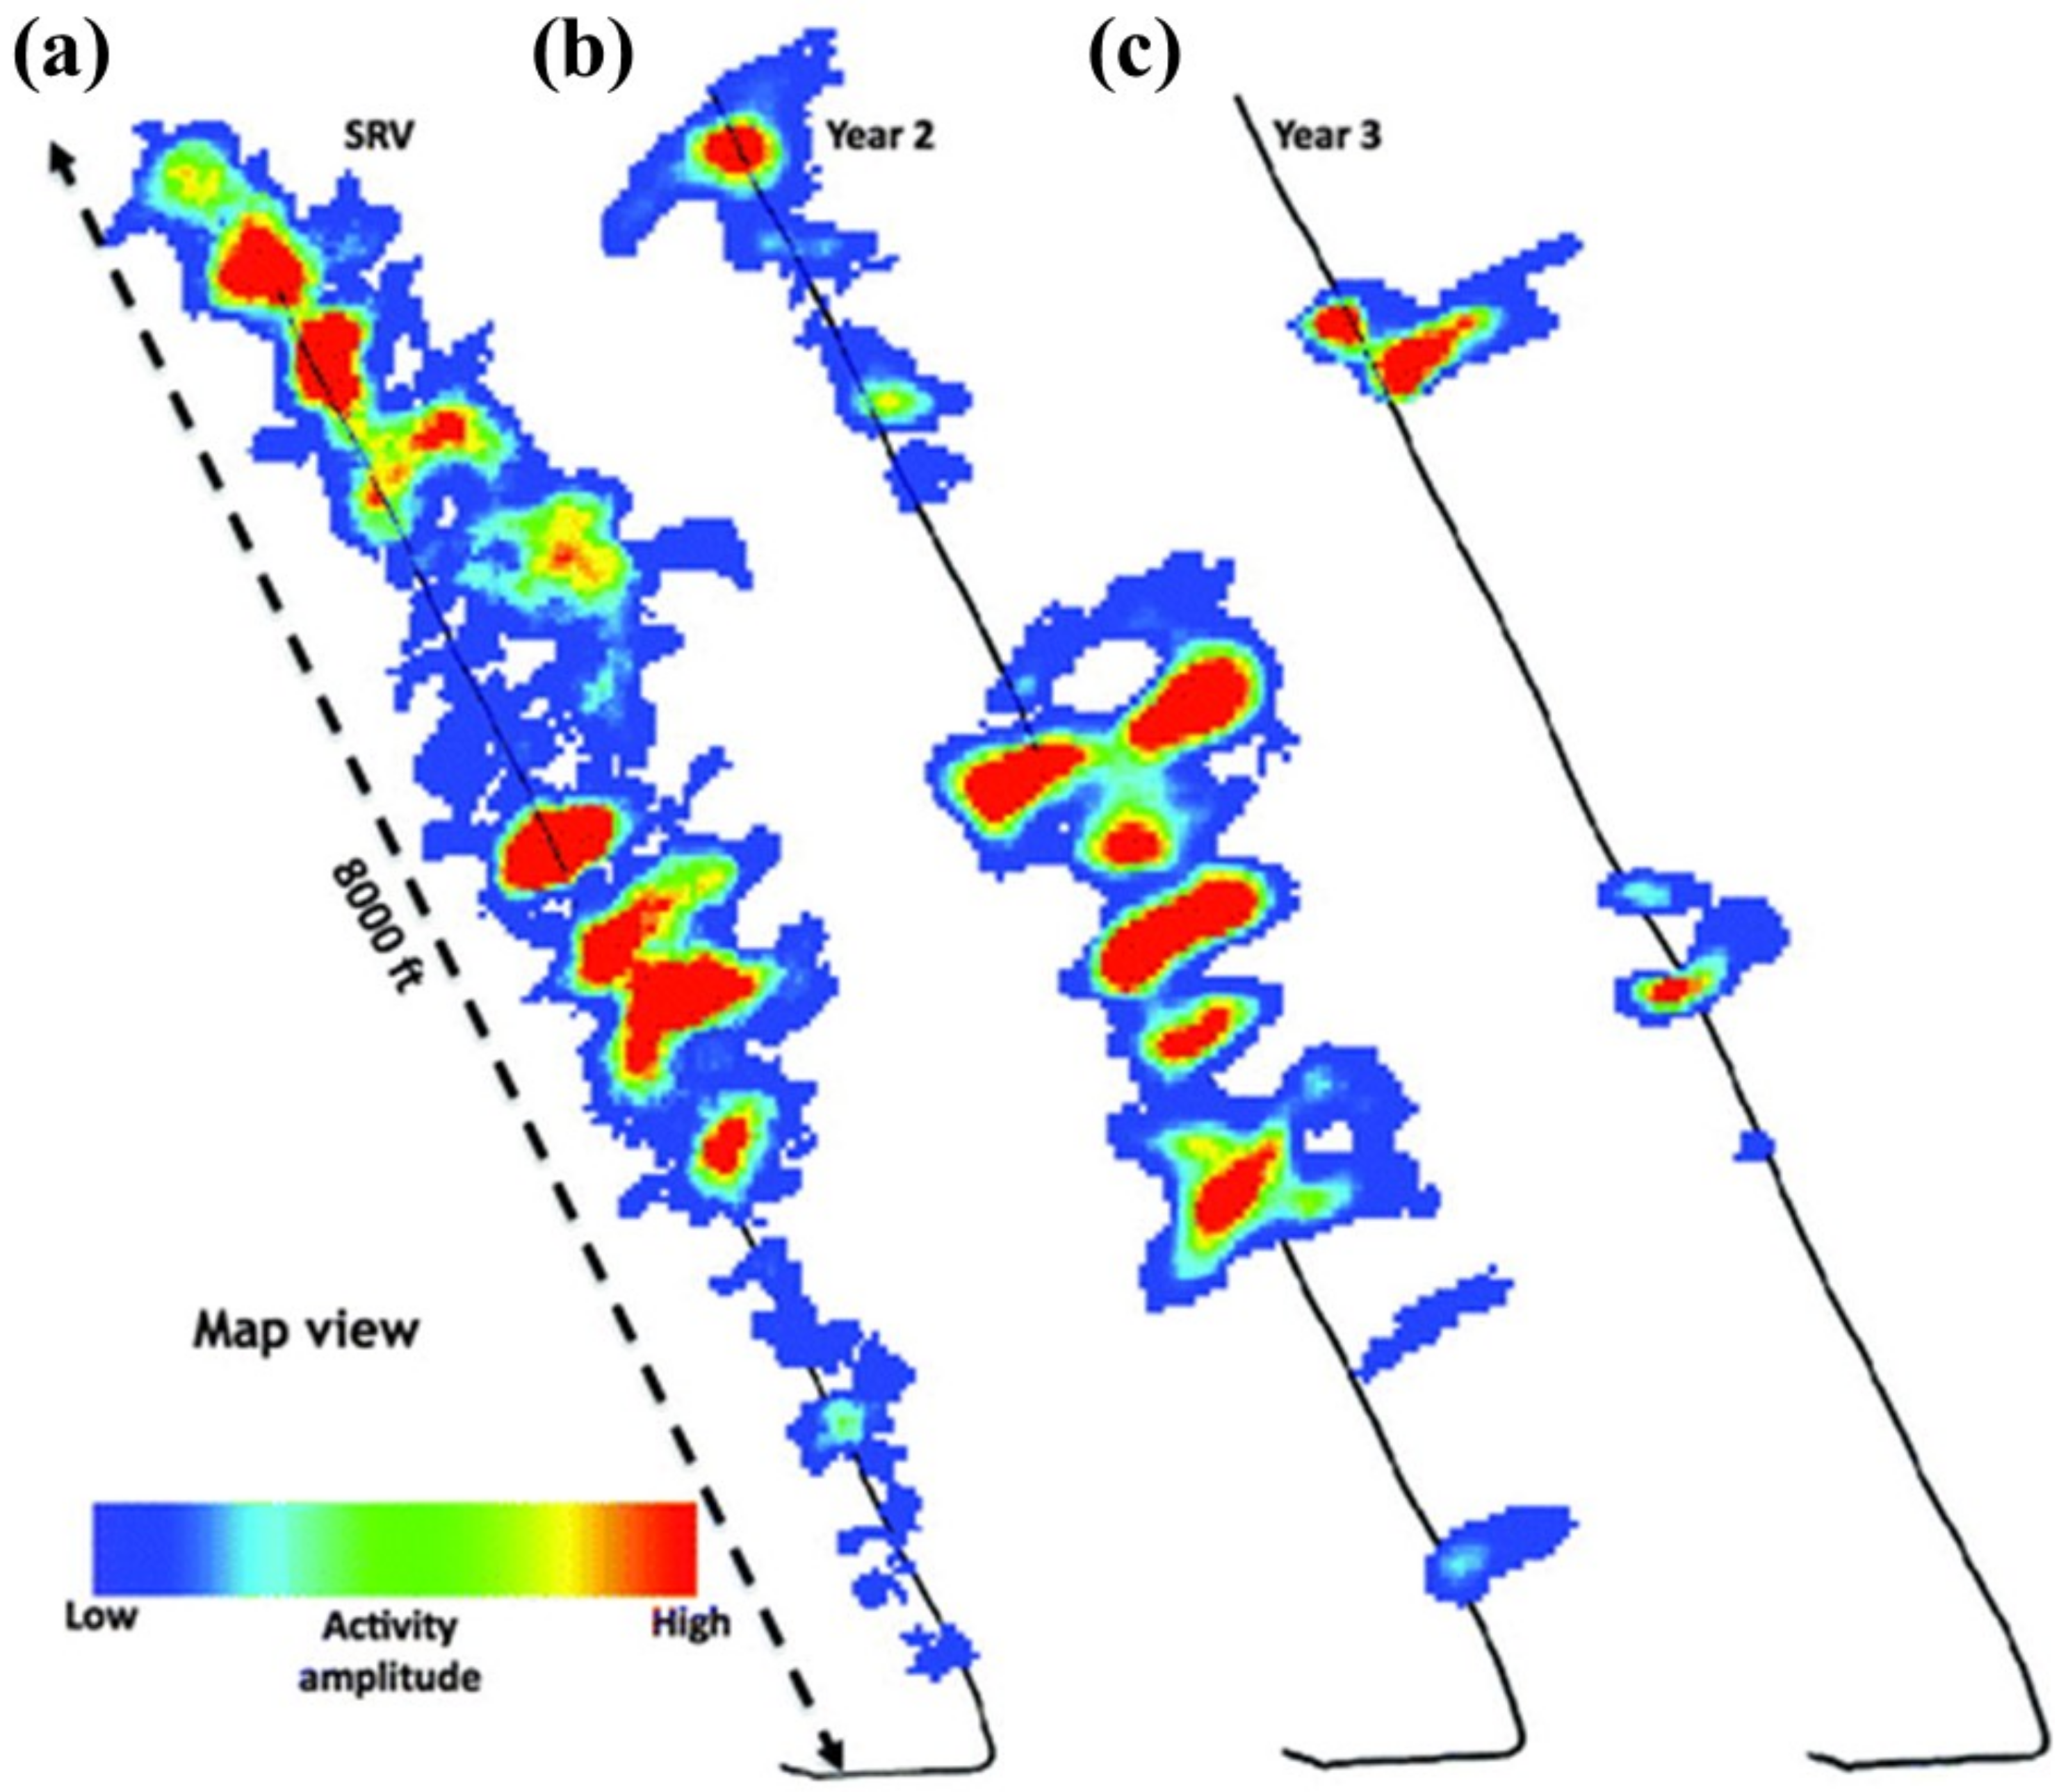
Streaming depth imaging (SDI) is the periodic or episodic recording of micro-seismic signals from fracture systems in the reservoir during production [37,38]. Such SDI monitoring can provide information on the so-called active production volume (APV), which is a longer-term counterpart of the stimulated rock volume (SRV) visualized by micro-seismic monitoring during fracture treatment only. An example of a time series for the SRV and subsequent APV generated from annual SDI monitoring is given in Figure 16.
Our insight from prior LSM models is that the micro-seismic signals during the SRV development show mainly slip on micro-fractures [39]. We interpret the SRV signals to occur in the regime of stress cages (Figure 8a and Figure 13a). The micro-seismic activity during APV monitoring is marked by longer-duration, low-frequency signals. The LSM models presented in the present paper highlight that such APV signals are likely to occur in a stress trajectory regime of fracture cages (Figure 8b and Figure 13b).

5. Recommendations

Armed with the conceptual insight gained from the models presented in this study, it is possible to formulate certain improvements of the hydraulic fracture treatment operational workflow and the subsequent well operations. Our recommendations are as follows:
(A) During the pumping of injection fluid into the stages.
  • First, place a limited set of first-generation perforation clusters, PF1.
  • Create the first generation of hydraulic fractures from PF1, termed HF1.
  • Next, create a second generation of perforation clusters PF2, between the prior PF1.
  • Keep HF1 pressurized, and then initiate, from PF2, the second-generation fractures, HF2.
  • The above schedule results in HF2 fractures curving transverse to HF1.
(B) During the production phase.
  • The bottomhole pressure should not be lowered further than needed for lift, because the hydraulic conductivity of the HF1 and HF2 will deteriorate with increased pressure differential between the reservoir and the bottomhole.
  • Keeping the well on natural flow, for as long as possible, will be best to prevent premature closure of HF1 and HF2.
  • When artificial lift is required, the bottomhole pressure (BHP) in the well should be gradually lowered, staying just below the threshold pressure to lift the fluid to the surface.
  • In undersaturated oil wells, the added advantage of keeping the BHP as high as possible for as long as possible, is that near-wellbore bubble-point effects will be minimized.
  • Although the time value of money concept urges operators to pump wells as quickly as possible, the insight gained from our study suggests that such pumping should be moderated to prevent premature decline of the well rate.

6. Conclusions

The present analysis used a recently developed linear superposition method (LSM) to produce the following new insights:
  • Stress trajectories can be rapidly visualized with LSM.
  • Principal stress orientations near hydraulic fractures may wander over time.
  • We show that two generations of such stress reversals occur.
  • A first reversal occurs during the fracture treatment intervention.
  • A second reversal occurs during production due to pressure depletion.
  • This new insight is important for improving fracture treatment operations.
The detailed analysis focused on the reversal of the principal stress orientations that may occur near hydraulic fractures of well systems used for energy extraction. At least two generations of stress reversals occur around the hydraulic fractures: an early, short-lasting episode occurs on the day of fracture treatment; a second generation of long-lasting stress reversals commences immediately after the onset of so-called flow-back. During these stress swaps, reservoir directions that were previously in compression subsequently exhibit extension, and directions previously stretching subsequently exhibit shortening.
The pressure change in the hydraulic fractures—from over-pressured to under-pressured (only held open by proppant packs)—causes the neutral points that separate domains with different stress states to migrate from locations transverse to the fracture to locations beyond the fracture tips. Understanding such detailed geo-mechanical dynamics, related to the pressure evolution in energy reservoirs, is extremely important for improving both the fracture treatment and the well operation, as future hydrocarbon and geothermal energy extraction projects emerge.

Author Contributions

Conceptualization, R.W. and J.W.; methodology, R.W.; software, J.W.; validation, R.W. and J.W.; formal analysis, R.W. and J.W.; investigation, R.W. and J.W.; resources, R.W.; writing—original draft preparation, R.W.; writing—review and editing, R.W. and J.W.; visualization, R.W. and J.W.; supervision, R.W.; project administration, R.W.; funding acquisition, R.W. Both authors have read and agreed to the published version of the manuscript.

Funding

The senior author would like to acknowledge the generous support provided by the College of Petroleum Engineering and Geosciences (CPG) at King Fahd University of Petroleum and Minerals (KFUPM). This work was further supported by the Human Resources Development program (No. 20194010201860) of the Korea Institute of Energy Technology Evaluation and Planning (KETEP) grant funded by the Korea government Ministry of Trade, Industry, and Energy.

Conflicts of Interest

The authors declare no conflict of interest.

References

  1. Fisher, M.K.; Heinze, J.R.; Harris, C.D.; Davidson, B.M.; Wright, C.A.; Dunn, K.P. Optimizing Horizontal Completion Techniques in the Barnett Shale Using Microseismic Fracture Mapping. In Proceedings of the SPE Annual Technical Conference and Exhibition, Houston, TX, USA, 26 September 2004. [Google Scholar]
  2. Guo, B.; Liu, X.; Tan, X. Petroleum Production Engineering, 2nd ed.; Gulf Professional Publishing: Houston, TX, USA, 2017. [Google Scholar]
  3. Parsegov, S.G.; Nandlal, K.; Schechter, D.S.; Weijermars, R. Physics-Driven Optimization of Drained Rock Volume for Multistage Fracturing: Field Example From the Wolfcamp Formation, Midland Basin. In Proceedings of the SPE/AAPG/SEG Unconventional Resources Technology Conference, Houston, TX, USA, 23–25 July 2018. [Google Scholar]
  4. Warpinski, N.R.; Branagan, P.T. Altered-Stress Fracturing. J. Pet. Technol. 1989, 41, 990–997. [Google Scholar] [CrossRef]
  5. Palmer, I.D. Induced Stresses Due to Propped Hydraulic Fracture in Coalbed Methane Wells. In Proceedings of the Low Permeability Reservoirs Symposium, Denver, CO, USA, 26–28 April 1993. [Google Scholar]
  6. Elbel, J.L.; Mack, M.G. Refracturing: Observations and Theories. In Proceedings of the SPE Production Operations Symposium, Oklahoma City, OK, USA, 21–23 March 1993. [Google Scholar]
  7. Siebrits, E.; Elbel, J.L.; Detournay, E.; Detournay-Piette, C.; Christianson, M.; Robinson, B.M.; Diyashev, I.R. Parameters Affecting Azimuth and Length of a Secondary Fracture During a Refracture Treatment. In Proceedings of the SPE Annual Technical Conference and Exhibition, New Orleans, LA, USA, 27–30 September 1998. [Google Scholar]
  8. Siebrits, E.; Elbel, J.L.; Hoover, R.S.; Diyashev, I.R.; Griffin, L.G.; Demetrius, S.L.; Wright, C.A.; Davidson, B.M.; Steinsberger, N.P.; Hill, D.G. Refracture Reorientation Enhances Gas Production in Barnett Shale Tight Gas Wells. In Proceedings of the SPE Annual Technical Conference and Exhibition, Dallas, TX, USA, 1–4 October 2000. [Google Scholar]
  9. Peirce, A.P.P.; Bunger, A.P.P. Interference Fracturing: Nonuniform Distributions of Perforation Clusters That Promote Simultaneous Growth of Multiple Hydraulic Fractures. SPE J. 2014, 20, 384–395. [Google Scholar] [CrossRef] [Green Version]
  10. Roussel, N.P.; Sharma, M.M. Strategies to Minimize Frac Spacing and Stimulate Natural Fractures in Horizontal Completions. In Proceedings of the SPE Annual Technical Conference and Exhibition, Denver, CO, USA, 30 October–2 November 2011. [Google Scholar]
  11. Sesetty, V.; Ghassemi, A. Numerical Simulation of Sequential and Simultaneous Hydraulic Fracturing. In Proceedings of the ISRM International Conference for Effective and Sustainable Hydraulic Fracturing, Brisbane, QLD, Australia, 20–22 May 2013. [Google Scholar]
  12. Roussel, N.P.; Sharma, M.M. Role of Stress Reorientation in the Success of Refracture Treatments in Tight Gas Sands. SPE Prod. Oper. 2012, 27, 346–355. [Google Scholar] [CrossRef]
  13. Mutalik, P.N.; Gibson, R.W. Case History of Sequential and Simultaneous Fracturing of the Barnett Shale in Parker County. In Proceedings of the SPE Annual Technical Conference and Exhibition, Denver, CO, USA, 21–24 September 2008. [Google Scholar]
  14. Waters, G.A.; Dean, B.K.; Downie, R.C.; Kerrihard, K.J.; Austbo, L.; McPherson, B. Simultaneous Hydraulic Fracturing of Adjacent Horizontal Wells in the Woodford Shale. In Proceedings of the SPE Hydraulic Fracturing Technology Conference, The Woodlands, TX, USA, 19–21 January 2009. [Google Scholar]
  15. Pham, T.; Weijermars, R. Solving stress tensor fields around multiple pressure-loaded fractures using a linear superposition method (LSM). Appl. Math. Model. 2020, 88, 418–436. [Google Scholar] [CrossRef]
  16. Pham, T.; Weijermars, R. Development of Hydraulic Fracture Hits and Fracture Redirection Visualized for Consecutive Fracture Stages with Fast Time-stepped Linear Superposition Method (TLSM). In Proceedings of the SPE/AAPG/SEG Unconventional Resources Technology Conference, Houston, TX, Texas, 20–22 July 2020. [Google Scholar]
  17. Shin, D.H.; Sharma, M.M. Factors Controlling the Simultaneous Propagation of Multiple Competing Fractures in a Horizontal Well. In Proceedings of the SPE Hydraulic Fracturing Technology Conference, The Woodlands, TX, USA, 4–6 February 2014. [Google Scholar]
  18. Roussel, N.P. Analyzing ISIP Stage-by-Stage Escalation to Determine Fracture Height and Horizontal-Stress Anisotropy. In Proceedings of the SPE Hydraulic Fracturing Technology Conference and Exhibition, The Woodlands, TX, USA, 24–26 January 2017. [Google Scholar]
  19. Soliman, M.Y.; East, L.E.; Adams, D.L. Geomechanics Aspects of Multiple Fracturing of Horizontal and Vertical Wells. SPE Drill. Completion 2008, 23, 217–228. [Google Scholar] [CrossRef]
  20. Weijermars, R.; Pham, T.; Ettehad, M. Linear superposition method (LSM) for solving stress tensor fields and displacement vector fields: Application to multiple pressure-loaded circular holes in an elastic plate with far-field stress. Appl. Math. Comput. 2020, 381, 125234. [Google Scholar] [CrossRef]
  21. Stepanova, L.; Computation Pavel, R.; Pavel, L. A Photoelastic Study for Multiparametric Analysis of the Near Crack Tip Stress Field Under Mixed Mode Loading. Procedia Struct. Integr. 2016, 2, 1797–1804. [Google Scholar]
  22. Sneddon, I.N. The distribution of stress in the neighbourhood of a crack in an elastic solid. Proc. R. Soc. A 1946, 187, 32. [Google Scholar]
  23. Lowengrub, M.; Sneddon, I.N. The distribution of stress in the vicinity of an external crack in an infinite elastic solid. Int. J. Eng. Sci. 1965, 3, 451–460. [Google Scholar] [CrossRef]
  24. Lowengrub, M.; Sneddon, I.N. Crack Problems in the Classical Theory of Elasticity. Soc. Ind. Appl. Math. 1969, 13, 2. [Google Scholar]
  25. Ramesh, K.; Sasikumar, S. Digital photoelasticity: Recent developments and diverse applications. Optics and Lasers in Engineering 2020, 135, 106186. [Google Scholar] [CrossRef]
  26. Weijermars, R.; Poliakov, A. Stream functions and complex potentials: Implications for development of rock fabric and the continuum assumption. Tectonophysics 1993, 220, 33–50. [Google Scholar] [CrossRef]
  27. Weijermars, R. Stress cages and fracture cages in stress trajectory models of wellbores: Implications for pressure management during drilling and hydraulic fracturing. J. Nat. Gas Sci. Eng. 2016, 36, 986–1003. [Google Scholar] [CrossRef]
  28. Thomas, N.; Weijermars, R. Comprehensive atlas of stress trajectory patterns and stress magnitudes around cylindrical holes in rock bodies for geoscientific and geotechnical applications. Earth-Sci. Rev. 2018, 179, 303–371. [Google Scholar] [CrossRef]
  29. Wang, J.; Weijermars, R. New Interface for Assessing Wellbore Stability at Critical Mud Pressures and Various Failure Criteria: Including Stress Trajectories and Deviatoric Stress Distributions. Energies 2019, 12, 4019. [Google Scholar] [CrossRef] [Green Version]
  30. Weijermars, R.; Schultz-Ela, D. Visualizing Stress Trajectories around Hydraulically Pressurized Wellbores. In Proceedings of the SPE/EAGE European Unconventional Resources Conference and Exhibition, Vienna, Austria, 20–22 March 2012. [Google Scholar]
  31. Weijermars, R.; Zhang, X.; Schultz-Ela, D. Unrecognized ‘fracture caging’ could make shale gas drilling safer and more profitable. First Break 2012, 30, 2. [Google Scholar] [CrossRef]
  32. Weijermars, R.; Zhang, X.; Schultz-Ela, D. Geomechanics of fracture caging in wellbores. Geophys. J. Int. 2013, 193, 1119–1132. [Google Scholar] [CrossRef] [Green Version]
  33. Wang, J.; Weijermars, R. Expansion of Horizontal Wellbore Stability Model for Elastically Anisotropic Shale Formations With Anisotropic Failure Criteria: Permian Basin Case Study. In Proceedings of the 53rd U.S. Rock Mechanics/Geomechanics Symposium, New York, NY, USA, 23–26 June 2019. [Google Scholar]
  34. Weijermars, R.; Wang, J.; Nelson, R. Stress concentrations and failure modes in horizontal wells accounting for elastic anisotropy of shale formations. Earth-Sci. Rev. 2020, 200, 102957. [Google Scholar] [CrossRef]
  35. Weijermars, R.; Wang, J.; Pham, T. Borehole Failure Mechanisms in Naturally and Hydraulically Fractured Formations Investigated With a Fast Time-Stepped Linear Superposition Method (TLSM). In Proceedings of the 54th U.S. Rock Mechanics/Geomechanics Symposium, On-line; 2020. [Google Scholar]
  36. Raterman, K.T.; Farrell, H.E.; Mora, O.S.; Janssen, A.L.; Gomez, G.A.; Busetti, S.; McEwen, J.; Friehauf, K.; Rutherford, J.; Reid, R.; et al. Sampling a Stimulated Rock Volume: An Eagle Ford Example. SPE Reserv. Eval. Eng. 2018, 21, 927–941. [Google Scholar] [CrossRef]
  37. Sicking, C.; Vermilye, J.; Lacazette, A. Predicting Frac Performance and Active Producing Volumes Using Microseismic Data. In Proceedings of the SPE/AAPG/SEG Unconventional Resources Technology Conference, San Antonio, TX, USA, 20–22 July 2015. [Google Scholar]
  38. Sicking, C.; Vermilye, J.; Yaner, A. Forecasting reservoir performance by mapping seismic emissions. Interpretation 2015, 5, 9. [Google Scholar] [CrossRef]
  39. Weijermars, R.; Wang, J. Analyzing Data from the Hydraulic Fracture Test Site (Permian Basin) with the Linear Superposition Method (LSM). In Proceedings of the 55th US Rock Mechanics/ Geomechanics Symposium, Houston, TX, USA, 20–23 June 2021. [Google Scholar]
Figure 1. (a) Wellbore schematic of multi-fractured horizontal well completed with so-called plug and perf method (after Guo et al. [2]). In this example, each fracture stage has three perforation clusters from where the fractures are initiated during the fracture treatment. (b) Typical orientation of the principal stresses relative to the horizontal well direction immediately prior to hydraulic fracturing.
Energies 14 03256 g001
Figure 2. (a,b) Color fringes in photo-elastic methods visualizing strain magnitude contours around two fractures stressed in the vertical direction of the image, which is dynamically similar to the case of pressure-loaded fractures. Photo-elastic method modified from Stepanova et al. [21]. (c,d) Corresponding solutions obtained with LSM code using input values given in Table 1 and algorithms summarized in Section 2 of this paper. The color bar shows strain intensity.
Energies 14 03256 g002
Figure 3. (a) Photo-elastic color fringes in pressured in visualizing strain magnitude contours, after Ramesh and Sasikumar [25]. Original image kindly provided by Dr. Ramesh. (b) Corresponding solutions obtained with LSM code. The color bar shows strain intensity.
Energies 14 03256 g003
Figure 4. Stress trajectory solutions (ac) for the three fracture constellations shown in Figure 2 and Figure 3. A far-field anisotropic stress field is present, with the largest compressional principal stress trajectories outlined in blue and the least principal stress trajectories outlined in green. Red dots mark neutral points, i.e., locations where the magnitude of the two principal stresses in the plane of view are equal.
Energies 14 03256 g004
Figure 5. Coordinate system used for the stress analysis in the matrix rock near three pressure-loaded hydraulic fractures (not to scale). Apertures of the hydraulic fractures in this conceptual drawing are vastly exaggerated; in reality, fracture walls are about 2–3 cm apart during the pressure-loading phase of the fracture treatment.
Energies 14 03256 g005
Figure 6. Coordinate system for Sneddon analytical solution modified to account for transformation and rotation of a hydraulic fracture parallel to the X-axis.
Energies 14 03256 g006
Figure 7. Stress trajectory solutions (a) when only the in-situ stress is adopted for the stress trajectory, (b) when the fracture net pressure is 20 MPa (the neutral points (red dots) are located at (x, y) = (7.86, 0) and (x, y) = (−7.86, 0); two more neutral points occur at the x = 0 line, beyond the field of view), (c) when the fracture net pressure is 10 MPa. There are four pairs of neutral points (red dots). The red dashed ellipse marks a so-called stress cage. (d) The principal stresses (in MPa) at x = 0, plotted along the line between (x, y) = (0, 0) and (x, y) = (0, 20). Crossings correspond to neutral points, where both of the principal stresses have the same magnitude, and their ranking based on magnitude σ1 > σ2 > σ3 becomes indeterminate. A far-field anisotropic stress field is present, with the largest compressional principal stress trajectories outlined in blue and least principal stress trajectories outlined in green.
Energies 14 03256 g007
Figure 8. Stress trajectory solutions for hydraulic fracture (solid red bar). (a) Stress cage (dashed red upright ellipse) for PNET = +20 MPa. (b) Fracture cage (dashed red horizontal ellipse) for PNET = -20 MPa. A far-field anisotropic stress field is present, with the largest compressional principal stress trajectories outlined in blue and the least principal stress trajectories outlined in green.
Energies 14 03256 g008
Figure 9. Stress trajectory patterns for wellbores. (a) Stress cage (dashed red upright ellipse) for PNET = +5 MPa. (b) Fracture cage (dashed red horizontal ellipse) for PNET = −5 MPa. Modified from Wang and Weijermars [29]. A far-field anisotropic stress field is present, with the largest compressional principal stress trajectories outlined in blue and the least principal stress trajectories outlined in green.
Energies 14 03256 g009
Figure 10. (a) Vertical wellbore penetrating horizontally layered sedimentary sequence with no tectonic stress component. (b) Spider web stress trajectory pattern around over-pressured (overbalanced) wellbore. The direction of preferred tensional failure (incipient fractures indicated by black spikes) is parallel to the largest principal stress trajectories (deviatoric compression τ1 = σ1P), normal to the least principal stress trajectories (deviatoric tension, τ3 = σ3P). Breakout cannot occur, due to unfavorable shear stress orientations. (c) Stress trajectory patterns around under-pressured wellbore. The direction of preferred tensional failure (solid black circles) follows concentric rings, due to a reversal of the principal stresses around under-pressured (underbalanced) wellbores. Breakouts may occur in all radial directions, due to favorable shear stress orientations. Modified from Weijermars and Schultz-Ela [30].
Energies 14 03256 g010
Figure 11. Stress magnitude contours (top row), principal stress trajectories (middle row), and slip lines for breakouts (bottom row) for (a) overbalanced, (b) balanced, and (c) underbalanced wellbores. Red dots are neutral points. Blue trajectories are for the largest principal stresses (deviatoric compression τ1 = σ1P). Green trajectories are for the smallest principal stresses (deviatoric tension, τ3 = σ3P). The yellow ellipse on the bottom left outlines the stress cage. The blue ellipse on the bottom right outlines the fracture cage. The pink triangle shows the potential breakout region. Modified from Thomas and Weijermars [28].
Energies 14 03256 g011
Figure 12. Stress trajectory patterns around hydraulic fractures without any regional stress anisotropy. (a) During fracture treatment, when over-pressure must exist for the fracture opening and proppant emplacement. (b) During flow-back, when under-pressure conditions prevail. Blue trajectories are for the largest principal stresses (deviatoric compression τ1 = σ1 − P). Green trajectories are for smallest principal stresses (deviatoric tension, τ3 = σ3 − P).
Energies 14 03256 g012
Figure 13. Stress magnitude contours (top row), principal stress trajectories (middle row), and slip lines (dashed in blue, bottom row) for (a) over-pressured, (b) balanced, and (c) under-pressured hydraulic fractures. Red dots are neutral points and red curves outline the fracture cage (in a) and stress cage (in c). Blue trajectories are for the largest principal stresses (deviatoric compression τ1 = σ1 − P). Green trajectories are for smallest principal stresses (deviatoric tension, τ3 = σ3 − P). The yellow ellipse on the bottom left outlines the stress cage. The blue ellipse on the bottom right outlines the fracture cage. The pink triangle shows the potential breakout region.
Energies 14 03256 g013
Figure 14. Stress state maps for (a) over-pressured hydraulic fracture and (b) under-pressured hydraulic fracture. Red regions have σ1 and σ3 both compressive, blue regions have σ1 and σ3 both tensile, and green regions have σ1 compressive and σ3 tensile.
Energies 14 03256 g014
Figure 15. Rapid changes in the local stress and pressure field occur during the fracking of individual stages as inferred from distributed acoustic sensing (DAS). Modified from Raterman et al. [36].
Energies 14 03256 g015
Figure 16. Changes in APV along the wellbore during the initial hydraulic fracturing and at two later times. (a) The activated fractures (SRV) during hydraulic fracturing. (b) The producing (APV) volume after 2 years of production. (c) The APV after 3 years of production. After [38].
Energies 14 03256 g016
Table 1. Basic input parameters for analysis (synthetic example).
PropertyAndersonian Stress State: Strike-Slip Basin
σ v (kPa/m)22.6
σ H (kPa/m)24.9
σ h (kPa/m)20.4
Pore pressure gradient (kPa/m)10.2
Assumed TVD (m)2000
Fracture spacing (m)10
Fracture half-length (m)10
Poisson’s ratio, ν0.25
Young’s modulus, E (GPa)40
Table 2. Conversion of principal stresses to stress tensor components.
Typical Stress GradientsStrike-Slip Basin
σ v (kPa/m) σ z = σ z z = 22.6   [ kPa / m ] z   [ m ]
σ H (kPa/m) σ x = σ x x = 24.9   [ kPa / m ] z   [ m ]
σ h (kPa/m) σ y = σ y y = 20.4   [ kPa / m ] z   [ m ]
Publisher’s Note: MDPI stays neutral with regard to jurisdictional claims in published maps and institutional affiliations.