Article

Hydraulic Fracturing Simulations with Real-Time Evolution of Physical Parameters

1
Key Laboratory of Petroleum Resources Research, Institute of Geology and Geophysics, Chinese Academy of Sciences, Beijing 100029, China
2
Innovation Academy for Earth Science, CAS, Beijing 100029, China
3
University of Chinese Academy of Sciences, Beijing 100049, China
4
Institute of Geophysics, China Earthquake Administration, Beijing 100081, China
*
Author to whom correspondence should be addressed.
Energies 2021, 14(6), 1678; https://doi.org/10.3390/en14061678
Submission received: 2 December 2020 / Revised: 28 December 2020 / Accepted: 12 March 2021 / Published: 17 March 2021
(This article belongs to the Special Issue Modelings and Analysis of Hydraulic Fracturing in Reservoirs)

Abstract

:
During hydraulic fracturing, expansion of internal micro-fractures deforms the rock to different extents. Numerical studies typically assume fixed parameters; however, in the field site, parameters are likely to vary. Error accumulation underlies deviation of simulation results from actual data. In this study, it was found that the mean velocity of an in-lab active source obtained from the hydraulic fracturing experiment decreased. To explain the effect of physical parameter (velocity) on numerical simulation results, we performed numerical simulations based on the extended finite element method (XFEM) of indoor hydraulic fracturing considering the velocity variation. The simulation results considering the change of the physical parameter (velocity) of the rock sample reflect the rock damage evolution more exactly. Consequently, the real-time evolution of physical parameters during hydraulic fracturing should be considered in numerical simulations. Rock damage evolution can be better captured using the offered modification of physical parameters. The present work provides theoretical guidance for hydraulic fracturing simulations to some extent.

1. Introduction

In recent years, hydraulic fracturing technology has been widely used in the petroleum industry, especially in unconventional oil and gas exploration [1,2,3,4]. The construction design of on-site hydraulic fracturing has a profound effect on the fracturing results and productivity. How to determine the optimal construction design parameters is an important issue, and it is also a difficult problem in the study of hydraulic fracturing theory. The hydraulic fracturing problems have been studied experimentally and numerically [5,6,7,8,9,10].
However, the results of numerical simulations often deviate from actual data [11]. During numerical analysis, selecting rock physical parameters strongly affects the reliability and the stability of analysis results. In particular, results are shown to depend on the values of physical parameters [12,13]. Typically, in numerical simulations, physical parameters are assumed to have constant values. However, during engineering operations, rock is always disturbed by the operations to some extent. These disturbances result in changes in the values of the corresponding rock physical parameters. Many studies addressed the change of parameters [14,15]. During a hydraulic fracture experiment, an acoustic emission (AE) waveform recording system was used to monitor the velocity change [16]. Zhai et al. [17] performed a hydraulic fracturing experiment based on Longmaxi shale, which is the main formation of shale gas production in China. Those authors simulated the fluid injection and rock damage processes and studied the sensitivity of seismic velocity and the variation of attenuation, and the results from microseismic monitoring at the field site were changed in real-time. Large amounts of the fracturing fluid and proppant were injected into the treated rock formation [18]. Along with this process, the rock properties of the corresponding layer changed significantly; in particular, the rock velocity became more sensitive to the fluid injection, which could not be ignored in the fracturing process.
Therefore, the real-time evolution of physical parameters is taken into consideration in research. Zhang et al. [19] constructed a real-time velocity model of the fracturing process, by fracture compliances, to approximate the influence of fractures and pore pressure on the rock elastic parameters. They showed that the results deviated from the actual source data, and the deviation increased as the ray trace propagated in the fracturing domain when the velocity variation was overlooked. Many studies addressed the need to consider real-time changes of the physical parameter values. Calibration of dynamic parameters using the rate transient analysis (RTA) method was established. This method could reduce the uncertainty of reservoir descriptions [20]. Forward modeling demonstrated that the equivalent velocity was feasible and effective for real-time processing in the conditions by location accuracy for field processing of actual array microseismic data [21]. Bosman et al. [22] performed dynamic parameter analysis of microseismicity to estimate primary production volumes of unconventional shale reservoirs. Javadpour et al. [23] studied the influence of slip-corrected permeability on fracture network and fluid loss during hydraulic fracturing. The simulation results and other aspects related to actual fracture growth are also different. Maity and Ciezobka [24] performed an experiment based on the core from the Permian Basin and found that stress changes and the degree of natural fracturing were related to the local propping agent of the core.
Other scholars have performed significant work by revising the existing theoretical models. Gidley [25] developed a method that extended the dimensionless fracture conductivity concept to the design of fracture conductivity in wells, which would be produced at rates that led to fractures in non-Darcy flow directions. The first principal stress tensile stress criterion for brittle material was supplied and modified [26]. A new method for predicting pore pressure based on compression velocity and acoustic propagation time was proposed by modifying the pore pressure prediction method using the depth-dependent normal compaction equation [27]. Liu et al. [28] presented a new model that could fully characterize the evolution of fracture height under various formation characteristics through theoretical and numerical study. Furthermore, the phenomenon of “second pair solution” was well explained by the new model. In other areas, analog parameter corrections have been effectively applied. Oterkus et al. [29] proposed a new fully coupled dynamic formula of porous elastic surrounding rock, and it was proved that this formulation was also applicable when the fracture was filled with fluid. At a much finer scale, Rohmer and Seyedi [30] presented a large-scale hydromechanical numerical calculations by sequential coupling of a multiphase fluid flow (TOUGH2) with a hydromechanical calculation code (Code_Aster), and it was applied to evaluate the safety of cover during CO2 geological sequestration. Zhou et al. [31] discussed the applicability of three sets of formulations based on the CFD-DEM method. A fully coupled hydromechanical model with explicit fracture flow was proposed. Compared with the continuous coupled model, this model had the advantage of solving simultaneously [32]. Davydzenka et al. [33] studied the effects of wettability and other parameters on deformation in porous media by numerical simulation on a porous medium based on the fictitious domain methodology.
The development presented in this paper used the indoor hydro-fracturing experiment and analysis results. From the perspective of rock damage mechanics, the influence of the rock damage evolution on the rock physical parameter (velocity) was studied. Based on the change of physical parameter during the experiment, we provided the simulations based on the extended finite element method (XFEM) to illustrate the effect of real-time evolution of a physical parameter (velocity) on numerical simulation results.

2. Laboratory Hydraulic Fracturing Experiment

In this paper, we conducted a hydraulic fracturing experiment on a sandstone sample from the Yanchang-6 formation in the Ordos Basin. According to the experimental standard of rock mechanics, the ratio of length to width of the rock sample was 2.5:1, the diameter was 50 mm, and the standard cylindrical core was 125 mm long. Considering fluid injection, we made a cylindrical hole (diameter, 5 mm; length, 75 mm) in the center of the studied rock sample, as shown in Figure 1.
Before the test, medical X-ray computed tomography (CT) scanning equipment (Aquilion ONE TSX 301A, Toshiba Medical Systems Corp., Kyoto, Japan, belonging to RITE) was used to analyze the structure of the rock sample and pre-existing fractures. Figure 2 showed the original rock core CT scan image.
This experiment was conducted using a three-axis compression device and a multi-channel acoustic emission wave information acquisition system from Japan Industrial Technology Research Institute. The experimental platform mainly included the following systems [34]: (1) a waveform recording system, (2) a stress/strain recording and switching system, (3) a load control system, and (4) a flow control system. Axial stress loading was performed using a single-axis compressor mainly controlled by the stress loading. According to different experimental purposes, the loading mode of the axial stress and the loading rate were controlled by a servo system. Control oil was pumped through a pipe to apply pressure on the rock pressure vessel. The dead time of the system acquisition was under 200 μs, making it possible to record more than 5000 acoustic emission waveform data in one second. Therefore, for the instantaneous failure of the hydraulic fracturing problem, the experimental system could record most of the acoustic emission events, which provided a solid foundation for the subsequent experimental data processing.
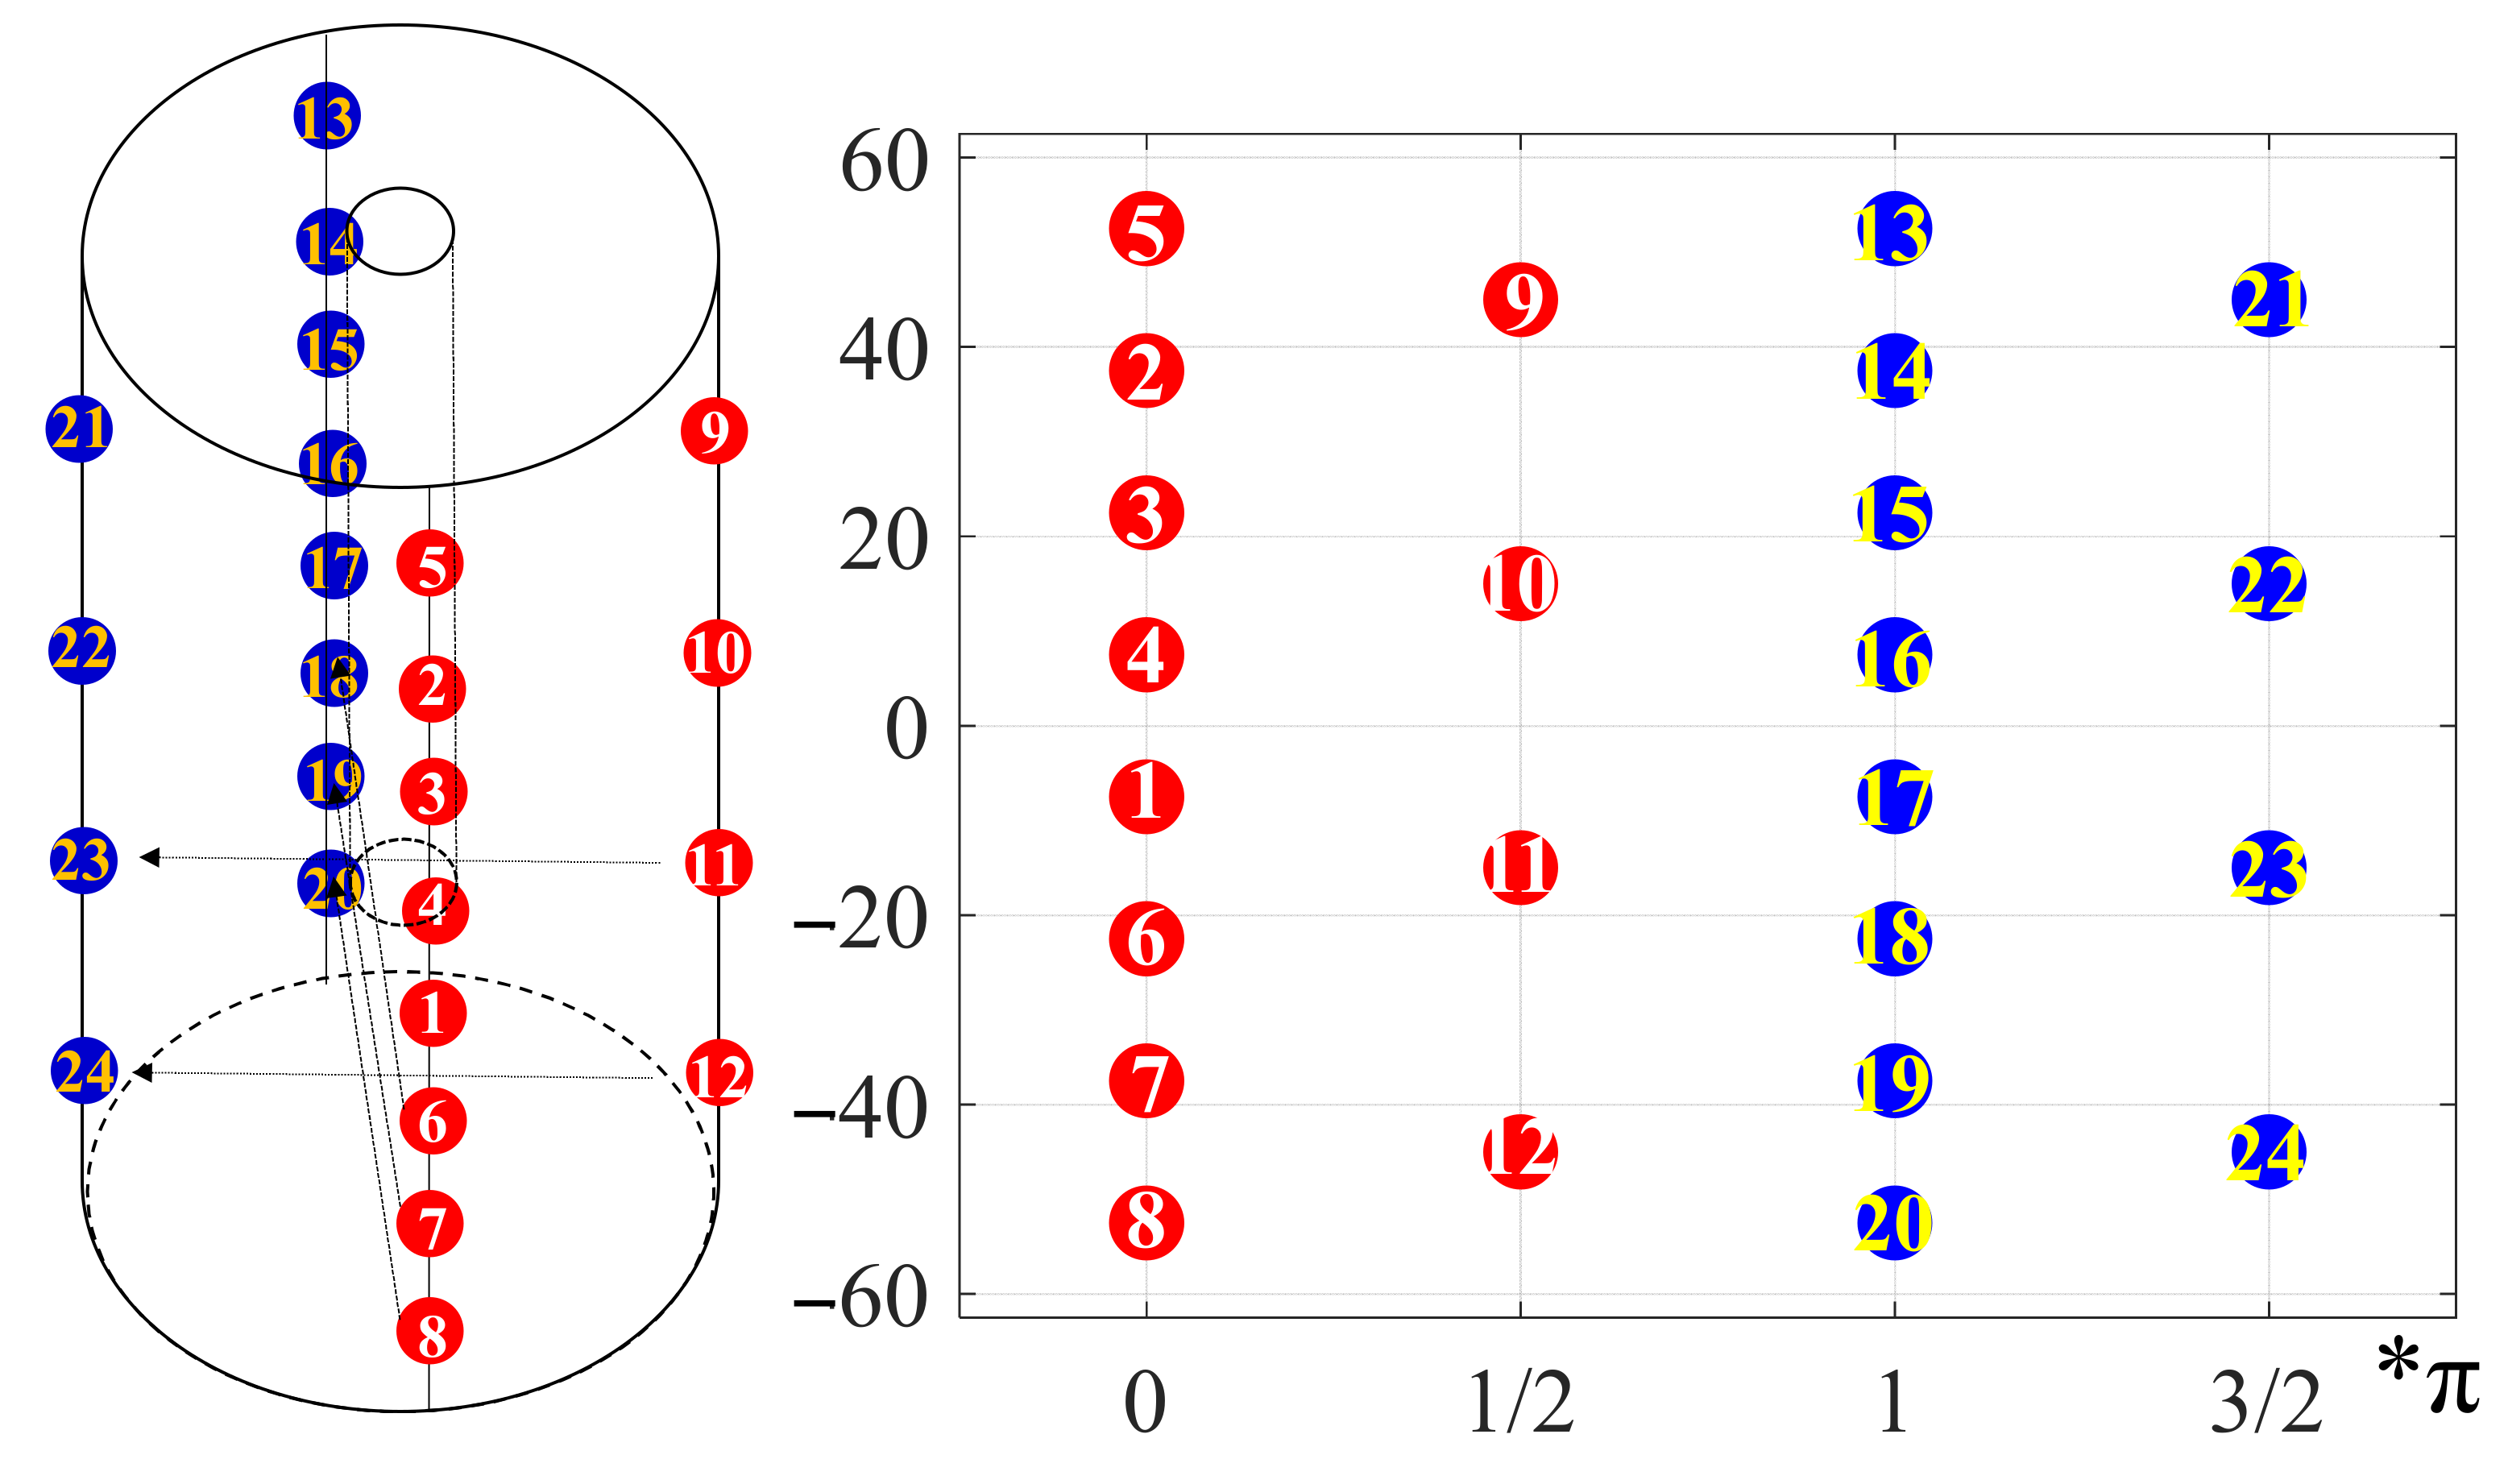
To record the acoustic emission signals generated by hydraulic fracturing during the whole process, 24 piezoelectric sensors (PZT) were installed on the surface of the core, as shown in Figure 3. PZT 1–12 acted as the pulse source emission, while PZT 13–24 served as the receiving sensors. P-waveforms were received by the waveform acquisition system, which consisted mainly of a preamplifier and a 24-channel full-waveform high-speed digital-to-analog converter, with a maximal sampling rate of 100 MHz and resolution of 16 bits. After the 40 dB amplifier, the received signal indicated the corresponding waveform acquisition card. Waves of PZT6-18 (PZT6 acted as pulse source emission and PZT18 acted as the receiver) were shown in Figure 4. We picked up the first arrival of each waveform according to the first motion (red line in Figure 4). Then the travel time was calculated by the time difference between the emission time of the pulse source (blue line in Figure 4), which was decided by the multi-channel acoustic emission wave information acquisition system [34] and the time of the first arrival of each waveform. Furthermore, P-wave velocity was determined by the travel time and the distance between the pulse source emission and the receiving sensor.
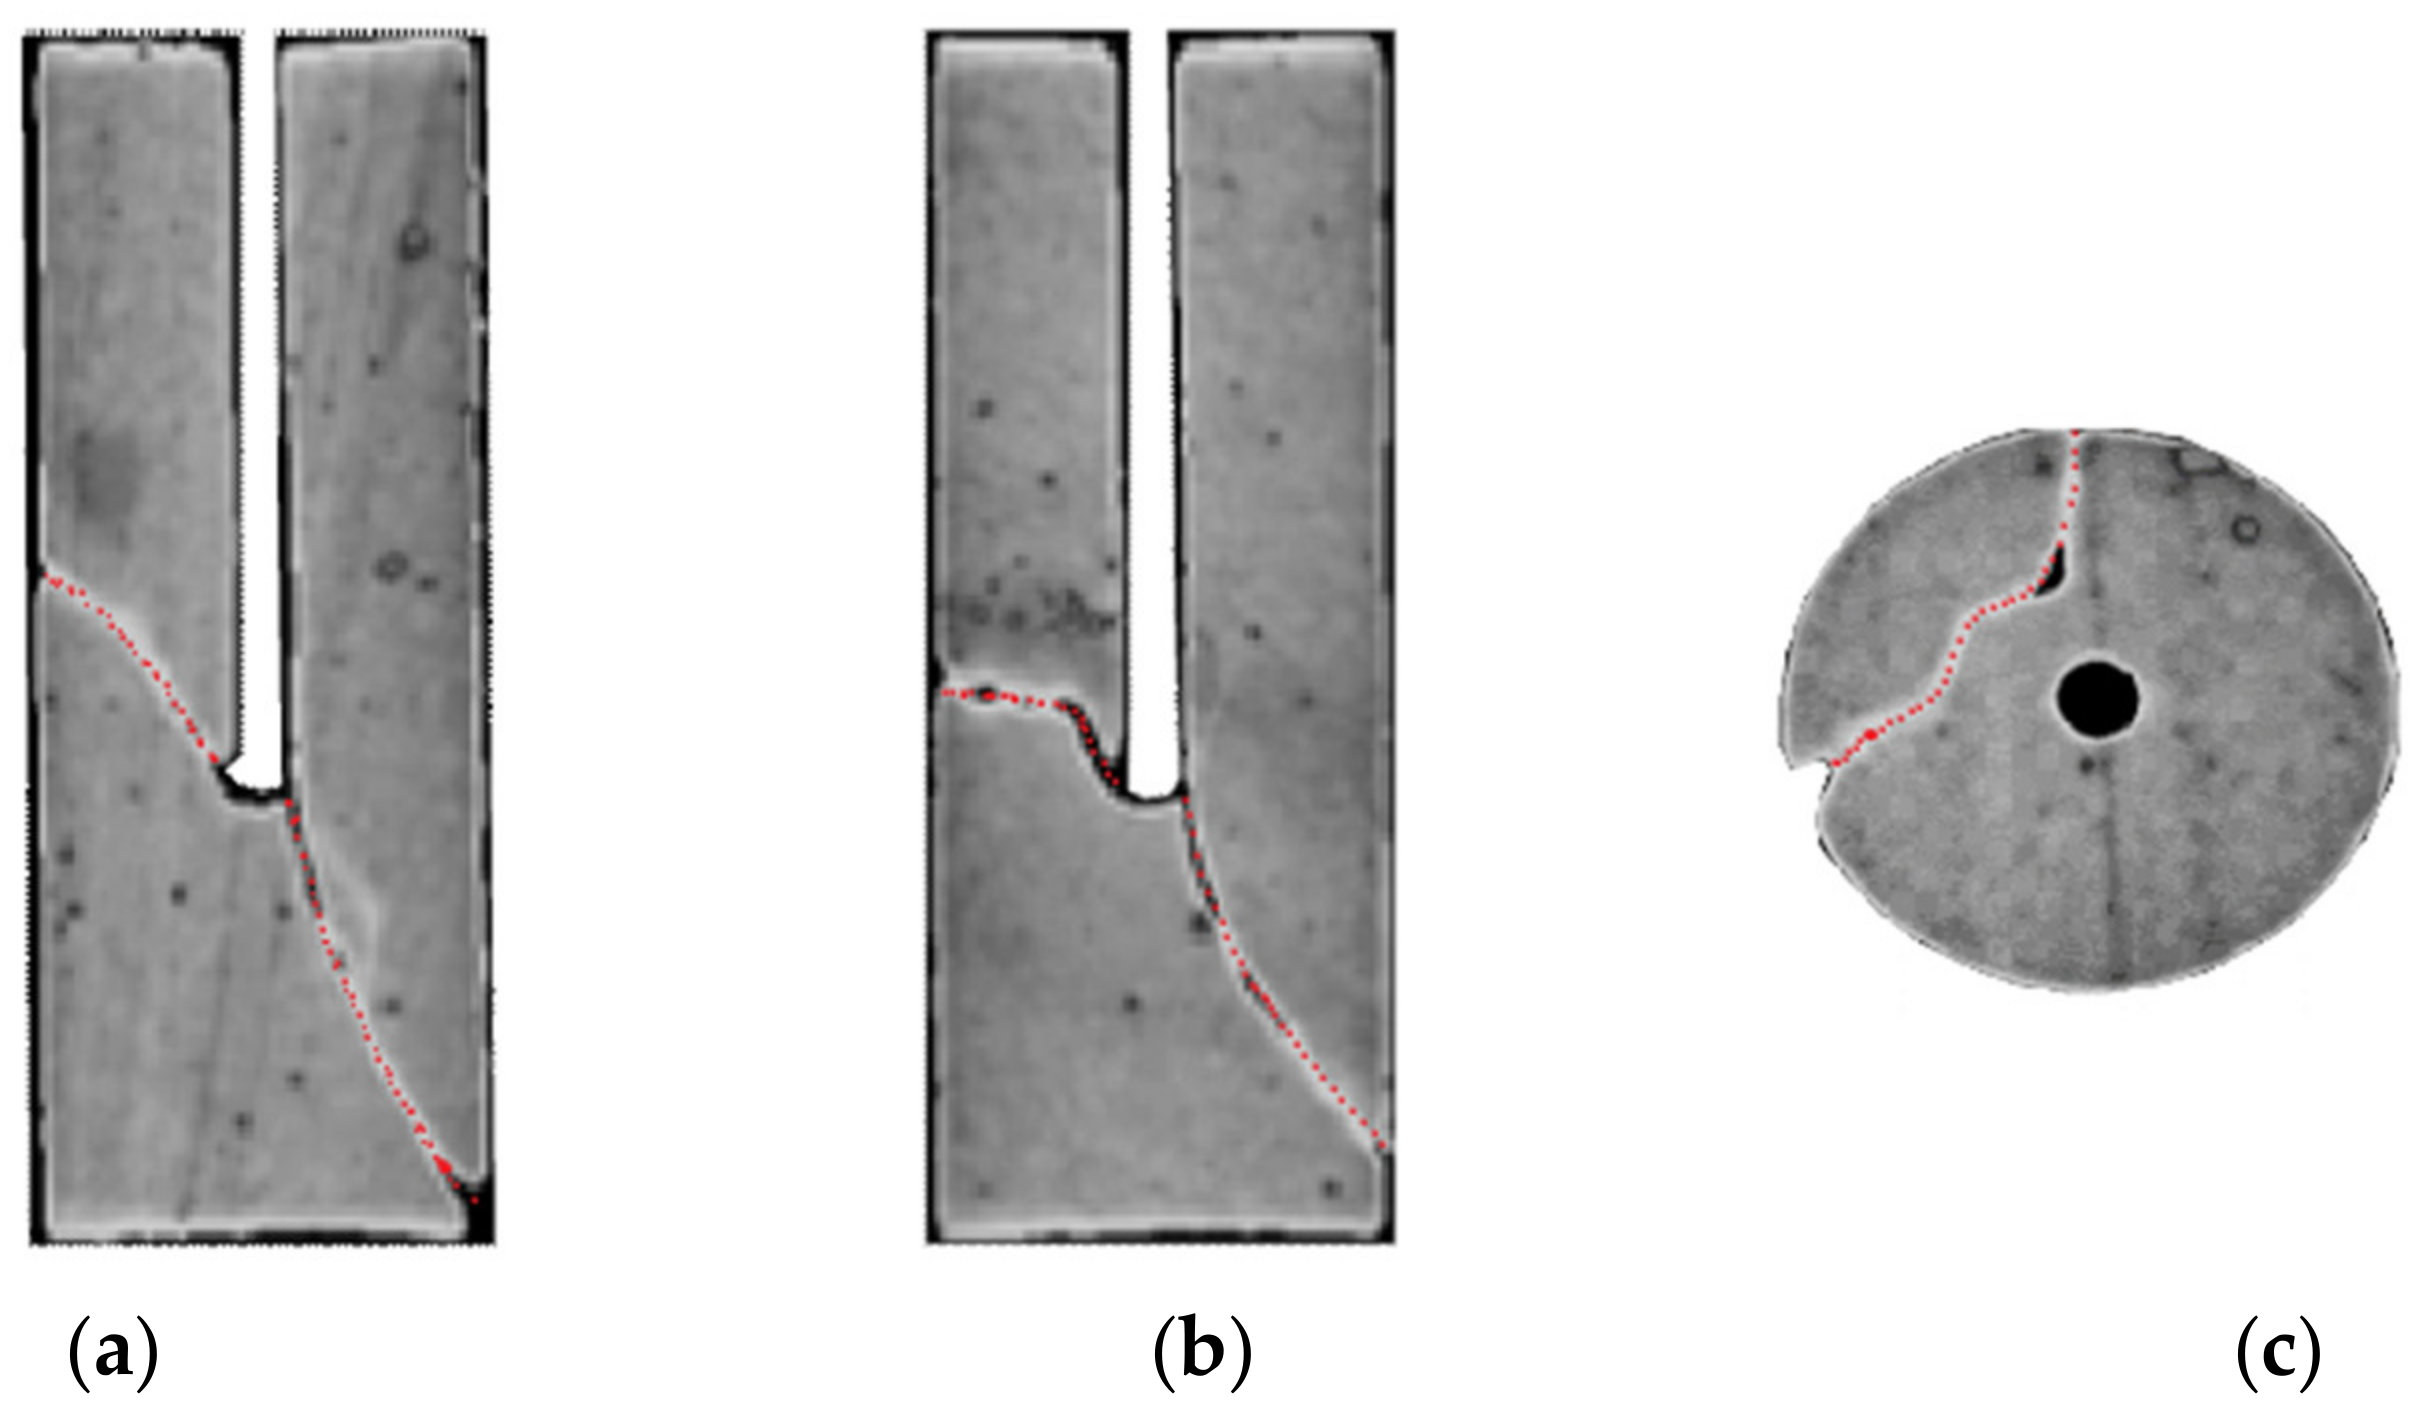
Figure 5a shows the P-velocities along the 5 horizontal paths (Figure 3), which were PZT6–18, 7–19, 8–20, 11–23, and 12–24, respectively. Figure 5b shows the axial compression (σa), confining pressure (σc), inlet fluid pressure (Pi), and AE cumulative number throughout the entire experiment. The major load/unload steps were as follows: (1) the axial compression was increased to 176 MPa and the confining pressure (σc) was increased to 35.5 MPa at a slow rate; (2) the axial compression and the confining pressure were kept constant to make sure the sample was stable, and then fluid was injected to simulate the process of hydraulic fracturing, and the inlet pressure was increased to 14 MPa over a few seconds, and velocity was measured and did not change significantly at the initial stage of pumping; (3) the axial loading stress was reduced from 176 MPa to 29 MPa in about 300 s until a final dynamic fracture, and the velocity decreased and AE events were increased from 4450 to 24,710 during the dynamic fracture; the pressure decreased in this short time due to the damage of the rock sample, and the increase in the cumulative number of AE events could also explain the phenomenon; (4) reloading the axial loading stress until 83 MPa and the velocity increased; (5) at the beginning of the phase for a short period of time, inlet pressure and AE events increased and the axial compression decreased, and then the axial loading pressure and confining pressure remained constant, and velocity changed smoothly; (6) unloading the pressure, and velocity decreased and AE events increased during this phase. The experiment after the failure event was analyzed by X-ray CT scans, and CT scanning profiles of the sample after hydraulic fracturing are shown in Figure 6. According to the observation results, it was known that the velocity of the rock sample changed during the whole process, and from the perspective of Shen et al. [35], P-velocity was affected by microstructures. Therefore, it was necessary to consider real-time evolution of the physical parameter (velocity) in the numerical simulation.

3. Methodology

Hydraulic fracturing is a multi-field coupled problem with complex mechanics; based on ABAQUS, the extended finite element method (XFEM) was used to study the damage process of the rock sample [36].
Dolbow [37] developed the extended finite element method (XFEM), which significantly improved crack modeling. To introduce the discontinuous field on the crack surface far from the crack tip, Moës et al. [38] developed a generalized Heaviside function and simple rules for crack tip enrichment.
The shape function at any point can be expressed as follows:
u = i = 1 N N i x u i + H x a i + α = 1 4 F α x b i α
where N i (x) are shape functions of conventional nodes, u i is the degree of freedom vector of the conventional mesh node, a i is the enriched degree of freedom vector of the mesh node where the crack surface is located, b i α is the enriched degree of freedom vector of the mesh node where the crack tip is located, H x is the Heaviside function across the crack surfaces presented by Moës et al. [38], and F α x is the enrichment function used in the element cut by the crack tip.
The Heaviside function can be described as
H x = 1                               i f x x · n 0 1                                             o t h e r w i s e
where x is a sample point of the model, x* is a point located at the crack surface closest to x, n is the outer normal direction perpendicular to the crack at x point, and r and θ represent the local polar coordinate system of the crack tip. F α x can be expressed as [39]
F α x = r sin θ 2 , r cos θ 2 , r sin θ sin θ 2 , r sin θ cos θ 2

4. Numerical Examples

4.1. Fracturing Simulation with Constant Physical Parameter

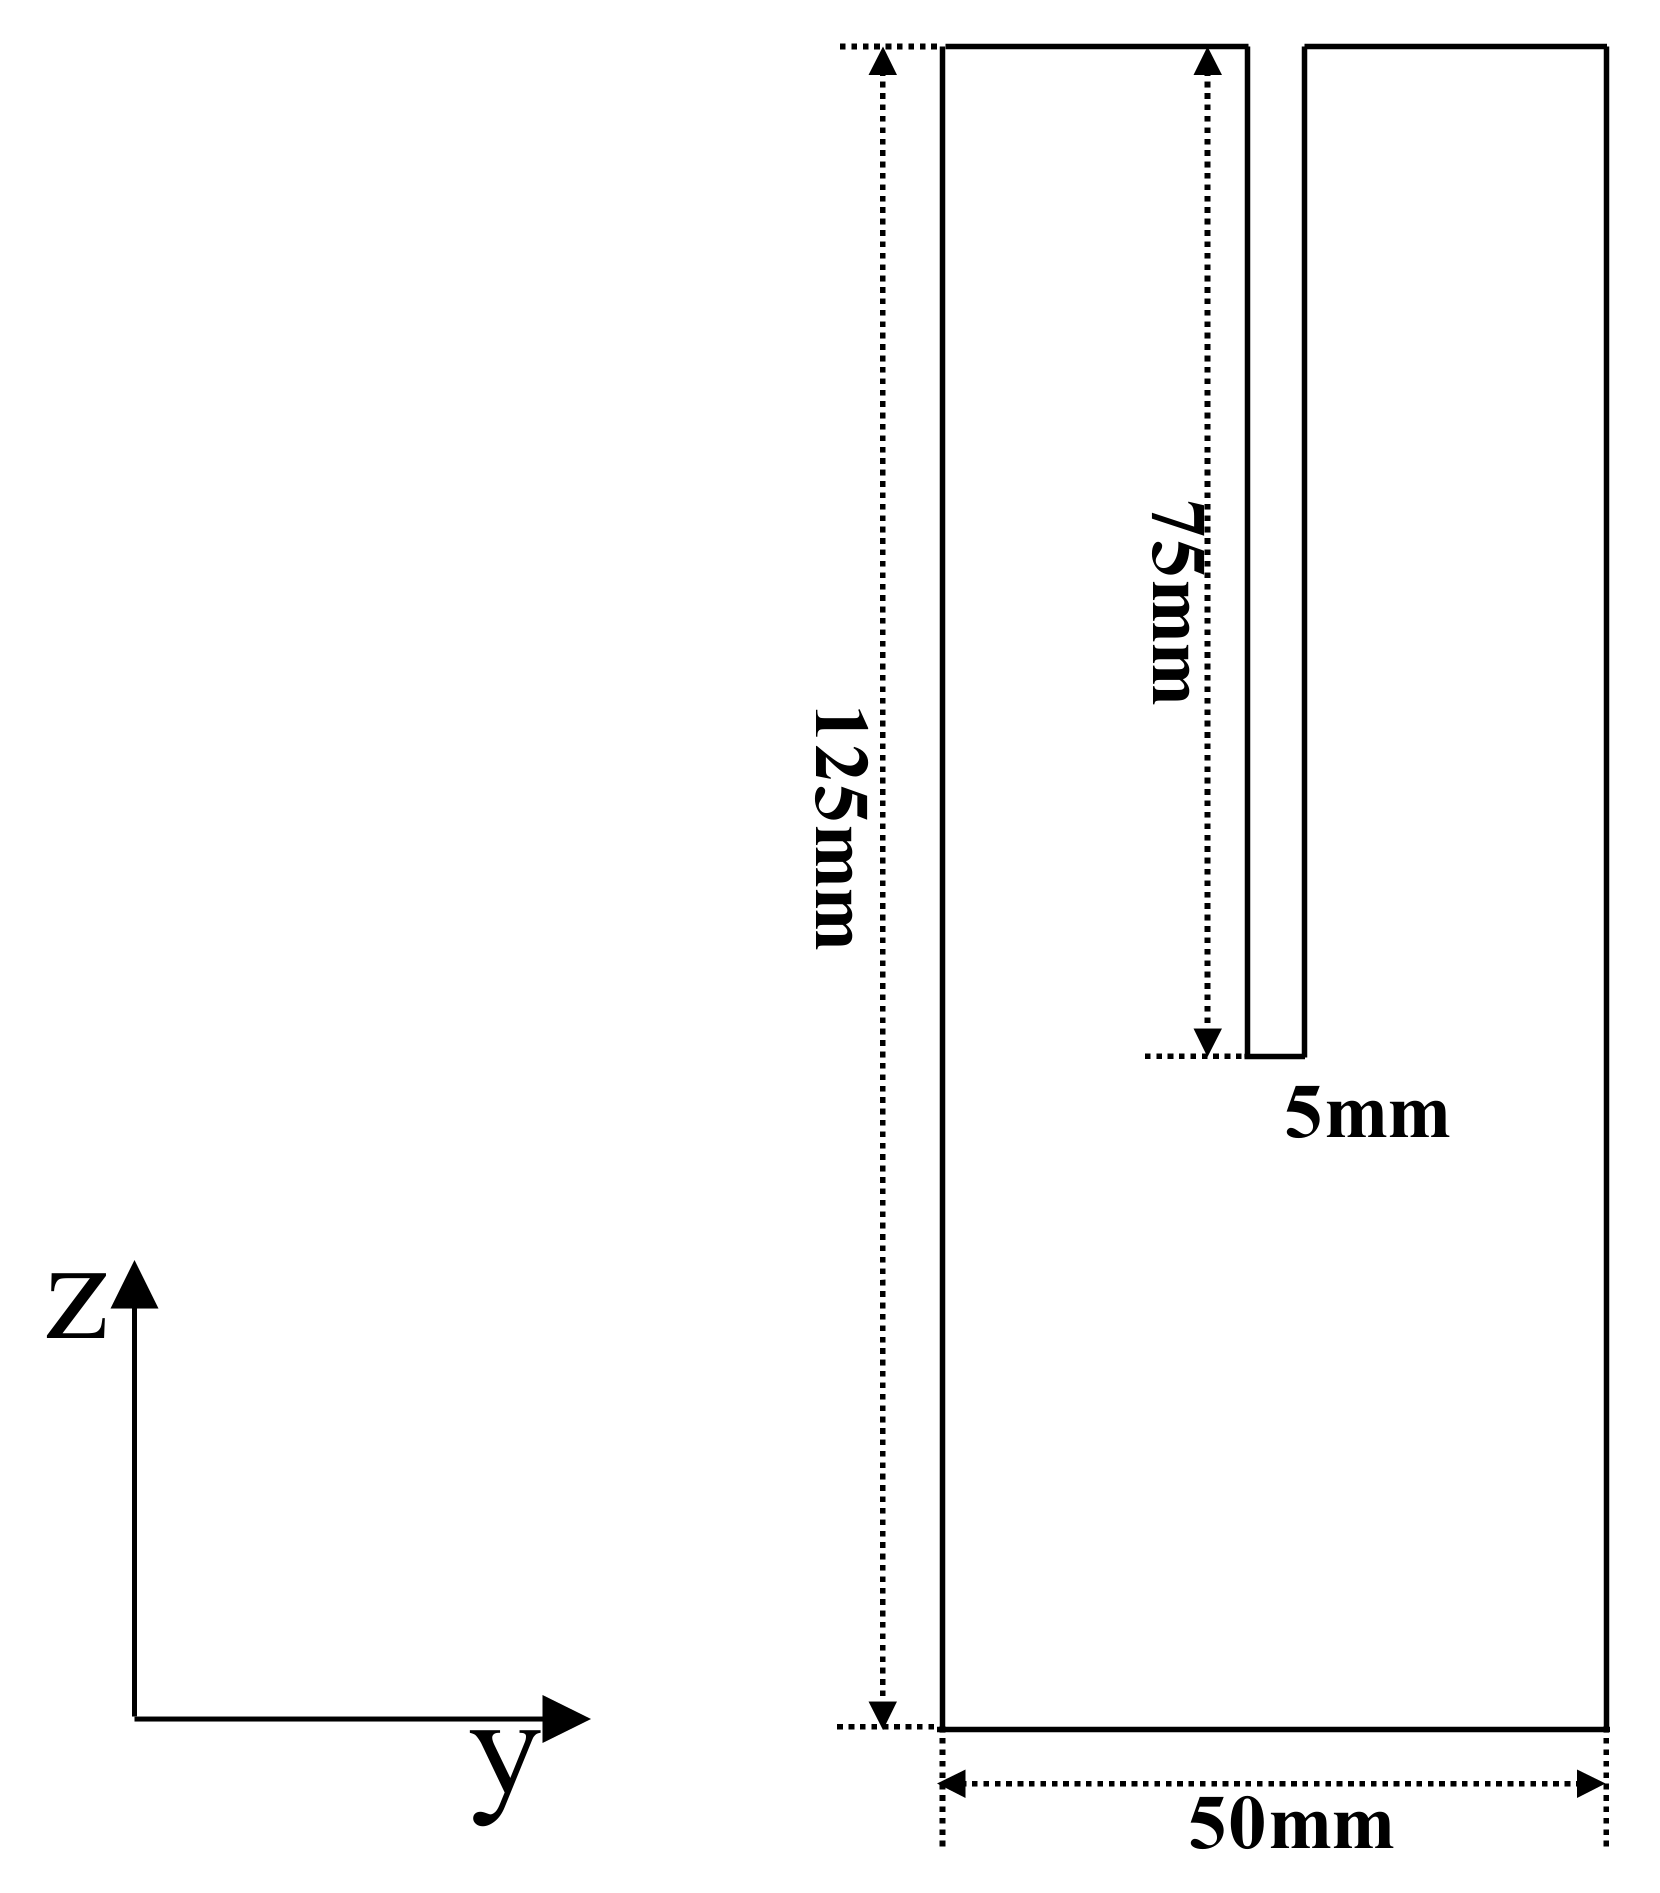
To systematically study the damage process of the rock sample, we performed a series of numerical simulations. In conventional numerical simulations, the values of physical parameters are usually fixed. Rock fracturing simulations were conducted according to the configuration shown as Figure 7. The four node plane strain pore fluid/stress element (CPE4P) in ABAQUS was applied in the simulation. The initial increment of the time step was 0.1 s, and the maximum increment of the time step was 1 s. The initial values of physical parameters used for the simulation are summarized in Table 1. Figure 8 shows the fracture geometry at the end of simulation.

4.2. Fracturing Simulation Considering Real-Time Evolution of Velocity

As seen in Phase 3 in Figure 5, the P-velocity decreased from 4.77 km/s to 4.17 km/s, and the percentage of velocity variation was −13%. This means that during the whole process of simulation, the velocity was reduced from 4.77 km/s to 4.17 km/s. In addition, we performed the numerical simulation considering −20% and −30% velocity variation based on the configuration shown in Table 2. The values of the other parameters remained constant, and they are listed in Table 1. According to the basic theory of elasticity in an isotropic medium, the velocity and the Young’s modulus are related through Equation (4). Formula 5 is derived from Equation (4).
V p = E ρ · 1 σ 1 2 σ 1 + σ
E = ρ V p 2 1 2 σ 1 + σ 1 σ
In the above equations, V p is the velocity of the rock sample; E is Young’s modulus; σ is Poisson’s ratio; and ρ is density.
Next, we analyzed the relationship between fracture length and the simulation time. It can be clearly seen that the time when the fracture length reached maximum was different. When the physical parameter (velocity) of the model was changed by 0%, −13%, −20%, and −30%, the time of fractures propagating to model boundaries was 274 s, 290 s, 301 s, and 347 s, respectively, as shown in Figure 9. Furthermore, similar results could be obtained from the numerical simulations [40]. The real fracturing time lasted about 300 s from Phase 3 in Figure 5. It could be clearly found that when we considered real-time evolution of velocity change (−13%), the time 290 s was closer to 300 s than 274 s with constant physical parameter (0% velocity variation), which means that when we considered real-time evolution of velocity change during the simulation, the numerical simulation results could reflect the rock damage evolution more exactly. Additionally, the change of final facture geometries was not clear, considering the evolution of velocity from Figure 10. However, when we analyze Figure 9 and Figure 10 comprehensively, it is not difficult to find that the fracture geometries were different at the same simulation time with the change of the physical parameter (velocity). The fracture length considering the velocity change was shorter than that with constant physical parameters at the same simulation time. Thus, considering that at the field site it is impossible to inject the fracturing fluid all the time, we draw the conclusion that the change of physical parameter (velocity) likely has an effect on the fracture geometry.

5. Discussions and Conclusions

Based on the hydraulic fracturing experiment in the laboratory, we recorded the real-time effects of the hydraulic fracturing process on the velocity, and this study simulated the process of rock damage evolution. From the above theoretical analysis and numerical simulations, the following conclusions can be drawn:
It was found that the velocity from the in-lab active source test during the hydraulic fracturing experiment decreased, which provides an evidentiary basis for subsequent analysis. During the process of rock sample damage evolution, the effects of velocity variation on the simulation results were tested. The simulation results showed that the change of the physical parameter (velocity) of the rock sample affected the final fracture geometries slightly. However, the fracture geometries were different at the same injection time with changes of the physical parameter (velocity). Thus, considering the field site and that it is impossible to inject the fracturing fluid all the time, we draw the conclusion that the change of the physical parameter (velocity) has an effect on the fracture geometry. Additionally, when we consider real-time evolution of velocity change (−13%) from the experiment during the simulation, the numerical simulation results can reflect the rock damage evolution more exactly. The time (290 s), represented the process of rock damage evolution, is closer to real fracturing time (about 300 s) during Phase 3 in-lab hydraulic fracture experiment, compared with 274 s of fractures propagate to model boundaries without considering real-time evolution of physical parameter (0% velocity change).
Furthermore, the geological conditions of the fracturing field site and the changes in physical parameters cannot be ignored. In addition, it is of great significance to predict and control hydraulic fracture morphology accurately for improving oil and gas production. The present study can provide some theoretical guidance for future numerical simulations. Furthermore, geological conditions and more reasonable on-site production should be considered.
Of course, the defects of the study must be pointed out. Physical parameters of rock samples, such as the strength and velocity of samples at each point, will change under pressure. In this experiment, the equivalent velocity of the rock sample was obtained during the process of rock sample damage evolution. Conclusions of the above are drawn based on the assumption of whole equivalent velocity variation of the rock. For simplicity, only a 2D model is simulated in this paper. For further research, a 3D model should be considered, which may provide more detailed discovery. In order to show the process of rock sample damage evolution more realistically, further work should utilize velocity tomography from acoustic emission data recorded during the experiment, which can obtain real-time and high-resolution physical parameter changes, and then the hydraulic fracturing simulation results can be obtained more reasonably.

Author Contributions

Each author has contributed to the present paper. Q.Q. analyzed the data and wrote the paper; Q.X. performed the experiments and provided the data; Z.M. and Y.Z. gave advice for the numerical simulation and helped to check and revise the manuscript; H.Z. performed the experiments. All authors have read and agreed to the published version of the manuscript.

Acknowledgments

We want to thank Xinglin Lei from the Geological Survey of Japan, National Institute of Advanced Industrial Science and Technology, for his help with the hydraulic experiment. The research is funded by the Key Research Program of Frontier Sciences, CAS, Grant No. QYZDY-SSW-DQC009.

Conflicts of Interest

The authors declare no conflict of interest.

References

  1. Zhang, Z.; Li, X. Numerical Study on the Formation of Shear Fracture Network. Energies 2016, 9, 299. [Google Scholar] [CrossRef] [Green Version]
  2. Guo, T.; Qu, Z.; Gong, F.; Wang, X. Numerical Simulation of Hydraulic Fracture Propagation Guided by Single Radial Boreholes. Energies 2017, 10, 1680. [Google Scholar] [CrossRef] [Green Version]
  3. Figueiredo, B.; Tsang, C.F.; Rutqvist, J.; Niemi, A. The effects of nearby fractures on hydraulically induced fracture propagation and permeability changes. Eng. Geol. 2017, 228, 197–213. [Google Scholar] [CrossRef] [Green Version]
  4. Remij, E.W.; Remmers, J.J.; Huyghe, J.M.; Smeulders, D.M. On the numerical simulation of crack interaction in hydraulic fracturing. Comput. Geosci. 2018, 22, 423–437. [Google Scholar] [CrossRef] [Green Version]
  5. Warpinski, N.R.; Teufel, L.W. Influence of geologic discontinuities on hydraulic fracture propagation. J. Pet. Technol. 1987, 39, 209–220. [Google Scholar] [CrossRef]
  6. Bahorich, B.; Olson, J.E.; Holder, J. Examining the effect of cemented natural fractures on hydraulic fracture propagation in hydrostone block experiments. In Proceedings of the SPE Annual Technical Conference and Exhibition, San Antonio, TX, USA, 8–10 October 2012. [Google Scholar]
  7. Nguyen, V.P.; Lian, H.; Rabczuk, T.; Bordas, S. Modelling hydraulic fractures in porous media using flow cohesive interface elements. Eng. Geol. 2017, 225, 68–82. [Google Scholar] [CrossRef]
  8. Xie, J.; Huang, H.; Ma, H.; Zeng, B.; Tang, J.; Yu, W.; Wu, K. Numerical investigation of effect of natural fractures on hydraulic-fracture propagation in unconventional reservoirs. J. Natl. Gas Sci. Eng. 2018, 54, 143–153. [Google Scholar] [CrossRef]
  9. Tuttle, S.; Grechka, V.; Jahan, I.; Zhang, Z. Spatiotemporal Gyration from Microseismicity in the Permian Basin. In Proceedings of the Unconventional Resources Technology Conference (URTEC), Houston, TX, USA, 20–22 July 2020. [Google Scholar]
  10. Liu, R.; Jiang, Y.; Huang, N.; Sugimoto, S. Hydraulic properties of 3D crossed rock fractures by considering anisotropic aperture distributions. Adv. Geo-Energy Res. 2018, 2, 113–121. [Google Scholar] [CrossRef] [Green Version]
  11. Zhu, W.S.; Zhao, C.L.; Zhou, H. Discussion on several key issues in current rock mechanics. J. Rock Mech. Eng. 2015, 34, 649–658. [Google Scholar]
  12. Bazan, L.W.; Brinzer, B.C.; Meyer, B.R.; Brown, E.K. Key Parameters Affecting Successful Hydraulic Fracture Design and Optimized Production in Unconventional Wells. Soc. Pet. Eng. 2013. [Google Scholar] [CrossRef]
  13. Youcai, T.A.; Fenglin, N.I. Recent advances in microseismic monitoring and implications for hydraulic fracturing mapping. Pet. Sci. Bull. 2016, 1, 198–208. [Google Scholar]
  14. Hu, L.; Ghassemi, A. Heat production from lab-scale enhanced geothermal systems in granite and gabbro. Int. J. Rock Mech. Min. Sci. 2019, 126, 104205. [Google Scholar] [CrossRef]
  15. Hu, L.; Ghassemi, A.; Pritchett, J.; Garg, S. Characterization of laboratory-scale hydraulic fracturing for EGS. Geothermics 2019, 83, 101706. [Google Scholar] [CrossRef]
  16. Lei, X.; Funatsu, T.; Ma, S.; Liu, L. A laboratory acoustic emission experiment and numerical simulation of rock fracture driven by a high-pressure fluid source. J. Rock Mech. Geotech. Eng. 2016, 8, 27–34. [Google Scholar] [CrossRef] [Green Version]
  17. Zhai, H.; Chang, X.; Wang, Y.; Xue, Z.; Lei, X.; Zhang, Y. Sensitivity analysis of seismic velocity and attenuation variations for longmaxi shale during hydraulic fracturing testing in laboratory. Energies 2017, 10, 1393. [Google Scholar] [CrossRef]
  18. Kong, B.; Fathi, E.; Ameri, S. Coupled 3-D numerical simulation of proppant distribution and hydraulic fracturing performance optimization in Marcellus shale reservoirs. Int. J. Coal Geol. 2015, 147, 35–45. [Google Scholar] [CrossRef]
  19. Xiao-Lin, Z.; Feng, Z.; Xiang-Yang, L.; Xu-Ri, H.; Shuang-Quan, C. The influence of hydraulic fracturing on velocity and microseismic location. Chin. J. Geophys. 2013, 56, 3552–3560. (In Chinese) [Google Scholar] [CrossRef]
  20. Urbancic, T.; Baig, A.; Viegas, G.; Thompson, J.M.; Anderson, D.; Rice, C.; Martin, L. Effective constraint of RTA models utilizing microseismicity derived flow attributes. In Proceedings of the Unconventional Resources Technology Conference, Austin, TX, USA, 24–26 July 2017; Society of Exploration Geophysicists, American Association of Petroleum Geologists, Society of Petroleum Engineers: Houston, TX, USA; pp. 2411–2426. [Google Scholar]
  21. Diao, R.; Hu, X.T.; Cui, Q.H. Precision analysis and application of equivalent velocity in micro-seismic monitor. Reserv. Eval. Dev. 2015, 5, 49–53. [Google Scholar]
  22. Viegas, G.; Bosman, K.; Urbancic, T.; Angus, D. Estimates of primary production volumes of unconventional shale reservoirs using dynamic-parameter analysis of microseismicity: Validation case study applying topology on discrete fracture networks. In Proceedings of the SEG International Exposition and Annual Meeting, Anaheim, CA, USA, 14–19 October 2018; pp. 2997–3001. [Google Scholar] [CrossRef]
  23. Javadpour, F.; McClure, M.; Naraghi, M.E. Slip-corrected liquid permeability and its effect on hydraulic fracturing and fluid loss in shale. Fuel 2015, 160, 549–559. [Google Scholar] [CrossRef]
  24. Maity, D.; Ciezobka, J. An Interpretation of Proppant Transport Within the Stimulated Rock Volume at the Hydraulic-Fracturing Test Site in the Permian Basin. Soc. Pet. Eng. 2019. [Google Scholar] [CrossRef]
  25. Gidley, J.L. A method for correcting dimensionless fracture conductivity for non-Darcy flow effects. SPE Prod. Eng. 1991, 6, 391–394. [Google Scholar] [CrossRef]
  26. Zhang, D.F.; Li, S.C. The modified tensile stress crack propagation criterion and influence of cranny hydraulic pressure on crack propagation. Chin. J. Comput. Mech. 2009, 26, 114–119. [Google Scholar]
  27. Zhang, J. Pore pressure prediction from well logs: Methods, modifications, and new approaches. Earth-Sci. Rev. 2011, 108, 50–63. [Google Scholar] [CrossRef]
  28. Liu, S.; Valkó, P. An Improved Equilibrium-Height Model for Predicting Hydraulic Fracture Height Migration in Multi-Layered Formations. Soc. Pet. Eng. 2015. [Google Scholar] [CrossRef]
  29. Oterkus, S.; Madenci, E.; Oterkus, E. Fully coupled poroelastic peridynamic formulation for fluid-filled fractures. Eng. Geol. 2017, 225, 19–28. [Google Scholar] [CrossRef] [Green Version]
  30. Rohmer, J.; Seyedi, D.M. Coupled large scale hydromechanical modelling for caprock failure risk assessment of CO2 storage in deep saline aquifers. Oil Gas Sci. Technol 2010, 65, 485–502. [Google Scholar] [CrossRef] [Green Version]
  31. Zhou, Z.Y.; Kuang, S.B.; Chu, K.W.; Yu, A.B. Discrete particle simulation of particle–fluid flow: Model formulations and their applicability. J. Fluid Mech. 2010, 661, 482–510. [Google Scholar] [CrossRef]
  32. Salimzadeh, S.; Khalili, N. A Fully Coupled XFEM Model for Flow and Deformation in Fractured Porous Media with Explicit Fracture Flow. Int. J. Geomech. 2015, 16, 04015091. [Google Scholar] [CrossRef]
  33. Davydzenka, T.; Fagbemi, S.; Tahmasebi, P. Coupled fine-scale modeling of the wettability effects: Deformation and fracturing. Phys. Fluids 2020, 32, 083308. [Google Scholar] [CrossRef]
  34. Li, X.Y.; Lei, X.L.; Li, Q.; Cui, Y.X. Characteristics of acoustic emission during deformation and failure of typical reservoir rocks under triaxial compression: An example of Sinian dolomite and shale in the Sichuan Basin. Chin. J. Geophys. Chin. Ed. 2015, 58, 982–992. [Google Scholar] [CrossRef]
  35. Shen, H.; Li, X.; Li, Q.; Wang, H. A method to model the effect of pre-existing cracks on P-wave velocity in rocks. J. Rock Mech. Geotech. Eng. 2019, 12, 493–506. [Google Scholar] [CrossRef]
  36. ABAQUS. ABAQUS Documentation; ABAQUS: Palo Alto, CA, USA, 2017. [Google Scholar]
  37. Dolbow, J.E. An Extended Finite Element Method with Discontinuous Enrichment for Applied Mechanics. Ph.D. Thesis, Theoretical and Applied Mechanics, Northwestern University, Evanston, IL, USA, 1991. [Google Scholar]
  38. Moës, N.; Dolbow, J.; Belytschko, T. A finite element method for crack growth without remeshing. Int. J. Numer. Methods Eng. 1999, 46, 131–150. [Google Scholar] [CrossRef]
  39. Lecampion, B. An extended finite element method for hydraulic fracture problems. Commun. Numer. Methods Eng. 2009, 25, 121–133. [Google Scholar] [CrossRef]
  40. Dong, Z.Q.; Jun, Y. Numerical Simulation of Shale Hydraulic Fracturing Based on the Extended Finite Element Method. Appl. Math. Mech. 2014, 35. [Google Scholar] [CrossRef]
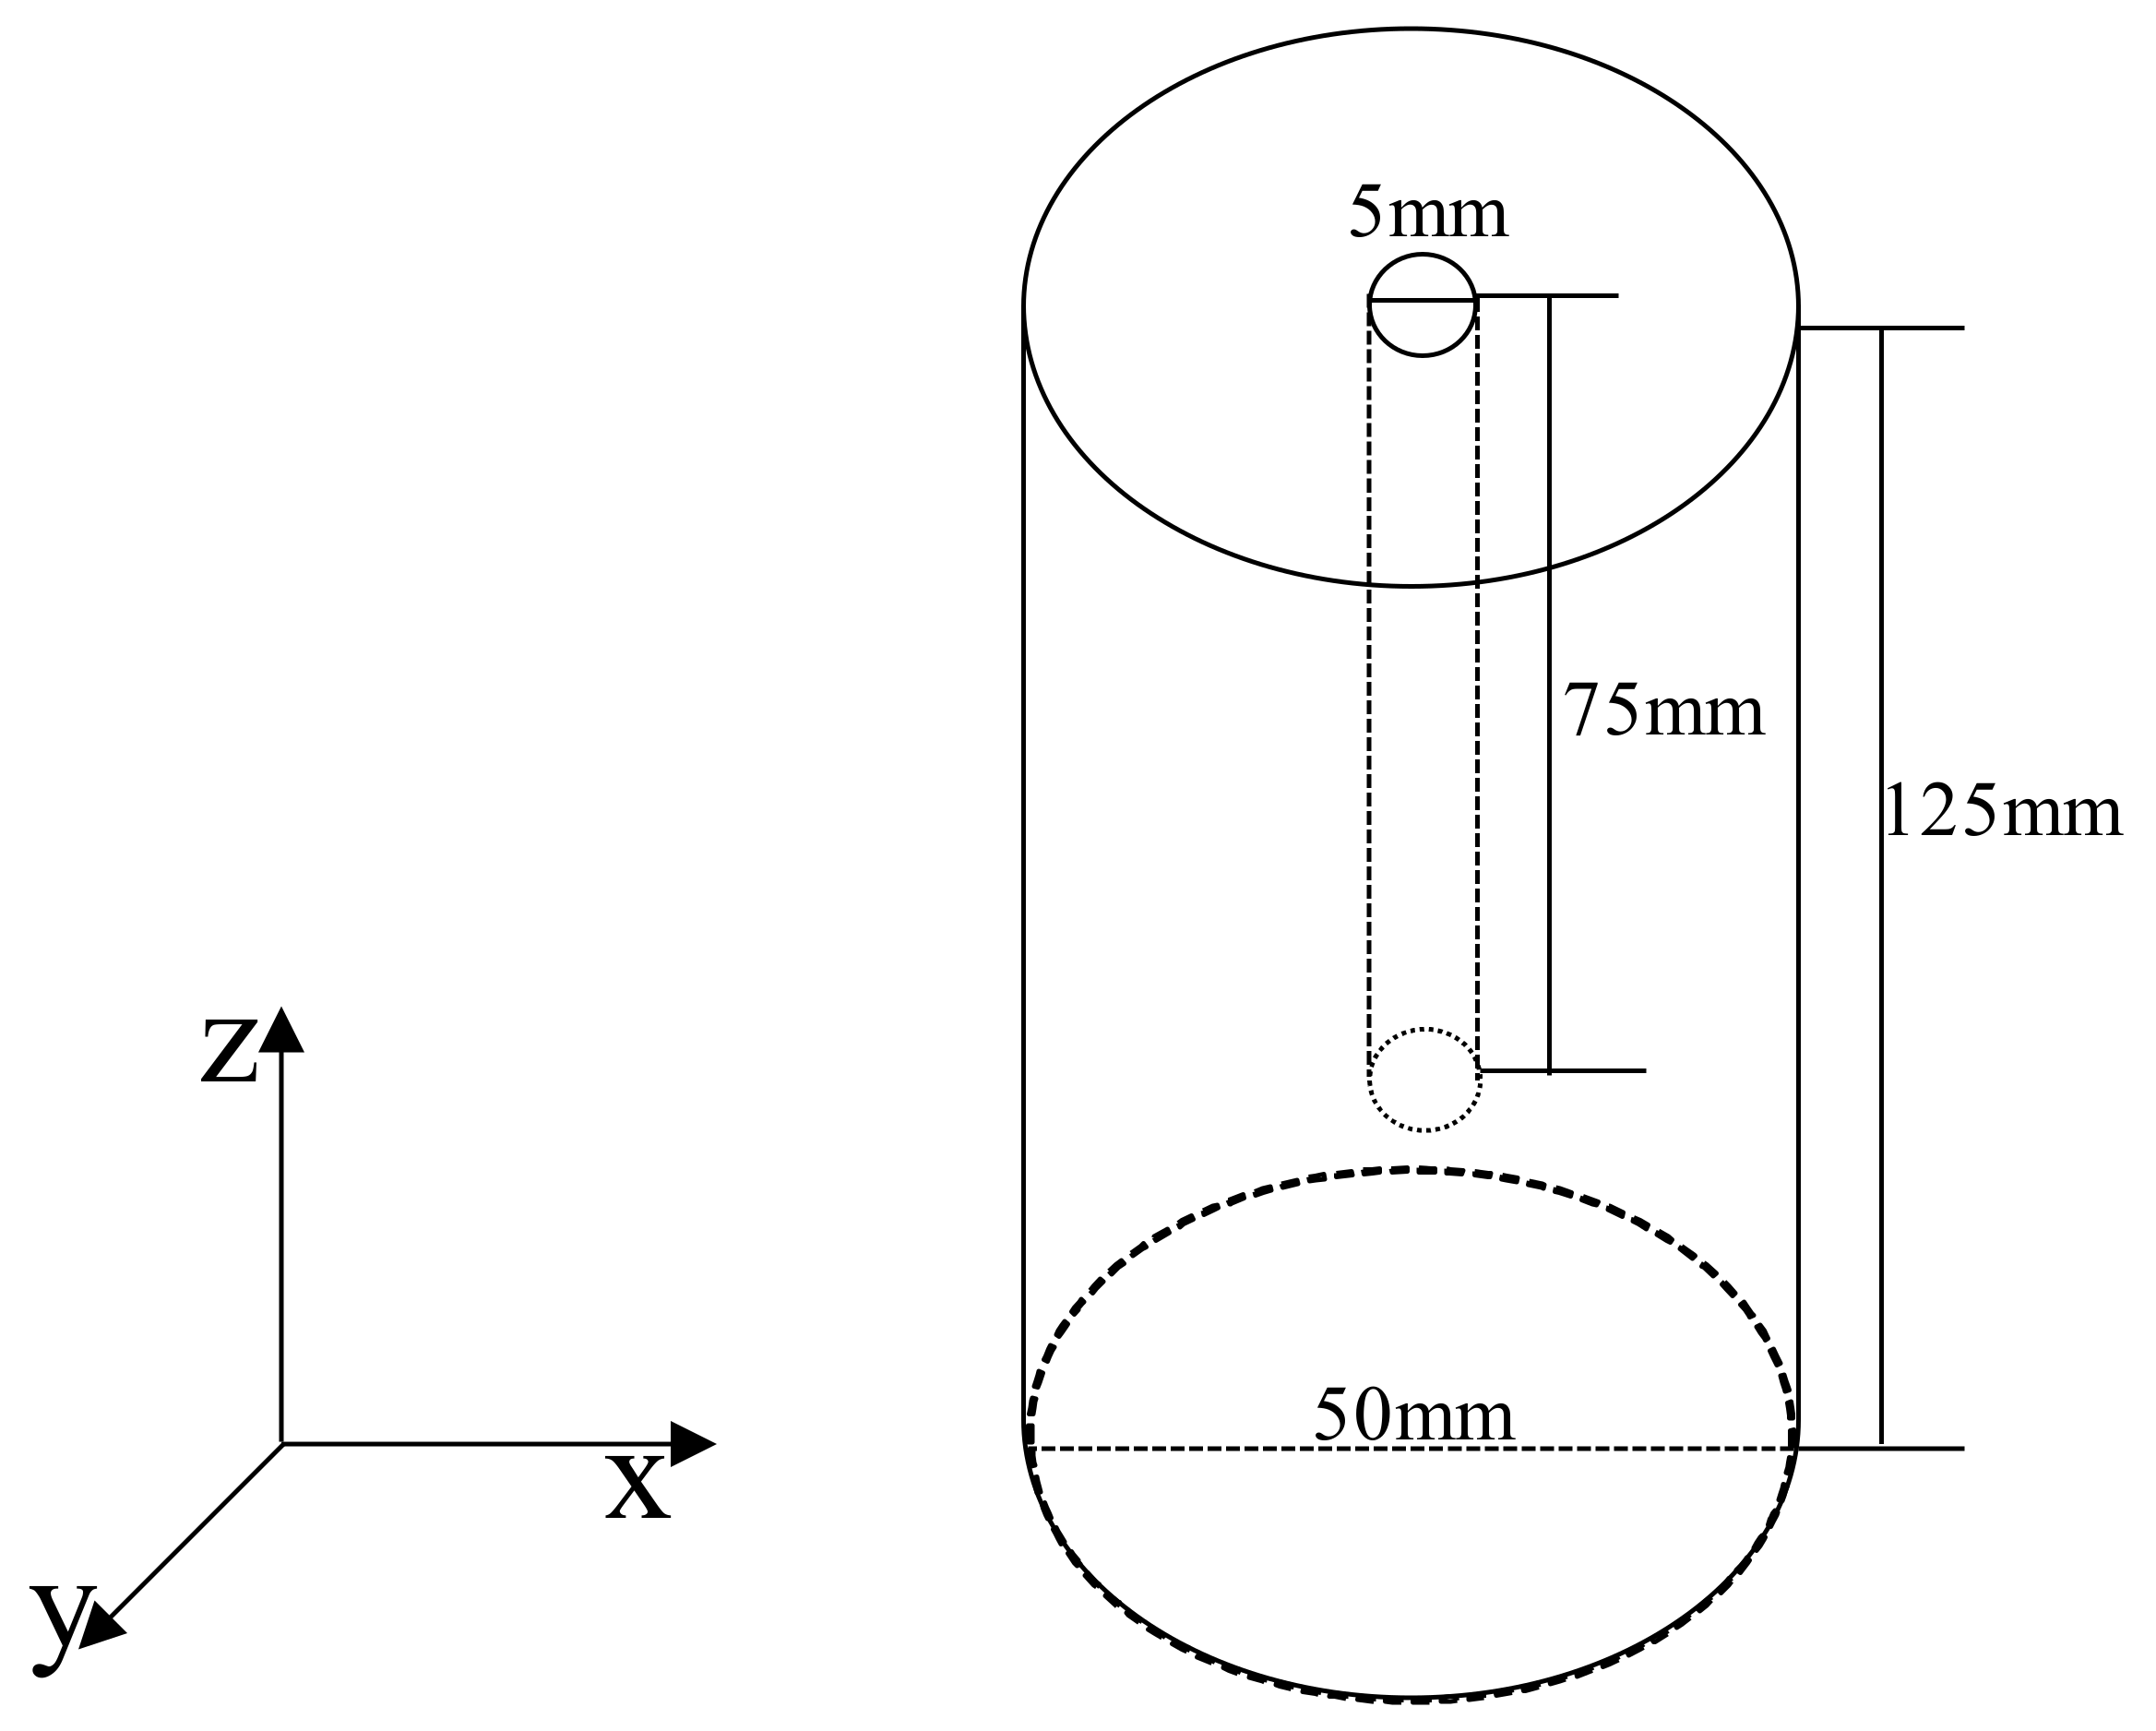
Figure 1. Geometry of the rock sample.
Energies 14 01678 g001
Figure 2. CT scan images of the axial rock center, x-z plane (a), y-z plane (b), and x-y plane in the center of the sample (c).
Energies 14 01678 g002
Figure 3. Distribution of piezoelectric transducer sensors mounted on the surface of the test sample. PZT 1–12 (the red dot) indicates ultrasonic wave emission sensors, and PZT 13–24 (the blue dot) served as the receiving probes. An expanded view of the lateral cylinder is showed in the cylindrical coordinate system.
Energies 14 01678 g003
Figure 4. Example of waveforms with respect to PZT6-18 (PZT6 acted as pulse source emission and PZT18 acted as the receiver) during the experiment.
Energies 14 01678 g004
Figure 5. (a) P-velocities measured along horizontal paths as indicated in Figure 3; (b) the procedure of the hydraulic fracturing experiment: the axial compression (σa), confining pressure (σc), inlet fluid pressure (Pi), and cumulative number of AE events versus time. The whole procedure could be divided into six phases according to different stress loading.
Energies 14 01678 g005
Figure 6. CT scanning profiles of the sample after hydraulic fracturing, x-z plane (a), y-z plane (b), and x-y plane (c). Red dots highlight the traces of fractures.
Energies 14 01678 g006
Figure 7. Geometry of the numerical model.
Energies 14 01678 g007
Figure 8. Fracture geometry at the end of simulation.
Energies 14 01678 g008
Figure 9. Fracture length changes versus time at different velocity variations.
Energies 14 01678 g009
Figure 10. Fracture geometries at different percentages of velocity variation. (a) 0%, (b) −13%, (c) −20%, (d) −30%.
Energies 14 01678 g010
Table 1. Initial values of physical parameters.
UnitValue
Young’s modulusGPa47
Poisson’s ratio-0.23
Leak-off coefficientm/Pa1 × 1014
Fluid viscosityPas0.001
Densityg/cm32.42
Tensile strength of rockMPa10
Table 2. The percentage of velocity change.
Velocity (km/s)%
4.770
4.17−13
3.82−20
3.34−30
Publisher’s Note: MDPI stays neutral with regard to jurisdictional claims in published maps and institutional affiliations.