Article

Automatic Overcurrent Protection Coordination after Distribution Network Reconfiguration Based on Peer-To-Peer Communication

1
Postgraduate Department, Smart Grid Research Group (GIREI), Universidad Politécnica Salesiana, Quito EC170525, Ecuador
2
Department of Engineering, University of Ferrara, 44121 Ferrara, Italy
*
Author to whom correspondence should be addressed.
These authors contributed equally to this work.
Energies 2021, 14(11), 3253; https://doi.org/10.3390/en14113253
Submission received: 11 May 2021 / Revised: 27 May 2021 / Accepted: 28 May 2021 / Published: 2 June 2021

Abstract

:
Electrical power systems represent a fundamental part of society, and their efficient operations are of vital importance for social and economic development. Power systems have been designed to withstand interruptions under already provided safety and quality principles; however, there are some extreme and not so frequent events that could represent inconveniences for the correct operation of the entire system. For this reason, in recent years the term resilience, which serves to describe the capacity of a system to recover from an unwanted event, has been analyzed on planning, operation and remedial actions. This work is focused on the implementation of a topological reconfiguration tool, which is oriented to change the structure of primary feeders based on changing the status of switchgears. Once the distribution network has been reconfigured, an algorithm of protection coordination is executed based on communication peer-to-peer between Matlab and PowerFactory, which develops an adaptive calculation to determine the current setting and the time multiplier setting. The reconfiguration and coordination protection algorithms could be implemented and evaluated on different distribution networks, areas and locations.

1. Introduction

Power system operation is an extremely important task due to the fact that it is linked to the economic development of industries, residential and commercial districts. Therefore, electric service companies invest technical and economic resources to provide a safe and reliable supply of electricity based on adequate components, reliable equipment, system structures and modern devices. Under these considerations, not only is reliable equipment needed in power systems, but also a competent use of international, regional and local standards and norms to fulfill all technical requirements, and withstand any kind of faults limiting its effect on the electrical system. Additionally, several legal, social, political, environmental and financial restrictions are stated on laws for electrical power supply, regulations and guidelines, which have strong influence on planning tasks, construction and operation of electrical networks [1,2]. Therefore, the importance of the network is clear not only in electrical engineering, but also in other fields such as bioinformatics and social sciences [3,4,5].
Within this background, if it is clear that ancillary services such as protection systems are mandatory on transmission and distribution grids, where protective systems are designed to ensure minimum loss of load, then it must take into account basic principles such as reliability, speed, selectivity, simplicity and cost [6,7]. Selectivity has been defined as the ability of the overall protection scheme to isolate the fault such that the minimum interruption occurs. The simplicity concept is associated with the minimum protective equipment and its circuitry to achieve the protection objectives. To achieve the required reliability levels, protection schemes are designed considering redundancy, dependability and security. The first one is achieved through duplication of the protection system or through remote back-up protections. Dependability is associated with the operation on the presence of a fault within its zone of protection, while security is the ability of the protection to refrain the tripping of the circuit breakers on the non-faulted parts of the protected zone when faults occur elsewhere on the protected zone. Consequently, reliability of power protections can be measured as the probability that the system will function correctly when it is required to act, i.e., it must operate in the presence of a fault within its zone of protection and must restraint from operating at other times. The aforementioned concepts are applied in [8] where overcurrent protection relays are set for modern Medium Voltage (MV) distribution grids considering the inclusion of different generation sources.
Figure 1 shows the dependability and security concepts represented by logical gates (OR and AND), which are employed in power systems. For example, for busbar protection, due to the large number of bays which are tripped when a busbar protection operates, the application of security concept is more important. On the other hand, for feeder protection where the loss of a feeder can be compensated for other parallel circuits, the dependability concept is more useful than security [9,10,11,12].
The aforementioned principles are practically impossible to satisfy completely and simultaneously on a protection system. Typically, the complexity increases due to reliability enhancement and selectivity concept, consequently the protection system cannot be simple and straightforward, and therefore it leads to higher cost protection. The optimum protection system is reached when the protection scheme offers the maximum protection at the lowest possible cost, and obviously at the minimum operating time to clear a fault to avoid equipment damage [13,14].
Not only basic principles, but also advanced criteria such as protection zones, primary and back-up protections, or Special Protection Schemes (SPS) are used to avoid outages and damage in power systems [15]. Protective zones are virtual divisions within the power system, which are protected and disconnected in the presence of a fault permitting that the rest of the power system operates normally [16]. To this aim, Ghorbani et al. modeled an electric protection system considering protective zones, and trip characteristics of distance relay, where a comparison with two different and specialized software is performed [17]. Approaches associated with primary and back-up protections are applied in [18,19], which stated the importance of installation of primary and back-up systems on power grids. The former is represented by relays within a given protection zone that detects a fault on power systems, whereas the back-up protection is installed to operate when the primary protection does not work. Consequently, the coordination of protection devices is performed to ensure that only the necessary faulty sections of the network are isolated. Usually a time-delay characteristic is used on back-up protection to guarantee that primary protection operates first. A more sophisticated design is the SPS which is implemented to preserve the system stability after a large disturbance on important transmission lines or facilities. SPS is capable of avoiding system collapse using adequate matching between supply and load based on different methods such as load shedding and generator rejection [20].
All the aforementioned protection principles and advanced schemes can be applied to resist, adapt, and recover from disruptions generated by unpredictable events and disturbances. However, not only power protections, but also recommended practices taken by governments, advanced technologies and new strategies are useful to face such abnormal events. Currently, resilience and protection systems are highlighted topics since faults could cause caused power outage for entire zones [21,22].
The paper is organized as follows. The characteristics of electrical network protection are discussed in Section 2, with focus on overcurrent relays. Therefore, a briefly description of network reconfiguration and protection coordination is carried out in Section 3. Section 4 deals with the presentation of the proposed solution, while the case study and analysis of results are reported in Section 5. Finally, Section 6 concludes the paper by summarizing the main achievements of the work and suggesting open problems.

2. Electrical Network Protection

Protection coordination of overcurrent relays is very useful to protect distribution networks, since they are designed to operate when current reaches high levels during an abnormal event. These high values of current are used to calculate the parameters for the adjustment of overcurrent relays. Definite current, definite time and inverse time over current protection are depicted in Figure 2. Definite current protection is applied with no intentional delay, therefore, the coordination is based on current. On the other hand, definite time relay is used for coordination based on time with identical pick-up currents of all relays. Finally, a more generalized kind of operating characteristic is based on an inverse-time overcurrent protection, which is employed to protect distribution networks because the operating times varies inversely with current.

Inverse-Time Overcurrent Protection

As remarked above, a protection relay is a device that compares one or more signals to a reference value and emit an alarm when the input signals become higher than the preset value. The most used protection devices on distribution networks are inverse-time overcurrent relays, which are activated by an increase in current levels. Consequently, it generates a signal that activates the circuit breaker, thus clearing the short-circuit [25].
The operation of this relay depends on its ability to detect a fault in its protection area, but it is limited because the current is the only measured parameter, which is sensitive to the system operating conditions and the network topology. The operation of an overcurrent relay depends on the following setting parameters: the current setting ( I s ) or pick-up current, which activates the device, and the Time Multiplier Setting (TMS) or time dial, which is a tuning parameter that permits the setting of the time delay before the relay operates whenever the current (e.g., due to a fault) reaches a value greater than the current setting [6,14].
Overcurrent protection is considered to be inherently non-selective because these relays are dependent on the measurement of current at one end of the protected section. Nevertheless, relative selectivity can be achieved by a correct protection coordination taking into account a discrimination margin; consequently, an adequate selection of pick-up current and TMS allows the satisfaction of technical requirements such as selectivity, sensitivity and speed [14,25].
The main property of these overcurrent relays is the ability to operate in a time that is inversely proportional to the current. Consequently, the activation of an inverse-time overcurrent relay is characterized by a curve that defines the operating time of the protection device for various current magnitudes. Therefore, this curve allows the relay to operate slowly at low overcurrent values and, as the current increases, the action time decreases. There are several types of inverse-time curves, which are mathematically modeled under the IEC, ANSI/IEEE standards and manufacturer policies. Table 1 shows the parameters that are used by different manufactures for overcurrent relays [26]. For this work, a standard inverse IEC curve will be used to carry out the automatic coordination of overcurrent protections. In particular, Equation (1) shows the mathematical models of the inverse-time curves:
t = T M S β ( I / I s ) α 1 + L
where:
  • t is the operating time in seconds
  • I is the fault current level at the secondary side of current transformer
  • I s is the current setting expressed at the secondary side of current transformer
  • L , α , β , are constants defined according to the standard considered, as summarized in Table 1.
As remarked above, there are two basic parameters to set an overcurrent relay. Those parameters are the TMS and I s , which the adjustment of the characteristic curve to be activated for a given value of time and current. Before calculating these parameters, a short-circuit analysis must be carried out to know the value of the short-circuit current at the most critical point of the relay protection zone, which is associated with the furthest point of protection. The pick-up current represents a key parameter, which is the value that will activate the protection, thus allowing the change of state in the relay. The pick-up current is expressed as:
I s = I s C T R
where:
  • C T R is the Current Transformer Ratio
  • I s is the current value expressed at the secondary side of current transformer
  • I s is the current setting expressed at the secondary side of current transformer
A protection coordination is a process in which the operating times of the overcurrent protections are defined to allow a prioritized trip based on the activation order, minimizing the tripping times and guaranteeing selectivity. Consequently, it is possible to have an appropriate margin in the operating times of all relays that are part of the protection system. The TMS of an inverse-time overcurrent relay is a parameter that allows the characteristic curve of a relay to be adjusted to a predetermined tripping time of a specific current. An important aspect that should be considered is the discrimination margin, which is a margin interval used between two successive time/current characteristics. Common values of discrimination margin are between 200 ms to 400 ms, which avoid losing selectivity due to excessive breaker opening times, variation in fault level, and error in current transformers [14,27].

3. Network Reconfiguration and Protection Coordination

Within power systems, a distribution network has the function of supplying the energy that is carried from power substations via primary feeders to distribution transformers and finally connect end users. A distribution system consists mainly of overhead lines or power cables that represent the primary feeders, distribution transformers and also include protection devices such as circuit breakers, reclosers, fuses and overcurrent relays [2,28,29,30]. Due to this complex structure, the distribution network is exposed to multiple factors or events (such as natural disasters) that can put its operation at risk. Consequently, it is particularly important to have a distribution network correctly protected to guarantee the adequate operation of the entire system meeting technical requirements such as quality of the service and the effective continuity of supply [31,32].
Contingencies or continuous failures on different system components can affect Quality of Service (QoS), especially if they cannot be solved in acceptable time frames, which may lead to users to have no access to the service for long periods of time. To this end, fast and effective service reconfiguration procedures become significantly important, especially in those loads considered critical due to their high productivity or relevance; the main goal of those procedures is to keep the largest possible portion of its service area energized when failures occur [33,34]. The distribution system may be affected by several kind of disturbances such as short-circuits, undervoltages or overvoltages, as well as lightning strikes. Therefore, protection devices activate the circuit breakers to isolate the faulty sections, keeping the rest of the system under normal operating conditions. However, due to this isolation strategy and the network topology, some healthy sections can be left disconnected. One of the objectives of a resilient operation is to maintain the greatest number of loads connected to the distribution network with acceptable levels of power quality, and those healthy zones are the main ones involved when performing network reconfigurations [35,36].
An effective tool used to operate distribution networks is the topological reconfiguration, whose objectives include most commonly the reduction of losses, improvement of voltage levels and the increase of reliability levels. The reconfiguration problem cannot be optimally solved without considering first an adequate modeling of all the distribution network components, including loads, distribution transformers, power cables or overhead lines and protective and switchgear equipment. Restoration process is associated with robust algorithms, which are responsible for managing the status of switchgear equipment, consequently the network topology. Commonly, power-flow analysis is carried out to obtain the system electrical variables and parameters that are relevant to determine the best solution as part of the optimization problem; the solution is based on the implementation of the objective functions, while taking into account technical and economic constraints [37,38]. To this end, the reconfiguration of a distribution network must be carried out with the necessary promptness and precision; consequently, all the tasks involved in the automation of the electrical networks are of paramount importance, such as control and protection equipment improving communication capabilities [39,40].
Modern overhead and underground distribution networks are designed and constructed considering the implementation of remote-controlled switchgear equipment, which can modify distribution network, improving the operating grid conditions due to the enhancement of voltage profiles and reduction of power losses. As remarked above, an overcurrent protection is a valuable device during a restoration procedure due to the fact that the overcurrent protection relays detect faults or abnormal operating conditions caused by the presence of an overcurrent in the system. Therefore, the adjustment and coordination must be met with technical requirements such as sensitivity, speed and selectivity. Sensitivity is a characteristic that allows the detection of abnormal conditions no matter how incipient they may be, allowing the protection to distinguish between normal and abnormal operation of the distribution system. The other requirement is the speed, associated with the operating time of the relay, which must clear the fault in the shortest time. Finally, selectivity requires an adequate adjustment to detect all the faults in the respective protection zones that are assigned to each relay. Considering these elements, a protection coordination of overcurrent relays is based on the determination of the operating conditions of the system to define the thermal limit of the different electrical components, thus guaranteeing that the current does not exceed its nominal value in normal operating conditions. Considering the network configuration, it is necessary to execute a fault analysis in the furthest busbar to determine an adequate value of the current setting and TMS. Consequently, it can be stated that the main objective of the adjustment of protection coordination problem consists of achieving selectivity with the maximum sensitivity and speed. Nevertheless, it is worth noting that these parameters are not independent, as two of them are more likely to decrease when the other one increases [6,25,41].

4. Network Reconfiguration and Protection Coordination Algorithm

Network reconfiguration and protection coordination are critical procedures, which are aimed to change the topological structure of primary feeders based on changing the status of switchgear equipment, where tie lines are closed. Consequently, overcurrent relays are coordinated based on new operating conditions to face any abnormal event [36,42]. For the present analysis, the network has been designed considering the availability of different tie lines and tie points with remote switching, which are placed in each feeder of the distribution systems. Subsequently, several network configurations are possible, which can deal with contingencies occurring at any point in the network. For all the aforementioned characteristics, the reconfiguration of electrical systems and the coordination of protection systems represent effective strategies to improve the resilience and the reconstitution of distribution networks. To this aim, an important index will be analyzed, the Expected Energy Not Supplied (EENS) [43], which indicates the energy not delivered to the users during a period of time. It is expressed mathematically with the following relation:
E E N S = i = 1 k ( L a i U i )
where:
  • L a i is the average load at busbar i
  • U i is the duration of the energy not supplied
  • k is the number of faulty busbars
The tasks of reconfiguration and protection coordination are performed on both PowerFactory and Matlab tools running at same time. DIgSILENT Programming Language (DPL) (web page: https://www.digsilent.de/en/scripting-and-automation.html accessed on 23 April 2021) is used to performs automated tasks such as power-flow, short-circuit analysis and protection coordination on PowerFactory. On the other hand, Matlab, which is a versatile mathematical tool, provide all the parameters, circuit breakers status, and operating conditions generated by the execution of the algorithm. Figure 3 depicts a peer-to-peer scheme between Matlab and PowerFactory [44], where various Comma Separated Values (CSV) files are used to transfer data from PowerFactory to Matlab, and vice versa. Parameters and variables are depicted in Table 2 for the proposed methodology.
The reconfiguration process is implemented to improve customer satisfaction, especially after an outage, when service restoration process must energize all available areas, isolating the faulty section. Consequently, as can be seen in Equation (4) the objective function aims to maximize the number of restored loads. The possible solutions must be within operative constraints such as maximum and minimum voltage level per busbars as can be seen in Equation (5). Moreover, also the restored load must not be greater than feeder capacity as showed in Equation (6): Finally, Equation (8) indicates that the topology of the system should remain radial.
m a x i = 1 L D S i , i L D a
subject to:
| V k m i n | | V k | | V k m a x | , k B a
i = 1 L D a P i P f m a x
i = 1 L D a Q f m a x , i L D a
Ψ = N l i n e s N b u s + 1
where:
  • S i is the apparent power consumed by load i
  • V k is the voltage at bus k
  • V k m i n is the minimum voltage at bus k
  • V k m a x is the maximum voltage at bus k
  • P i is the active power consumed by load i
  • P f m a x is the limit of active power at the feeder
  • Q i is the reactive power consumed by load i
  • Q f m a x is the limit of reactive power at the feeder
  • L D a is the set of active loads
  • B a is the set of active busbars
  • N l i n e s is the number of active section branches of the network
  • N b u s is the number of active buses
  • Ψ is 0 when the system remains radial
The present methodology is reported in Algorithm 1, whose structure can be represented by means of an explanatory flowchart in Figure 4. Two procedures are reported; the first one is related to the reconfiguration network, where the main parameters of distribution network (loads, busbars, voltages) are gathered in an initial step and transferred as data from PowerFactory to Matlab. Consequently, Matlab performs an analysis that finds all loads which are disconnected (out of service). After that, all circuit breakers are evaluated, checking which one has changed from its predefined status. This procedure is used to generate different switch combinations, which are sent from Matlab to PowerFactory to execute a power-flow analysis. Therefore, all variables such as voltage on each busbar, cable loading and circuit breaker status are sent to Matlab to determine the best restoration process, which meets all technical requirements. The second procedure concerns the protection coordination. The power-flow analysis is executed in PowerFactory to determine the current that is circulating along the feeder, and the I s is calculated on Matlab. Short-circuit analysis is executed on each busbar, to determine the TMS. Both parameters, I s and TMS are fundamental to analyze selectivity, where a fault along a feeder is cleared. As already remarked, selectivity, sensitivity and speed are important requirements on protection systems to achieve an adequate correct protection coordination on distribution networks. Consequently, the protection system should clear faults considering a minimum of load disconnections.
Algorithm 1 Reconfiguration and protection coordination algorithm between Matlab - PowerFactory.
1:
 procedure Reconfiguration Network
2:
     Initial operating condition of distribution network, create csv files (Data, Flag)
3:
     while  f l a g = 0 do           ▹ Matlab waits and PowerFactory runs
4:
         A contingency is defined in PowerFactory
5:
         PowerFactory executes a power-flow analysis
6:
         Save operating conditions of the network as D a t a . c s v
7:
          F l a g . c s v changes to 1
8:
     end while
9:
     Collect the new operating conditions       ▹ Matlab runs and PowerFactory waits
10:
    Generate switching options
11:
    Start searching possible topologies
12:
    Reduce switching options to the faulty feeder
13:
    for  i = 1 : s i z e ( s t a t u s 1 )  do
14:
        take switching status
15:
        while  f l a g = 0 do          ▹ Matlab waits and PowerFactory runs
16:
           PowerFactory executes a power-flow analysis
17:
            F l a g . c s v changes to 1
18:
        end while
19:
        Save operating conditions of each topology as D a t a 2      ▹ Matlab runs and PowerFactory waits
20:
        Evaluate the EENS
21:
        Check radiality based on feeder data from PowerFactory
22:
    end for
23:
    Evaluate voltage and cable loading from D a t a 2
24:
    Select the best solution representing the optimal network structure
25:
end procedure
26:
procedureCoordination Protection
27:
    Send the switching status from Matlab to PowerFactory
28:
    while  f l a g = 0 do           ▹ Matlab waits and PowerFactory runs
29:
        PowerFactory executes a power-flow analysis
30:
        PowerFactory executes a short-circuit analysis
31:
        Save results as D a t a . c s v
32:
         F l a g . c s v changes to 1
33:
    end while
34:
    Save results of simulation as D a t a 2           ▹ Matlab runs and PowerFactory waits
35:
    Sort overcurrent relays at each primary feeder
36:
    Read the value
37:
    for  j = 1 : s i z e ( p r i f e e d e r )  do
38:
        take switching status
39:
        for  k = 1 : l e n g t h ( r e l a y s )  do
40:
           Calculate the I s based on circulating current
41:
           Calculate the TMS based on short-circuit current at the end of the protection zone
42:
        end for
43:
    end for
44:
    Send results of protection coordination from Matlab to PowerFactory
45:
    while  f l a g = 0 do           ▹ Matlab waits and PowerFactory runs
46:
        PowerFactory updates I s and TMS
47:
        Test the protection coordination
48:
         F l a g . c s v changes to 1
49:
    end while
50:
    Matlab finishes the execution
51:
    PowerFactory finishes the execution
52:
end procedure
Figure 5 illustrates the application of inverse-time overcurrent protection, where the fault, which is colored in red, could be cleared by the relay A or the relay B. However, the downstream device (Relay B) that is closer to the fault should trip coordinates with the upstream relay that should not trip. The protection algorithm should be implemented in such a way the relay B operates first, i.e., the time t B will be reached before than the time t A for the specified value of fault current, clearing the fault and keeping maximum continuity of service.

5. Case Study and Results

5.1. Case Study

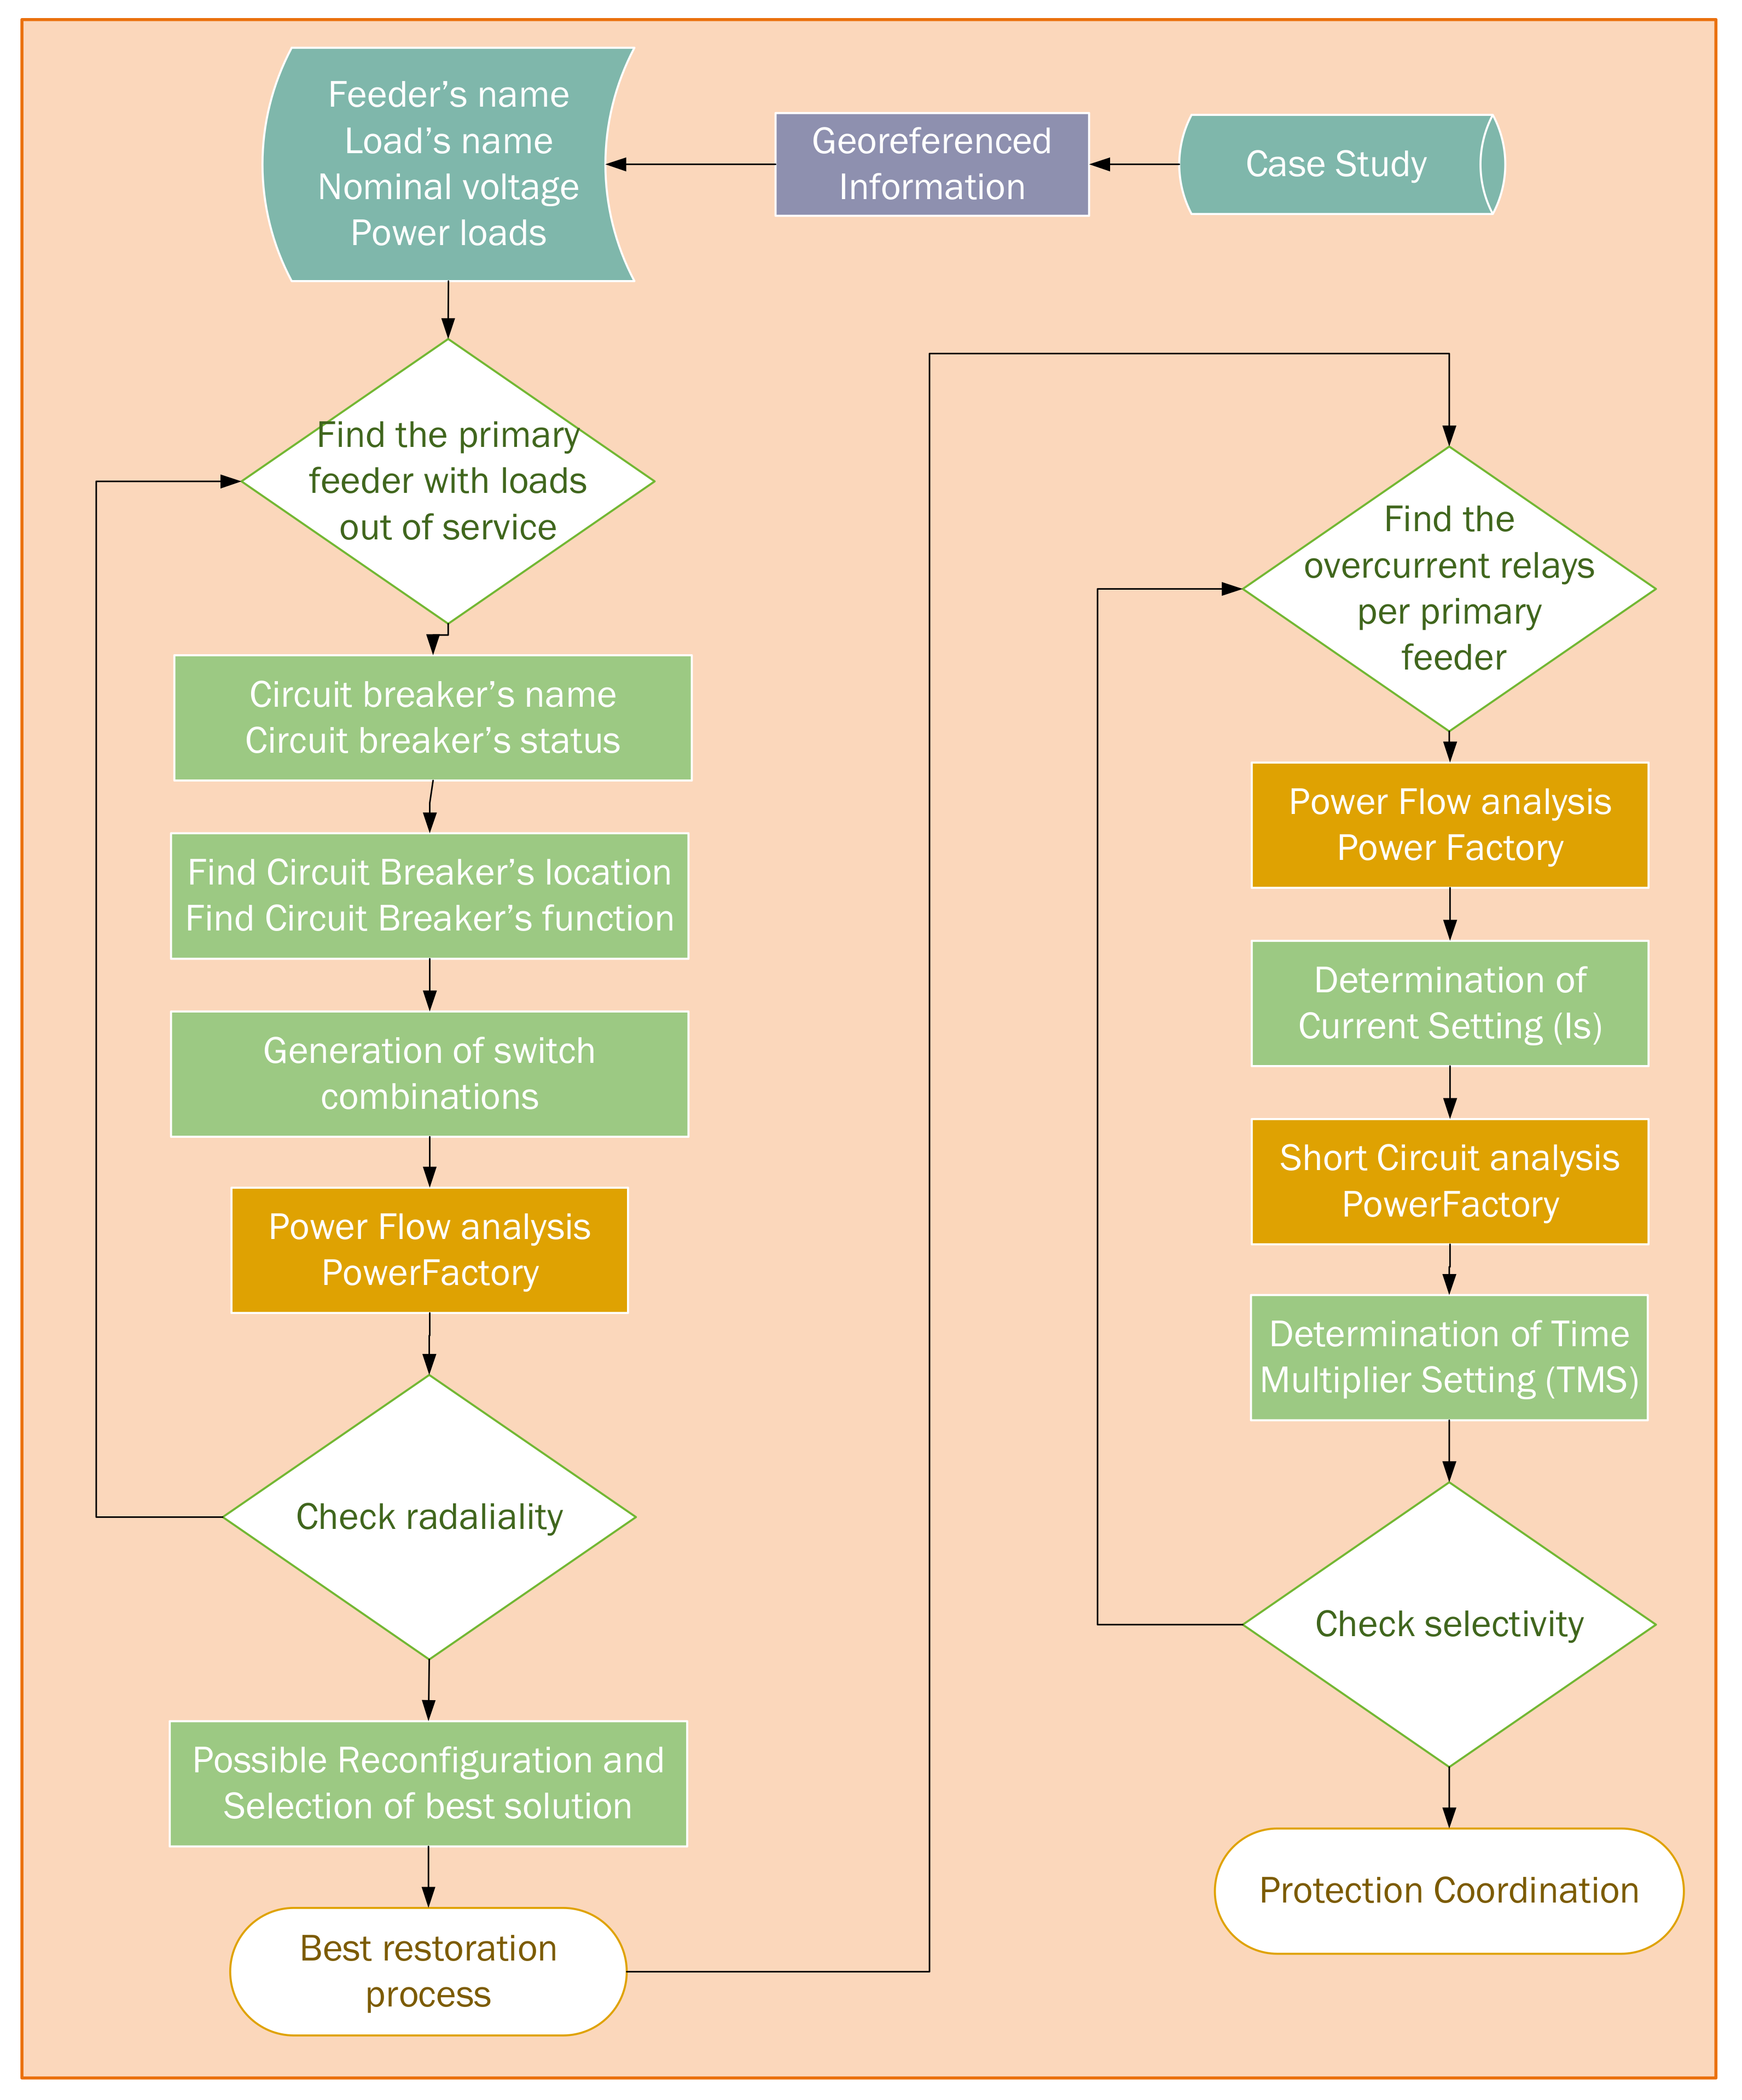
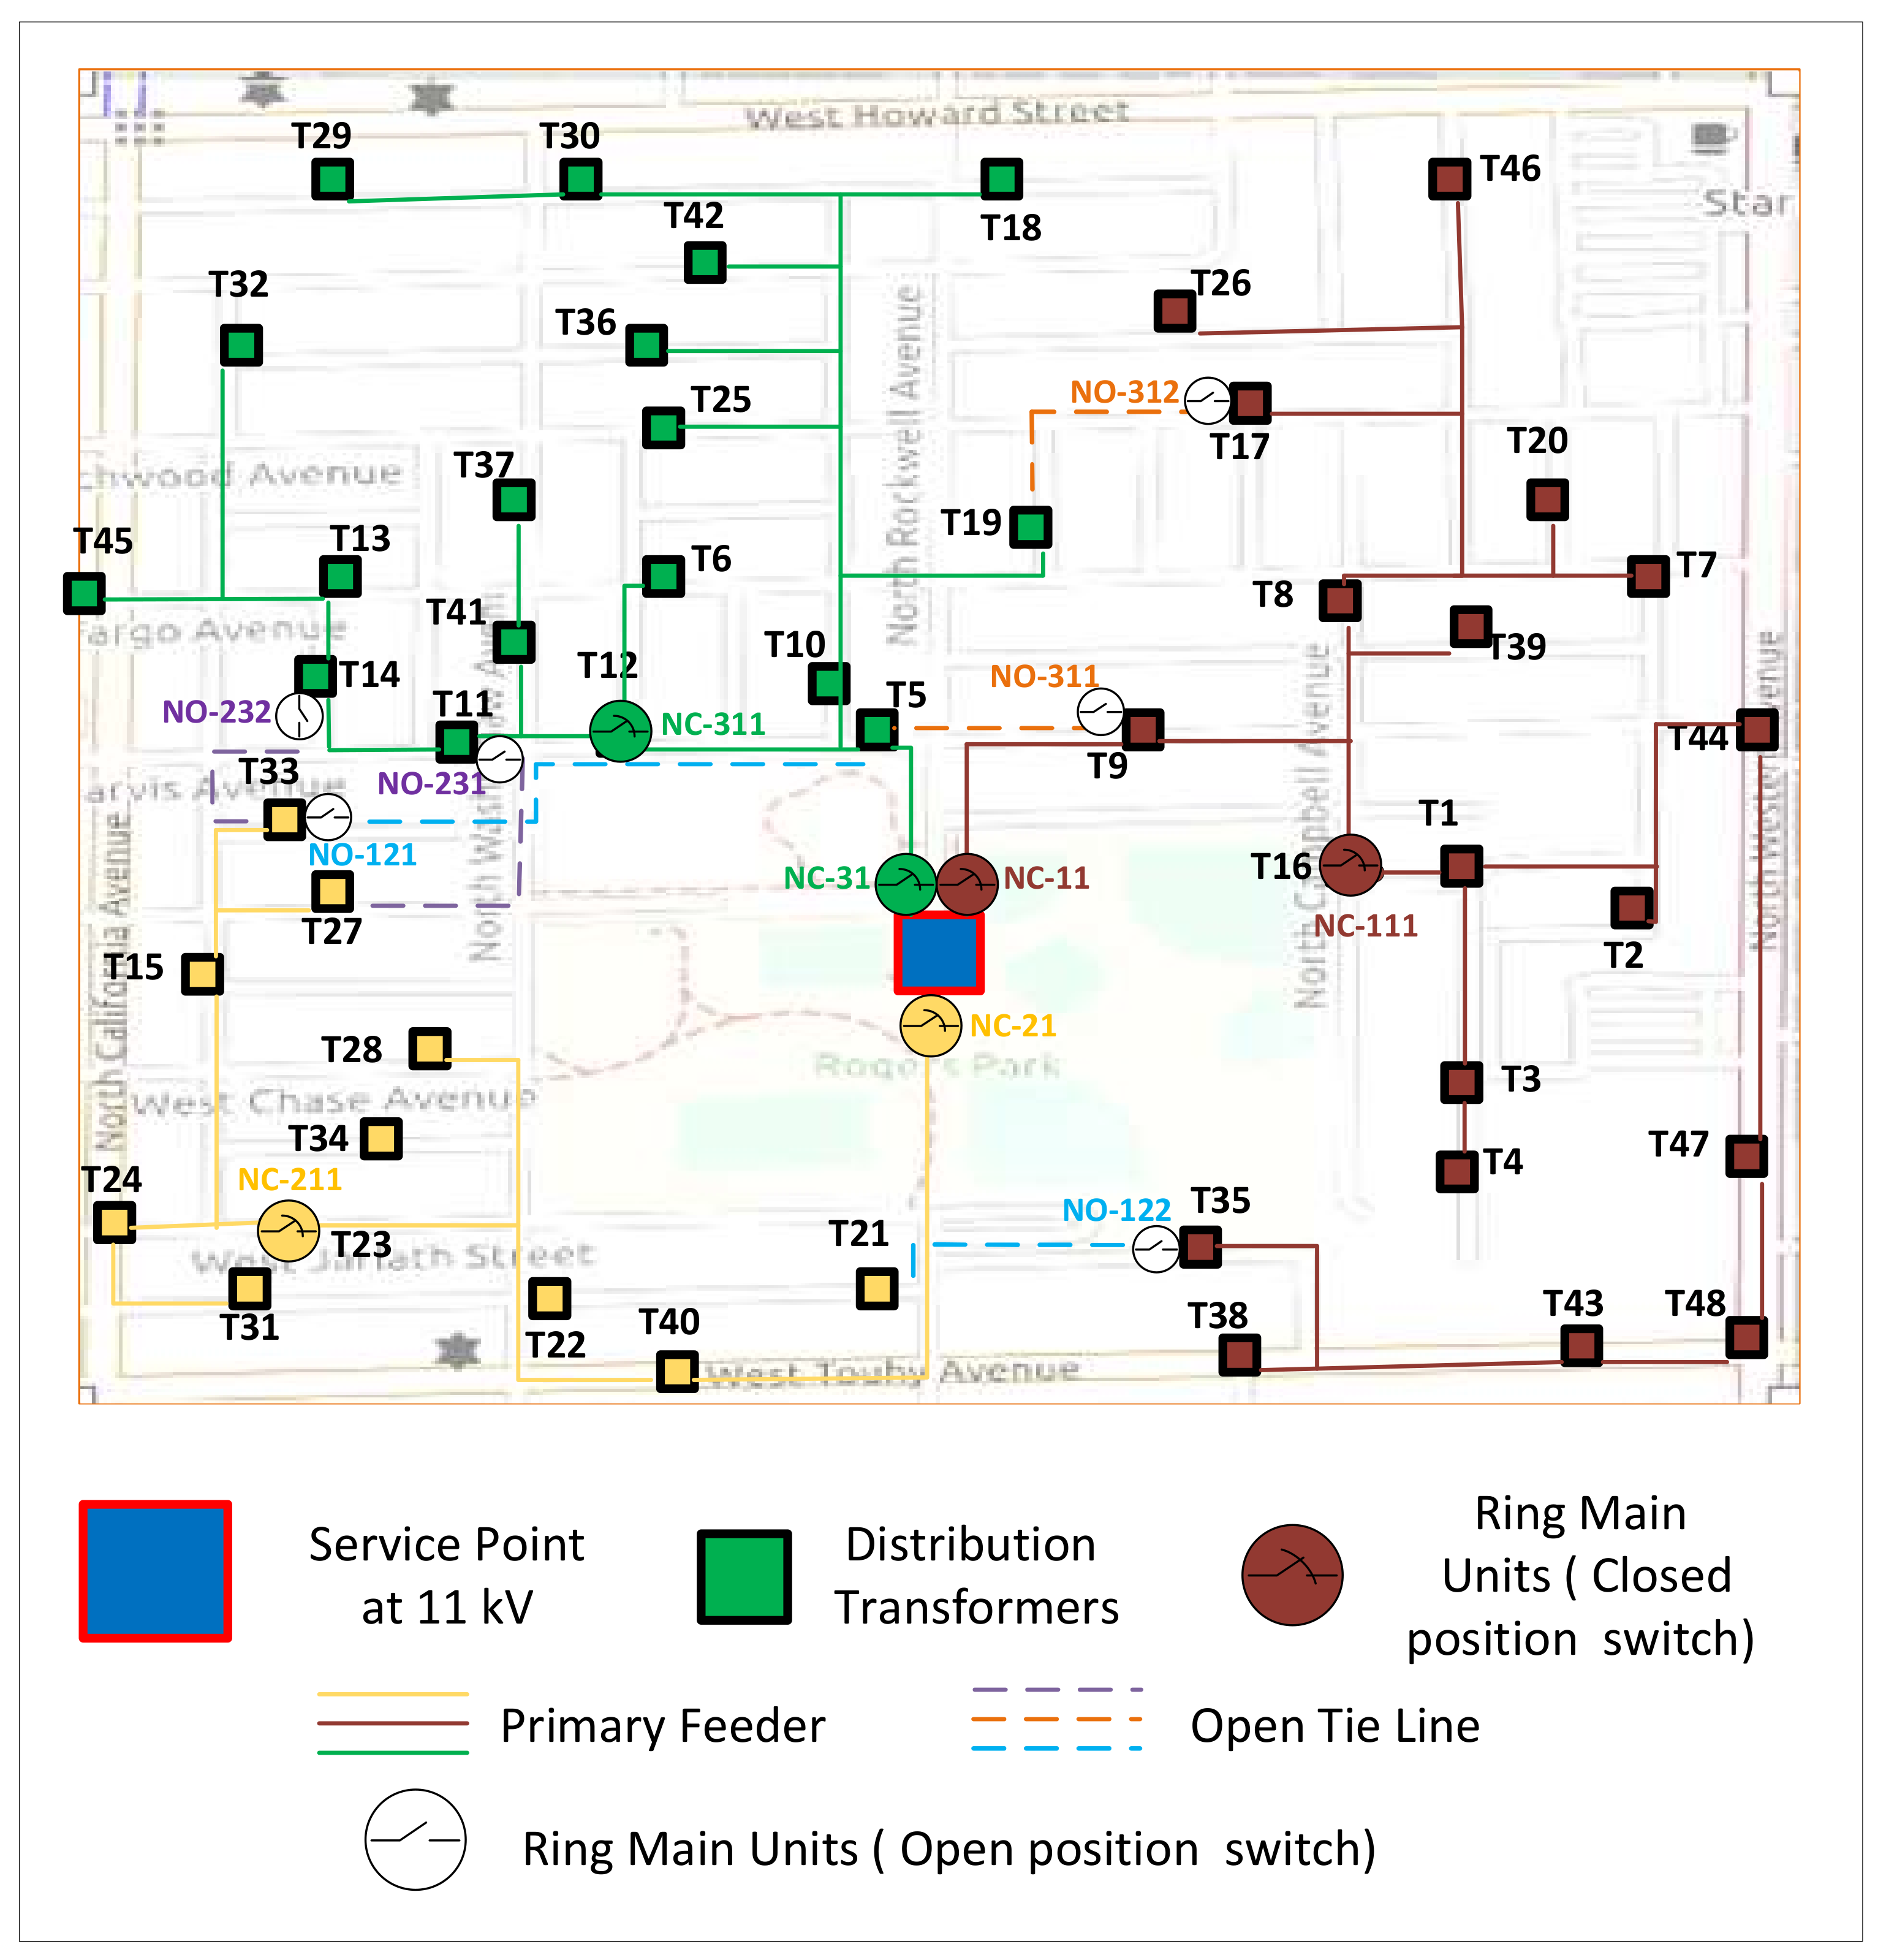
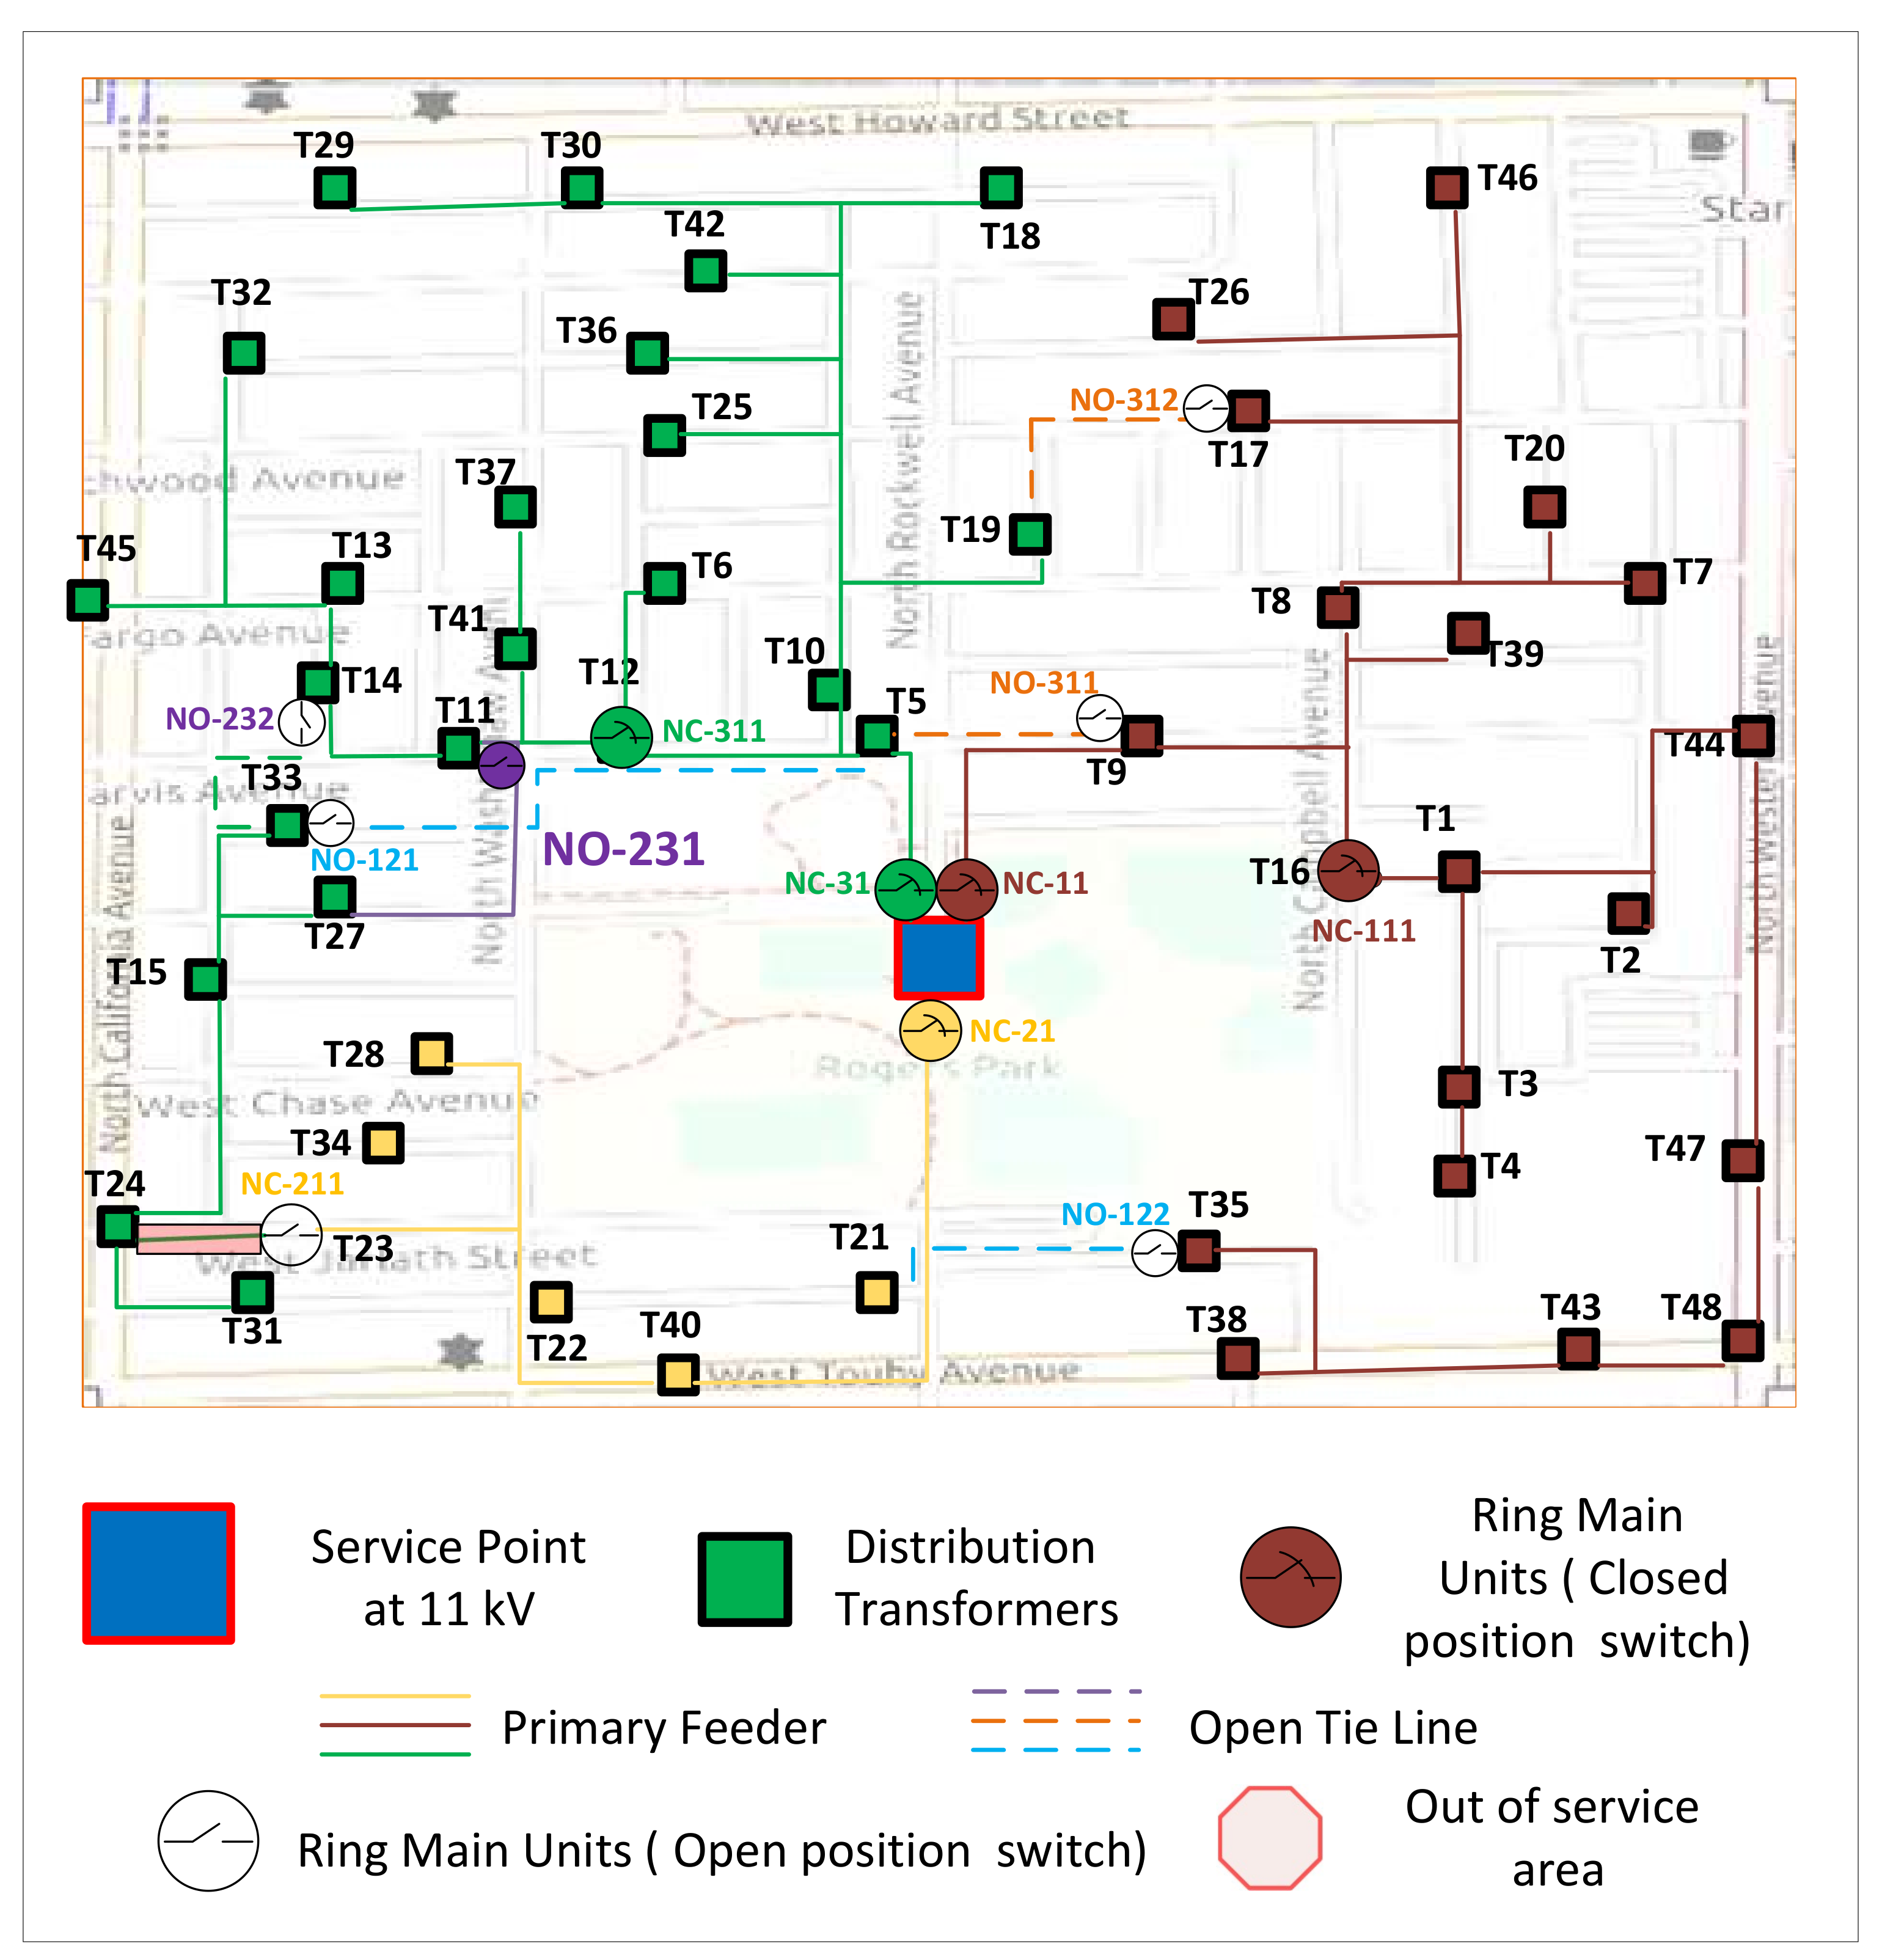
The service restoration on electrical networks is a crucial task for distribution network operators due to the fact that a rapid and effective connection to the main grid ensure high levels of continuity of service by switching operations of tie lines. The proposed restoration strategy has been applied to a predefined case study, which was designed considering a resilient planning for a residential and commercial sector, as depicted in Figure 6 [2]. The proposed case study considers three different primary feeders, which feed several distribution transformers, the Ring Main Units (RMU). Control, protection and communication capabilities are also considered. Table 3 shows the features and the parameters of the proposed case study.
The three underground primary feeders are based on a radial configuration with external interconnections (tie lines), which have enough capacity to connect and transfer end-customers between primary feeders. Circuit breakers on auxiliary interconnections are normally open, but they allow various configurations when are tripped by emergency conditions. For this case, overcurrent relays have been located on specific positions such as tie lines, and in the middle of the primary feeder, as sketched in Figure 6. Additionally, Table 4 shows the initial switching status of the ring main units which have overcurrent relays.
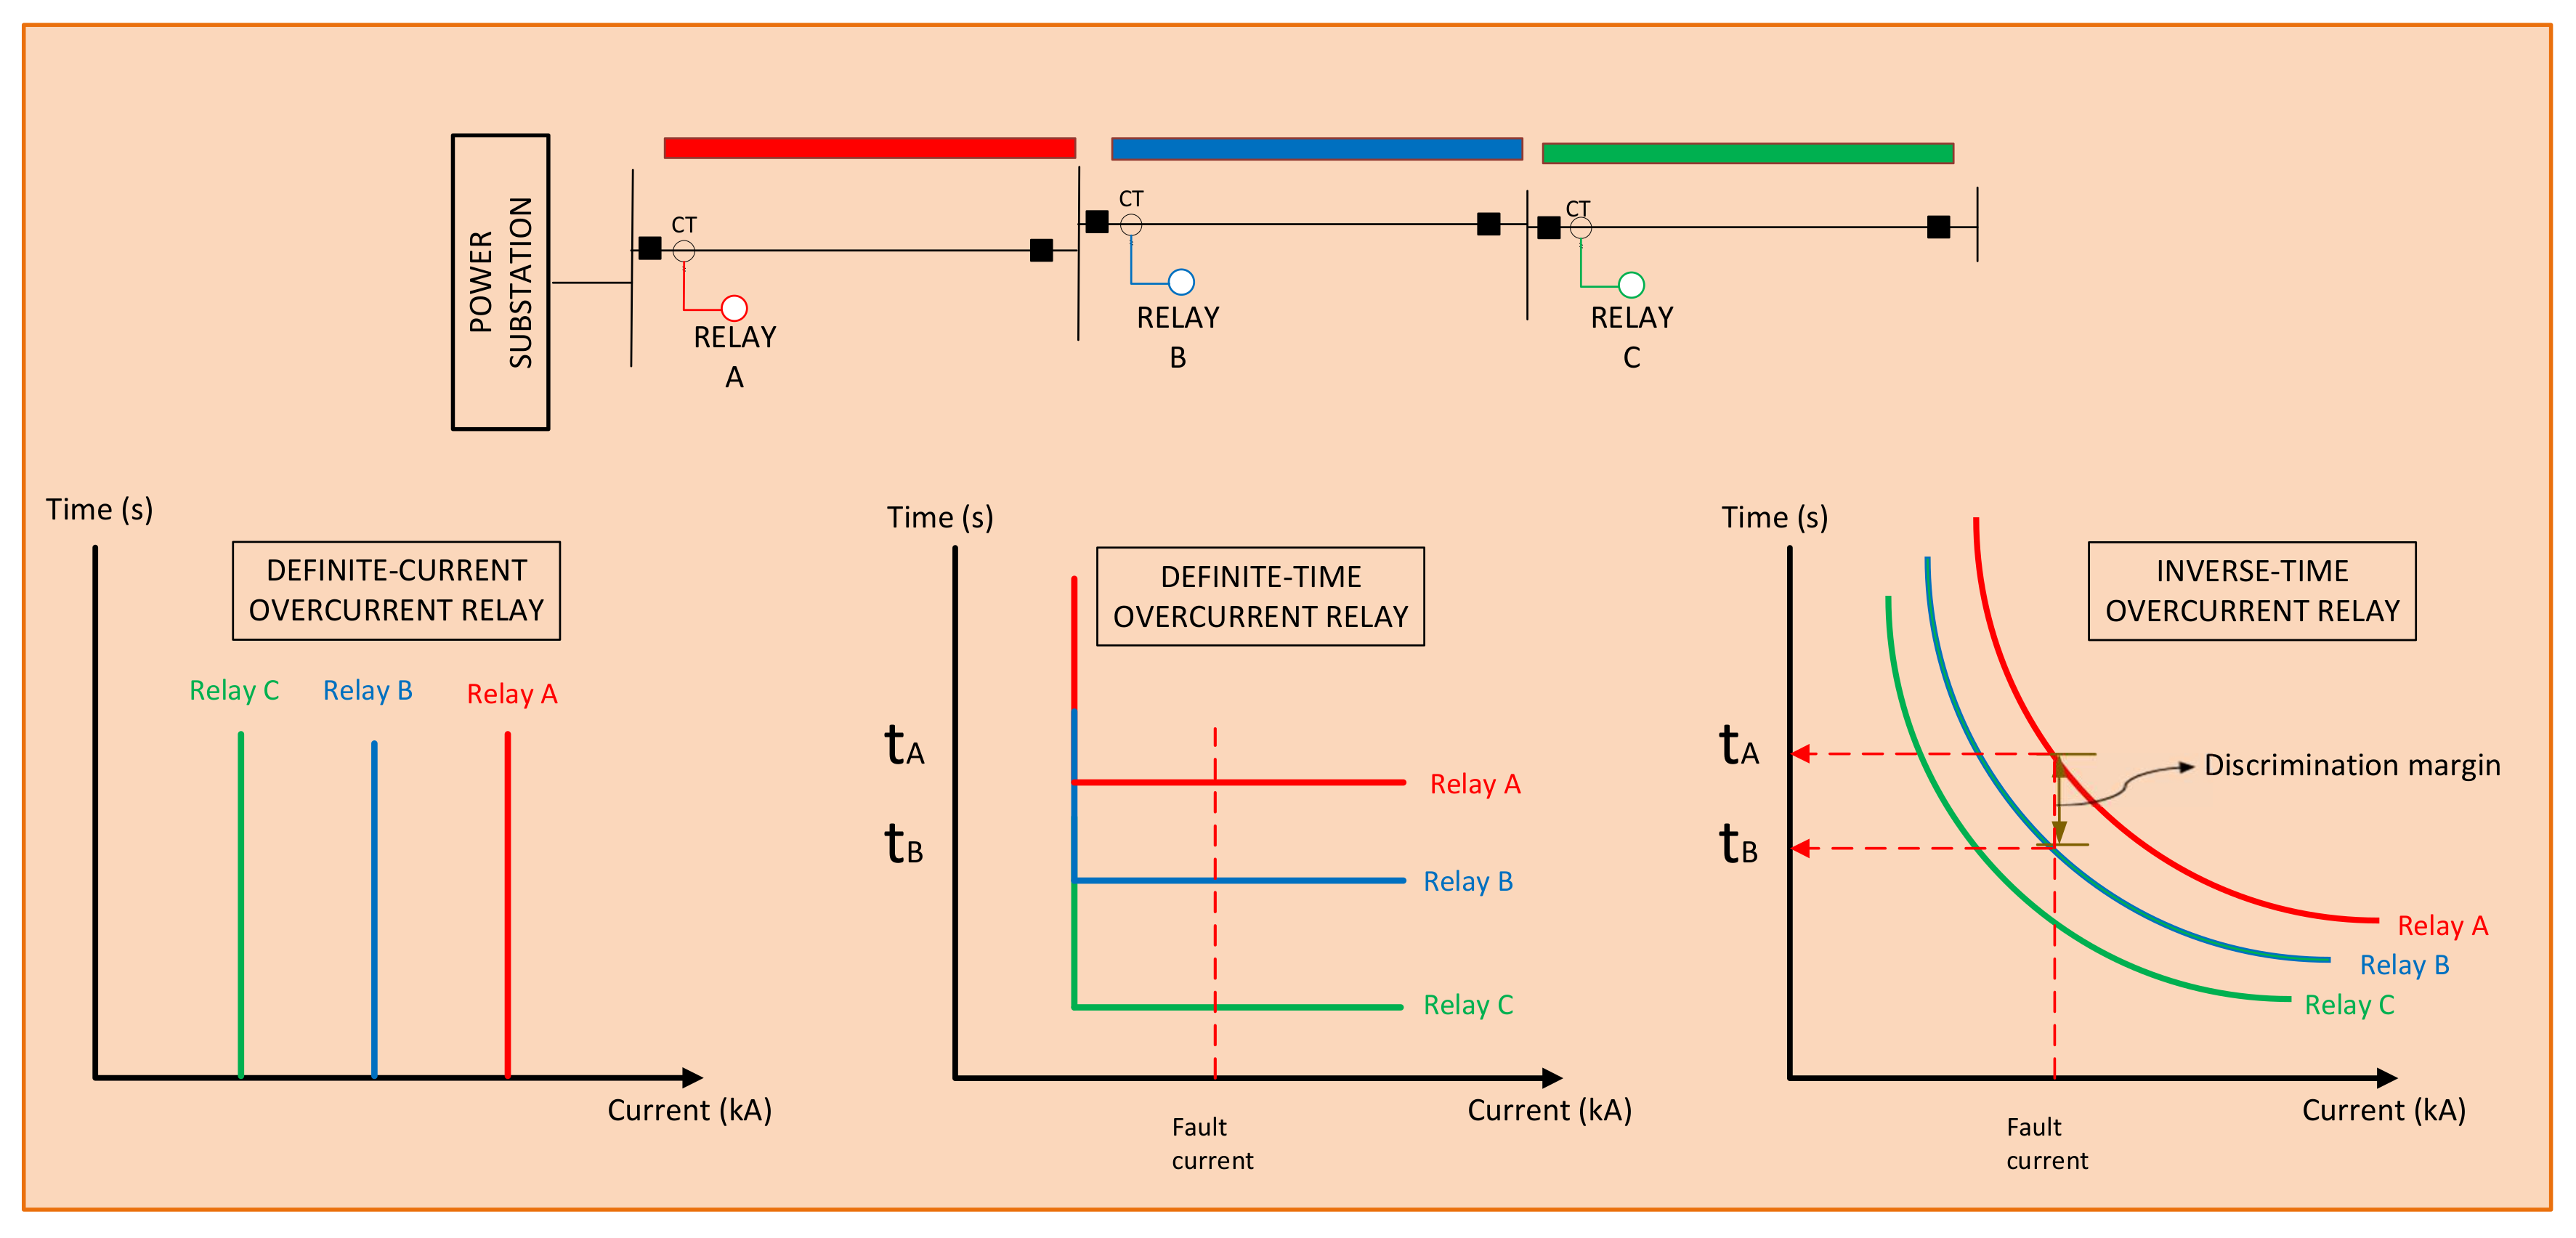
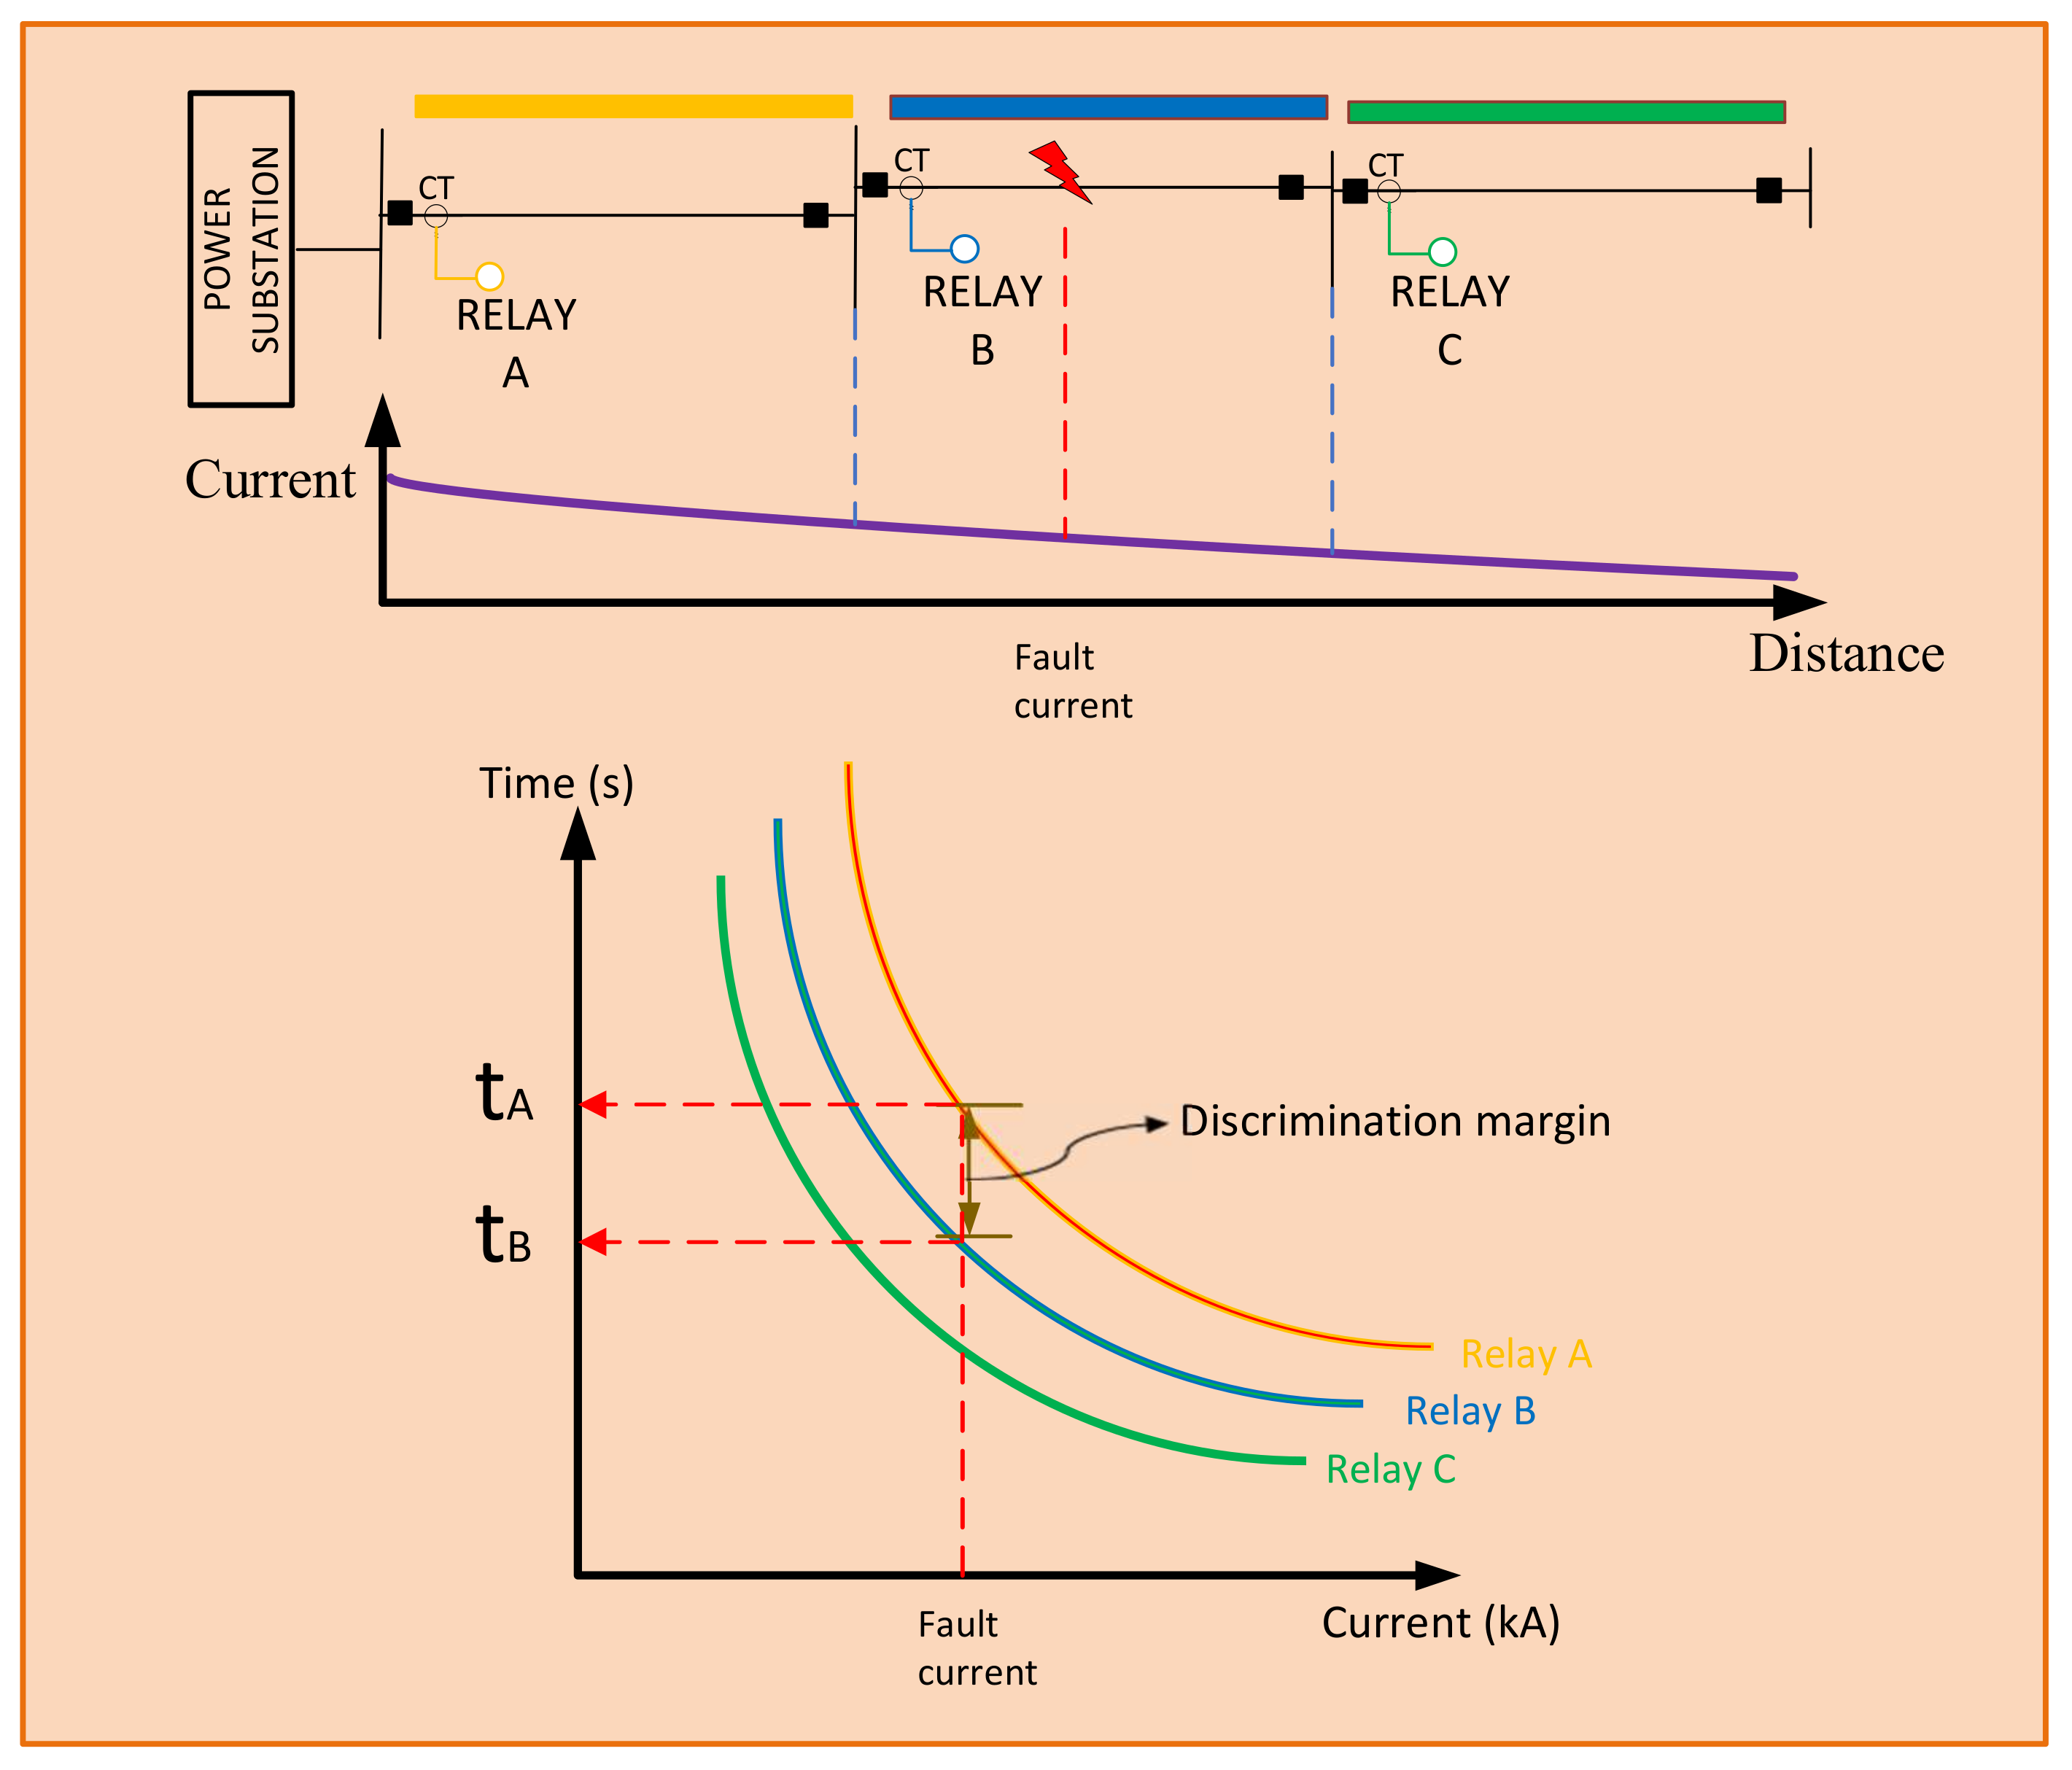
As remarked above, protection coordination can be associated with a network resilience because proper protection devices allow the rapid restoration of a power network, and permit the facing of any disturbance or anomalous event after a grid reconfiguration. Consequently, all switching equipment and overcurrrent relays can be operated and configured by remote control from a utility control center. These strategies and features provide higher service reliability and flexibility under unusual circumstances, due to the fact that customers’ loads are managed by another primary feeder to minimize interruption times. The principle of selectivity has been considered on protection coordination of inverse-time overcurrent relays as highlighted in Figure 7, where I s and TMS for initial operating conditions are reported in Table 5 for each of the primary feeders. Figure 7 shows a proper coordination of overcurrent relays located on feeder A, B and C, respectively. For initial conditions, each one of the primary feeders is protected by two overcurrent relays which are located at the beginning and the middle of the feeder, and they are displayed as red and green color, respectively. The vertical green and red lines represent the current circulating along the primary feeder at the relay point, and that value was used for determining the I s . The TMS has been calculated using Equation (1) (standard inverse IEC curve) considering a three phase short-circuit, as it represents the most severe event in a distribution network.

5.2. Results

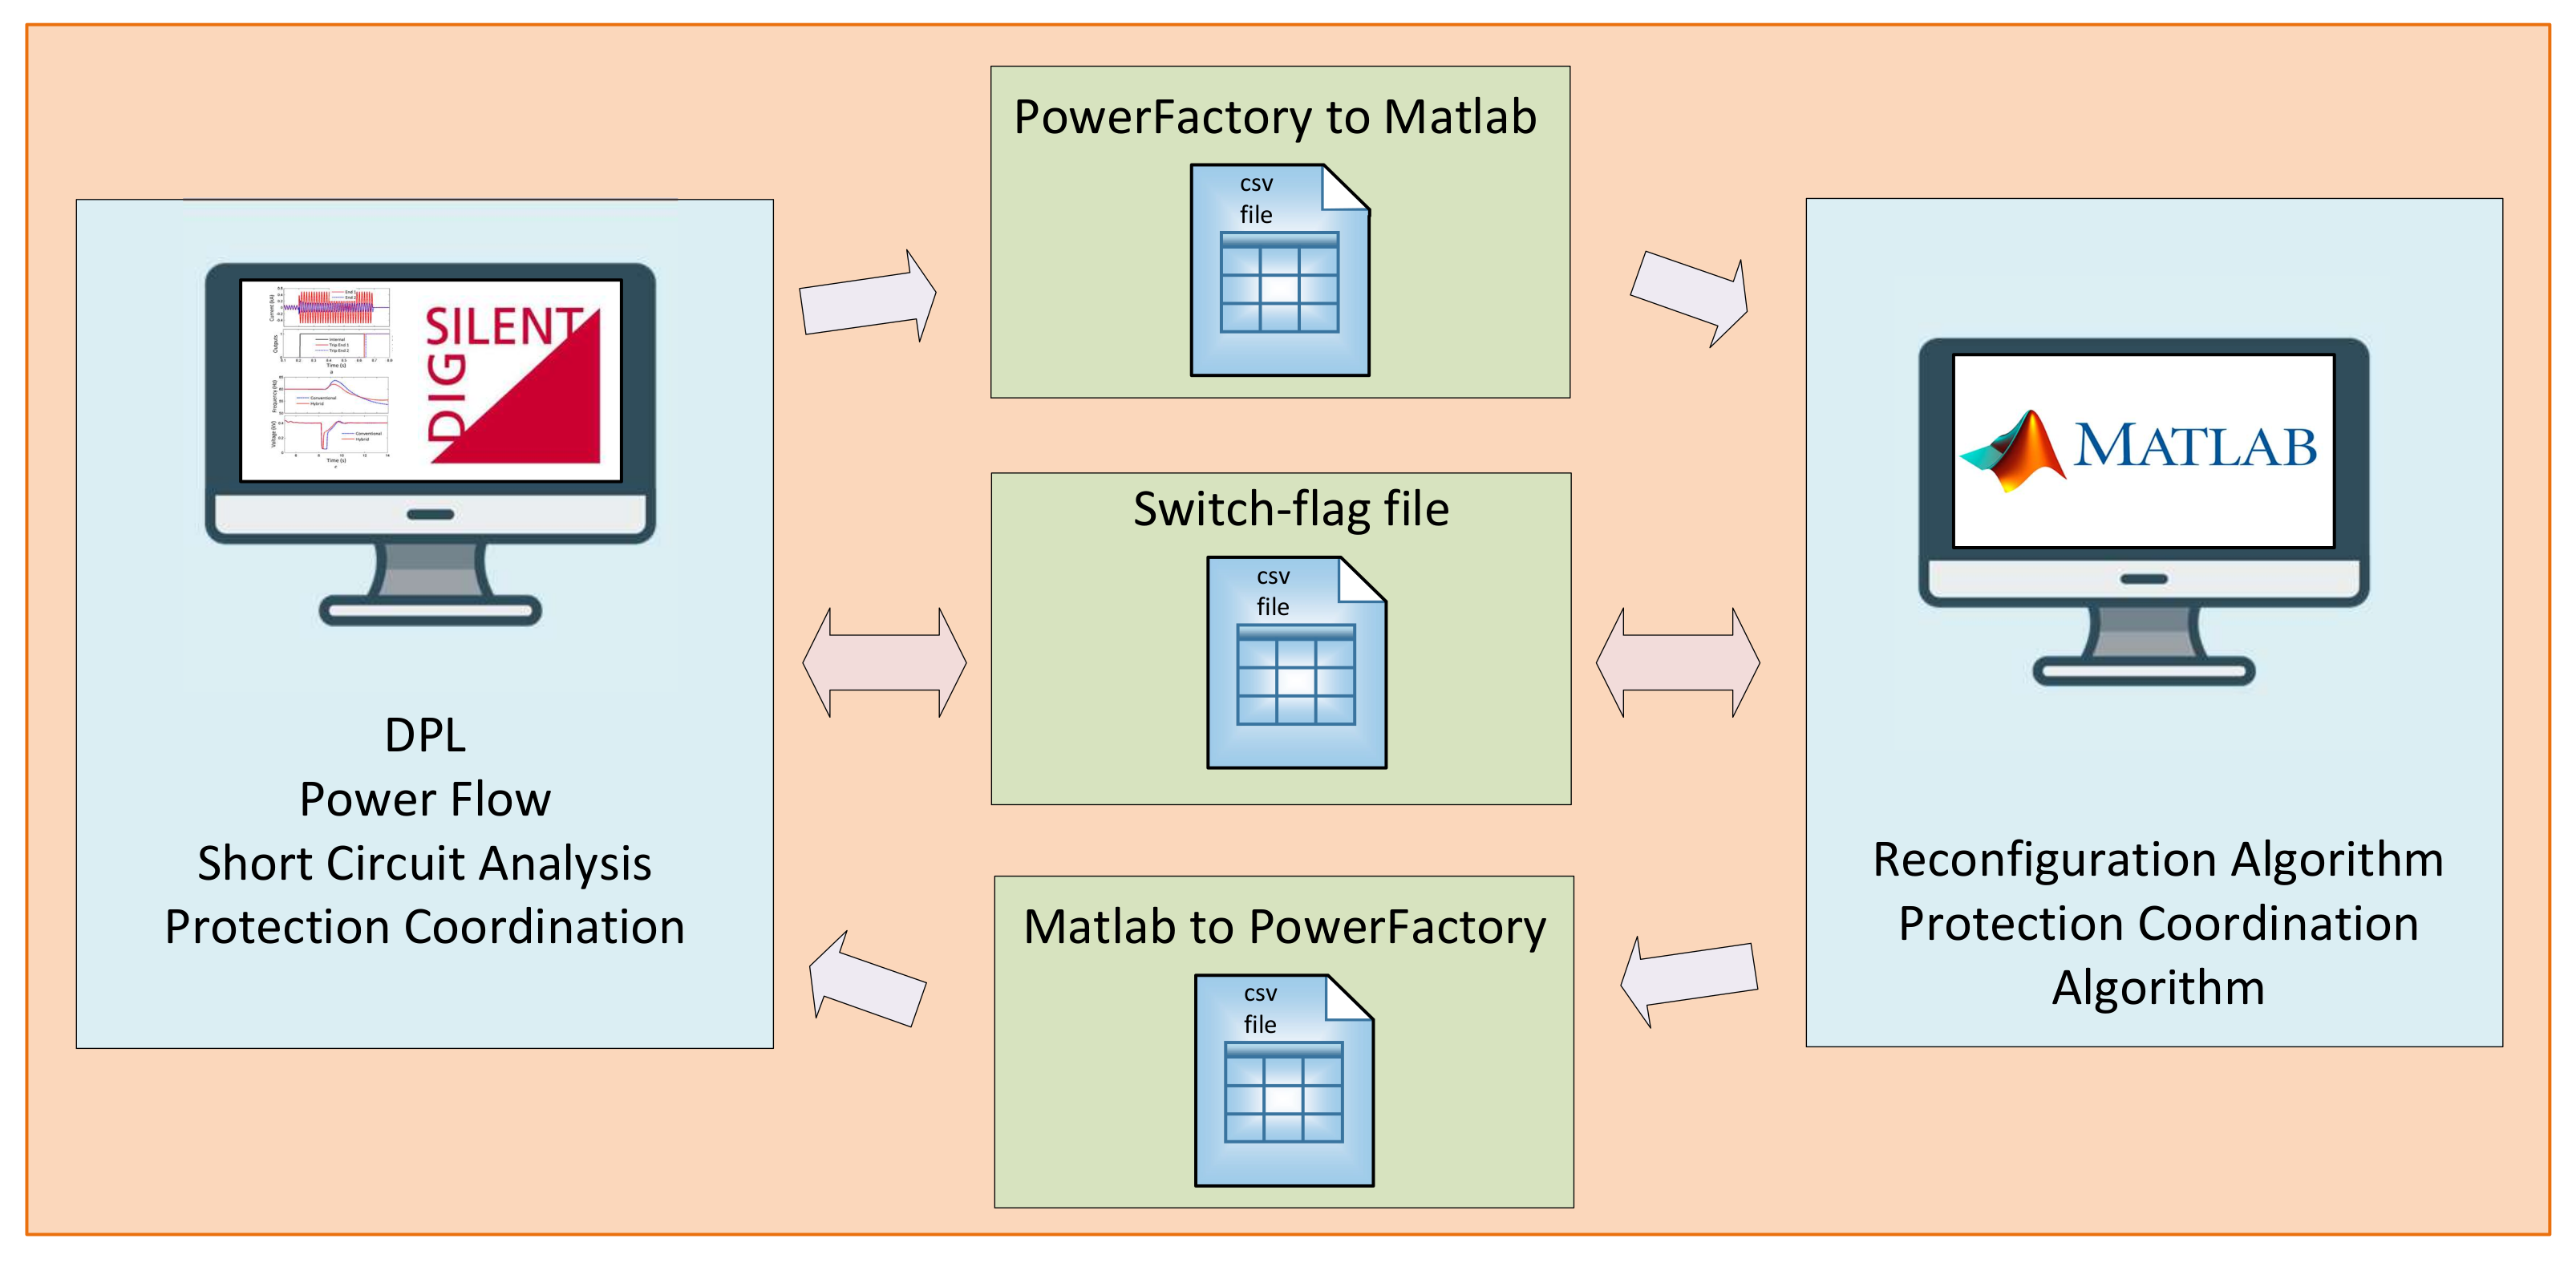
This section reports the results achieved from a peer-to-peer communication between Matlab and PowerFactory to develop a service restoration after an outage in a distribution network. Moreover, it also shows an adequate protection coordination on the distribution network. 
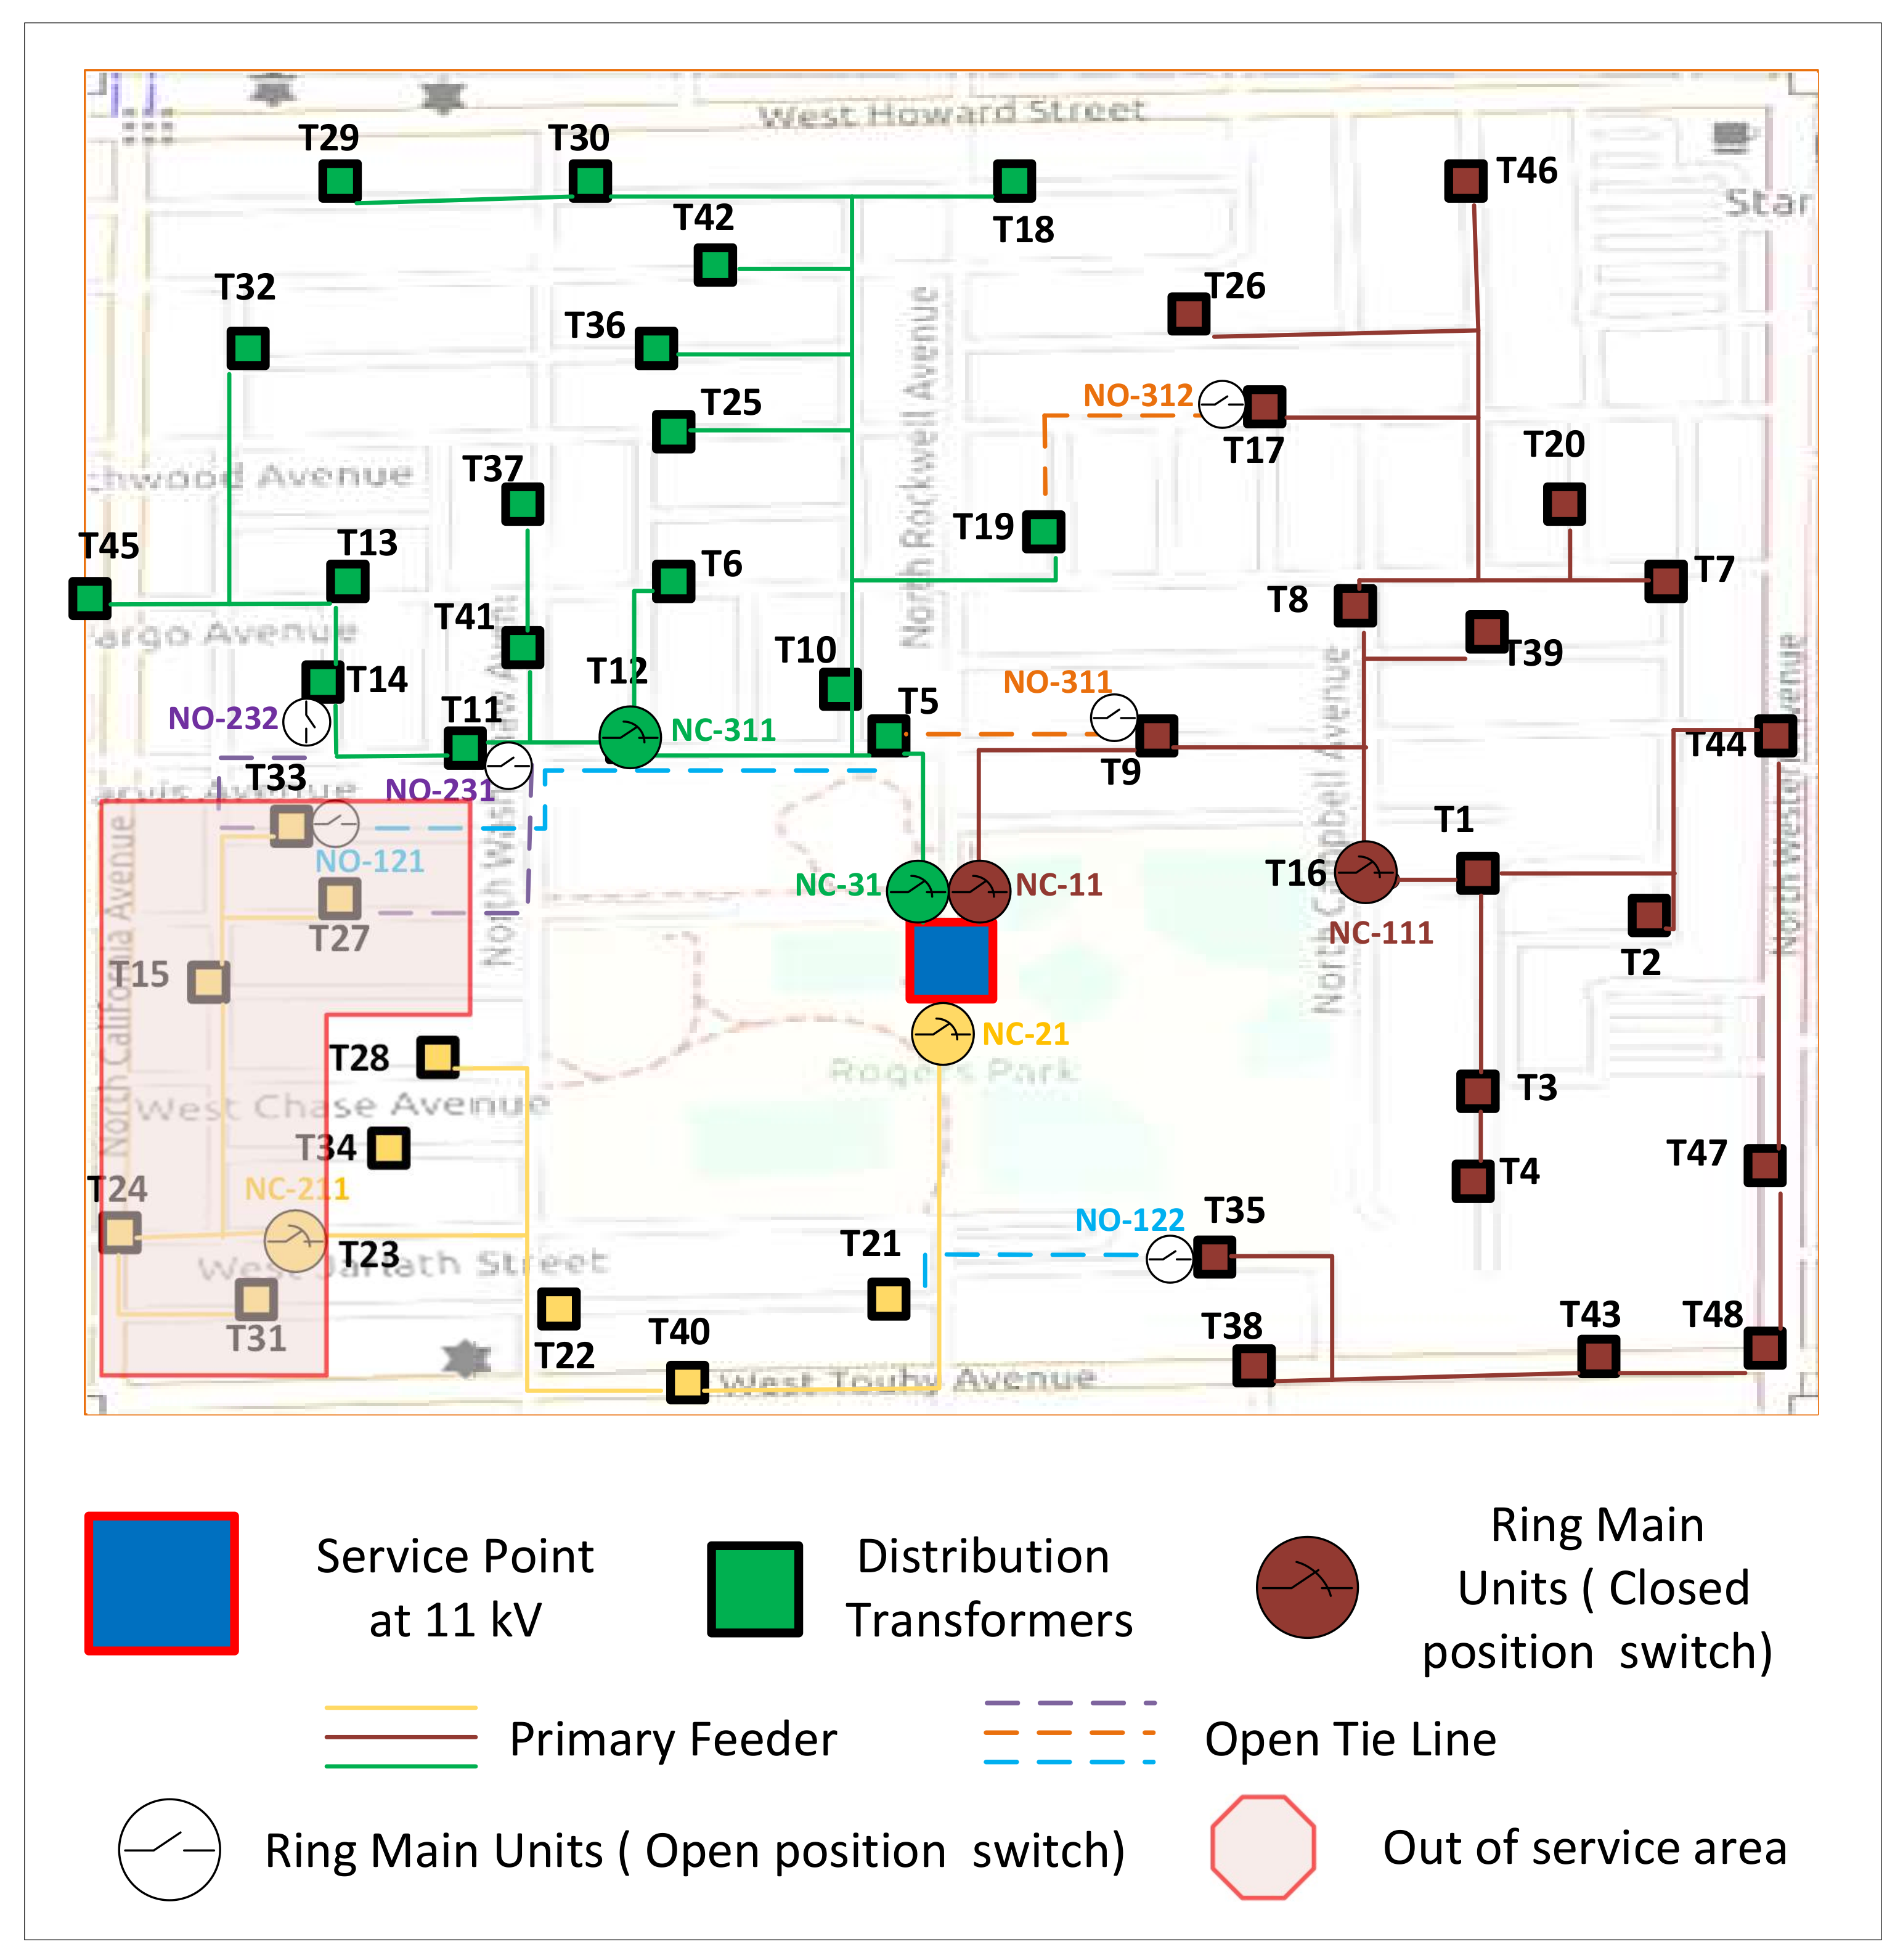
Figure 8 considers a particular case, where an out of service zone is highlighted in red after the detection and the execution of protective and switchgear equipment of ring main units. The tripping of the circuit breaker is produced in the case of anomalous events in primary feeders due to temporary or permanent faults generated by flashover, insulation failure and open-circuit faults.
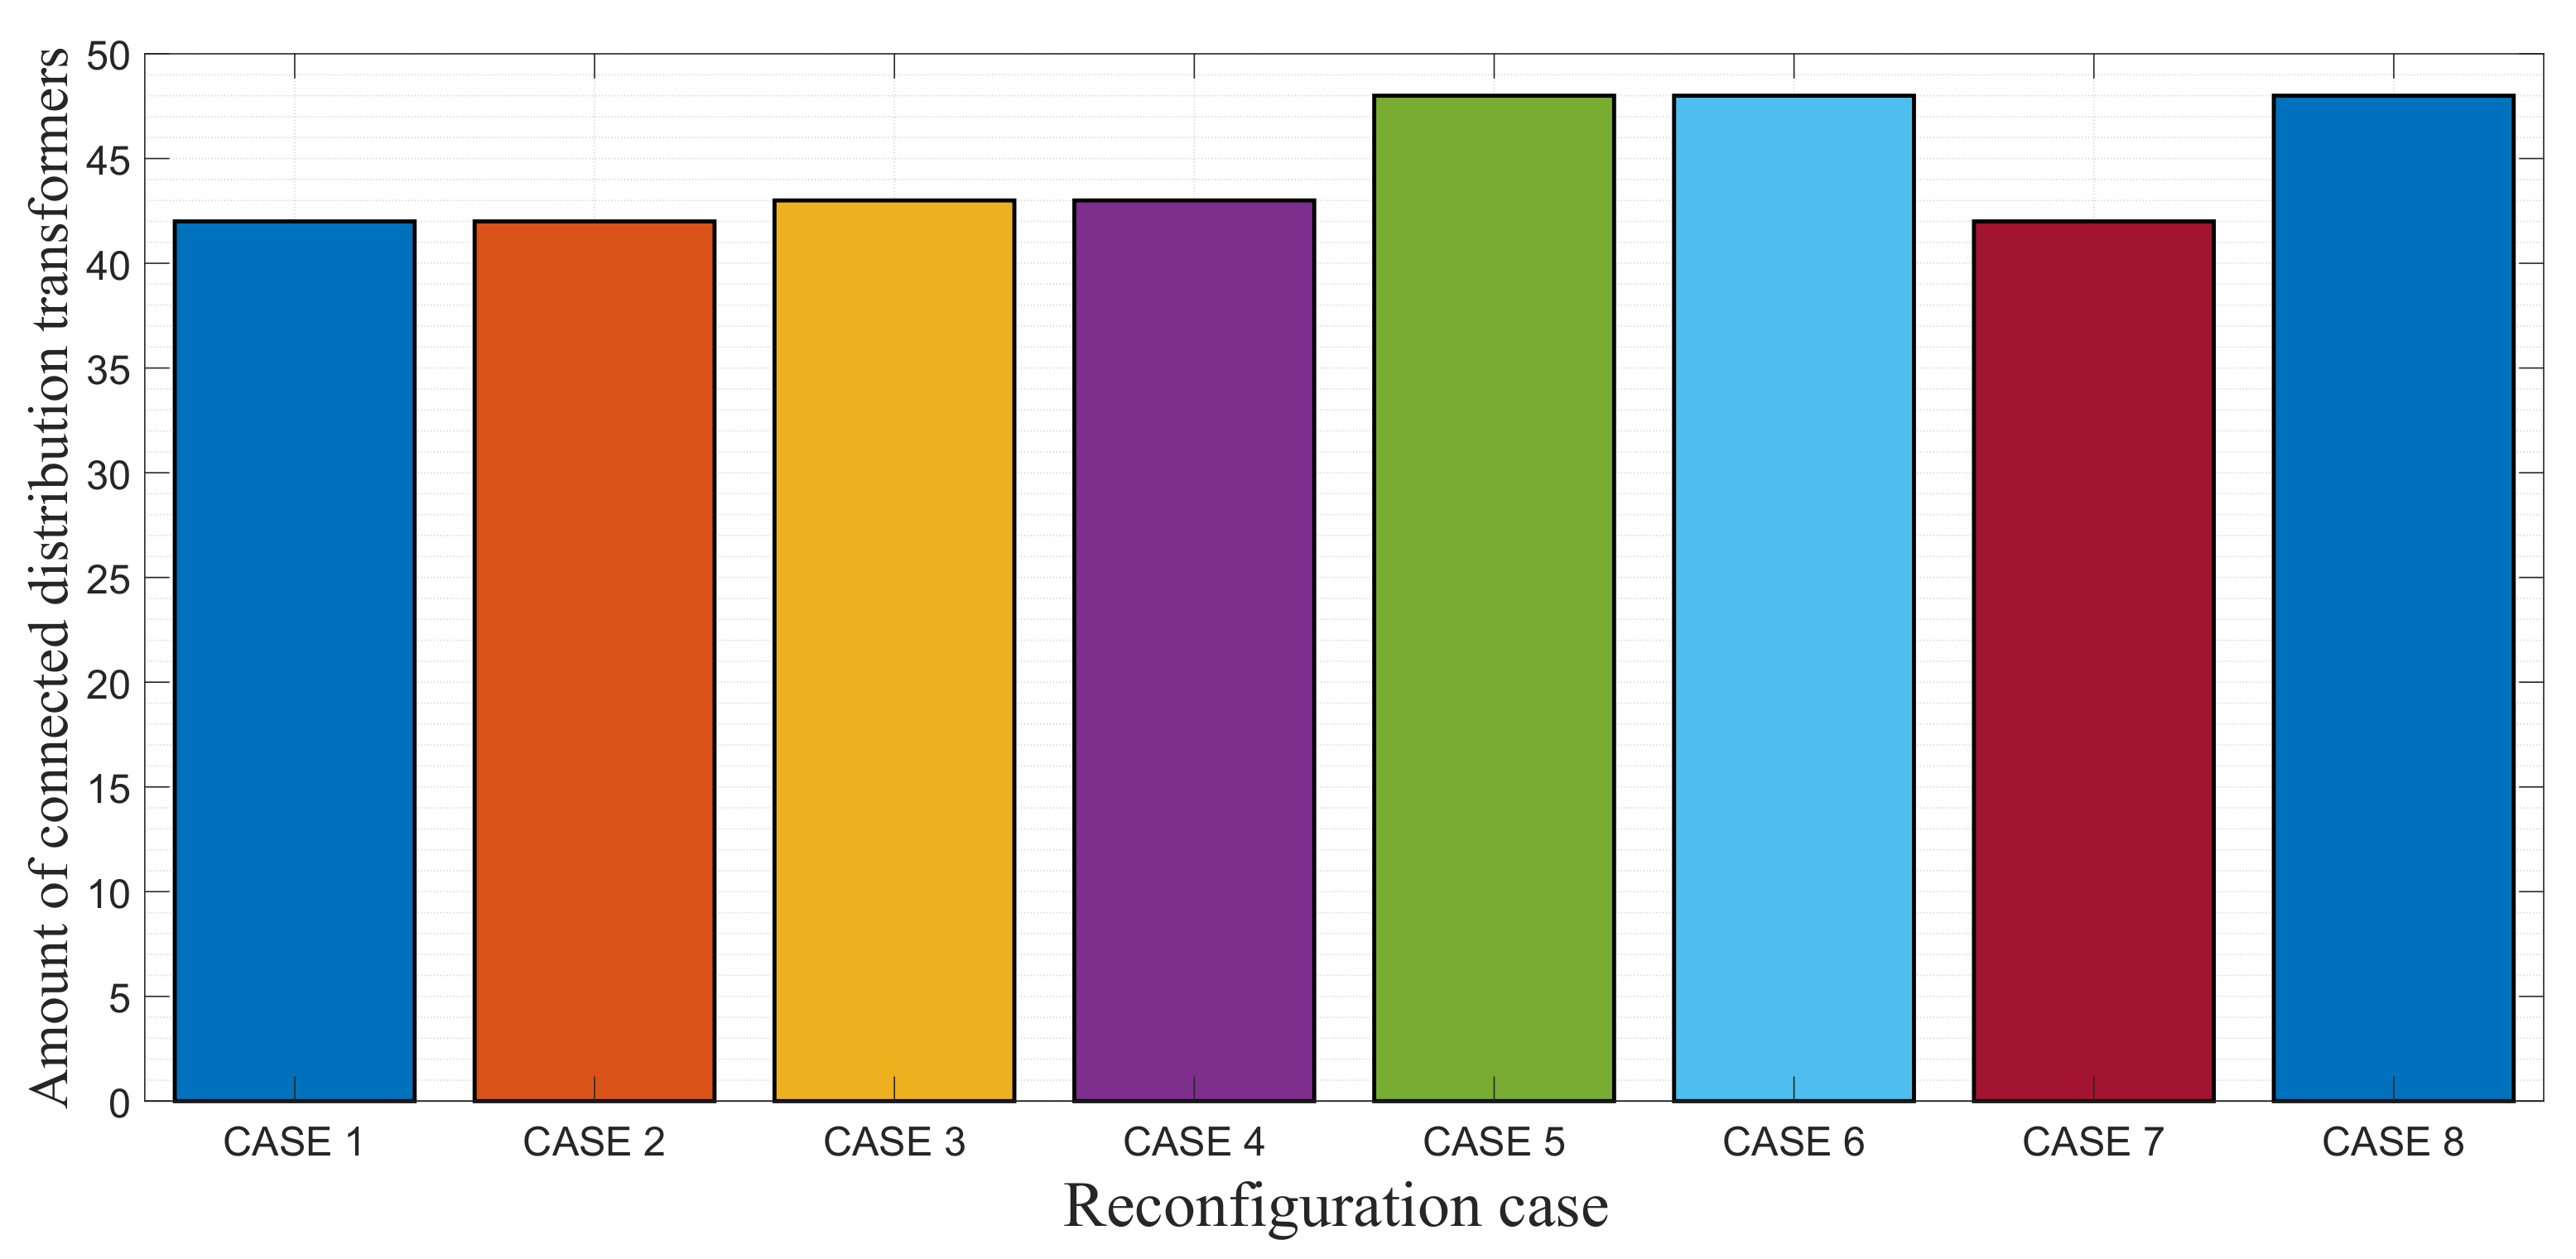
The reconfiguration algorithm is applied to the distribution network, after the detection of unusual operating conditions by the utility monitoring system. The peer-to-peer communication between Matlab and PowerFactory has generated several reconfiguration strategies; however, only 8 possible feasible options are considered because they are directly related to the faulty feeder, and they meet the technical requirements of voltage level and radiality. Table 6 shows the status of each switchgear equipment, in each one of the reconfiguration cases. Furthermore, Figure 9 depicts the number of distribution transformers connected to the main grid by the restoration process. Only three solutions correspond to the case where the complete load of the power substation is fed i.e., 48 distribution transformers are connected to primary feeders.
Figure 10 shows the distribution network under the new operating conditions, where switchgear equipment NC-211 is in open position, and NO-231 has changed to closed position. As a result of this switch operation the network has been reconfigured; consequently, the amount of restored load is maximized, thus minimizing out of service areas ( box highlighted in red). The new operation condition indicates that some distribution transformers has been connected to feeder C ( green feeder) due to the faulty section on primary feeder A. Figure 10 highlights the results provided by the proposed algorithm using communication peer-to-peer between Matlab and PowerFactory, which can be applied to different distribution networks.
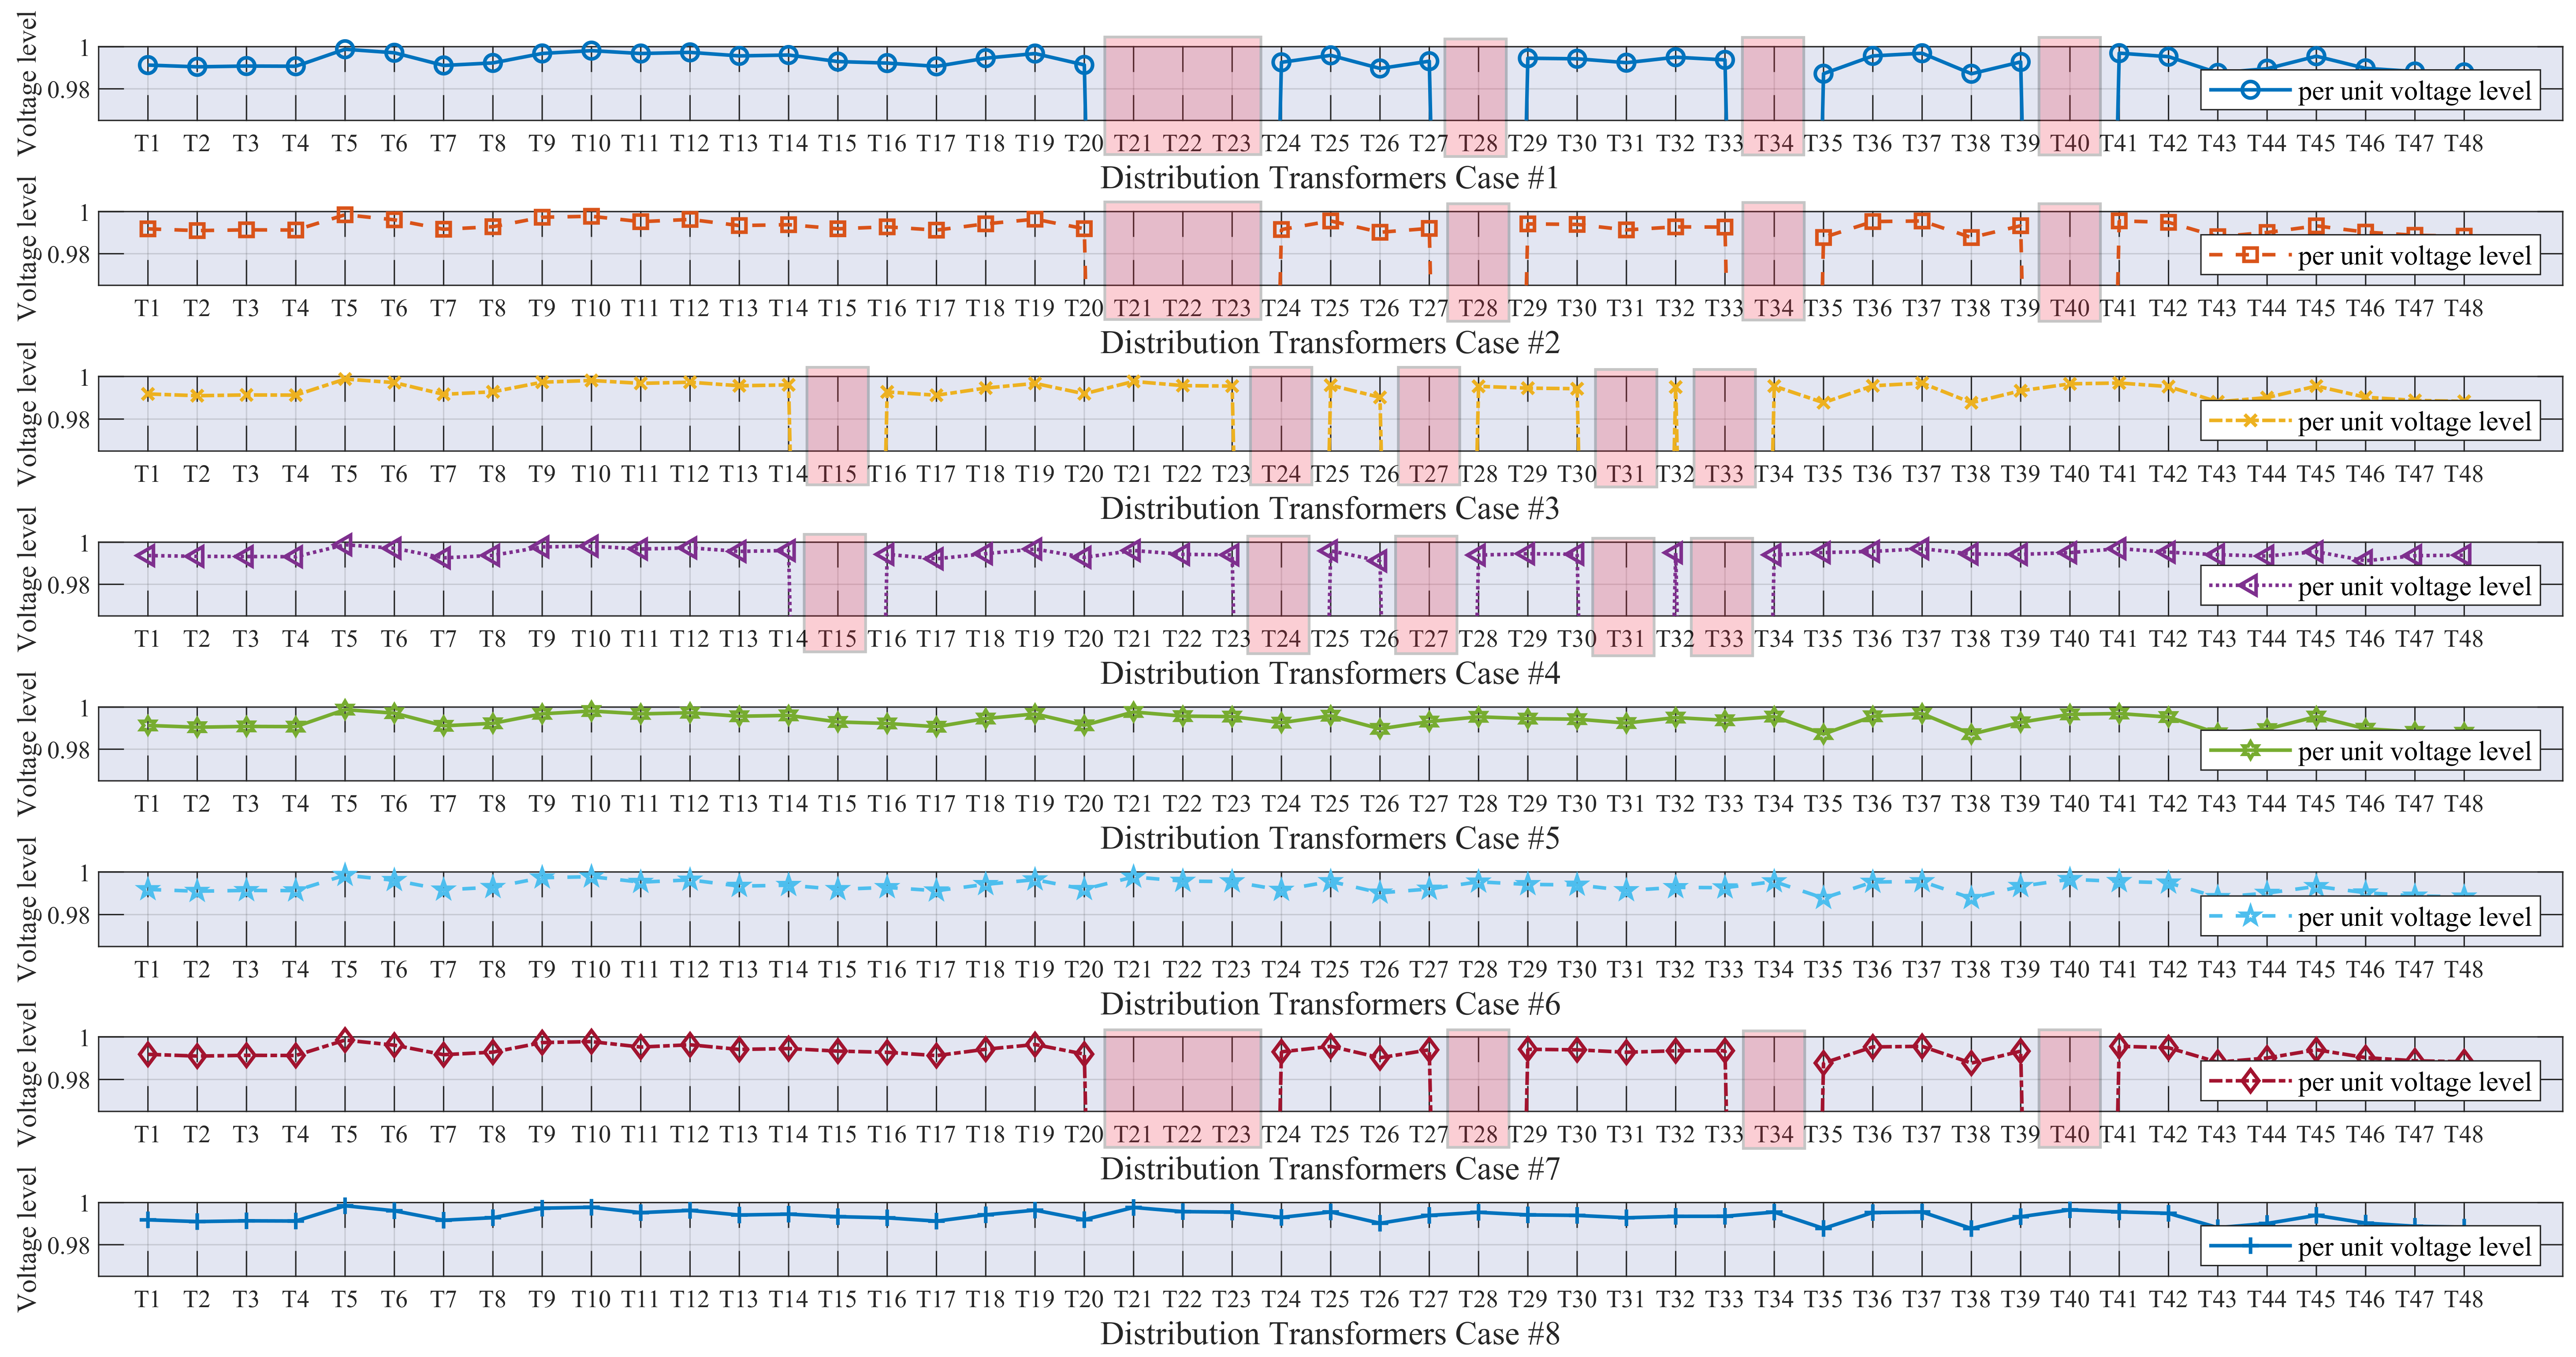
As already remarked, the reconfiguration process is solved as an optimization problem, where the objective function aims to maximize the restored load subject to technical constraints such voltage levels and radiality. The 8 feasible solutions are represented by means of the voltage levels at each distribution transformer, as reported in Figure 11. In particular, an out of service transformer is represented with a zero voltage level (highlighted in red). For this case study, three suitable solutions maximize the value of the restored load subject to technical constraints such voltage levels and radiality. Therefore, a comparison of these 3 feasible solutions is performed to determine the best reconfiguration solution based on voltage levels.
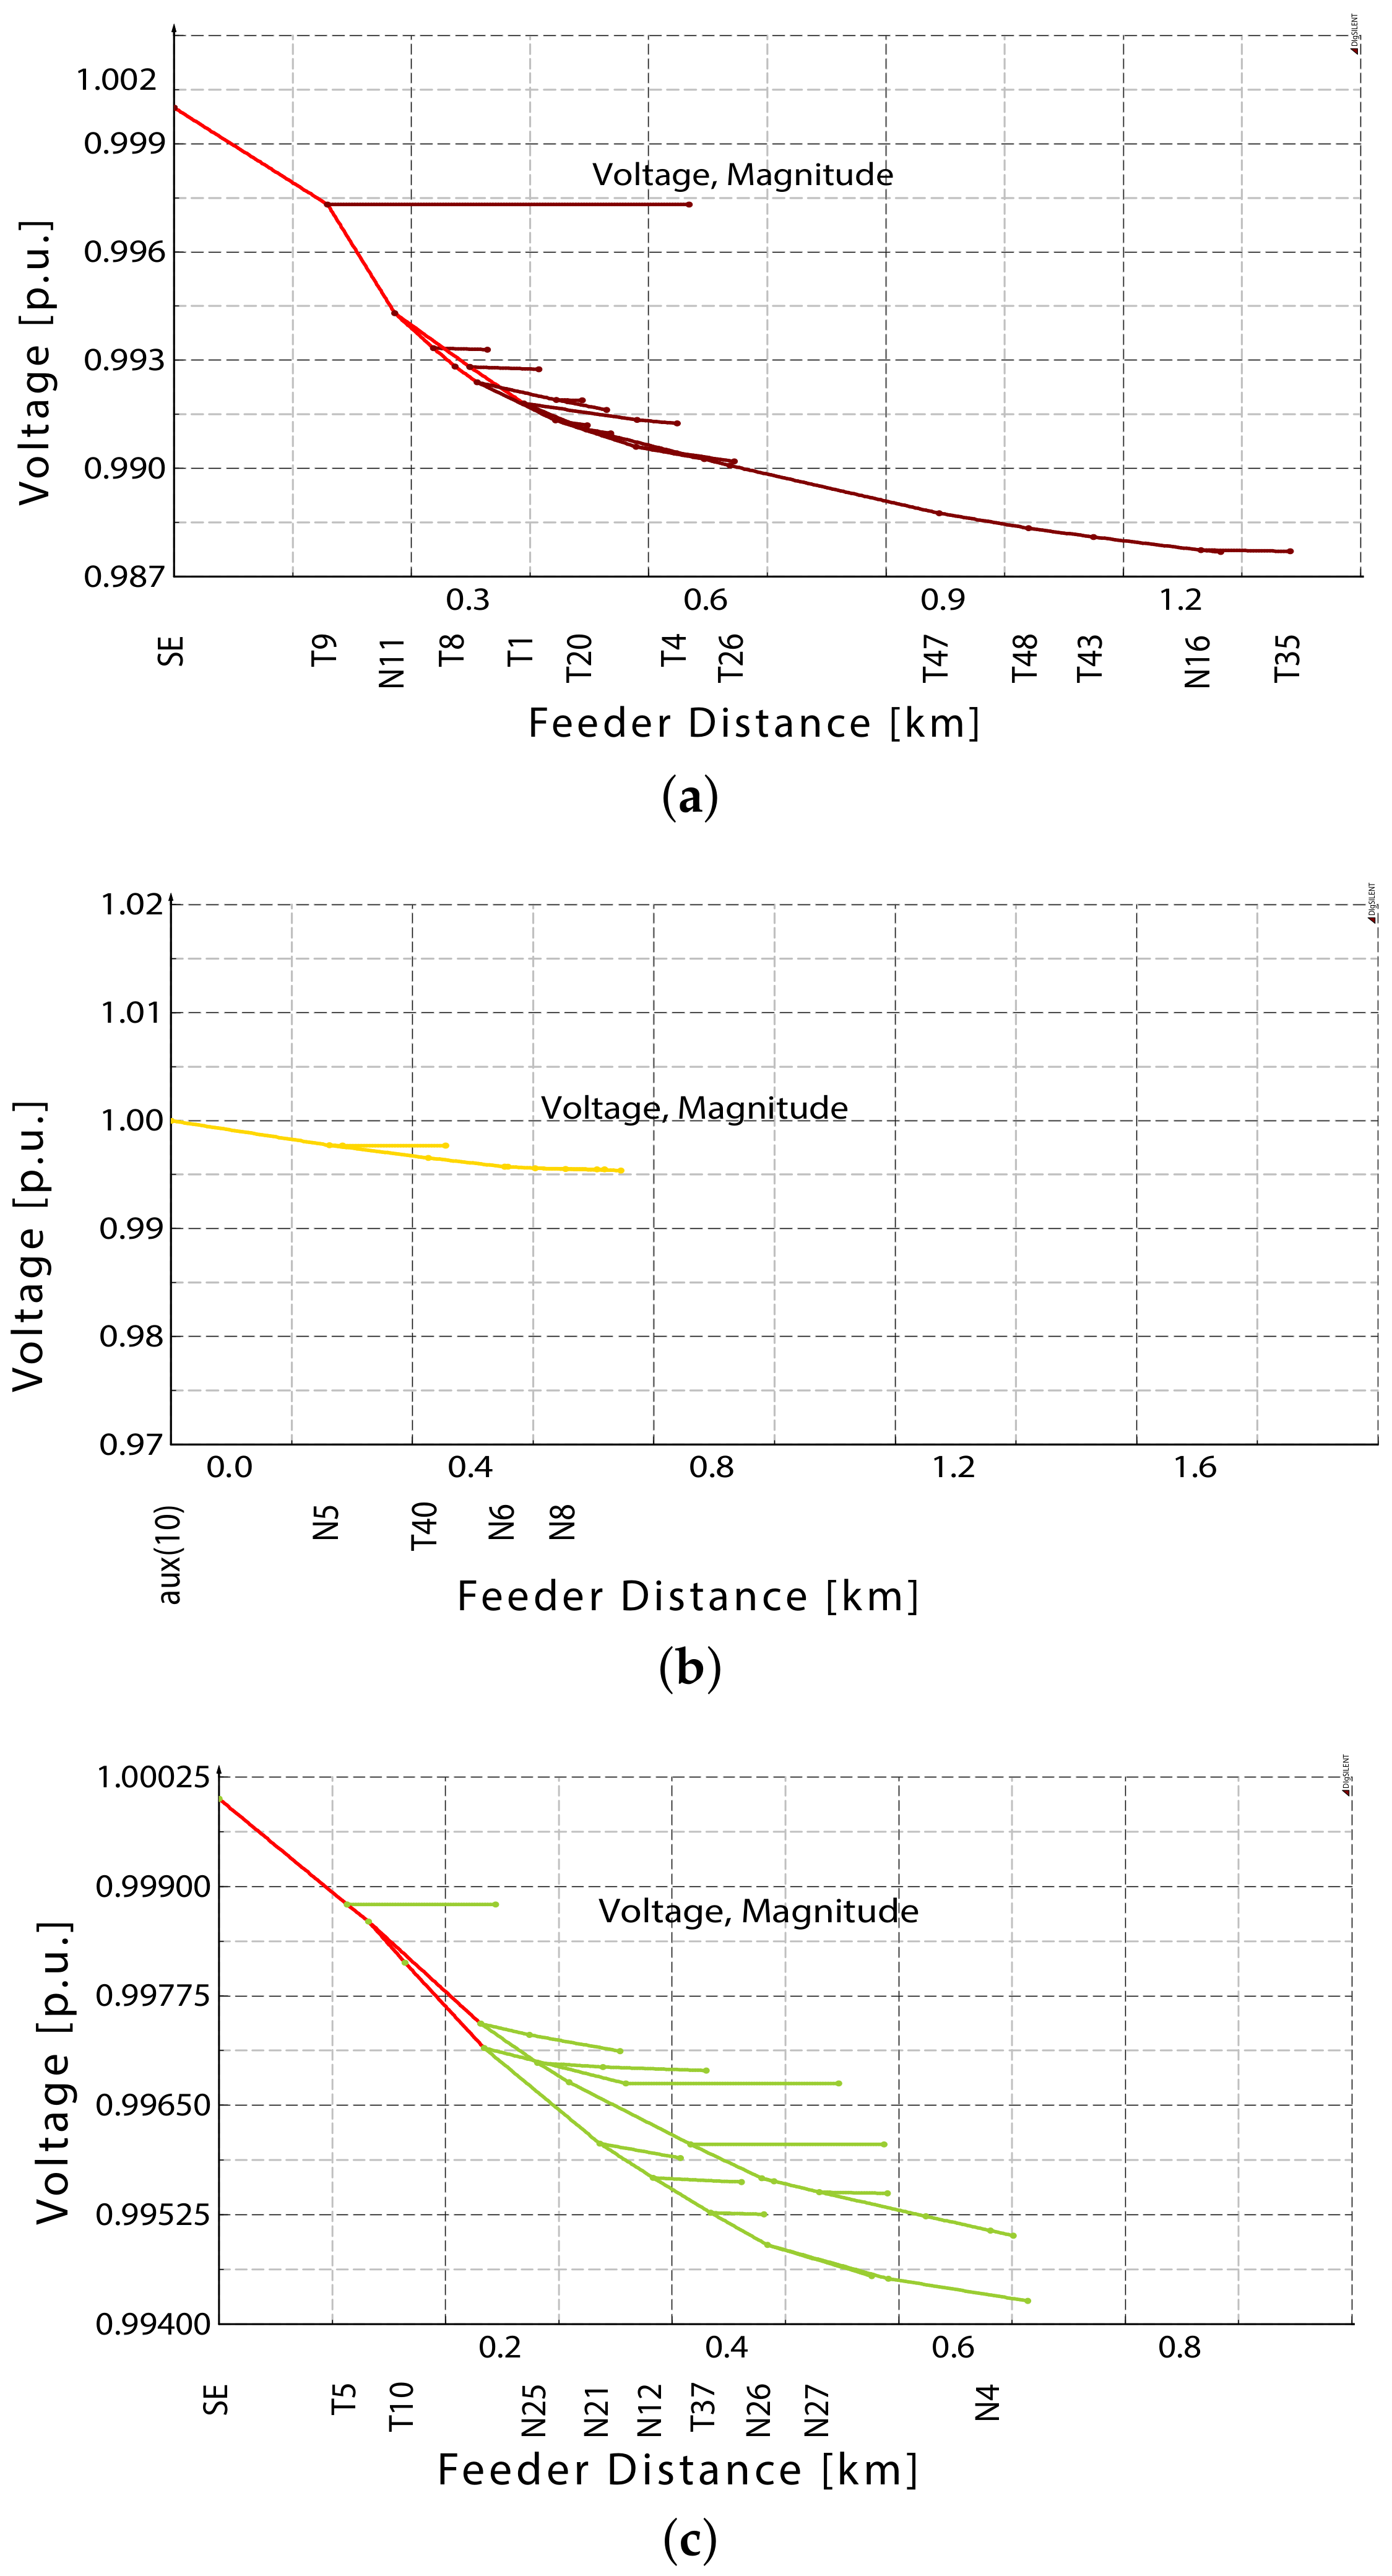
The voltage drop analysis is depicted in Figure 12 where a voltage profile highlights the behavior of the distribution network after operation of switchgear equipment, i.e., reconfigured network. The evaluation of the voltage drop is carried out because the power consumptions of the loads are different; therefore, there will be different voltage drops along each feeder. For this case study, it is clear that the voltage drop along the feeder is kept within standard limits that are imposed by utility policies. Figure 12 is composed by three subplots, where each one shows the voltage profile in feeder A, feeder B and feeder C during the new operating conditions, respectively.
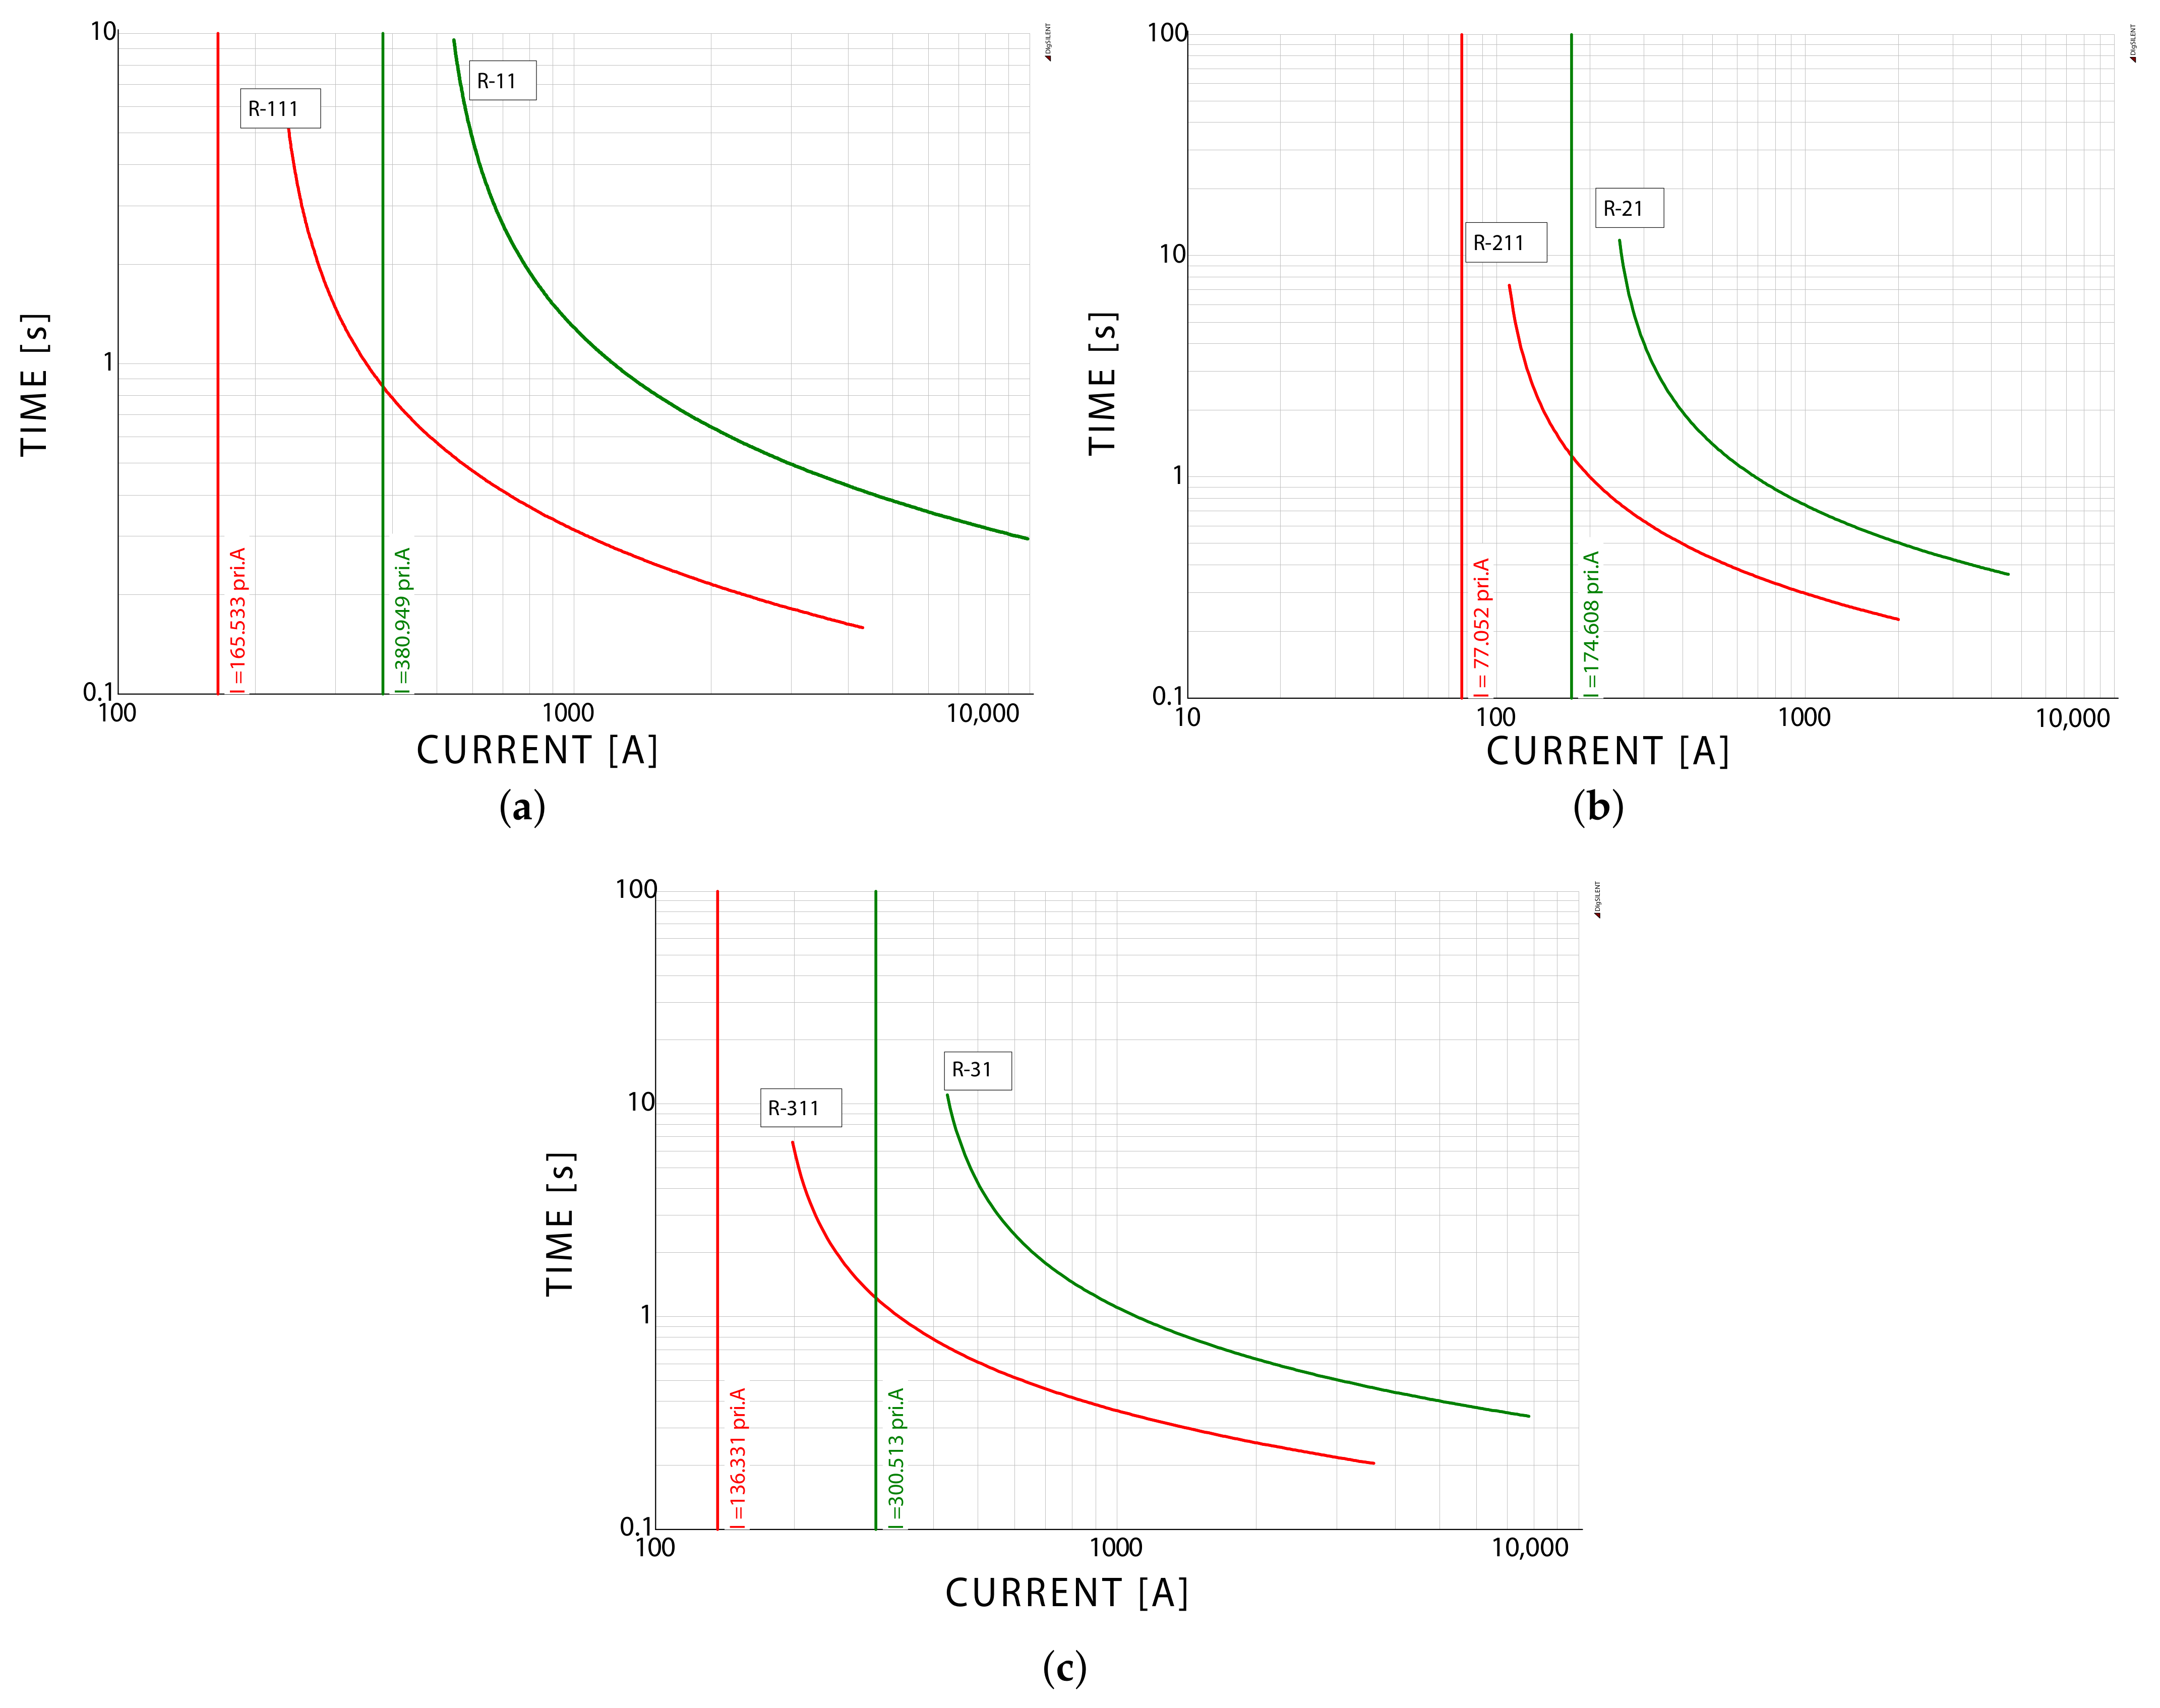
Finally, when the reconfiguration process is completed, the remaining stage of the algorithm is applied to the new operating conditions. Therefore, a communication peer-to-peer between Matlab and PowerFactory is executed to determine the electrical parameters such TMS and I s . Current setting or pick-up current is evaluated based on the load current circulating along the feeder, which is provided by the power-flow analysis. On the other hand, the TMS is determined based on Equation (1) of inverse overcurrent characteristic, which uses short-circuit analysis to determine the most remote point of protection, thus guaranteeing selectivity. Table 7 shows the new calculated parameters (TMS and I s ) for overcurrent protection, while 
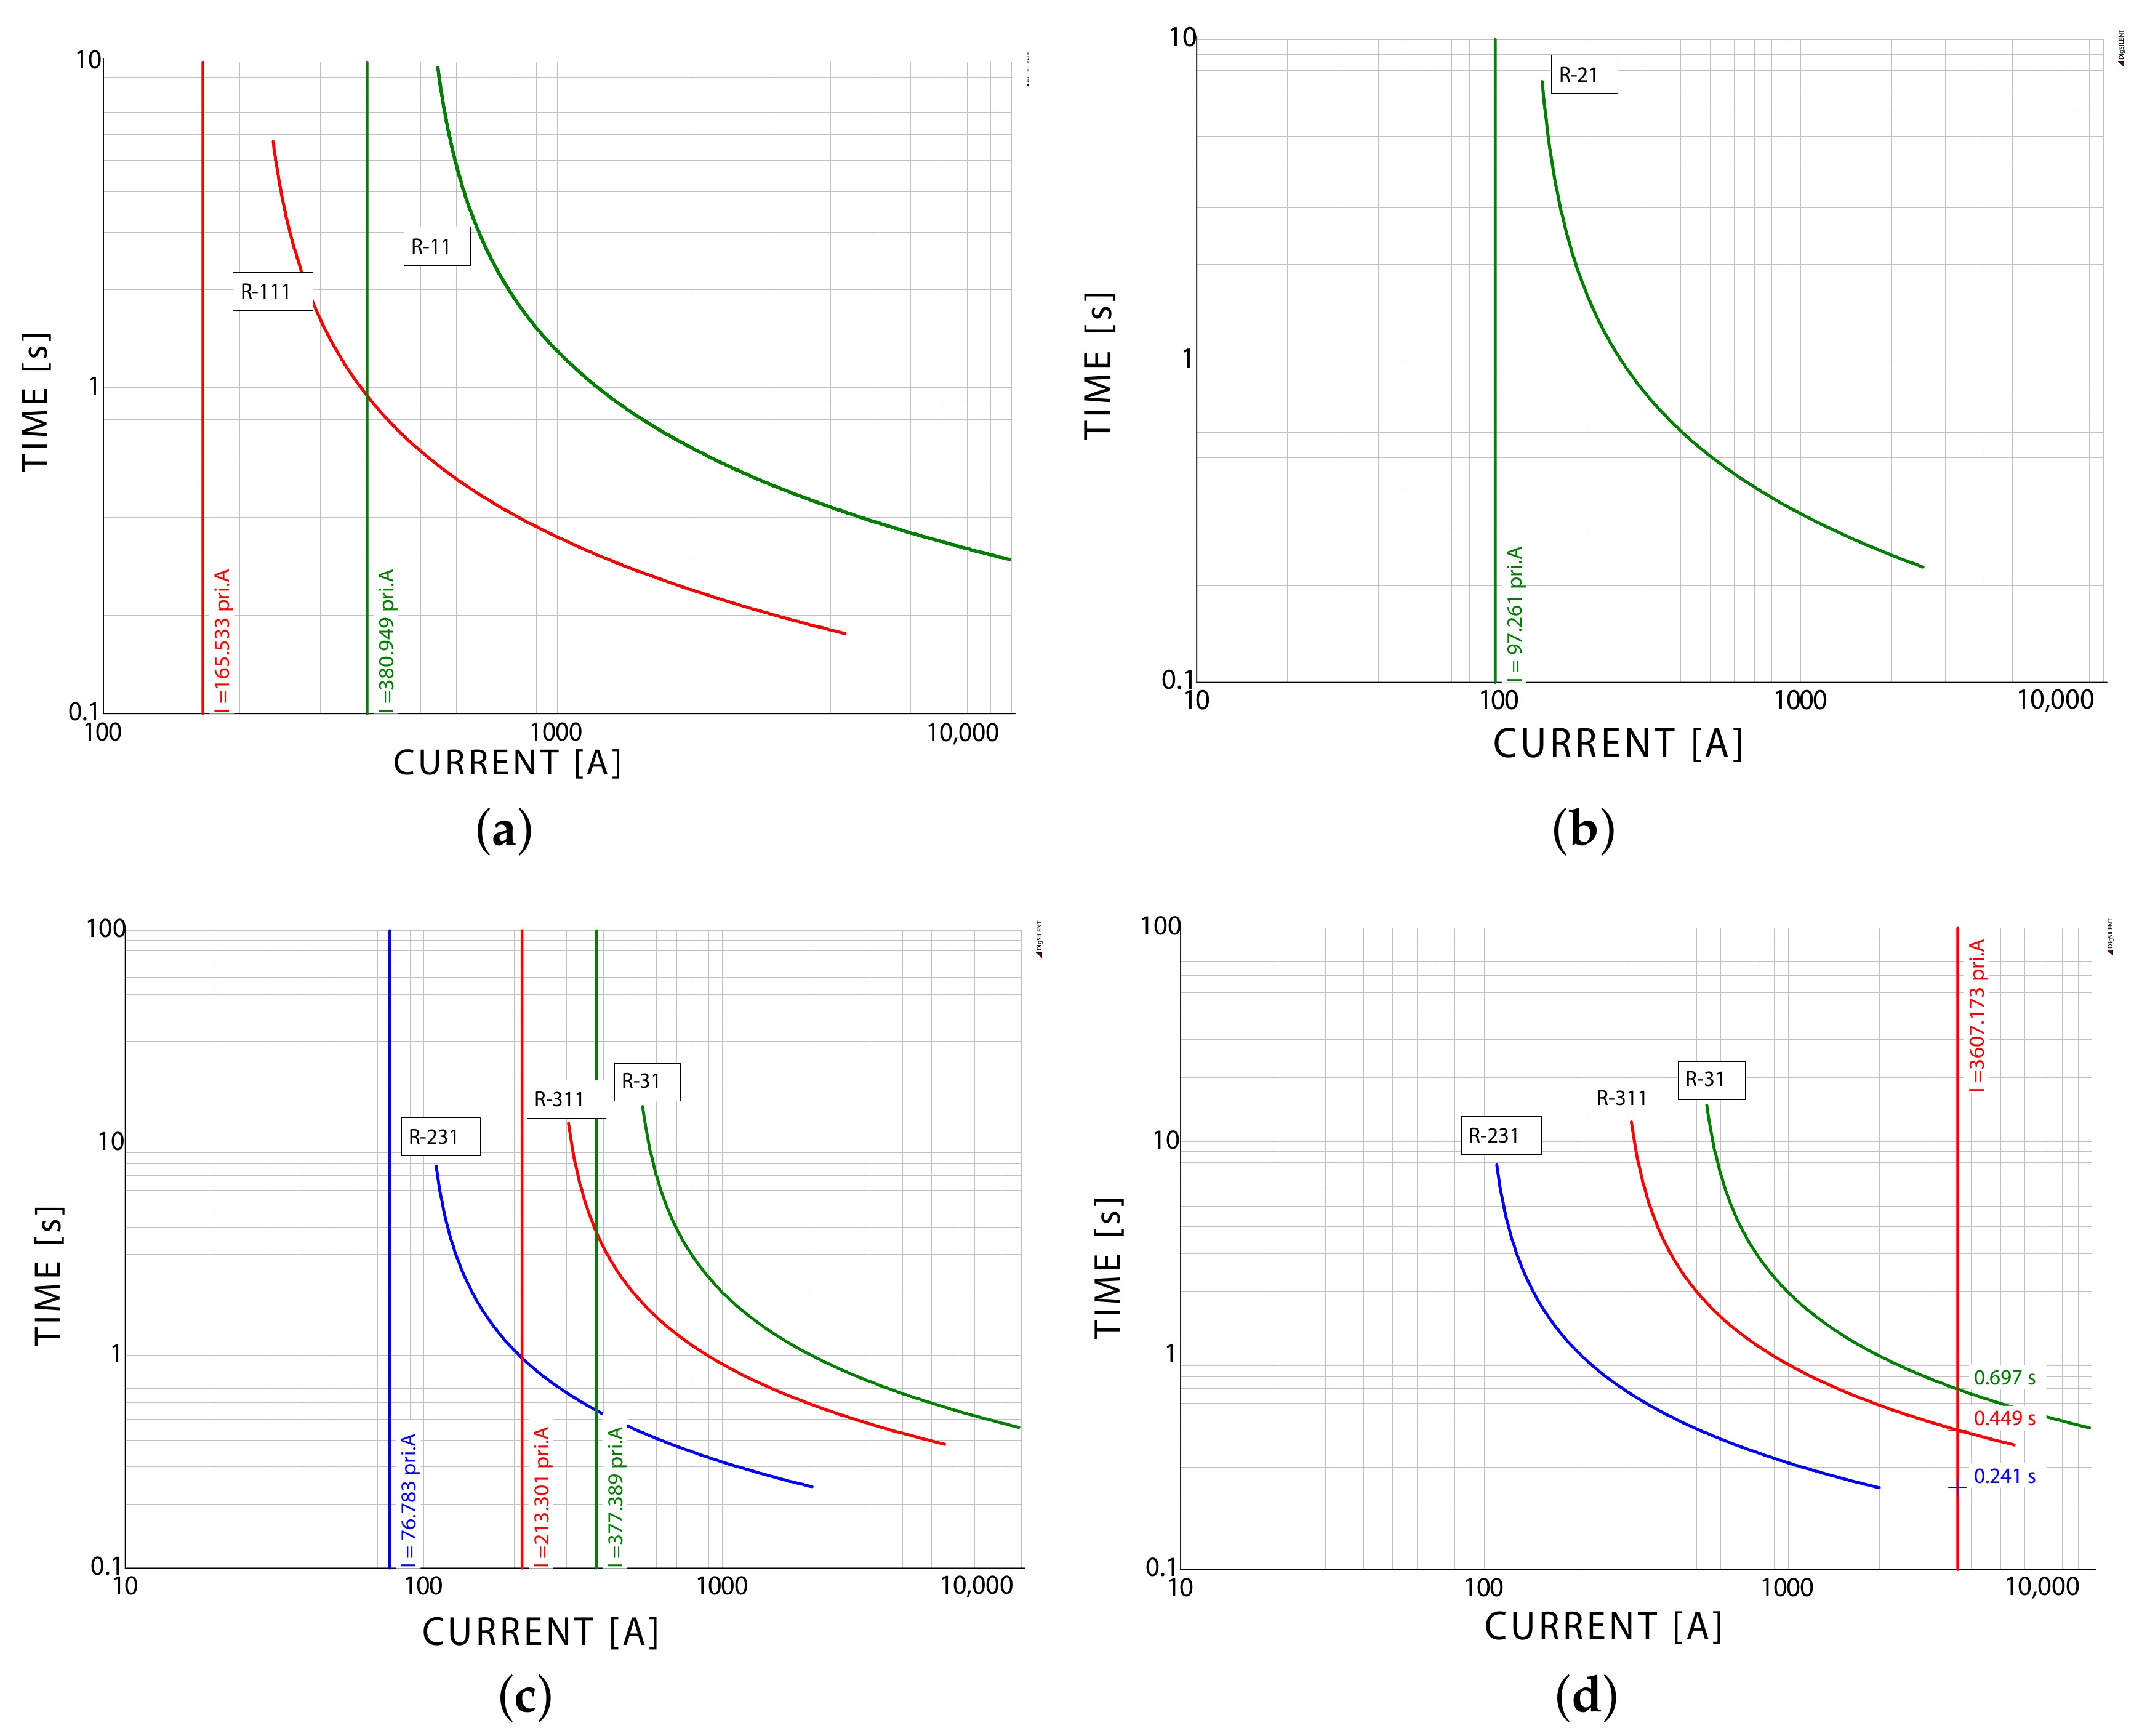
Figure 13 consists of 4 subplots, each one showing the protection coordination in feeder A, feeder B and feeder C after reconfiguration process. In particular, Figure 13a shows the protection coordination of two overcurrent relays connected in feeder A; Figure 13b depicts only one overcurrent relay in feeder B due to the fact that the other one is disconnected because it is associated with the faulty section. Figure 13c shows the coordination of three overcurrent relays because this feeder took the restored load; finally, Figure 13d shows the behavior of overcurrent relays in feeder C when this feeder is affected by a short-circuit. Therefore, Figure 13 highlights the case of a proper protection coordination for a distribution network, where selectivity is achieved.

6. Conclusions

This paper was focused on the development of a resilient operation strategy, where resilience is associated with reconfiguration capacity; consequently, a peer-to-peer communication between Matlab and PowerFactory was implemented to develop a reconfiguration algorithm which was used to restore a distribution network when it faces abnormal events. As a consequence of this topology change, an automated protection coordination was determined based on the available electrical components.
A faulty section was used to test the reconfiguration algorithm, which was based on a peer-to-peer communication between Matlab and PowerFactory. In particular, Matlab allowed to organize, process, and develop an exhaustive search of possible combinations of close/open status maximizing the amount of distribution transformers connected to primary feeders. On the other hand, PowerFactory represented the tool to model and simulate the distribution network, where power-flows were executed and sent to Matlab to be processed. An optimization process represented the best option of restoration considering technical requirements such as voltage levels and radiality. Therefore, the best option was evaluated in order determine the new order of protection coordination. In fact, a new topology involves new overcurrent relays in the primary feeder. Both parameters, current setting and time multiplier setting were calculated in Matlab based on a short-circuit analysis performed by PowerFactory. The achieved results highlighted an accurate protection coordination assuring selectivity for the proposed case study. The reconfiguration and coordination protection algorithms can be developed in different areas, locations and distribution networks.
Future research will be focused on different methodologies for service restoration and protection coordination using the environments of PowerFactory and Python.

Author Contributions

Conceptualization, methodology, software, resources, validation, formal analysis, A.V., S.S. and E.I.; investigation, writing—original draft preparation, A.V. and S.S.; writing—review and editing, supervision, E.I. All authors have read and agreed to the published version of the manuscript.

Funding

This work was supported by Universidad Politécnica Salesiana and GIREI–Smart Grid Research Group under the project Automatic Protection Coordination of Overcurrent Relays on Distribution Networks.

Institutional Review Board Statement

Not applicable.

Informed Consent Statement

Not applicable.

Conflicts of Interest

The authors declare no conflict of interest.

References

  1. Schlabbach, J.; Rofalski, K.H. Power System Engineering: Planning, Design, and Operation of Power Systems and Equipment; Wiley VCH: Weinheim, Germany, 2014. [Google Scholar]
  2. Valenzuela, A.; Inga, E.; Simani, S. Planning of a Resilient Underground Distribution Network Using Georeferenced Data. Energies 2019, 12, 644. [Google Scholar] [CrossRef] [Green Version]
  3. Borgatti, S.P.; Mehra, A.; Brass, D.J.; Labianca, G. Network Analysis in the Social Sciences. Science 2009, 323, 892–896. [Google Scholar] [CrossRef] [Green Version]
  4. Buldyrev, S.V.; Parshani, R.; Paul, G.; Stanley, H.E.; Havlin, S. Catastrophic cascade of failures in interdependent networks. Nature 2010, 464, 1025–1028. [Google Scholar] [CrossRef] [PubMed] [Green Version]
  5. Tieri, P.; Farina, L.; Petti, M.; Astolfi, L.; Paci, P.; Castiglione, F. Network inference and reconstruction in bioinformatics. In Encyclopedia of Bioinformatics and Computational Biology: ABC of Bioinformatics; Academic Press: Cambridge, MA, USA, 2018; Volume 1–3, pp. 805–813. [Google Scholar]
  6. Saldarriaga-Zuluaga, S.D.; López-Lezama, J.M.; Muñoz-Galeano, N. Optimal coordination of over-current relays in microgrids using unsupervised learning techniques. Appl. Sci. 2021, 13, 1241. [Google Scholar] [CrossRef]
  7. Valenzuela, A.; Montalvo, I.; Inga, E. A Decision-Making Tool for Electric Distribution Network Planning Based on Heuristics and Georeferenced Data. Energies 2019, 12, 4065. [Google Scholar] [CrossRef] [Green Version]
  8. Mehmed-hamza, M. Overcurrent Protection Against Faults in Smart Grids. In Proceedings of the 2019 11th Electrical Engineering Faculty Conference (BulEF), Varna, Bulgaria, 11–14 September 2019; pp. 1–4. [Google Scholar]
  9. Kiliçkiran, H.C.; Şengör, İ.; Akdemir, H.; Kekezoğlu, B.; Erdinç, O.; Paterakis, N.G. Power system protection with digital overcurrent relays: A review of non-standard characteristics. Electr. Power Syst. Res. 2018, 164, 89–102. [Google Scholar] [CrossRef]
  10. Cesar, A.; Abo-Al-Ez, K.M.; Kahn, M.T. Overcurrent directional protection with PV system integration. In Proceedings of the 27th International Conference on the Domestic Use of Energy, DUE 2019, Wellington, South Africa, 25–27 March 2019; pp. 2–7. [Google Scholar]
  11. Jain, R.; Lubkeman, D.L.; Lukic, S.M. Dynamic Adaptive Protection for Distribution Systems in Grid-Connected and Islanded Modes. IEEE Trans. Power Deliv. 2019, 34, 281–289. [Google Scholar] [CrossRef]
  12. Rizwan, M.; Hong, L.; Waseem, M.; Ahmad, S.; Sharaf, M.; Shafiq, M. A robust adaptive overcurrent relay coordination scheme for wind-farm-integrated power systems based on forecasting the wind dynamics for smart energy systems. Appl. Sci. 2020, 10, 6318. [Google Scholar] [CrossRef]
  13. Boaski, M.A.; Sperandio, M.; Bernardon, D.P.; Barriquello, C.H.; Porto, D.S.; Ramos, M.J. Methodology for coordination and selectivity of protection devices with reliability assessment. In Proceedings of the 2017 52nd International Universities Power Engineering Conference, UPEC 2017, Heraklion, Greece, 28–31 August 2017; pp. 1–6. [Google Scholar]
  14. Sisitha, T.; Hemapala, K. Optimized Adaptive Overcurrent Protection Using Hybridized Nature-Inspired Algorithm and Clustering in Microgrids. Energies 2020, 13, 3324. [Google Scholar] [CrossRef]
  15. Arabzadeh, M.; Seifi, H.; Sheikh-El-Eslami, M.K. A new mechanism for remedial action schemes design in a multi-area power system considering competitive participation of multiple electricity market players. Int. J. Electr. Power Energy Syst. 2018, 103, 31–42. [Google Scholar] [CrossRef]
  16. Chandraratne, C.; Ramasamy, T.N.; Logenthiran, T.; Panda, G. Adaptive protection for microgrid with distributed energy resources. Electronics 2020, 9, 1959. [Google Scholar] [CrossRef]
  17. Ghorbani, A.; Mehrjerdi, H.; Iqbal, A. Modeling of Digital Distance Relay in EMTPWorks Considering Protective Zones and Trip Characteristics. In Proceedings of the 2019 2nd International Conference on Smart Grid and Renewable Energy (SGRE), Doha, Qatar, 19–21 November 2019; Volume 1, pp. 1–6. [Google Scholar]
  18. Sahoo, B.; Samantaray, S. Deep Neural Network-based Wide Area Back-up Protection Scheme for Transmission System. In Proceedings of the 2019 IEEE PES Asia-Pacific Power and Energy Engineering Conference (APPEEC), Macao, China, 1–4 December 2019; pp. 1–6. [Google Scholar]
  19. Sharafi, A.; Sanaye-Pasand, M.; Aminifar, F. Transmission system wide-area back-up protection using current phasor measurements. Int. J. Electr. Power Energy Syst. 2017, 92, 93–103. [Google Scholar] [CrossRef]
  20. Canevese, S.; Ciapessoni, E.; Cirio, D.; Pitto, A.; Rapizza, M. Wide area system Protection Scheme design with an Artificial Intelligence approach considering communication constraints. In Proceedings of the 2016 IEEE International Energy Conference, ENERGYCON 2016, Leuven, Belgium, 4–8 April 2016. [Google Scholar]
  21. Oral, B.; Dönmez, F. The impacts of natural disasters on power systems: Anatomy of the marmara earthquake blackout. Acta Polytech. Hung. 2010, 7, 107–118. [Google Scholar]
  22. Bie, Z.; Lin, Y.; Li, G.; Li, F. Battling the Extreme: A Study on the Power System Resilience. Proc. IEEE 2017, 105, 1253–1266. [Google Scholar] [CrossRef]
  23. IEEE. IEEE Std C37.112. Standard for Inverse—Time Characteristics Equations for Overcurrent Relays; IEEE: Piscataway, NJ, USA, 2018. [Google Scholar]
  24. IEC. IEC 60255-151:2009 Measuring Relays and Protection Equipment—Part 151: Functional Requirements for over/under Current Protection; Technical Report; IEC: Geneva, Switzerland, 2011. [Google Scholar]
  25. Vai, V.; Suk, S.; Lorm, R.; Chhlonh, C.; Eng, S.; Bun, L. Optimal reconfiguration in distribution systems with distributed generations based on modified sequential switch opening and exchange. Appl. Sci. 2021, 11, 2146. [Google Scholar] [CrossRef]
  26. Gers, J. Protection of Electricity Distribution Networks, 3rd ed.; The Institution of Engineering and Technology: London, UK, 2011; p. 368. [Google Scholar]
  27. Barra, P.H.; Coury, D.V.; Fernandes, R.A. A survey on adaptive protection of microgrids and distribution systems with distributed generators. Renew. Sustain. Energy Rev. 2020, 118, 109524. [Google Scholar] [CrossRef]
  28. Wang, Y.; Chen, C.; Wang, J.; Baldick, R. Research on Resilience of Power Systems under Natural Disasters—A Review. IEEE Trans. Power Syst. 2016, 31, 1604–1613. [Google Scholar] [CrossRef]
  29. Espinoza, S.; Panteli, M.; Mancarella, P.; Rudnick, H. Multi-phase assessment and adaptation of power systems resilience to natural hazards. Electr. Power Syst. Res. 2016, 136, 352–361. [Google Scholar] [CrossRef]
  30. Gholami, A.; Shekari, T.; Amirioun, M.H.; Aminifar, F.; Amini, M.H.; Sargolzaei, A. Toward a consensus on the definition and taxonomy of power system resilience. IEEE Access 2018, 6, 32035–32053. [Google Scholar] [CrossRef]
  31. Mosbah, M.; Arif, S.; Mohammedi, R.D.; Hellal, A. Optimum dynamic distribution network reconfiguration using minimum spanning tree algorithm. In Proceedings of the 2017 5th International Conference on Electrical Engineering—Boumerdes (ICEE-B), Boumerdes, Algeria, 29–31 October 2017; pp. 1–6. [Google Scholar]
  32. Cadenovic, R.; Jakus, D.; Sarajcev, P.; Vasilj, J. Optimal distribution network reconfiguration through integration of cycle-break and genetic algorithms. Energies 2018, 11, 1278. [Google Scholar] [CrossRef] [Green Version]
  33. Zhai, H.F.; Yang, M.; Chen, B.; Kang, N. Dynamic reconfiguration of three-phase unbalanced distribution networks. Int. J. Electr. Power Energy Syst. 2018, 99, 1–10. [Google Scholar] [CrossRef]
  34. Zhang, J. Framework and Function design of An Intelligent Network Planning Software for Power Distribution. In Proceedings of the 2nd IEEE Conference on Energy Internet and Energy System Integration (EI2), Beijing, China, 20–22 October 2018. [Google Scholar]
  35. Kumar, P.; Singh, S. Energy efficiency performance of reconfigured radial networks with reactive power injection. In Proceedings of the 2014 IEEE 6th India International Conference on Power Electronics (IICPE), Kurukshetra, India, 8–10 December 2014. [Google Scholar]
  36. Raut, U.; Mishra, S. Power distribution network reconfiguration for loss minimization using a new graph theory based genetic algorithm. In Proceedings of the 2017 IEEE Calcutta Conference (CALCON), Kolkata, India, 2–3 December 2017. [Google Scholar]
  37. Agrawal, P.; Kanwar, N.; Gupta, N.; Niazi, K.R.; Swarnkar, A.; Meena, N.K.; Yang, J. Reliability and network performance enhancement by reconfiguring underground distribution systems. Energies 2020, 13, 4719. [Google Scholar] [CrossRef]
  38. Silva, F.F.C.; Carvalho, P.M.S.; Ferreira, L.A.F.M. Improving PV Resilience by Dynamic Reconfiguration in Distribution Grids: Problem Complexity and Computation Requirements. Energies 2021, 14, 830. [Google Scholar] [CrossRef]
  39. Kamble, S.G.; Vadirajacharya, K.; Patil, U.V. Decision Making in Power Distribution System Reconfiguration by Blended Biased and Unbiased Weightage Method. J. Sens. Actuator Netw. 2019, 8, 20. [Google Scholar] [CrossRef] [Green Version]
  40. Li, H.; Mao, W.; Zhang, A.; Li, C. An improved distribution network reconfiguration method based on minimum spanning tree algorithm and heuristic rules. Int. J. Electr. Power Energy Syst. 2016, 82, 466–473. [Google Scholar] [CrossRef]
  41. Nascimento, J.P.; Brito, N.S.; Souza, B.A. An adaptive overcurrent protection system applied to distribution systems. Comput. Electr. Eng. 2020, 81, 106545. [Google Scholar] [CrossRef]
  42. Ali, Z.M.; Diaaeldin, I.M.; Abdel Aleem, S.H.; El-Rafei, A.; Abdelaziz, A.Y.; Jurado, F. Scenario-based network reconfiguration and renewable energy resources integration in large-scale distribution systems considering parameters uncertainty. Mathematics 2021, 9, 26. [Google Scholar] [CrossRef]
  43. Xiang, Y.; Wang, L.; Liu, N. A Robustness-Oriented Power Grid Operation Strategy Considering Attacks. IEEE Trans. Smart Grid 2018, 9, 4248–4261. [Google Scholar] [CrossRef]
  44. Stativă, A.; Gonzalez-Longatt, F. Peer-to-Peer (P2P) MATLAB–PowerFactory Communication: Optimal Placement and Setting of Power System Stabilizer. In Advanced Smart Grid Functionalities Based on PowerFactory; Springer: Cham, Switzerland, 2018. [Google Scholar]
Figure 1. The importance of dependability applied in line protection and the importance of security applied in busbar protection.
Energies 14 03253 g001
Figure 2. Time/current operating characteristics of overcurrent relays [23,24].
Energies 14 03253 g002
Figure 3. Peer-to-peer communication between Matlab and PowerFactory.
Energies 14 03253 g003
Figure 4. The flowchart used to determine the best topological restoration and adaptive overcurrent protection coordination based on a peer-to-peer communication between Matlab and PowerFactory.
Energies 14 03253 g004
Figure 5. Single-line diagram and time-current curves for three overcurrent relays.
Energies 14 03253 g005
Figure 6. Three primary feeders with tie lines operating in normal conditions.
Energies 14 03253 g006
Figure 7. (a) Protection coordination of overcurrent relays on feeder A; (b) Protection coordination of overcurrent relays on feeder B; (c) Protection coordination of overcurrent relays on feeder C.
Energies 14 03253 g007
Figure 8. Distribution network under abnormal operating conditions, activation of switchgear equipment NC-211 and trip of overcurrent relay R-211.
Energies 14 03253 g008
Figure 9. Number of distribution transformers connected to the main grid for the different reconfiguration cases of the distribution network under abnormal operating conditions, i.e., activation of switchgear equipment NC-211 and tripping of overcurrent relay R-211.
Energies 14 03253 g009
Figure 10. Distribution network under the new operating conditions, i.e., switchgear NC-211 is in open position and NO-231 has changed to closed position due to the reconfiguration process.
Energies 14 03253 g010
Figure 11. Voltage levels of the different busbars with reference to possible reconfiguration solutions of the distribution network under abnormal operating conditions, i.e., activation of switchgear equipment NC-211 and tripping of overcurrent relay R-211.
Energies 14 03253 g011
Figure 12. (a) Voltage profile of distribution feeder A after a feeder reconfiguration; (b) Voltage profile of distribution feeder B after a feeder reconfiguration; (c) Voltage profile of distribution feeder C after a feeder reconfiguration.
Energies 14 03253 g012
Figure 13. (a) Protection coordination of overcurrent relays on feeder A; (b) Protection coordination of overcurrent relays on feeder B; (c) Protection coordination of overcurrent relays on feeder C; (d) Protection coordination of overcurrent relays on feeder C during a short-circuit on feeder C.
Energies 14 03253 g013
Table 1. ANSI/IEEE and IEC constants for overcurrent relays [23,24].
Curve DescriptionStandard α β L
Moderately inverseIEEE0.020.05150.114
Very inverseIEEE219.610.491
Extremely inverseIEEE228.20.1217
InverseCO825.950.18
Short-time inverseCO20.020.02390.0169
Standard inverseIEC0.020.140
Very inverseIEC10.05150
Extremely inverseIEC2800
Long-time inverseUK11200
Table 2. Parameter and variables.
NomenclatureDescription
Data, Flagcsv files used to communicate Matlab and PowerFactory
status1Reduced reconfiguration topologies
prifeederNumber of primary feeders
relaysNumber of overcurrent relays per feeder
Data1, Data2Temporal and complementary variables
Table 3. Case study parameters and variables.
ItemParameterValue
Primary feeders3
Voltage level11 kV
MediumInstallation TypeUnderground Network
Network ConfigurationRadial with tie points using RMU
VoltageConductor size and typeInsulated power cable 3 × 95 mm 2 15 kV
Ring Main Units1 to 4 switchgear cubicles
NetworkFeeder A (Brown Color)19 distribution transformers
Feeder B (Yellow Color)11 distribution transformers
Feeder C (Green Color)18 distribution transformers
TieFeeder A and Feeder B2 (Light Blue Color)
PointsFeeder B and Feeder C2 (Purple Color)
Feeder C and Feeder A2 (Orange Color)
ProtectionRelays12 Time-Inverse overcurrent relays
SystemCurrent Transformers Ratio100/1
Table 4. Status of connection of different switchgear equipment on normal operating conditions.
RMU with Overcurrent RelaysOperating ConditionStatusFeeder
NC-11Closed Position switch1A
NC-21Closed Position switch1B
NC-31Closed Position switch1C
NC-111Closed Position switch1A
NC-211Closed Position switch1B
NC-311Closed Position switch1C
NO-121Open Position switch0A and B
NO-122Open Position switch0A and B
NO-311Open Position switch0C and A
NO-312Open Position switch0C and A
NO-231Open Position switch0B and C
NO-232Open Position switch0B and C
Table 5. I s and TMS parameters on overcurrent relays at different switchgear equipment on normal operating conditions.
Overcurrent RelayCurrent SettingTime Multiplier SettingFeeder
R-114.950.13A
R-212.270.16B
R-313.900.15C
R-1112.150.07A
R-2111.000.10B
R-3111.80.09C
RX-121--A and B
RX-122--A and B
RX-311--C and A
RX-312--C and A
RX-231--B and C
RX-232--B and C
Table 6. Status of connection of different switchgear equipment under different reconfiguration cases.
RMUCase InitialCase 1Case 2Case 3Case 4Case 5Case 6Case 7Case 8
NC-11111111111
NC-21100111101
NC-31111111111
NC-111111111111
NC-211000000000
NC-311111111111
NO-121010001000
NO-122000010000
NO-311000000000
NO-312000000000
NO-231000000011
NO-232001000100
Table 7. Parameters of I s and TMS on overcurrent relays in different switchgear equipment after the reconfiguration process.
Overcurrent RelayCurrent SettingTime Multiplier SettingFeeder
R-114.950.13A
R-211.260.10B
R-314.900.20C
R-1112.150.07A
R-211---
R-3112.770.16C
RX-121--A and B
RX-122--A and B
RX-311--C and A
RX-312--C and A
RX-2310.990.10C
RX-232--B and C
Publisher’s Note: MDPI stays neutral with regard to jurisdictional claims in published maps and institutional affiliations.

