Article

Capacity Value from Wind and Solar Sources in Systems with Variable Dispatchable Capacity—An Application in the Brazilian Hydrothermal System

by
Nilton Bispo Amado
1,2,*,
Erick Del Bianco Pelegia
1,2 and
Ildo Luís Sauer
1,2
1
Instituto de Energia e Ambiente, Universidade de São Paulo, São Paulo CEP 05508-010, Brazil
2
Centro de Análise, Planejamento e Desenvolvimento de Recursos Energéticos (CPLEN), Universidade de São Paulo, São Paulo CEP 05508-010, Brazil
*
Author to whom correspondence should be addressed.
Energies 2021, 14(11), 3196; https://doi.org/10.3390/en14113196
Submission received: 18 April 2021 / Revised: 19 May 2021 / Accepted: 21 May 2021 / Published: 30 May 2021
(This article belongs to the Section A: Sustainable Energy)

Abstract

:
The most robust methods to determine the capacity contribution from intermittent sources combine load curve, variable generation profile, and dispatchable generators’ data to calculate any new inserted variable source’s capacity value in the power system. However, these methods invariably adopt the premise that the system’s dispatchable generators’ capacity is constant. That is an unacceptable limitation when the energy mix has a large share of hydroelectric sources. Hydroelectric plants are dispatchable sources with variable maximum power output over time, varying mainly according to the reservoirs’ level. This article develops a method that makes it possible to calculate the capacity value from renewable resources when the dispatchable generation units of an electric system have variable capacity. The authors apply the method to calculate the capacity value from solar and wind sources in Brazil as an exercise. By abandoning the hypothesis of constant dispatchable capacity, the developed approach is in principle extensible for other energy-limited resources, such as batteries and concentrating solar power (CSP). This can be a strategy to incorporate energy-limited capacity sources into the planning and operation models as reliable capacity sources.

1. Introduction

Energy planning and power systems operation must ensure that the load curve is met both in energy and power resources. The set of available generators must meet the total amount of energy in a certain period. It must also be able to meet any instantaneous power value observed.
In power systems made up of thermal power plants, generators’ power is equal to their installed capacity. Typically, a subset of fast-responding generators accompanies rapid variations in the power curve. Moreover, investments in overcapacity generation compensate for eventual outages. Under these conditions, it is usually possible to meet demand with high-reliability levels without the need for further reflection on how to treat the power variable in planning models.
The transition towards the use of renewable resources changes this scenario given the increasing relevance of non-dispatchable sources. Dispatchable sources have storage structures to control the outflow of electricity supplied to the power system. In thermoelectric plants, the fuel used for burning performs this function; in hydroelectric plants, reservoirs do so. The situation is different with renewable resources such as wind and solar. Investments in renewable sources, mainly solar and wind, are investments in installed capacity that will convert flow energy present in the natural system into useful energy. These resources usually do not have natural storage structures, as is the case with fossil fuels. As they make useful energy available from variable flows and not from controllable stocks, their power contribution to the electric system will rarely be equal to their installed capacity. Its availability will also be subject to more significant variation and uncertainty than the capacity value from dispatchable sources. Despite this, it is possible to determine the capacity value of sources that captures flow energy such as wind and solar.
With the increased insertion of renewable sources in the grid, interest in determining these resources’ capacity value has increased [1,2,3,4,5]. In this context, several methods were developed and contributed decisively to fill this gap. There are two main strategies for estimating capacity value: approximation and reliability-based methods [6,7]. Approximation methods are less computationally intensive. These methods include Garver’s ELCC approximation [8], Z method [9], and capacity factor-based methods [10]. Although approximation methods are simpler to implement, their accuracy varies [7]. Reliability-based methods allow the description of power systems’ behavior with intermittent renewable generators more accurately but require more computational resources. These methods include equivalent conventional power (ECP) [11], equivalent firm capacity (EFC) [11], and effective load carrying capability (ELCC) [7]. In this article, the analysis was performed employing the ELCC method.
Despite the progress they represent, reliability-based methods adopt the premise that dispatchable sources have constant capacity throughout the analysis period. Thermoelectric plants are taken as the dispatchable source base model. That is an unacceptable limitation for systems with a large share of hydroelectric sources. Hydroelectric plants are dispatchable sources with variable maximum power output over time, varying according to the reservoirs’ level and the rainfall regime.
Improving the representation of the contribution from flow resources (hydroelectric, wind, solar, etc.) is vital for the economic value of both renewable sources and para-renewable resources (such as storage or demand control technologies). It is necessary to quantify the level of extractable services from them. Otherwise, the level of investments in those technologies will likely be sub-optimal.
In addition to the usual concern with resource optimization, there is another important reason for energy researchers to develop new ways of representing power contribution from the sources that make up the energy mix. As already noted, this article develops a method that makes it possible to drop the dispatchable generators’ constant capacity hypothesis. This hypothesis is a substantial obstacle for all energy-limited capacity sources, such as hydroelectric, batteries, concentrating solar power (CSP), etc. In practice, constant capacity models are only capable of representing power contributions from conventional sources such as thermoelectric plants.
Significant technological advancements have taken place in energy storage [12], demand control [13], CSP [14], and even intermittent energy as possible sources of flexibility [15,16]. However, the models used for the planning and operation of power systems continue to a large extent using premises that, although representing well enough conventional thermoelectric technologies, do not facilitate the insertion of emerging technologies to perform the energy transition to renewable sources. This article provides a contribution towards overcoming this gap by developing a method that makes it possible to calculate the capacity value of renewable sources while recognizing and incorporating the variability of dispatchable plants’ capacity. The developed method was applied to calculate solar and wind capacity value in Brazil as an exercise. As further developments, it is possible to extend the approach here proposed to other energy-limited resources capable of providing power, such as batteries and CSP.
The remainder of this article has the following structure: in the Materials and Methods section, some reliability concepts that underlie the investigation are discussed, particularly loss of load probability (LOLP) and loss of load expectation (LOLE), in the sequence it is shown how standard effective load carrying capability (ELCC) calculation uses these concepts and how they can be extended to systems with variable capacity dispatchable generators. Having introduced the method, it is applied to a specific case study, assessing solar and wind sources’ capacity value for Brazil and for the Northeast region. The obtained results and the implications of the developed method for planning and operation are discussed in Section 4. Finally, in Section 5, the conclusions of the work are presented.

2. Materials and Methods

In this section, reliability concepts are discussed and incorporated into the presentation of the standard calculation of effective load carrying capability (ELCC). After that, it is shown how to calculate ELCC with variable capacity dispatchable generators.

2.1. Reliability Concepts

Typically, system reliability is measured using loss of load probability (LOLP) and loss of load expectation (LOLE) indicators. Although LOLP is a probability, LOLE is an expected value. At each moment, the likelihood that a set of generators does not meet a certain load level is the probability that the total available power from such generators is less than the load level at the time interval in question. A specific generator in the generators’ set may not be available either due to failures or scheduled shutdowns. In both cases, there will be unavailability.
For forced shutdowns, it is being implied that generators could assume only two possible states, total unavailability versus total availability. These possibilities determine a forced outage rate (FOR) as shown in Equation (1) [17]:
F O R = d o w n t i m e d o w n t i m e + u p t i m e
However, in reality, generators unavailability is more complex given that a particular generation unit can be operating in de-rated states. Therefore, a unit’s possible capacity states are not only total availability or total unavailability, but it may also have many intermediate levels of reduced availability. It is not always obligatory or feasible to work with all these possible states [17]. To take them into account and at the same time limit the complexity of the investigation, it is a common practice in reliability studies to use the equivalent forced outage rate (EFOR) which can be understood as the equivalent probability of a unit being on forced outage at some distant time [17]. This equivalent probability is calculated using [18]:
E F O R = j = 1 60 i = 1 I P i ( F O H + E U D H ) i j j = 1 60 i = 1 I P i ( S H + F O H + E U D H + O E C H + S R H ) i j
where: P i —Capacity of generation unit i, F O H —Forced outage hours, E U D H —Equivalent unplanned de-rated hours, S H —Service hours, O E C H —Outage for external conditions hours, S R H —Shutdown reserve hours, i—Generation unit of the plant, I—total of generation units, j—Month. E F O R is calculated considering the last 60 months as defined by [18].
To complete the availability measurement, it is also necessary to take into account the scheduled maintenance. The system stops in consequence of a failure and for a programmed interruption or programmed de-rated generation. To account for this, it must be included the Equivalent Programmed Outage Factor (EPOF) as proposed in [18]:
E P O F = j = 1 60 i = 1 I P i ( P O H + E P D H ) i j j = 1 60 i = 1 I P i ( P H ) i j
where: P O H —Planned outage hours, E P D H —Equivalent planned outage hours, P H —Period hours. E P O F is calculated considering the last 60 months as defined by [18].
Ideally, the availability calculation for each sub-period (day, week, etc.) should consider the maintenance schedules, as indicated in [19]. Unfortunately, the maintenance schedule for each plant that participates in the Brazilian market is not available. To deal with this situation, it was decided not to differentiate between forced and programmed outages, a risk-averse and conservative position. The proposed approach underestimates the plant’s availability because the programmed event takes place only in a particular time interval while the forced outage can take place at any given time period during the analyzed time horizon.
The National System Operator (ONS) provides data for the conventional dispatchable generators regarding the EFOR and the EPOF. The total unavailability of a specific unit is the combined effect of forced outage and the programmed outage events:
U n a v a i l a b i l i t y = 1 ( 1 E F O R ) ( 1 E P O F )
In this study, the unavailability provided by Equation (4) was used to take into account the forced and the programmed outages.
After accounting for each generator’s unavailability, it is necessary to evaluate the generators’ set aggregate risk. The fundamental instrument here is the capacity outage probability table (COPT). This table presents the probability of existence of each possible capacity level (or state) formed from the combination of all generators that comprises the generation park and presents the respective available capacity of each of these states [17]. In COPT, each line is always referred to a particular combination of availability and unavailability of all considered generators, which yields what here is being referred as capacity level or state. Table 1 shows a generic COPT and [17] details the algorithm to obtain it.
C n represents the capacity C of capacity state n of the set of generators, while P n indicates the probability of existence associated with each capacity state and 1 n P n represents the accumulated probability of all states up until state n. N is the total number of capacity states that a particular set of dispatchable generators can assume. Therefore, 1 N P n will be equal to 1, as all the probabilities of the sample space are being summed. System failure probability during a sub-period t is the sum of all state probabilities in which available capacity is less than load at sub-period t. The sum of all events probabilities in which C n < L t determines L O L P t [7]:
L O L P t = n = 1 N P ( C n < L t )
with:
C n L t P ( C n < L t ) = P n
C n > L t P ( C n < L t ) = 0
The assessed failure probability measure for each sub-period t allows evaluating the capacity shortage risks in period T (where T is the whole time horizon analyzed, while t is a subset of T) using LOLE indicator (loss of load expectation). By definition, the expected value of a random variable is the average of the values it can assume, weighted by the probability of each of these values, i.e., the expected value of a random variable X that accepts values x 1 , x 2 , , x n is:
E ( X ) = x i P ( X = x i ) = x i o b s x i n o b s
where o b s x i n o b s is the proportion of times the variable x i is observed in the total number of observations n o b s .
Suppose that to analyze the system’s operation during a specific period it is discretized in sub-periods of the same size t. In this article, one year period is divided into 8760 one-hour sub-periods t. By doing so, the expected value of load loss hours will be:
L O L E = ( L O L P t ) t = ( L O L P t ) 1 = ( L O L P t )
By discretizing the period of analysis in equal unit sub-periods, LOLE is the sum of the observed LOLPs. Therefore, the failure probability in each sub-period t impacts LOLE. As t is in hours, LOLE is measured in hours in this case. Another remark about LOLE is that, as shown in Equation (9), it is an value that must be interpreted as mathematical expectation of the load loss in time units and indicates the average number of hours that will present a loss of load event [17]. It must not be interpreted as frequency of events or with any duration connotation [17]. A final remark about LOLE is that it may be in hours, days or others possibilities depending on the discretization of the employed time series on the analysis.

2.2. ELCC Standard Calculation

The effective load carrying capability (ELCC) is a measure of the generator’s contribution to reliably meet the load curve. To determine the ELCC of an intermittent source the following procedure is adopted: first, the LOLE is calculated considering only the dispatchable generators (Equation (11)), then one or more intermittent generators are added to the system (Equation (12)). After that, LOLE is recalculated and since the load was kept constant and more generation capacity was added, the reliability increases and, consequently, the LOLE decreases. Now, there is a difference in LOLE prior and after the addition of intermittent generators. Then, the final step is performed, and virtual load is homogenously added to all sub-periods of the load curve up until the LOLE reaches back its original level before any generator addition (Equation (13)). The value of the added virtual load that makes the resultant LOLE equal to the prior level is the ELCC.
The steps required to calculate ELCC are summarized in Equations (10)–(13). For a given set of conventional generators, the LOLE of the system without the intermittent generation is:
L O L E = t = 1 T L O L P t
L O L E = t = 1 T n = 1 N P ( C n < L t )
The summation from n = 1 to N refers to the sum of all COPT lines and the summation from t = 1 to T refers to the sum of all sub-periods within the assessed period.
After the addition of the Variable Generation (VG) to the system, the standard ELCC procedure requires LOLE recalculation. The L O L E V G will be lower than the LOLE of the base system because extra generation capacity was added with no change in the load curve:
L O L E V G = t = 1 T n = 1 N P ( C n < L t G V G t )
G V G t is the new plant’s generation delivered at hour t. The global impact of this new generator depends on its effects on all hours t. The L t G V G t term is the Net Load after the addition of the VG. In this context, the dispatchable generators fleet is responsible for meeting the load portion not met by variable generation, i.e., for each hour t, the dispatchable generators must supply L t G V G t . The smaller this difference (Net Load), the less reserve margins are required from dispatchable generators; therefore, the lower the probability of failure at this time ( L O L P t ).
Traditionally, the power system faces a higher risk of loss of load in a few critical hours (peak hours in conventional power systems). At these times, the difference between the dispatchable generators park’s capacity and the demand level is minor, so it can be challenging to find generators to compensate for a possible failure in these critical moments. In other words, the reserve margin in these moments is low. That is why between two VG sources that provide precisely the same amount of energy over a given period, the one which contributes more on critical hours contributes more to the adequacy of supply, as it provides power in times of greater risk. The addition of a new VG generator impacts hours t, reducing LOLE so L O L E V G < L O L E p r i o r . The more significant the impact of installed capacity of G V G in hours t (especially in the critical ones), the more relevant the global effect on LOLE. The effective load carrying capability is the increment load D that makes the system’s reliability level before and after the VG generator’s addition equal. D is determined by applying Equation (13) iteratively varying D until the established criteria of equal LOLE is attained.
L O L E L o a d = t = 1 T n = 1 N P ( C n < L t G V G t + D )
D is the load added each sub-period. Computationally, D is found by adding equal increments of virtual load to all sub-periods t until the LOLE obtained with the new VG added is the same as the original. The D value is the load increase, which was possible due to VG addition in the power system while maintaining the system’s reliability. This value D considers the impact of the new VG on all sub-periods t, and it corresponds to the VG’s ELCC.

2.3. ELCC with Variable Dispatchable Capacity

The preceding discussion in Section 2.2 indicates that the entry of a new generator acts by reducing the probability of capacity shortages in sub-periods t. It also shows that the inserted generator impact does not occur homogeneously or linearly. Even if the generator produces equal increments in all sub-periods t, the observed reduction in failure probabilities L O L P t will not be distributed evenly over the new generator’s operation period. This reduction is more significant if this generator operates when reserve margins are low. In short, the new generator’s contribution to meet the load will depend on the risk the system faces when it actually delivers power.
Traditionally, in studies that calculate intermittent sources’ capacity contribution using reliability methodologies [7,10,11], it is assumed that dispatchable generators’ capacity is constant throughout the investigation period, i.e., it is considered that the state of the dispatchable generators does not change. Therefore, the COPT is the same during all analyzed sub-periods (hours, days, weeks etc.).
For systems that operate predominantly with thermoelectric plants, the supply of fuel can be considered unlimited when there is adequate logistics infrastructure. In this context, the hypothesis that dispatchable generators’ capacity is always equal to their nominal capacity is sufficiently robust. Although normally acceptable, there are circumstances in which the hypothesis that the thermoelectric generation capacity is constant throughout the year does not represent the system’s behavior adequately as analyzed by [20] ([p. 11]): “ISO-New England and PJM have observed that their markets are not attracting resources needed during extended periods of cold weather. Gas generators who commit to provide capacity do not necessarily have firm pipeline supply contracts, and dual fuel units with onsite oil storage may not have sufficient fuel to last for more than a week, especially when there are competing uses of that fuel and weather-related forced outages that can disrupt supply from multiple generation sources. PJM reports high coal plant failure rates in 2014 and 2018 cold weather episodes”.
In predominantly thermoelectric systems, the capacity variation of dispatchable thermoelectric plants throughout the year is usually only a fine adjustment in the model. However, in systems with a more significant share of hydroelectric resources, it is essential to consider how the dispatchable available power changes over time. In this case, the hypothesis that dispatchable capacity is constant is far from the truth. In these systems, there may be considerable intra-year and inter-year variations [21,22,23]. Not surprisingly, whenever the dependence on flow energies such as hydroelectric, wind, and solar increases, there is a need to describe the power system in more detail [24,25].
Therefore, how to proceed in cases where dispatchable generators’ capacity cannot be considered constant? First, it must be observed that although hydroelectric generators’ capacity is not constant throughout the year, it is possible to identify sub-periods i in which the capacity of these generators varies little or does not vary at all. Therefore, the dispatchable generators’ status can be adopted in each sub-period i to construct a respective C O P T i . For clarification, it must be noted that sub-period t denotes the discretization that the generation and load data are available from the National System Operator’s database while sub-period i, which is greater than sub-period t, denotes a time interval when the capacity of hydropower can be acceptably considered constant. For this study, t is discretized in hours and i in days. With C O P T i , which is the COPT of each day i, the generation data of the intermittent source and load curve in each hour t, the loss of load probability in the sub-period t can be determined as ( L O L P t ) i , which is understood as the probability of not supplying a particular load level that takes place at hour t that is comprised in day i.
C O P T = { C O P T 0 , C O P T 1 , C O P T 2 , . . . , C O P T i , . . . , C O P T I }
In Equation (14), it can be seen that there is a particular COPT for each sub-period i. The procedure for the LOLE determination with daily COPT recalculation is as shown:
L O L P t , i = 0 = n = 1 N 0 P ( C n < L t ) i = 0 , w i t h t [ 1 , 24 ] L O L P t , i = 1 = n = 1 N 1 P ( C n < L t ) i = 1 , w i t h t [ 25 , 48 ] L O L P t , i = 2 = n = 1 N 2 P ( C n < L t ) i = 2 , w i t h t [ 49 , 72 ] L O L P t , i = 364 = n = 1 N 364 P ( C n < L t ) i = 364 , w i t h t [ 8737 , 8760 ]
where N 0 to N 364 represents each line for each one of the 365 COPTs. For each day, i assumes a value between 0 to 364 and t assumes a value of an hour of that particular day. The term P ( C n < L t ) i is determined using the specific COPT for that day ( C O P T i ). The LOLE for the whole period will be the sum of the LOLPs of each hour of each day as show in Equation (15):
L O L E = t = 1 24 L O L P t i = 0 + t = 25 48 L O L P t i = 1 + . . . + t = 8737 8760 L O L P t i = 364
That is, i = t / 24 . This suggests that generally i = t / k , where t/k is the integer division of t by k, and k is the number of hours comprised in a day. For cases of practical importance and considering a park with a COPT of N lines, the LOLE calculation equations are:
L O L E = i = 0 364 t = 1 + k . i k + k . i L O L P t i i , k Z i = [ 0 , 364 ]
In the above equations, LOLE is evaluated for one year period. However, it is possible to change period evaluation and the other parameters accordingly. For example, studying intra-hour demand and intermittent behavior could lead to choose new values for i, t and k accordingly. As long as the choice captures the quasi-constant dispatchable power behavior, parameters for the sub-periods i, t and k can be specified.
In short, considering the variable capacity of dispatchable generators requires evaluating the COPT table in each sub-period i. This procedure does not require conceptual changes in the current practice of supply adequacy studies. Even so, it makes the meaning of the ELCC clearer. It makes explicit that the ELCC is a measure of the intermittent source’s capacity contribution throughout the period vis-à-vis the load level and the status of the dispatchable generators in each of the moments that comprise the period. In the analysis with dispatchable thermoelectric generators, this is less clear due to the constant value premise of these generators’ capacity.
Figure 1 summarizes the developed method to aggregate the standard ELCC calculation with hydropower modeling enabling the capacity value determination when the dispatchable generation has variable available capacity.
The method is comprised of three steps: Data Gathering, Hydro Modeling and ELCC Determination. In Data Gathering the hourly load curves and VG’s generation curves were obtained from the National System Operator (ONS) database [26], the hydropower and thermal plants’ design data are obtained from the NEWAVE datasets [27] (NEWAVE is the official computational optimization tool employed to guide the operation of the Brazilian hydrothermal electric system), EPOF and EFOR are periodically calculated by the ONS and are available in its database [28]. For the daily parameters of hydropower plants both the database of ONS or National Water Regulatory Agency (ANA in Portuguese) have this data [26,29]. After all data are gathered and organized, the Hydro Modeling step takes place. The method described in Appendix A is employed to determine the daily capacity availability of each hydropower plant modeled. After that, given that the assessed period is one year (2017, 2018, 2019), 365 COPTs are calculated. The ELCC Determination starts with the load and VG’s curve as input and the procedure described in Equations (11)–(13) is adopted. Actually, those equations refer to the standard ELCC calculation, so the actual employed equations are in the form of Equation (16), to mathematically incorporate the daily variability of the COPT, but that put aside, conceptually, the procedure is exactly the same of Equations (11)–(13).

The Performed Simulation

The simulation was performed for the Brazilian Electric System (SEB in Portuguese), so it is important to present some highlights of it. The SEB has two major operational contexts, the Interconnected National System (SIN—Sistema Interligado Nacional in Portuguese) and the Isolated Systems. The SIN covers almost all regions of Brazil, and therefore loads, of the country, being responsible for more than 99% of the consumed energy [30]. It is a nationwide interconnected grid allowing a great degree of resources integration. The Isolated Systems provide energy for regions that do not have access to the SIN and account for less than 1% of the energy consumed [30]. It has no kind of integration with the rest of the grid and therefore must be self-sufficient. The focus of this study lies on the SIN and its subsystems, more particularly the Northeast subsystem.
One final remark to be made about the method is that the exercise for Brazil was performed in two geographic (electric) scopes. The first one is the SIN and the second is the Northeast subsystem. The SIN is subdivided in 4 subsystems and the Northeast subsystem was chosen given the fact that it has the largest parcel of wind and PV installed among all SIN’s subsystems, and for the simulation it was considered to be isolated from the rest of the SIN. Wind and PV participation in the installed capacity of the Northeast subsystem was, in January of 2019, 3.9% and 38%, respectively against 1.2% and 8.9%, respectively, in the SIN [26]. Finally, the SIN and the Northeast subsystem had simulations performed for the years of 2017, 2018 and 2019. The year 2017 was chosen as the first year to be analyzed as it marks a substantial growth in the deployment of central PV generation in Brazil.
The simulations were performed by combining resources from the open source software Renewable Energy Probability Assessment (REPRA), a program developed at the National Renewable Laboratory [31], with code developed by the authors themselves. Both the REPRA and the authors’ code were written in R language. Code and data used can be found in the Data Availability Statement of this article.

3. Results

3.1. Variability of Hydropower Availability throughout the Year

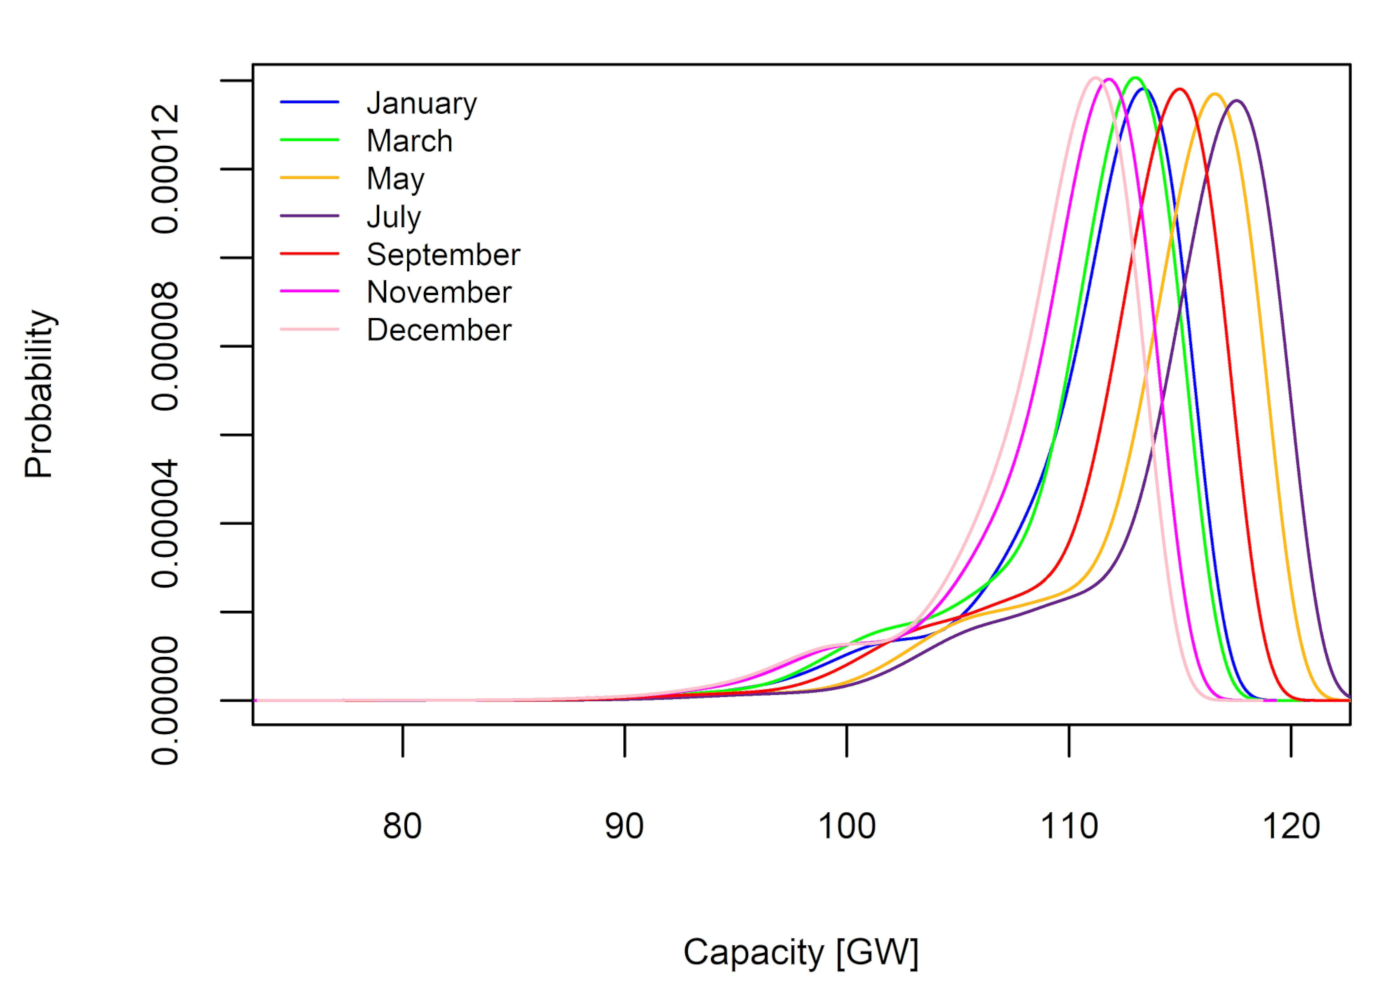
As discussed before, the hydropower availability varies throughout the year. Figure 2 presents the COPT for specific days (first day of each selected month) to illustrate this variation. Figure 2 has in the x-axis the first column of Table 1 (Capacity) and in the y-axis the second column (Probability).
The difference between the most distant months which are December and July when looking the most probable value of each COPT is around 6500 MW. This difference is in the same order of the average wind generation in 2019 in Brazil which was 6385 MW in 2019 [26] and makes clear that the variation in the capacity availability is considerable, thus not taking it into account would decrease the quality of the modeled results.
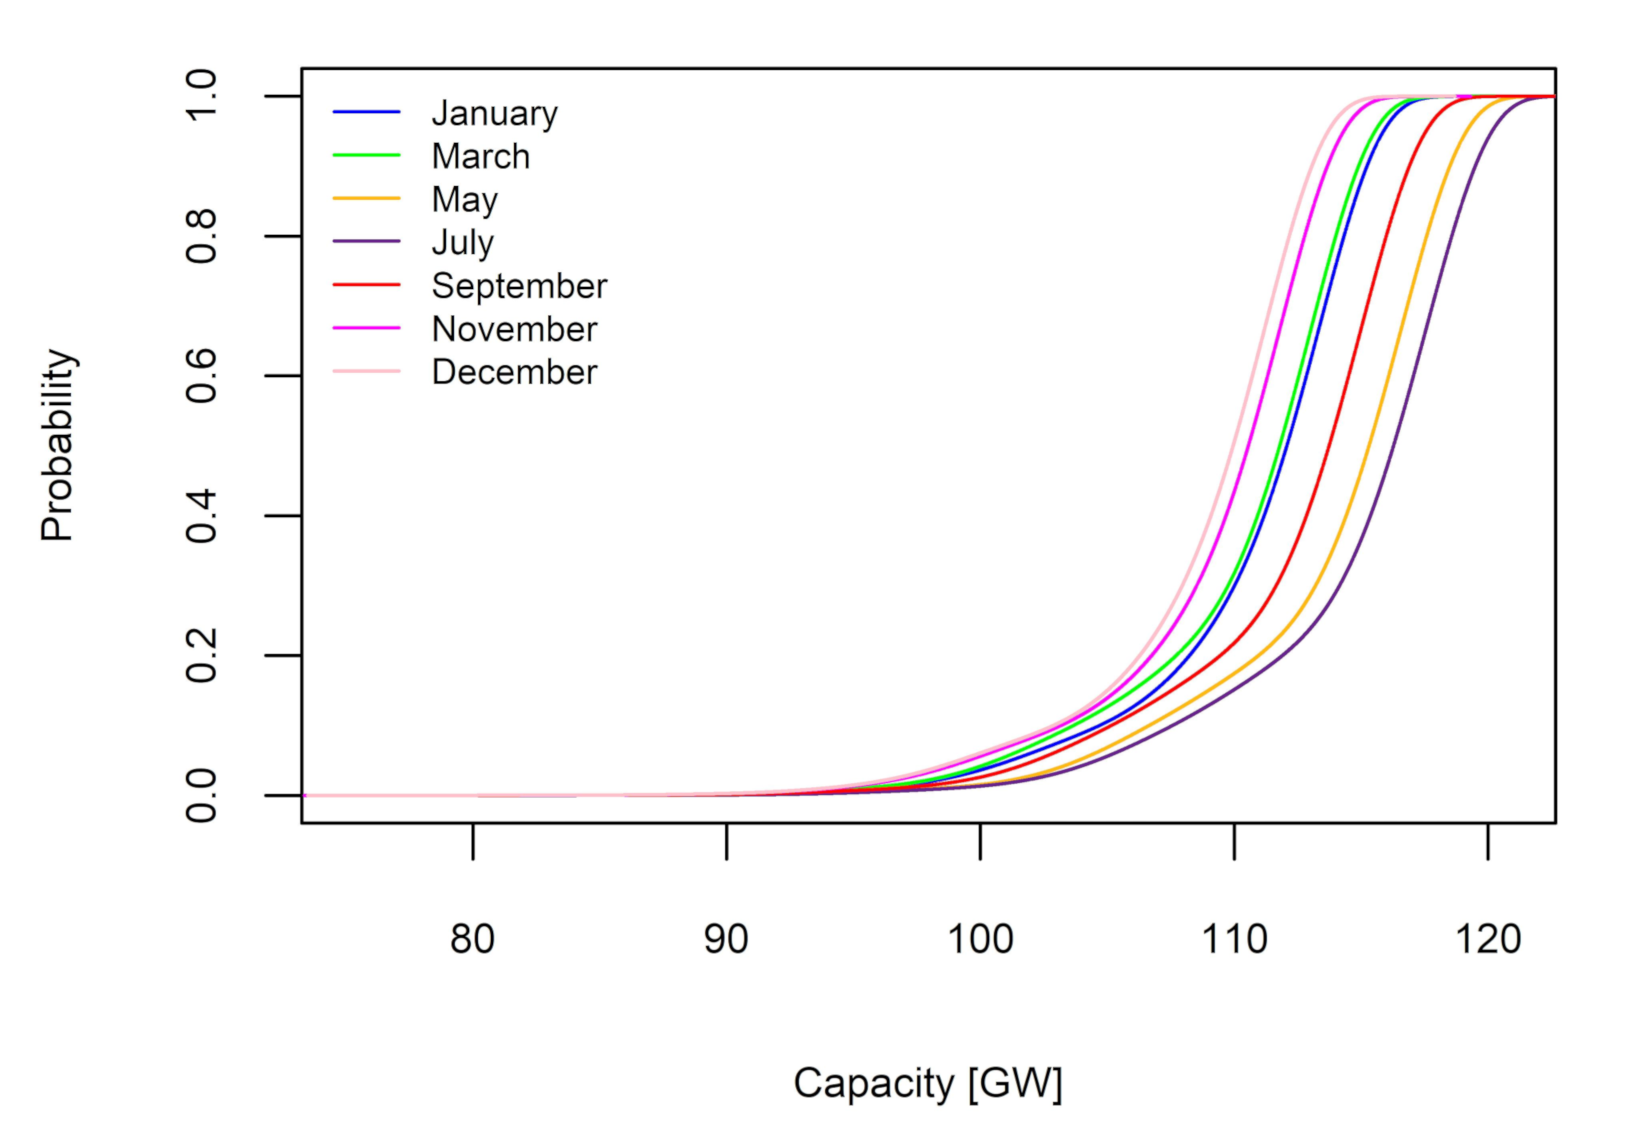
Figure 3 presents the values from the same COPT, but in this case, the y-axis has values for the accumulated probability (third column of Table 1). The same conclusions discussed for Figure 2 can be withdrawn.

3.2. ELCC Results

3.2.1. Brazil-SIN

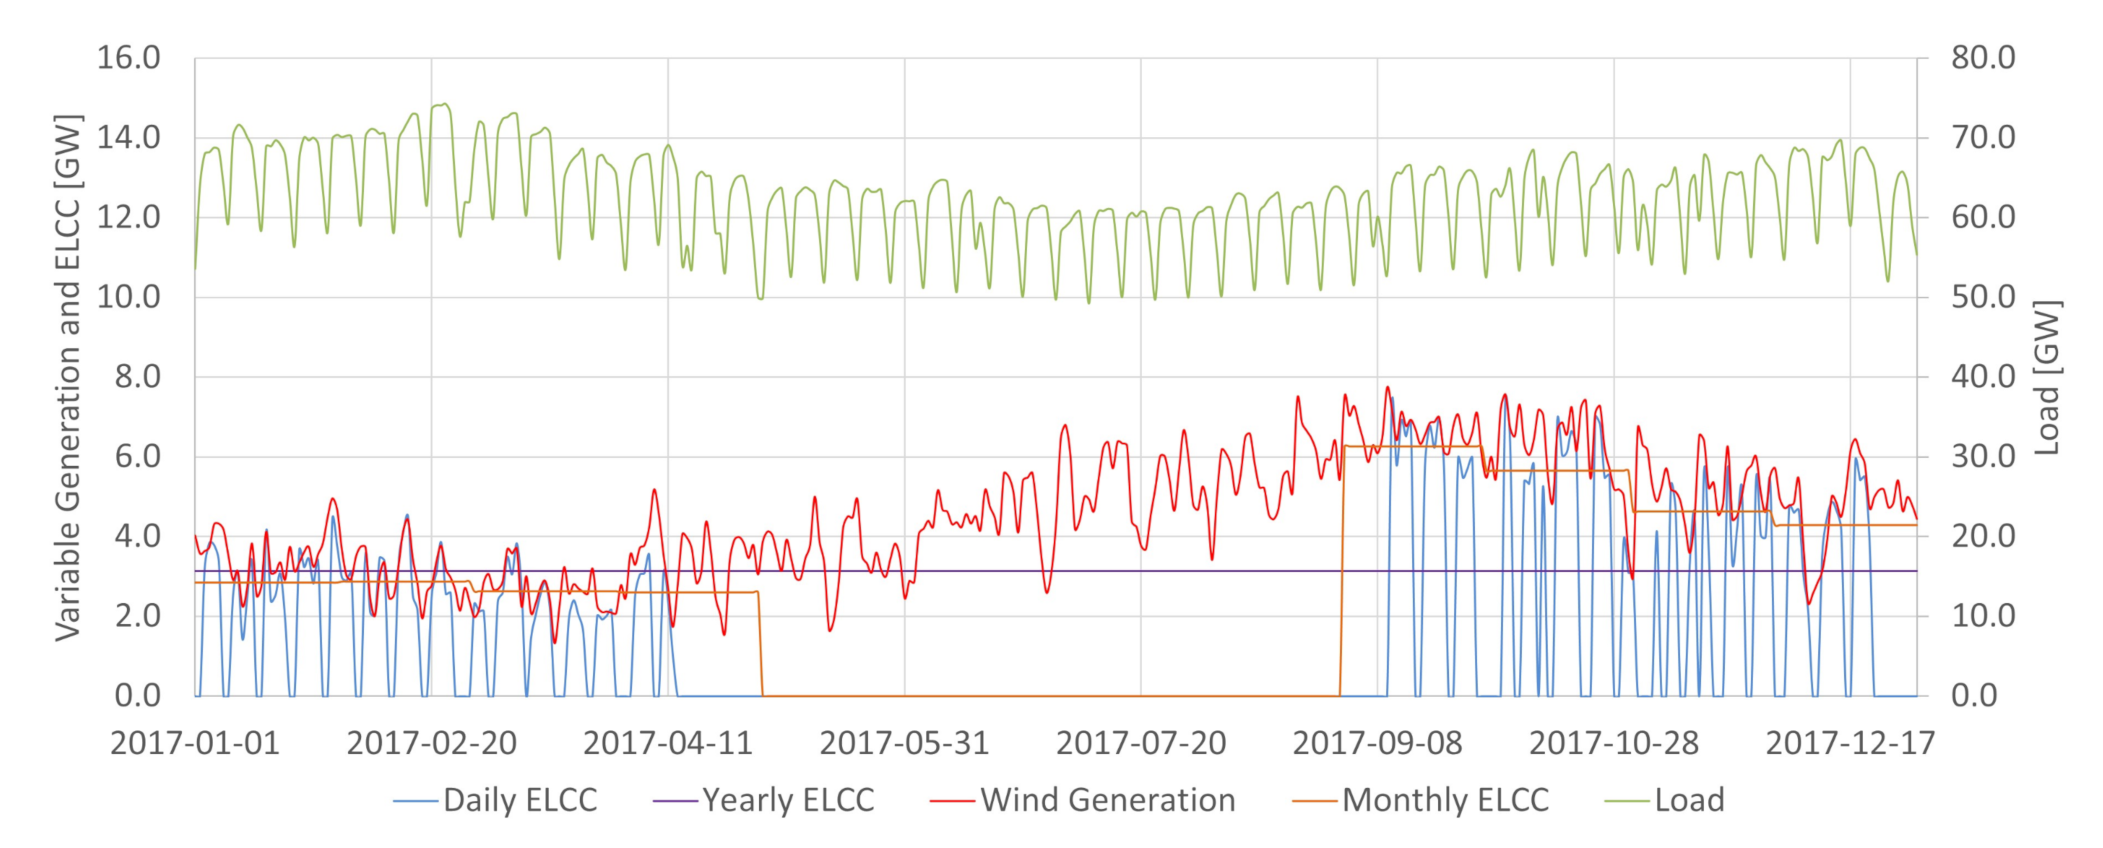
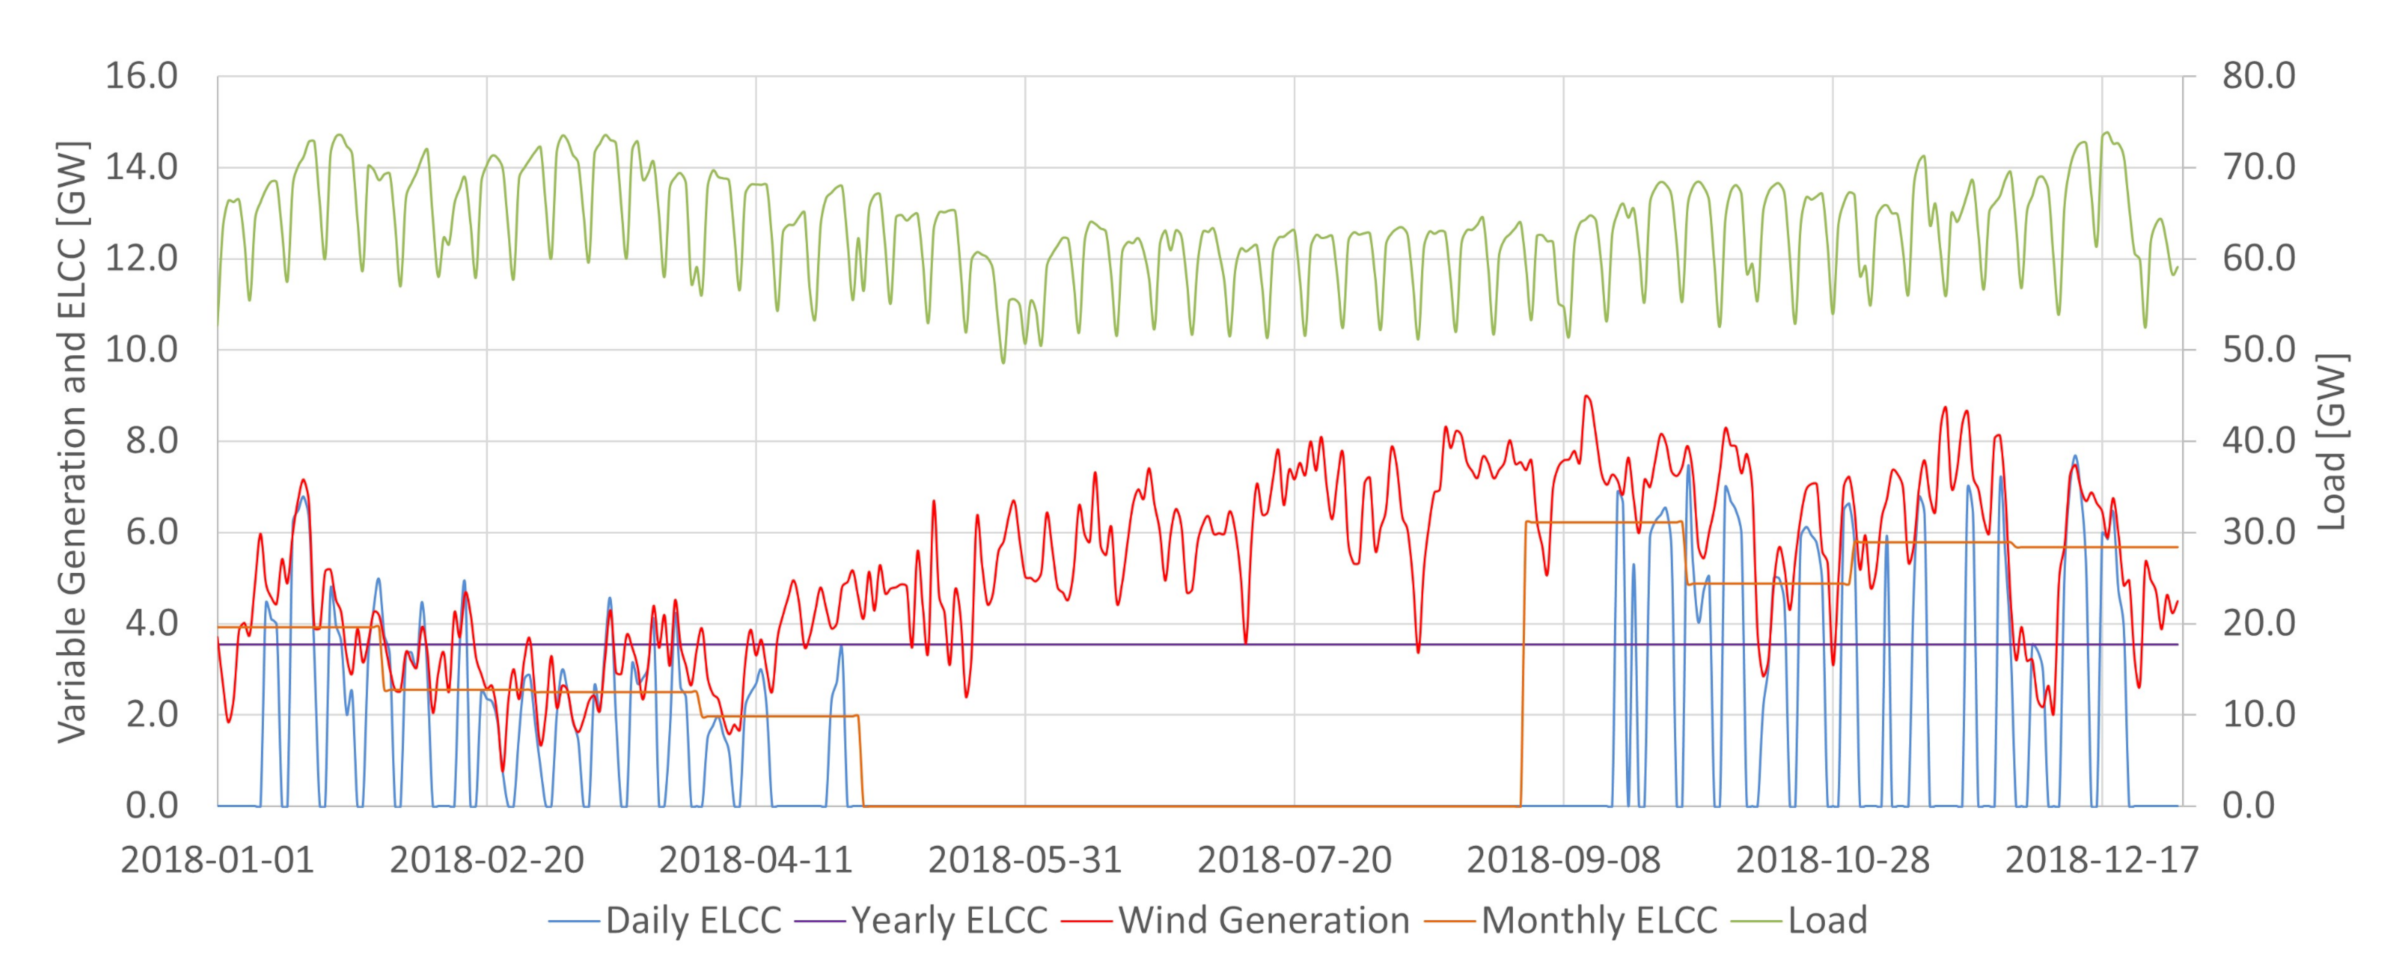
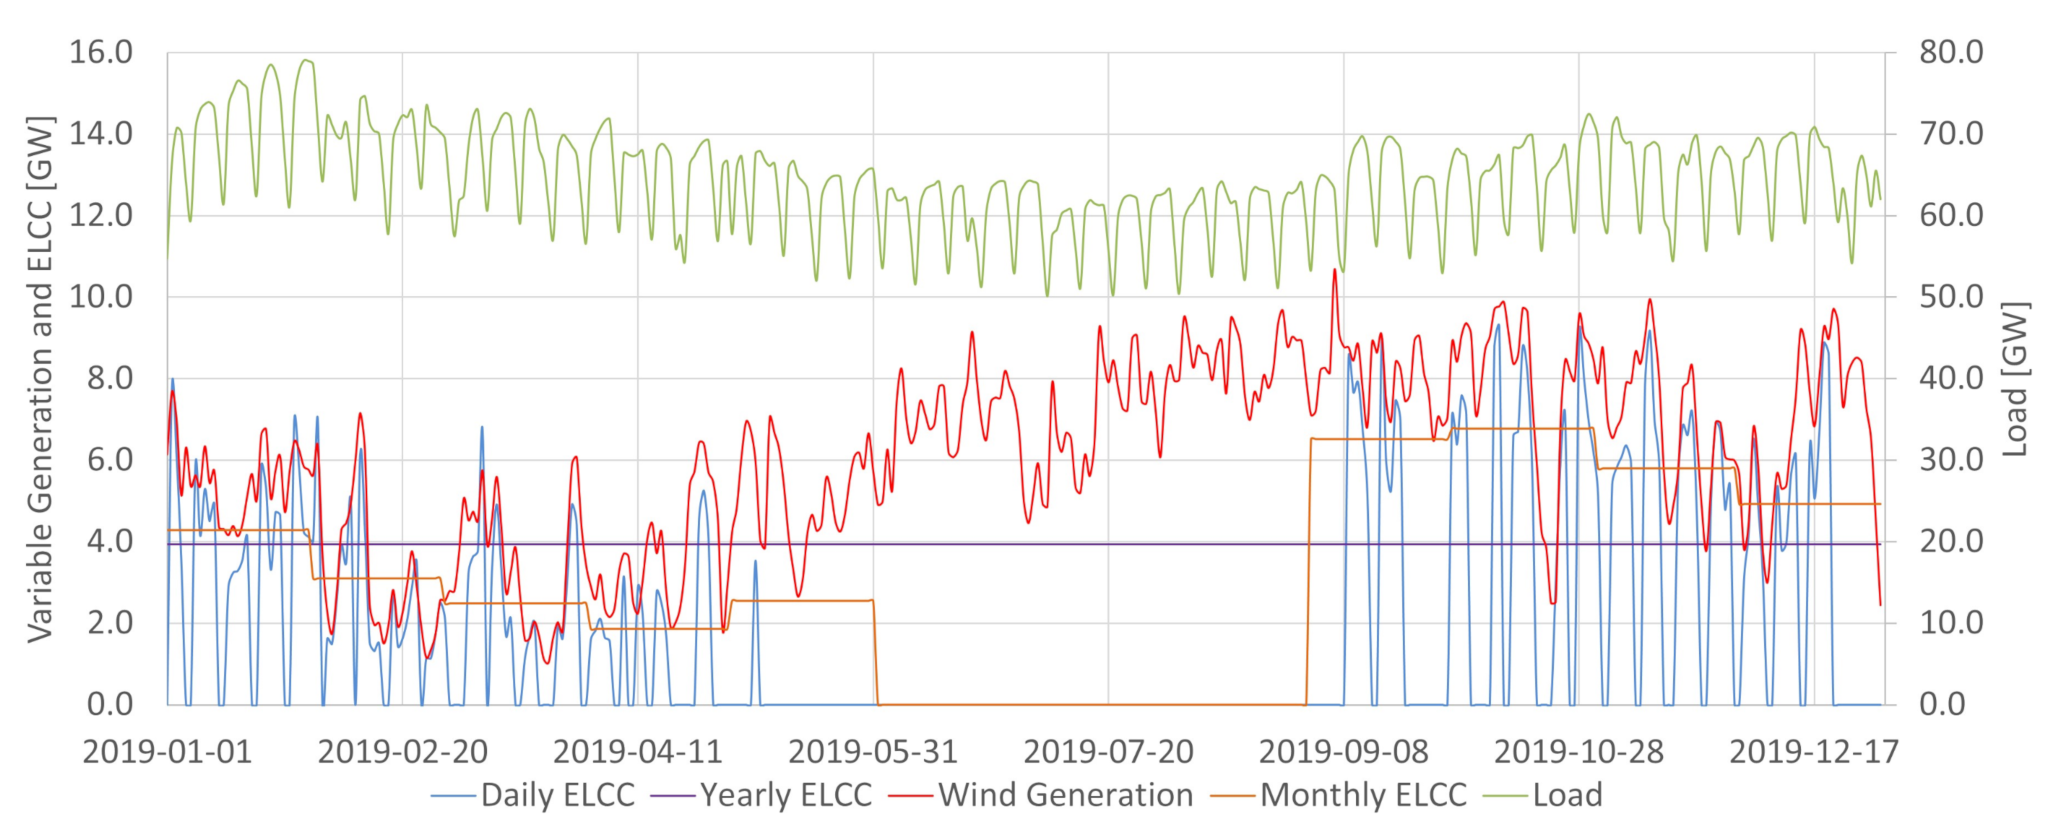
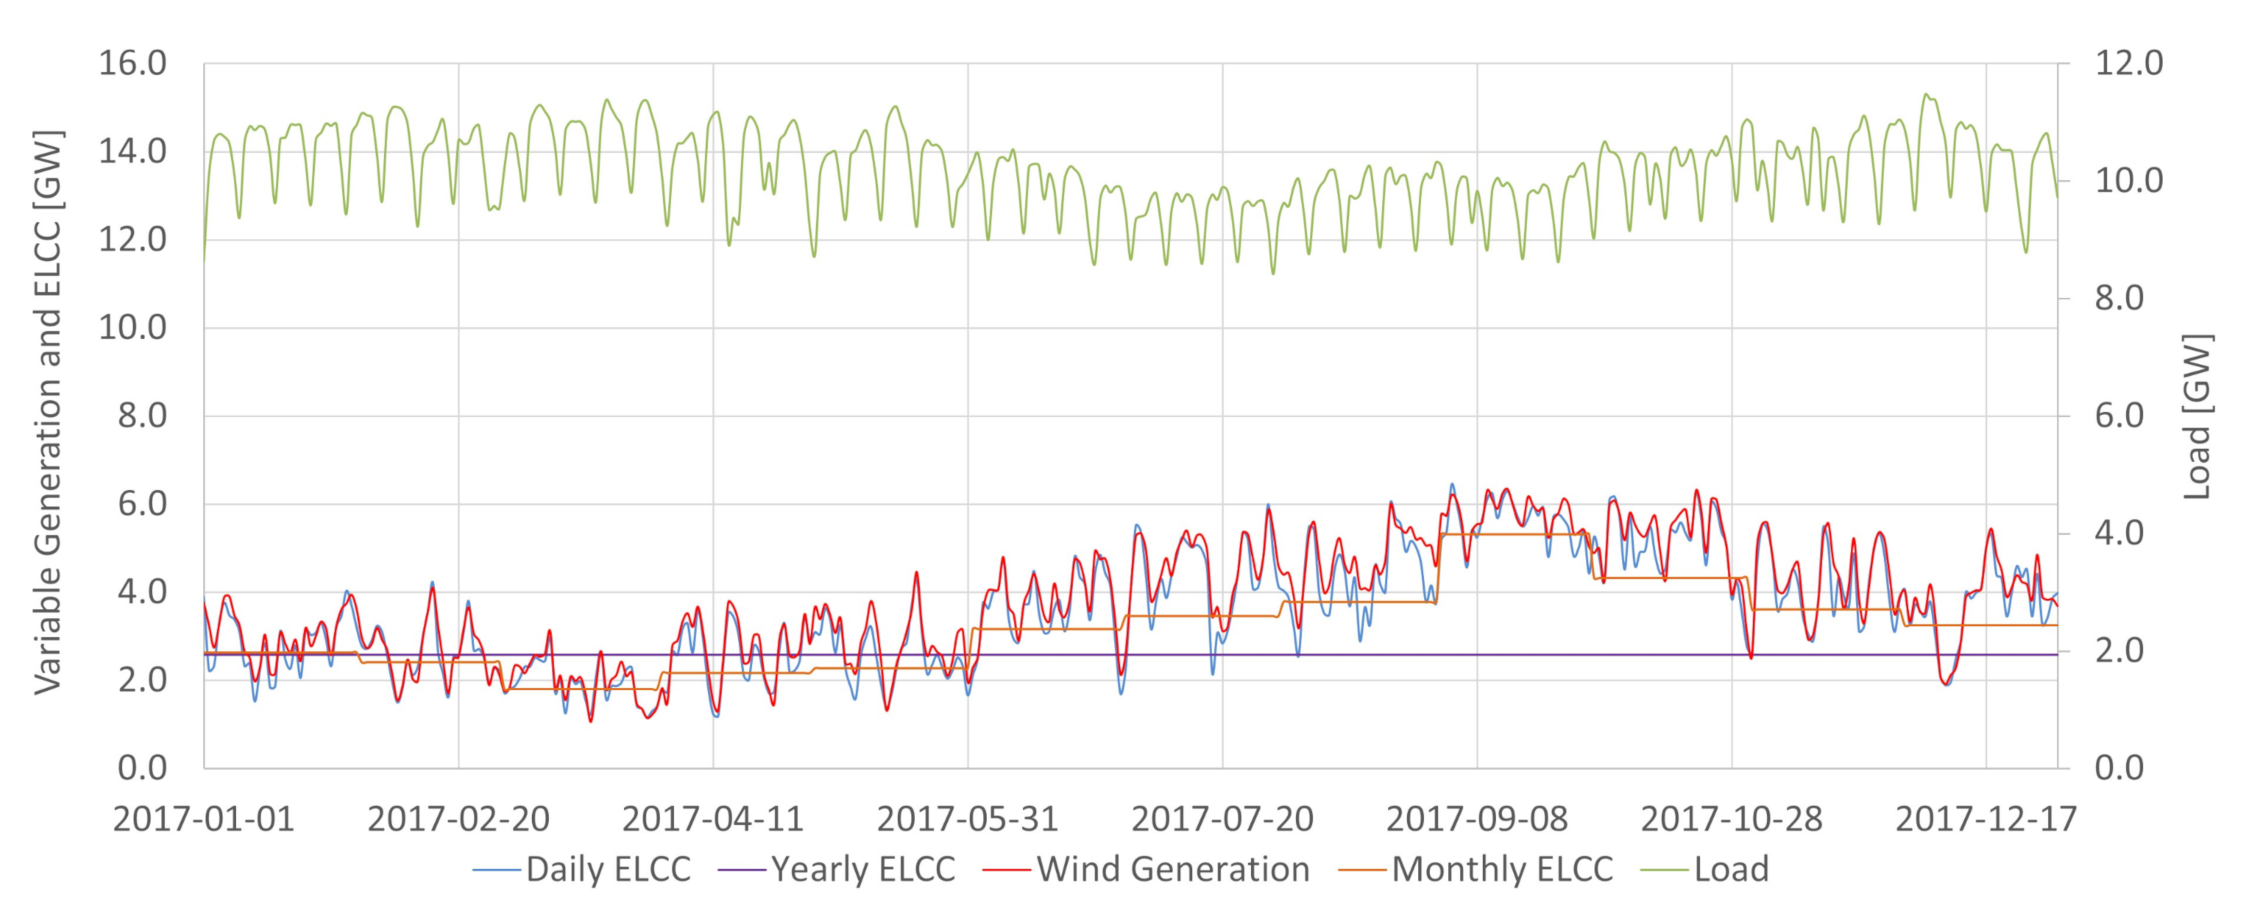
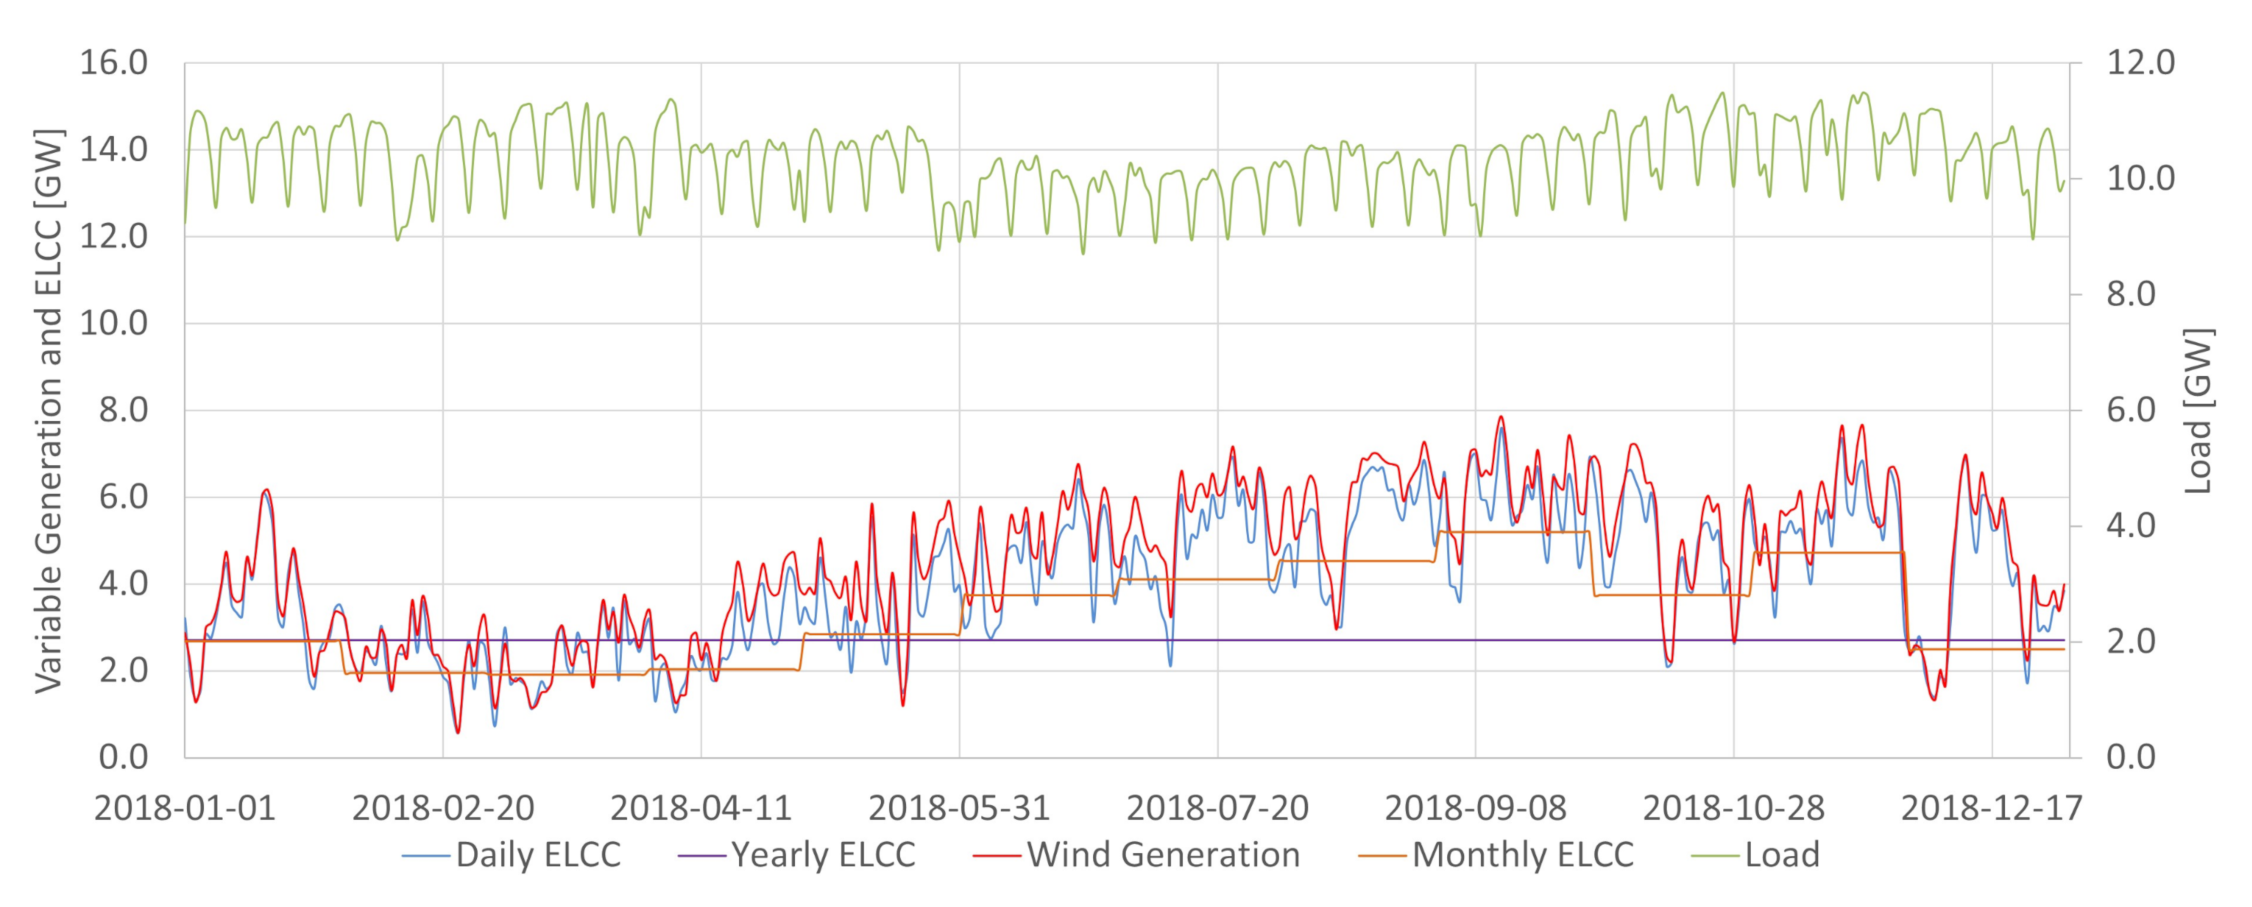
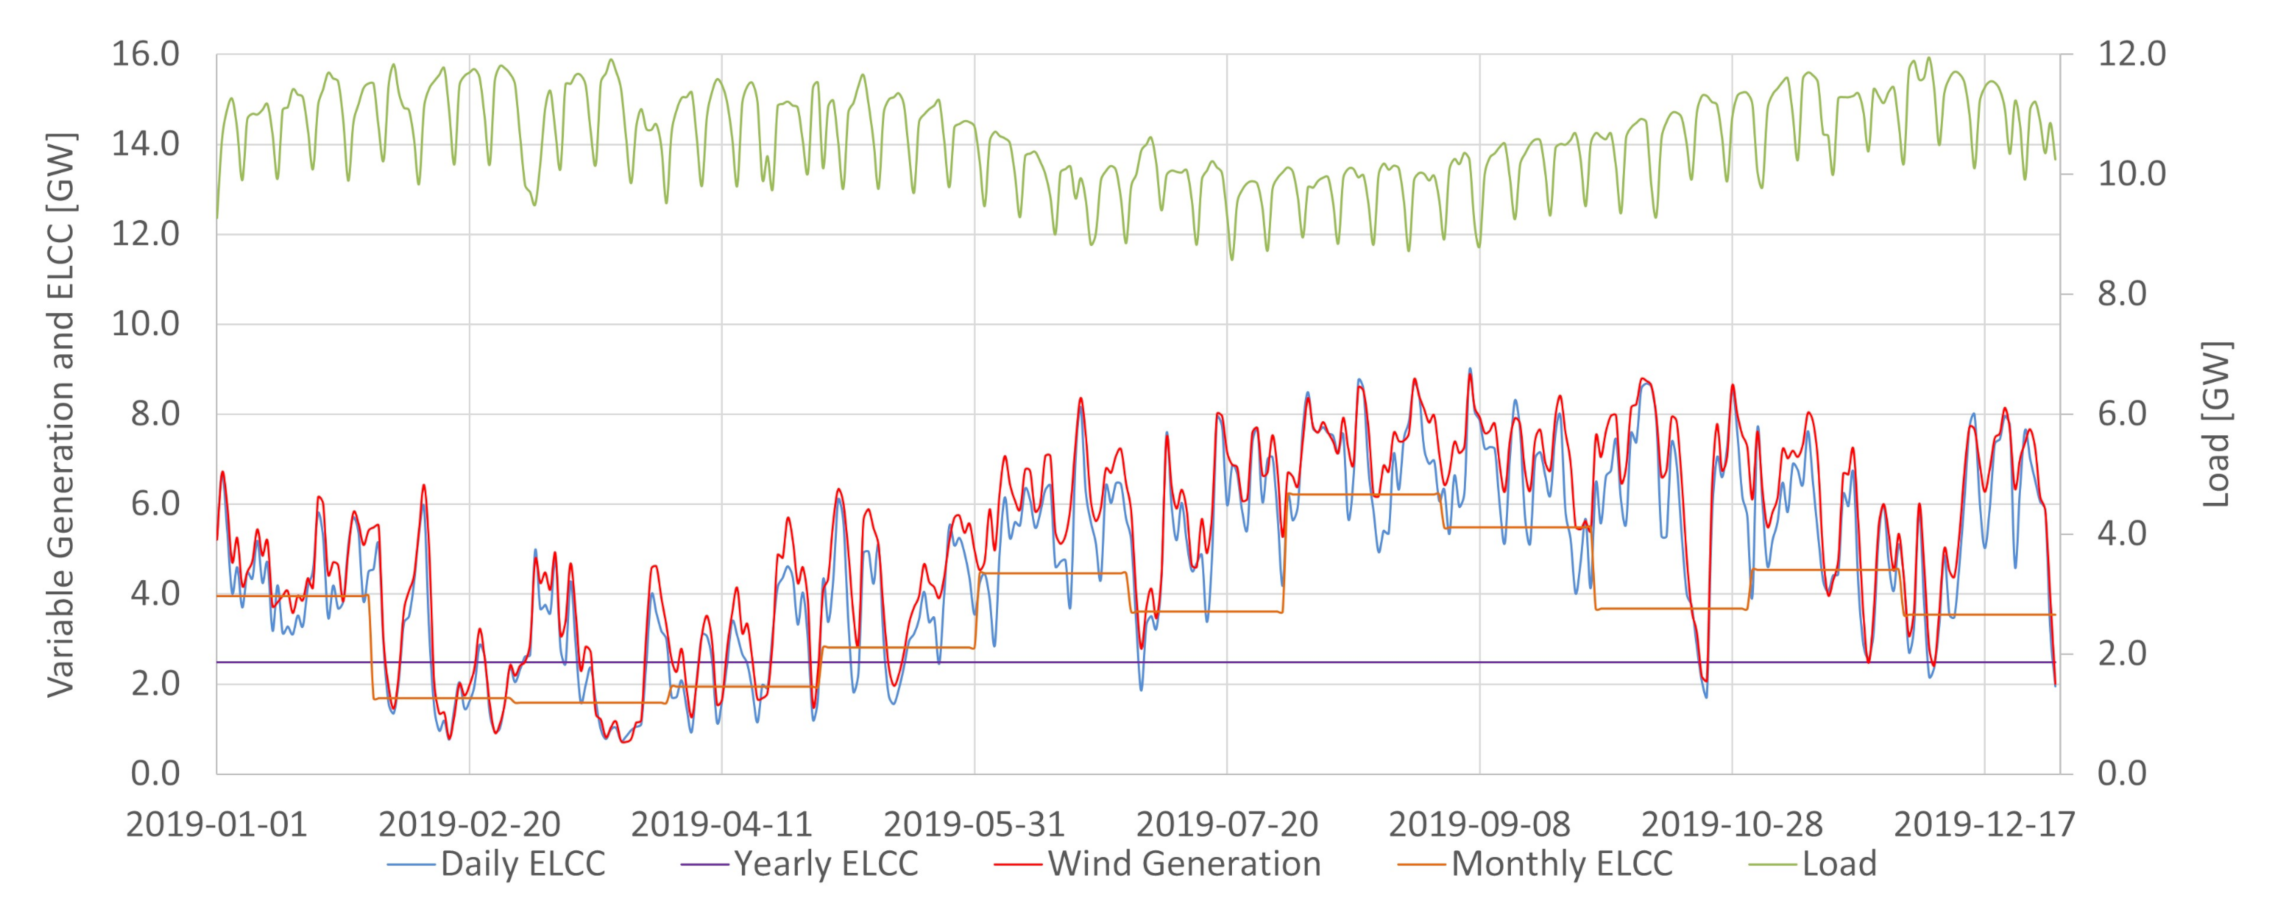
Figure 4, Figure 5 and Figure 6 indicate that daily ELCC for wind generation generally follows closely the actual generation. However, this is not true in two cases: for weekends and from May to August. It can be seen that the daily ELCC periodically falls to zero (within a week timescale), and the values close to zero marks the weekends. The main explanation for this is that the load drops considerably on the weekends. In this context, the dispatchable generation capacity is substantially greater than load demand. In this way, conventional sources reliably meet demand without intermittent sources support, so the added VG does not provide a relevant capacity contribution. The same pattern observed on weekends is also found in the monthly time scale, from May to August. During cold months in Brazil, the load suffers a decrease. This situation happens because in almost all Brazil regions, there is no need for indoor heating and the usage of air conditioning decreases as the temperature drops. Because of this sustained load drop from May to August, the same observations regarding the null ELCC values for weekends apply, forcing the ELCC to zero in those months.
For monthly wind ELCC, the zero values of ELCC during the cold months also happens for the same reason already explained for the daily ELCC, and the only difference is that a month is the base time interval where the condition L O L E L o a d = L O L E p r i o r is sought.
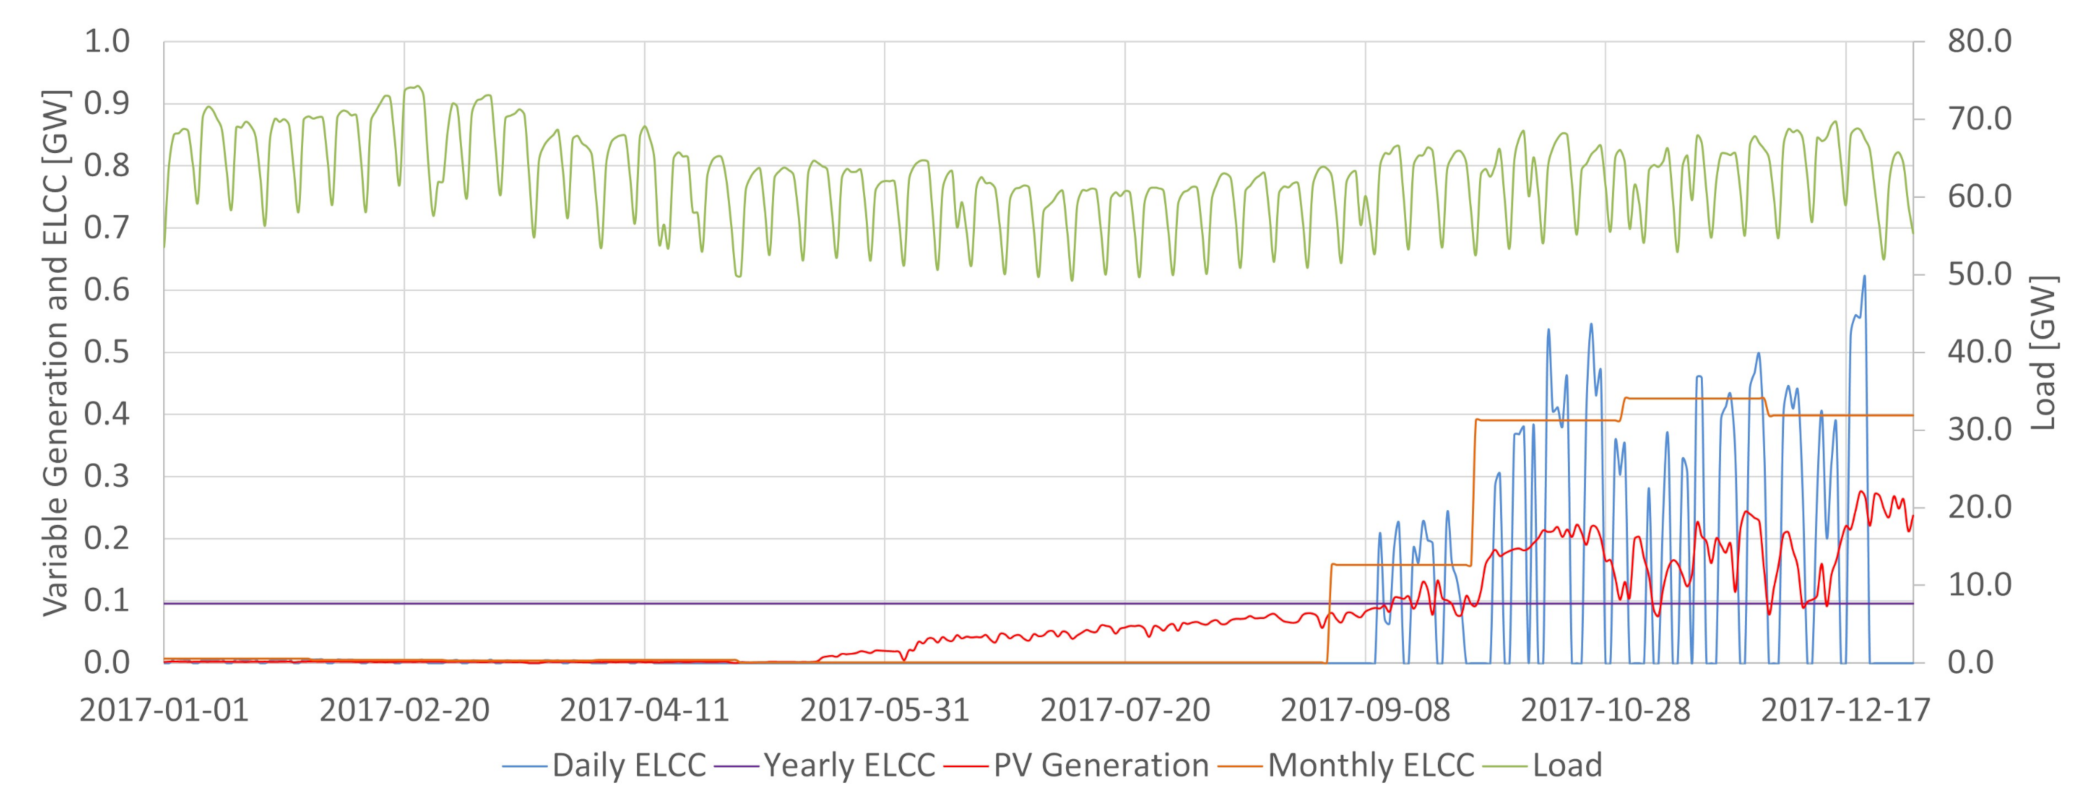
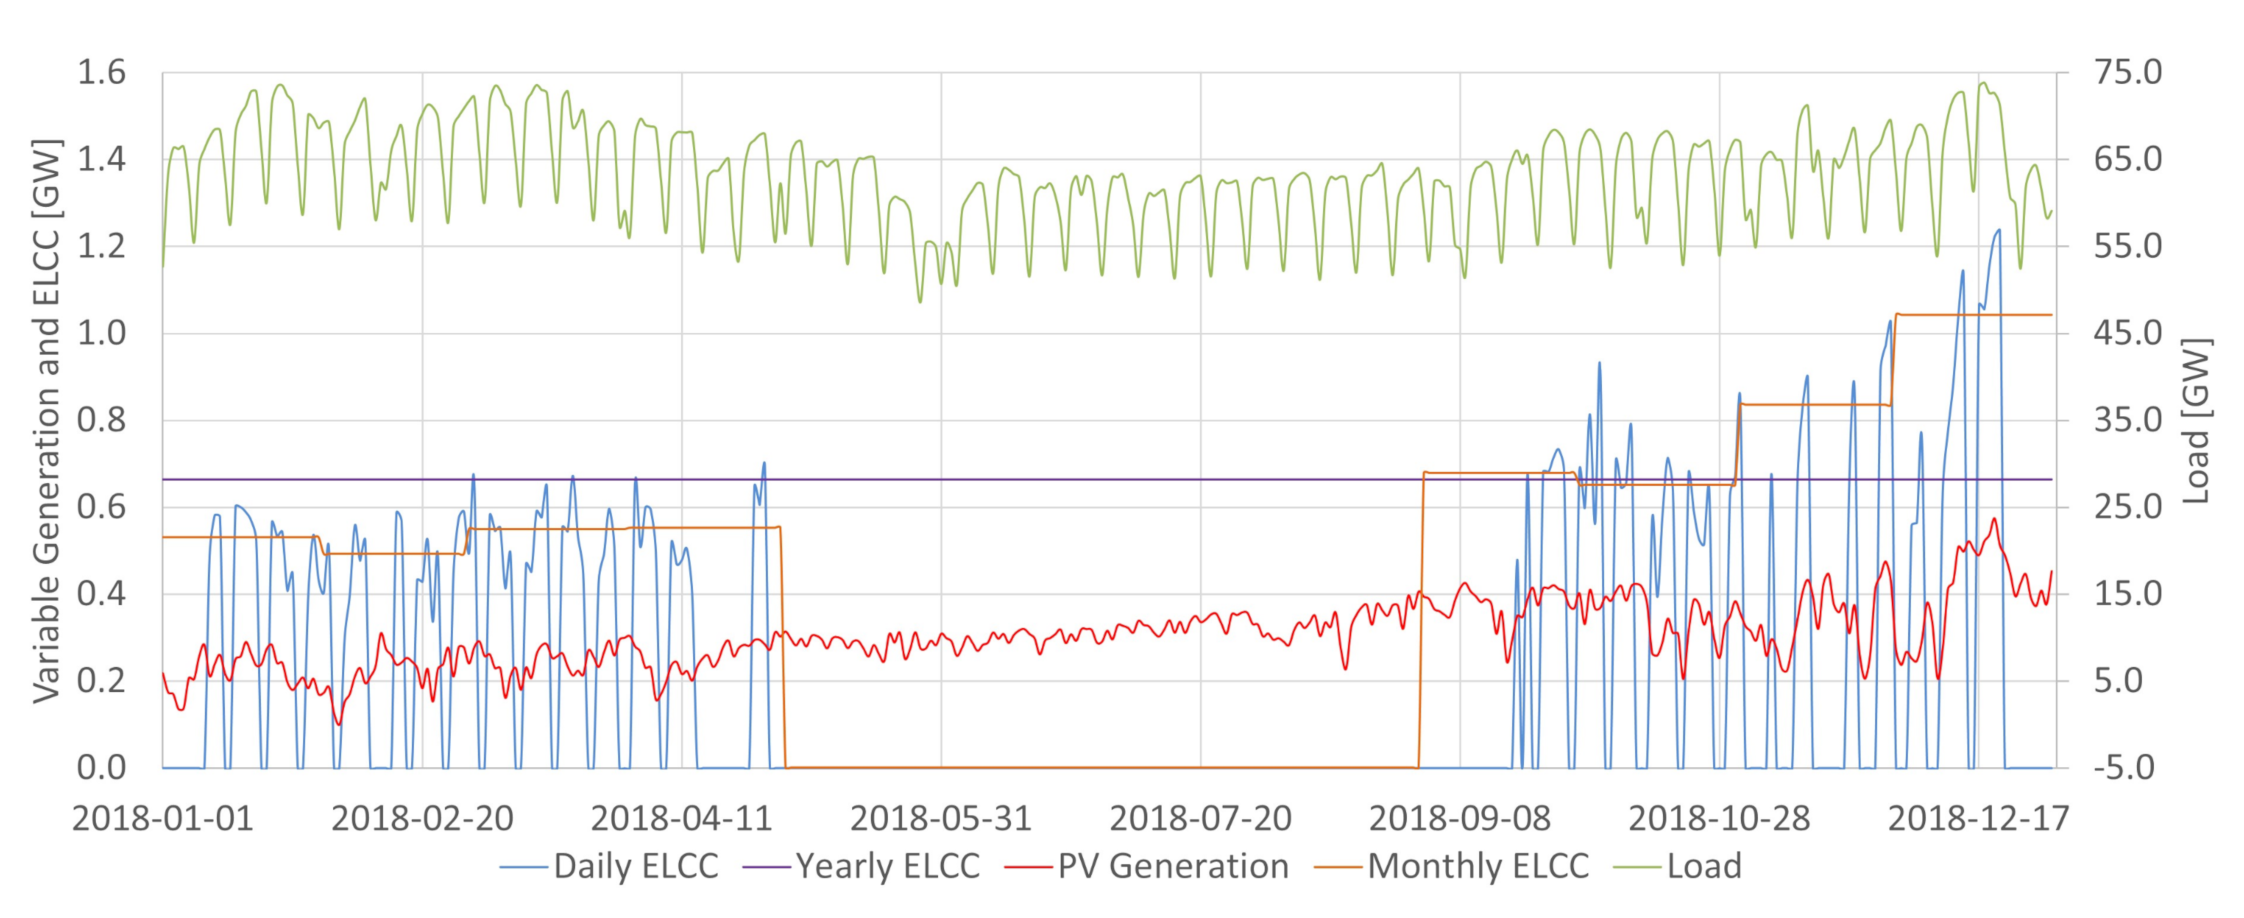
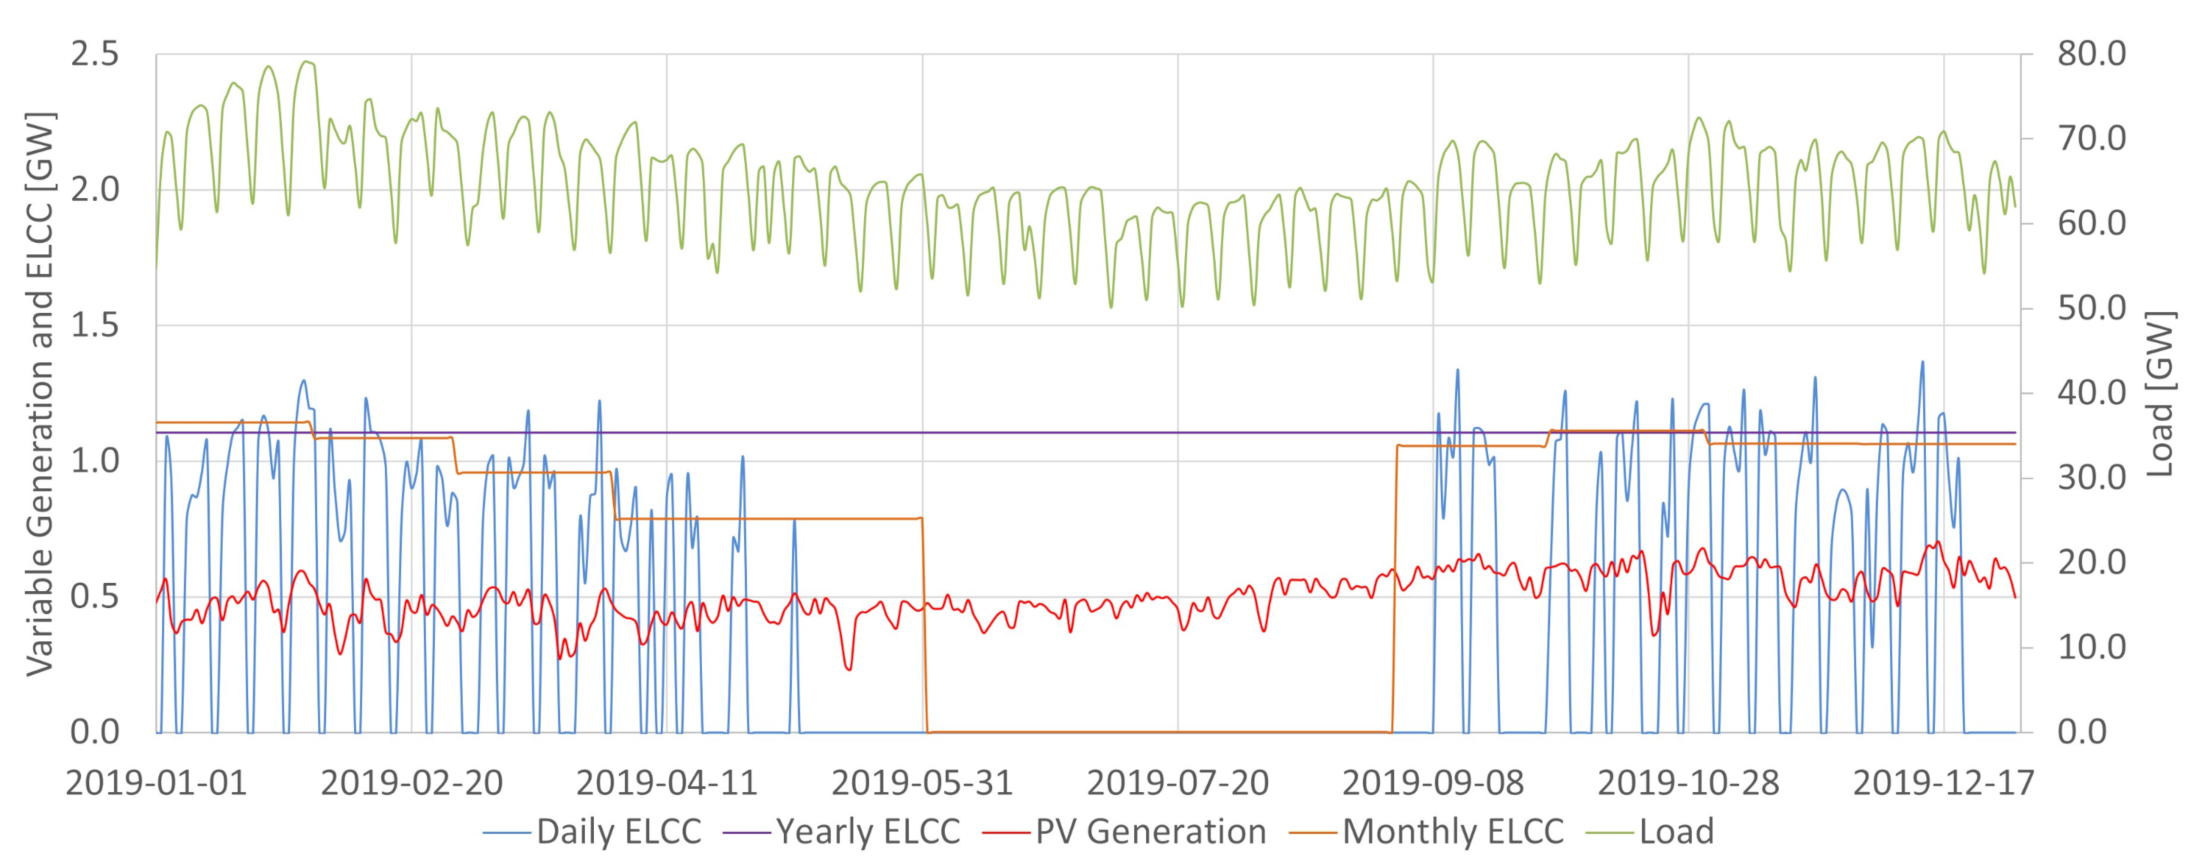
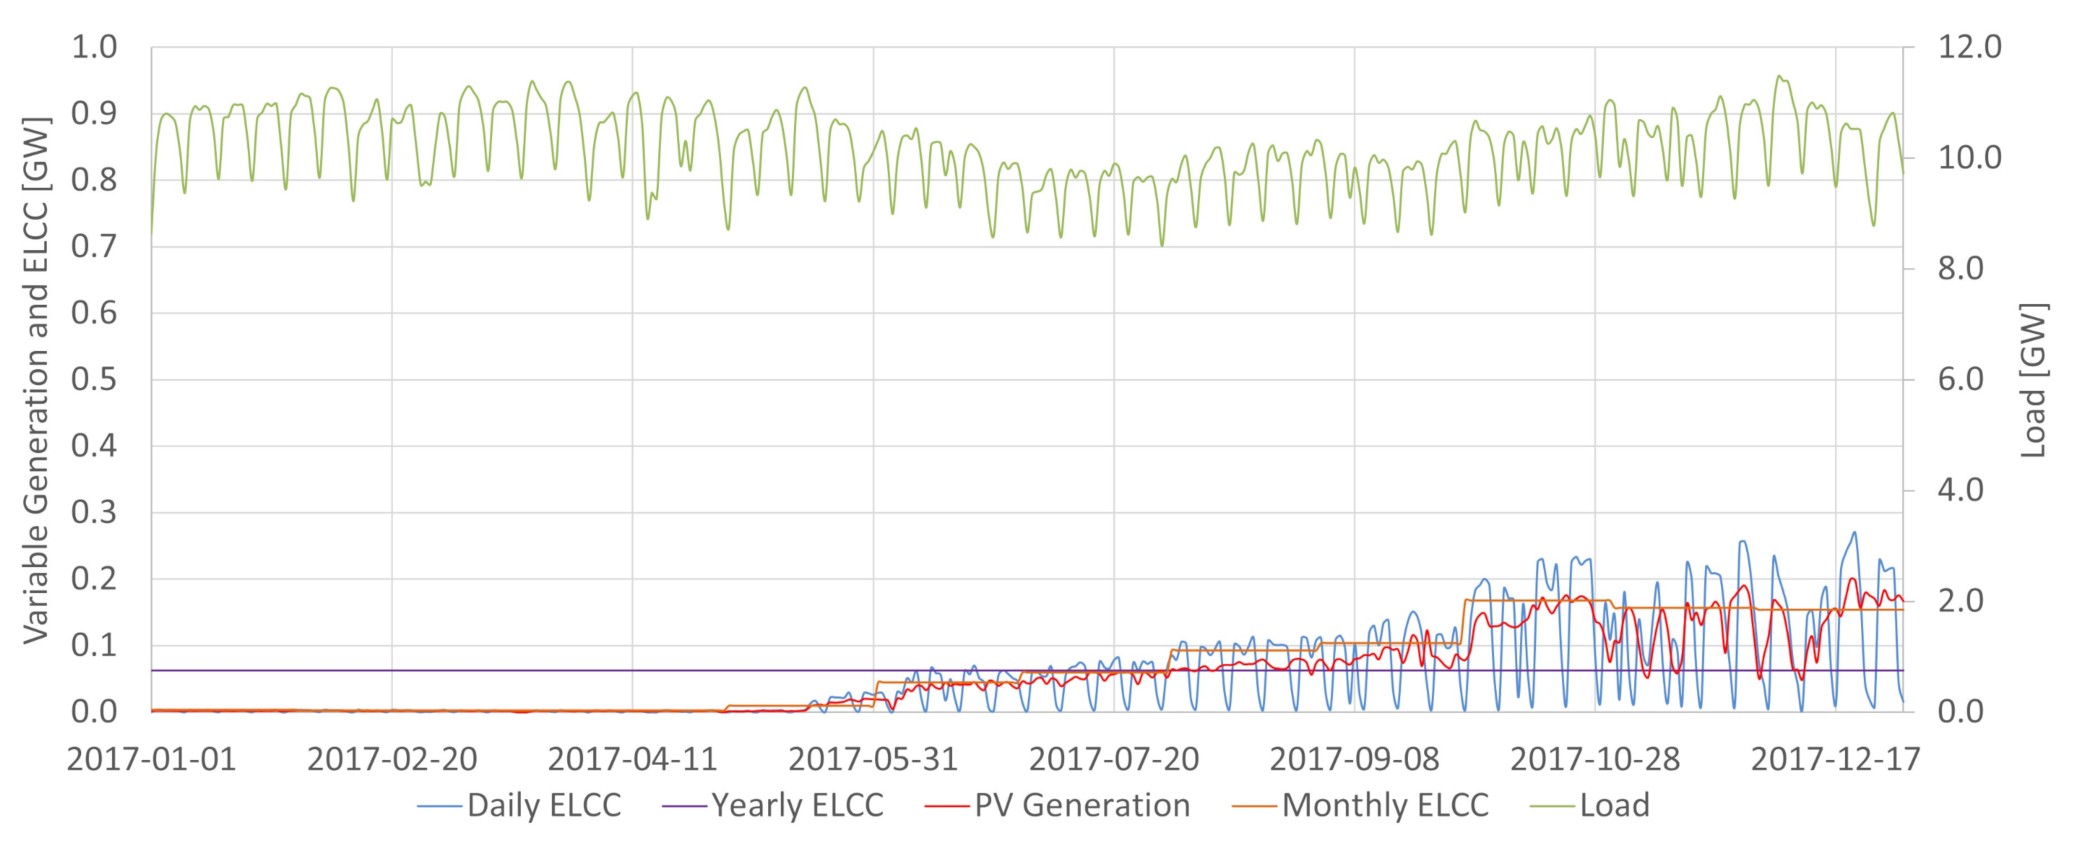
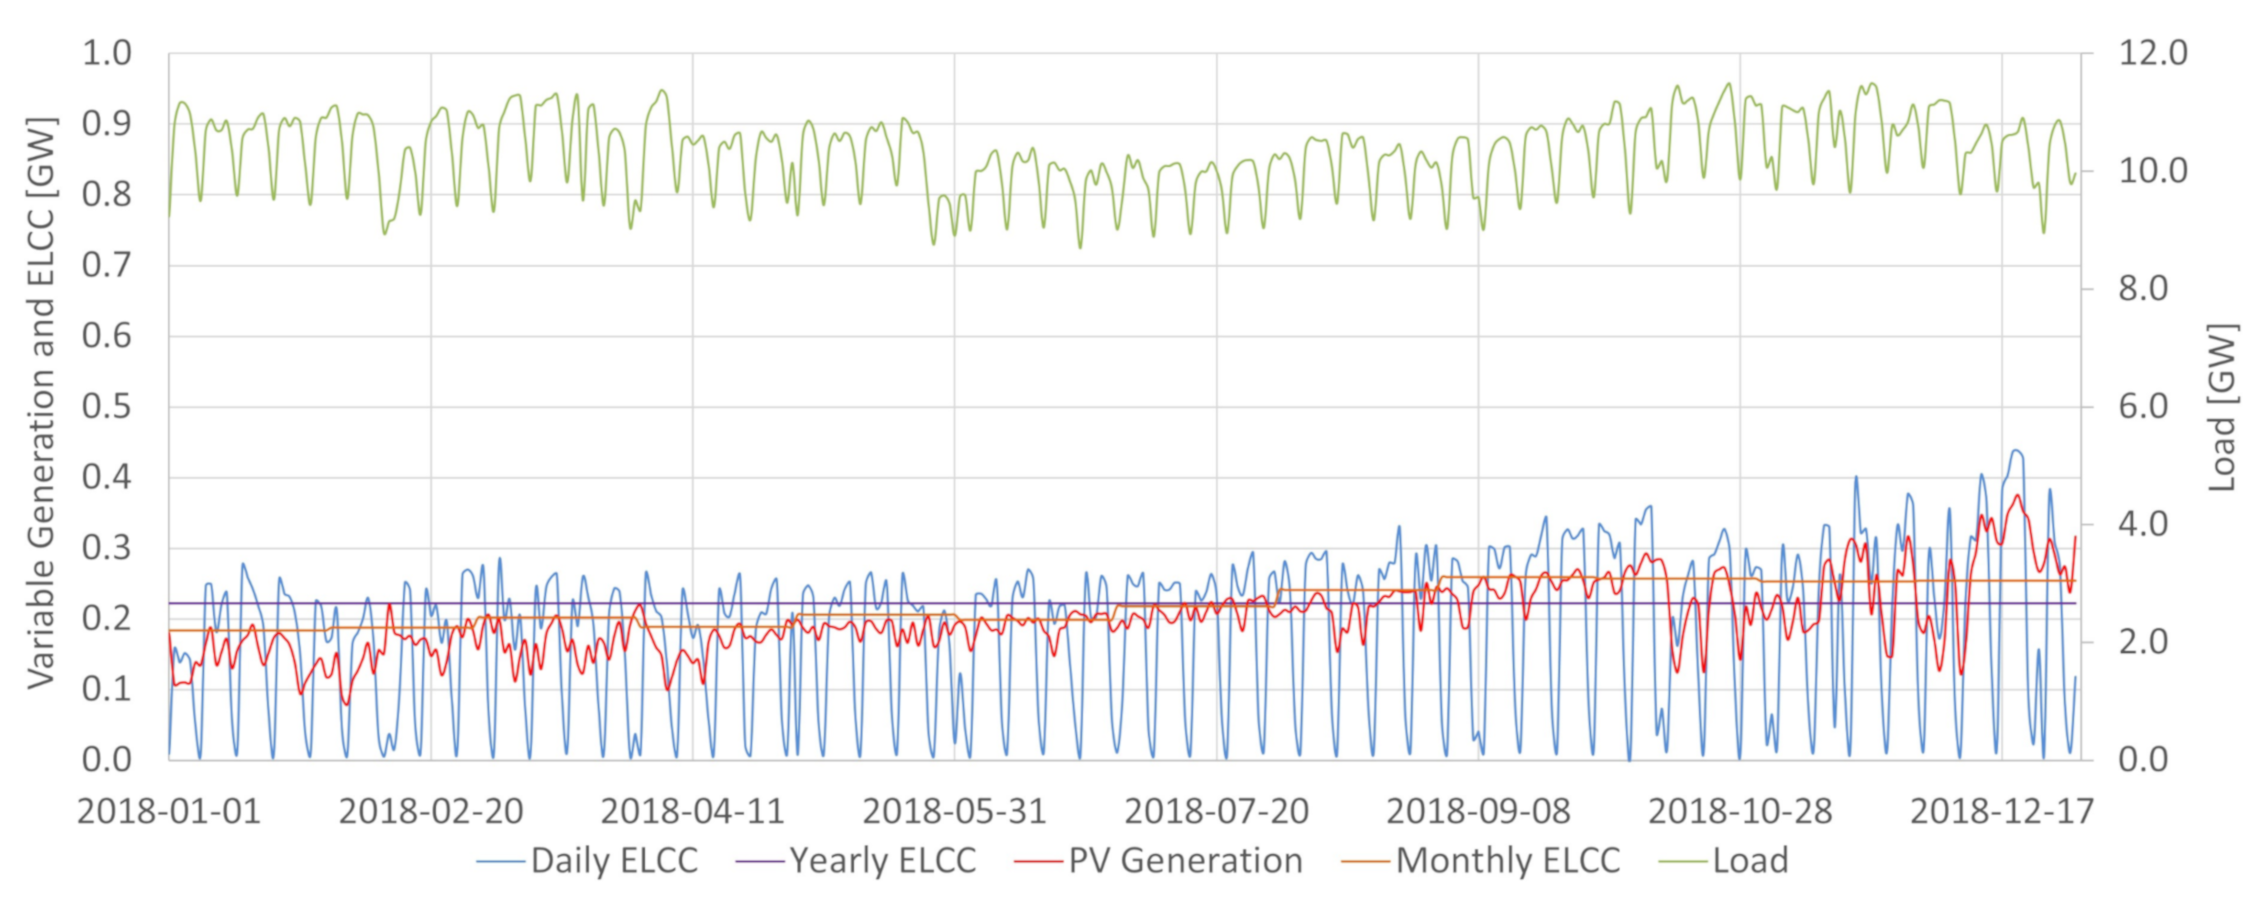
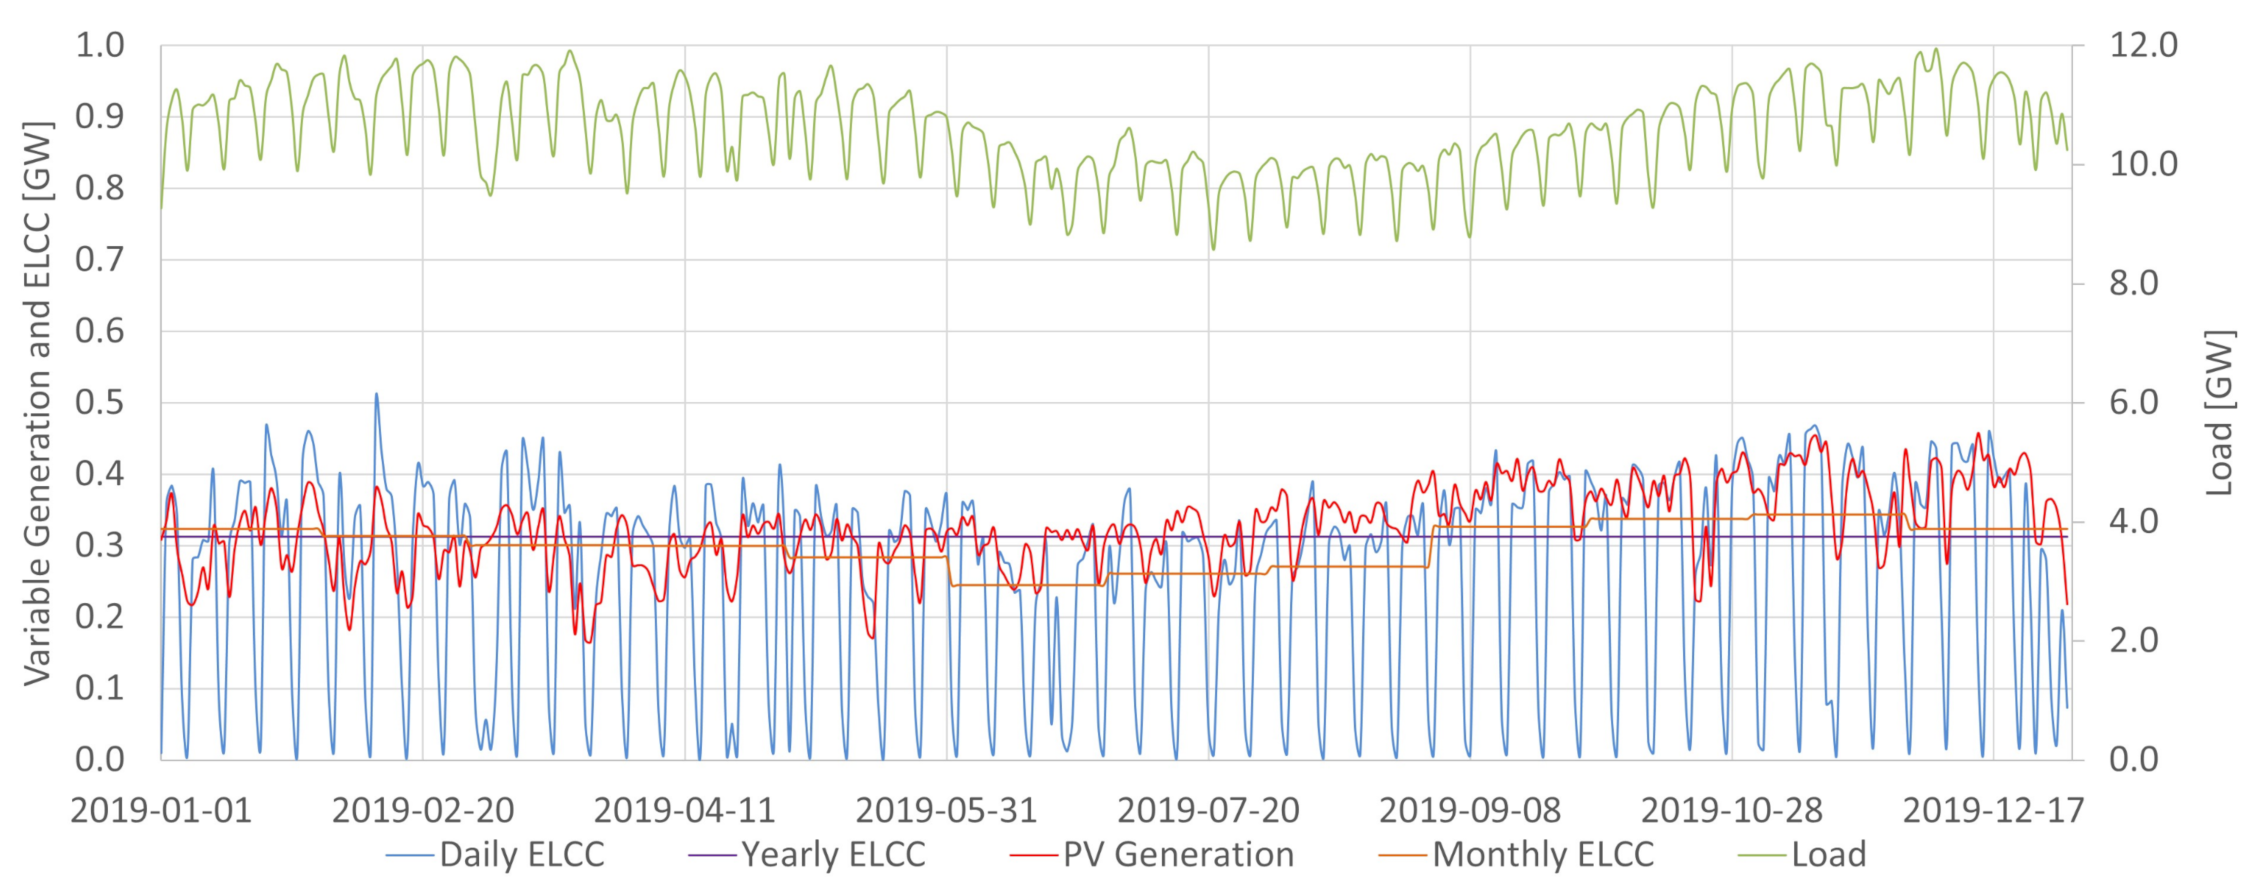
Figure 7, Figure 8 and Figure 9 show the daily, monthly, and yearly ELCC of PV power for 2017, 2018, and 2019 in the SIN.
The same observations for weekends and the load decrease from May to August apply for the PV generation. One additional comment is that for most non-zero ELCC, its value is higher than the PV generation. That happens because the generation’s data are an average for each day in Figure 7, Figure 8 and Figure 9.
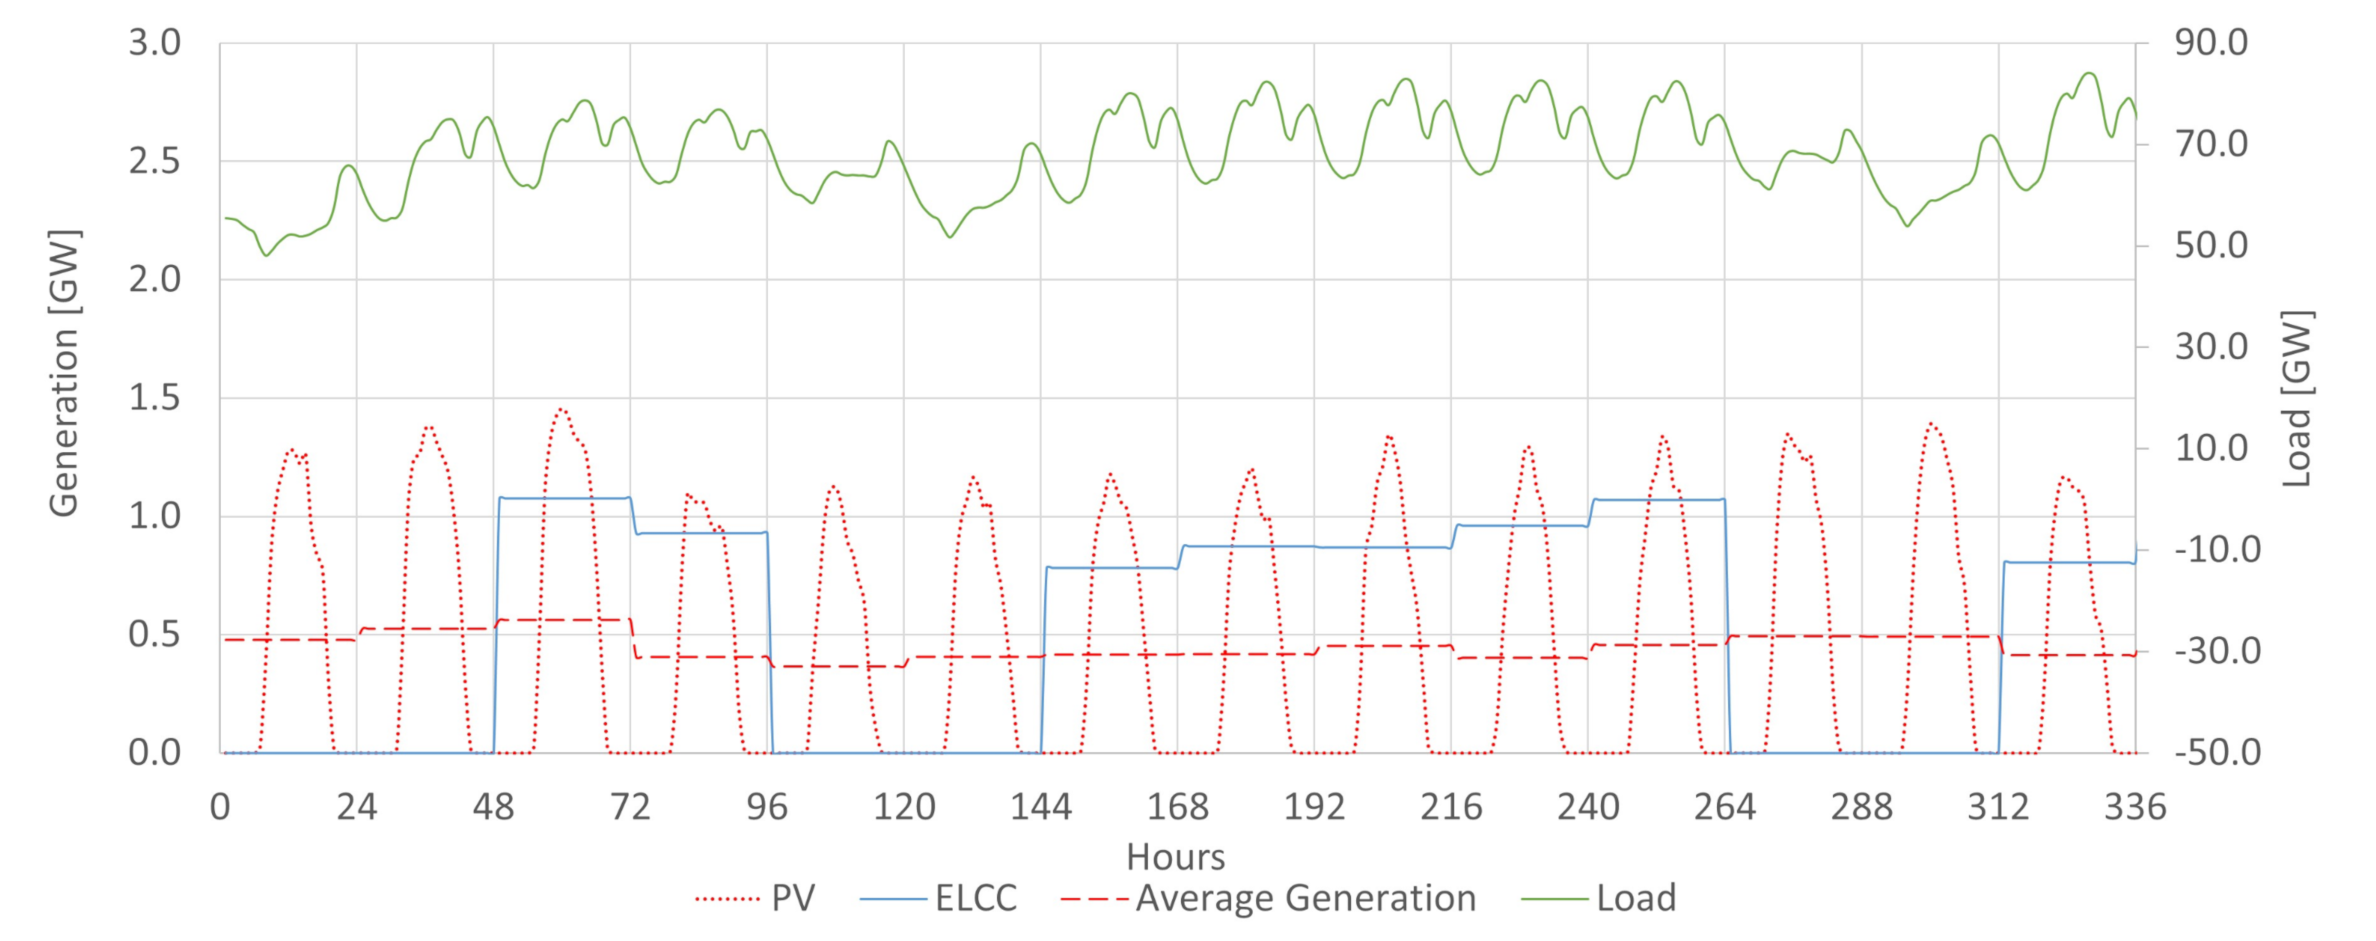
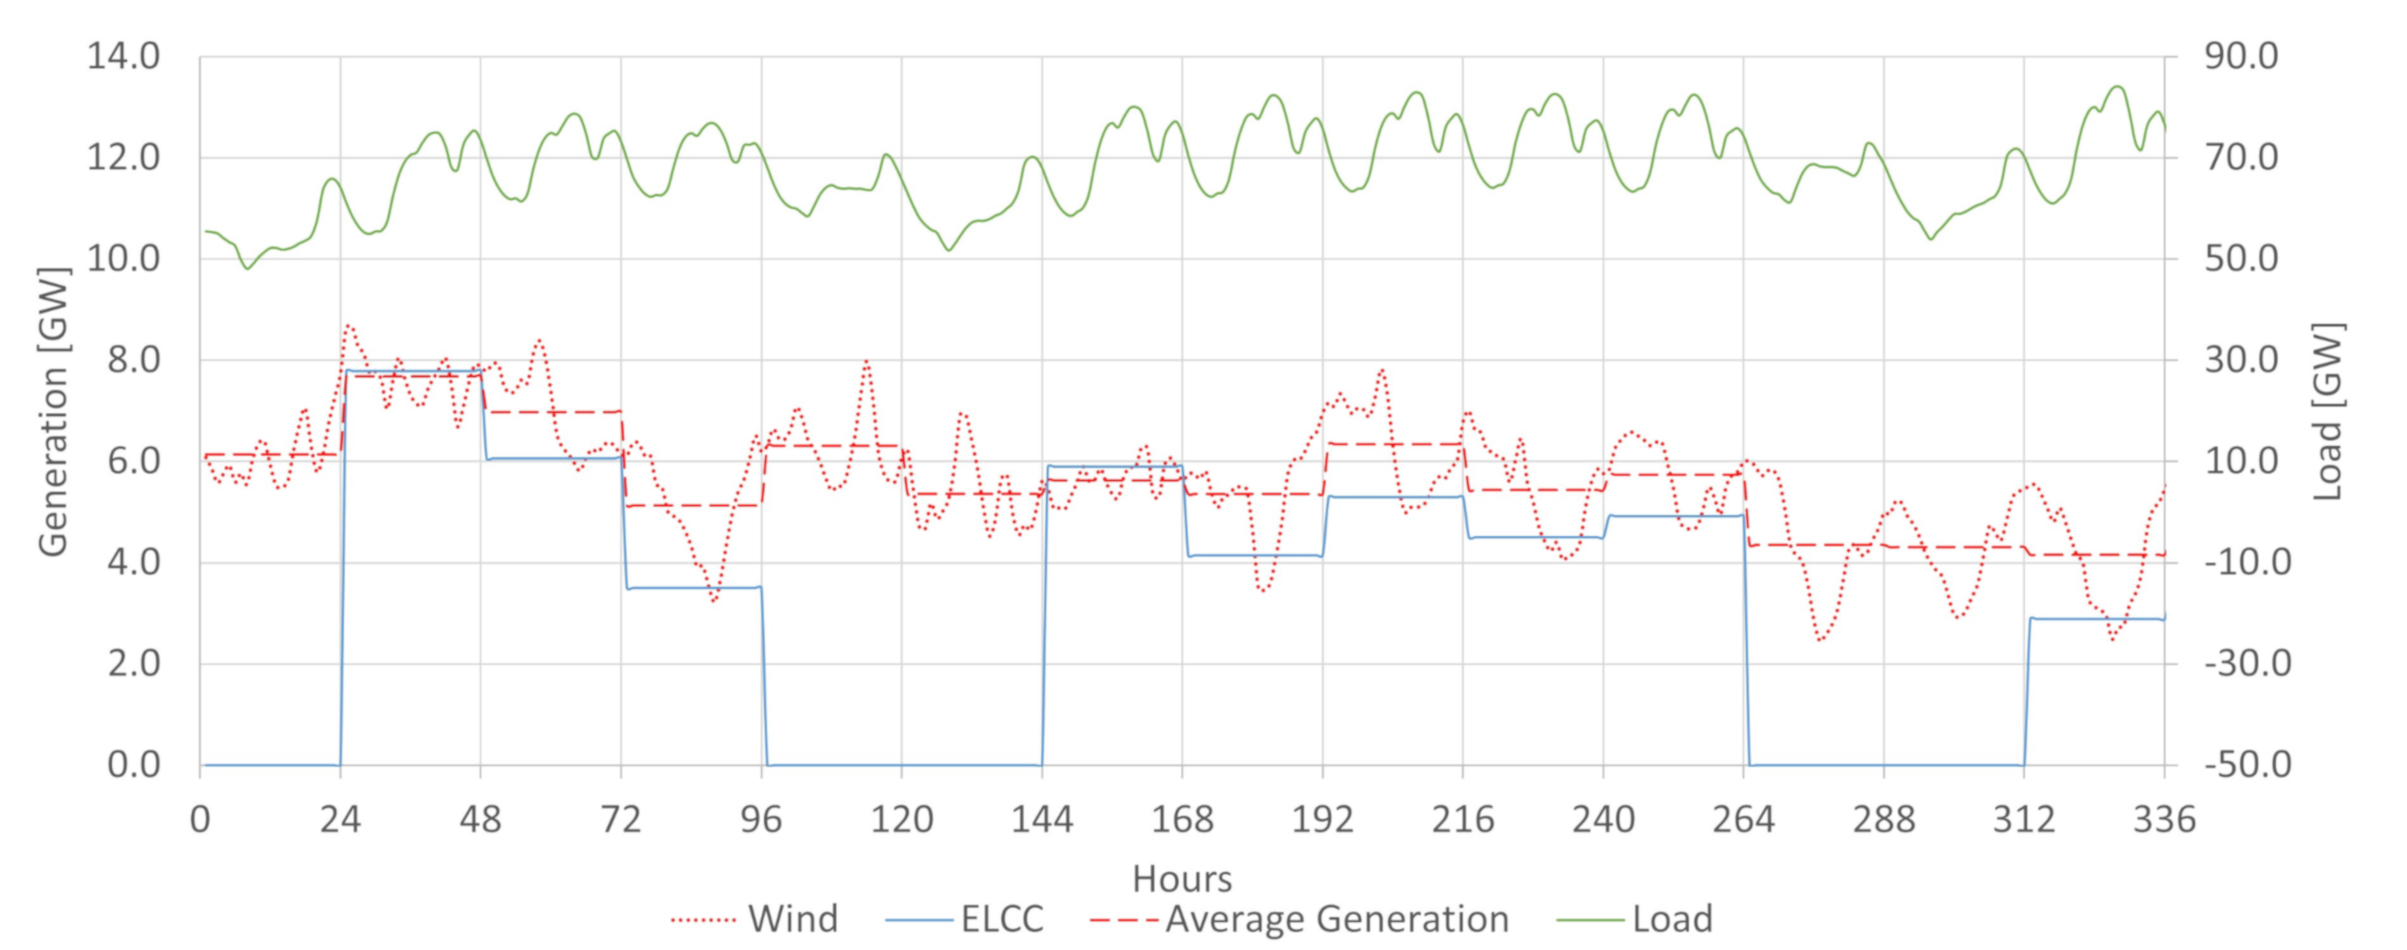
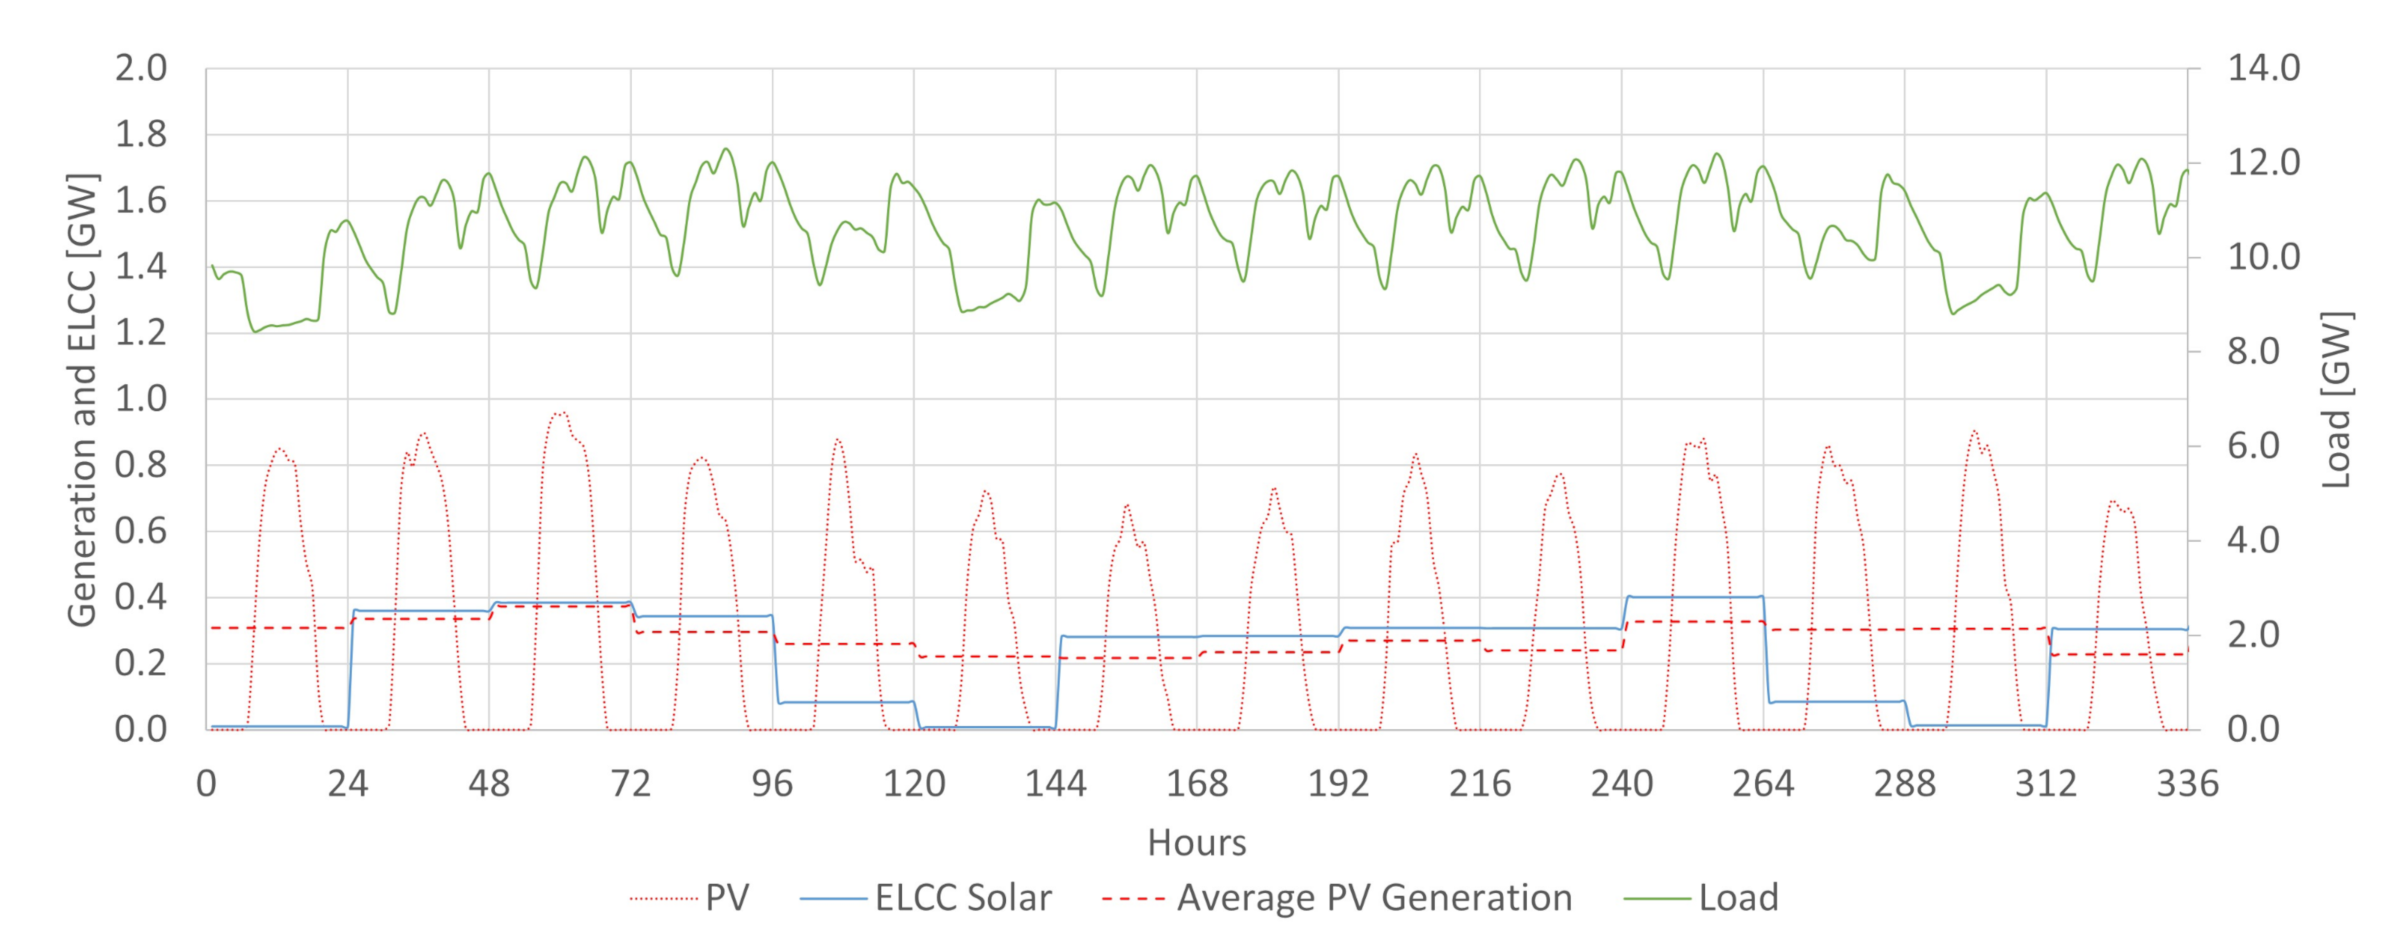
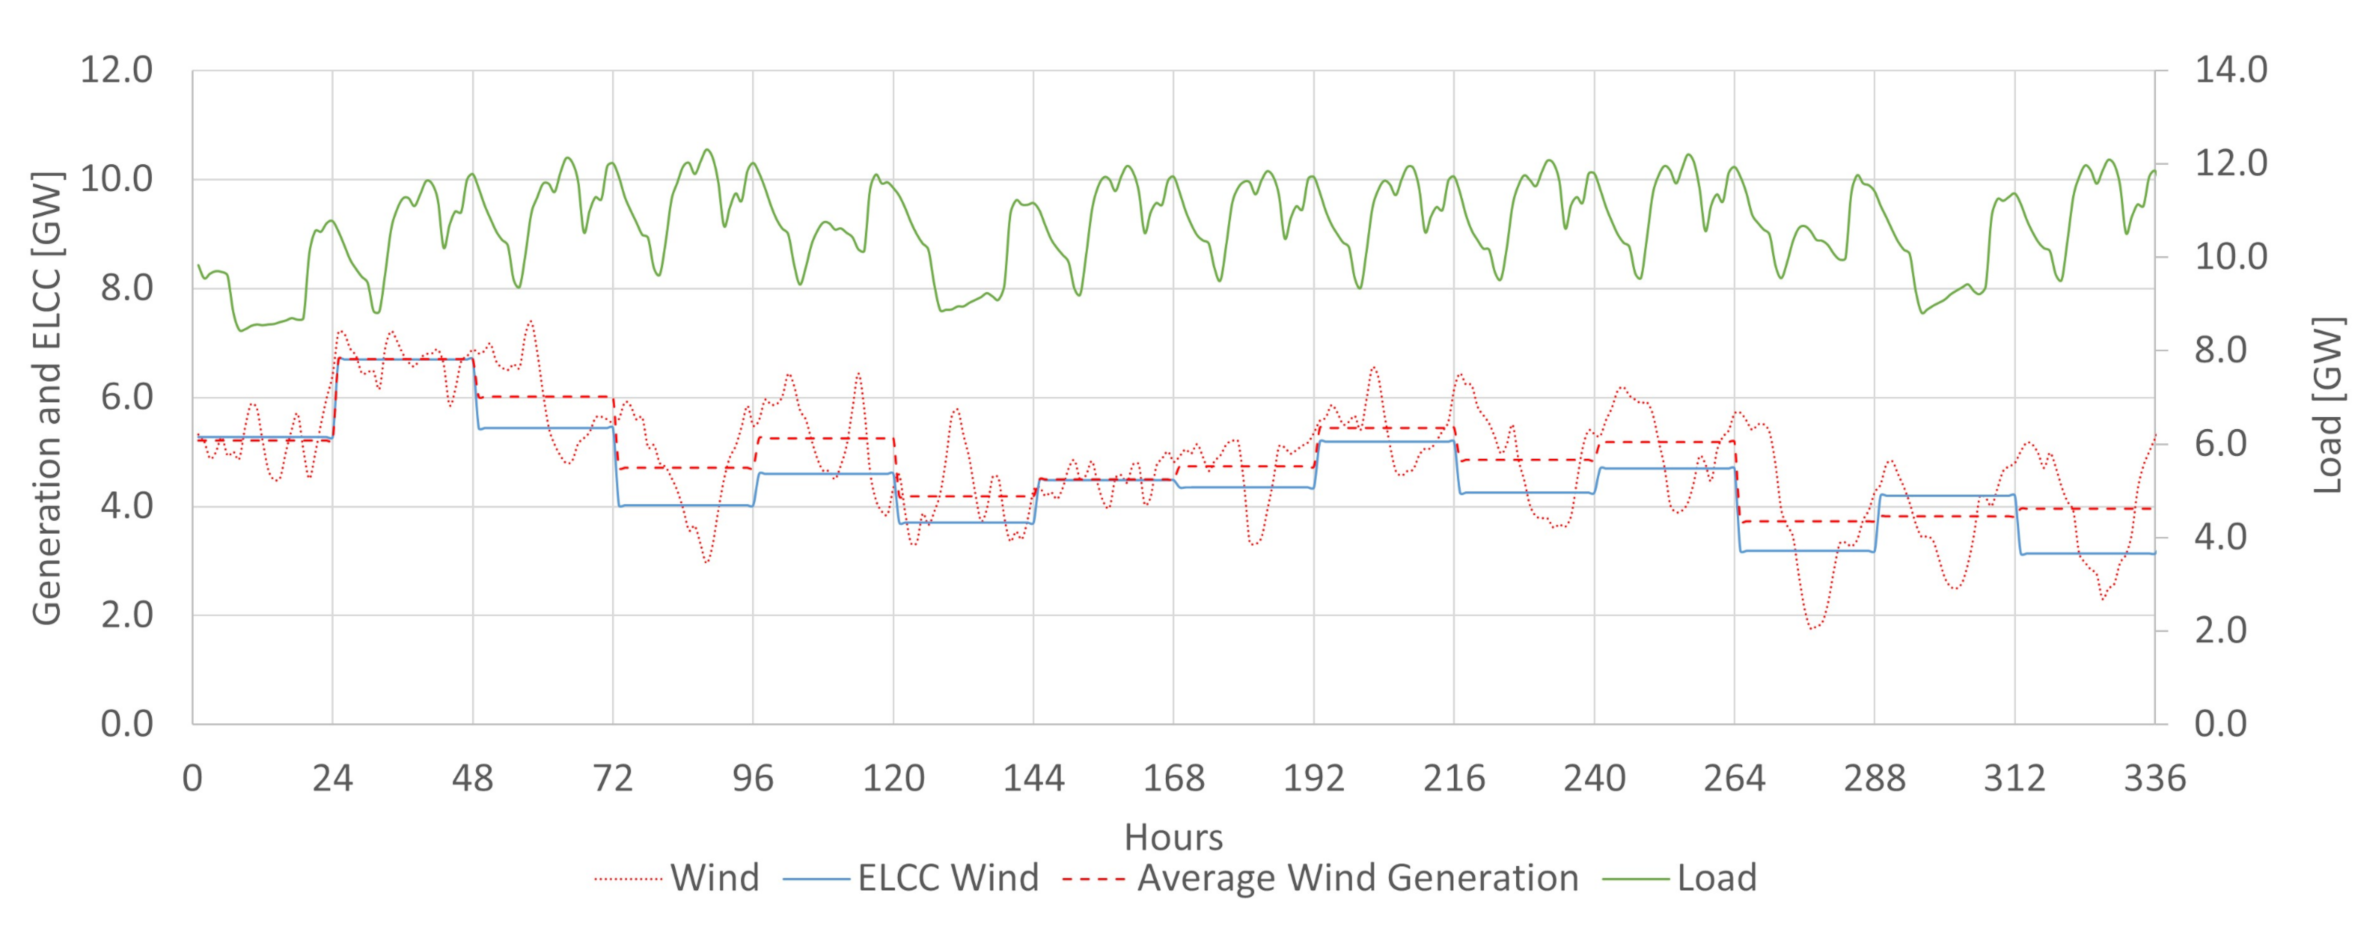
Figure 10 and Figure 11 allow looking into the hourly generation. From Figure 10, it can be seen that during high loads on weekdays (around 12 pm), the PV generation is considerably more significant than its daily average and significantly aligned with the peak load, increasing the ELCC above the average generation. In the wind generation case, the events where ELCC is greater than the average generation are less frequent. That is because, in wind generation, the hourly values are much closer to its daily average generation, indicating a lower variation within the same day, as shown in Figure 11. In the PV case, given that it only generates when there is the sun, the variation within the same day is much more significant, as shown in Figure 10.

3.2.2. Northeast Subsystem

Figure 12, Figure 13 and Figure 14 present the simulation results for wind generation in the Northeast subsystem from 2017 to 2019.
When analyzing the wind generation in the Northeast subsystem, the ELCC behavior is different. On the weekends, the daily ELCC value does not go to zero, and from May to August, it also does not go to zero, differently from the SIN simulation. The daily ELCC follows the generation much more closely than in the SIN simulation. That happens because, in the Northeast subsystem, relative participation of PV and wind capacity in the total generation is greater. As quoted before, the relative participation of wind capacity in all installed capacity of the Northeast subsystem is 38% [26]. Consequently, it has a higher ratio of wind to conventional generation. Having those characteristics, even though the load decreases in the weekends or the May-August period, the conventional generation cannot alone meet the demand reliably. Hence, the wind generation presents a daily ELCC always greater than zero and close to the generation level.
Figure 15, Figure 16 and Figure 17 show the PV generation’s simulation results in the Northeast subsystem for 2017 to 2019. As for PV in the SIN simulation, there are cases where the ELCC is greater than the average daily generation. The explanation is the same as the one given in the SIN simulation.
It should be expected that as for wind in the Northeast subsystem, the ELCC of PV should not fall close to zero during weekends as PV is relatively more important in this subsystem than in the SIN. However, this is not the case. A closer look in the behavior of the hourly generation of wind and PV in the Northeast subsystem, shown in Figure 18 and Figure 19, provides more explanatory elements.
Figure 18 shows that during weekends (hours 96 to 144 and 264 to 312), the demand is considerably lower than on weekdays, most notably during the late morning hours and the afternoon. That is the time where the PV Generation is generating and reaches its maximum. During the weekends’ early morning hours and the night hours, the demand increases, but there is no PV or low PV generation. The load and the PV generation’s behavior during the weekends results in a low daily ELCC, even though it is being analyzed only by the Northeast subsystem. In weekdays there is a good alignment between the peak PV generation and the peak day load which drives the ELCC up.
In Figure 19, for wind generation the effect observed in PV generation during weekdays does not happen because Wind generation varies around its daily average more closely than PV. Therefore, on weekends, there is an alignment between the early morning and night high demand and the wind generation, thus maintaining the ELCC high. However, it is essential to notice that even though it does not fall close to zero, the weekend’s wind ELCC is lower than on weekdays, given the decrease in the demand.

3.3. Capacity Credit

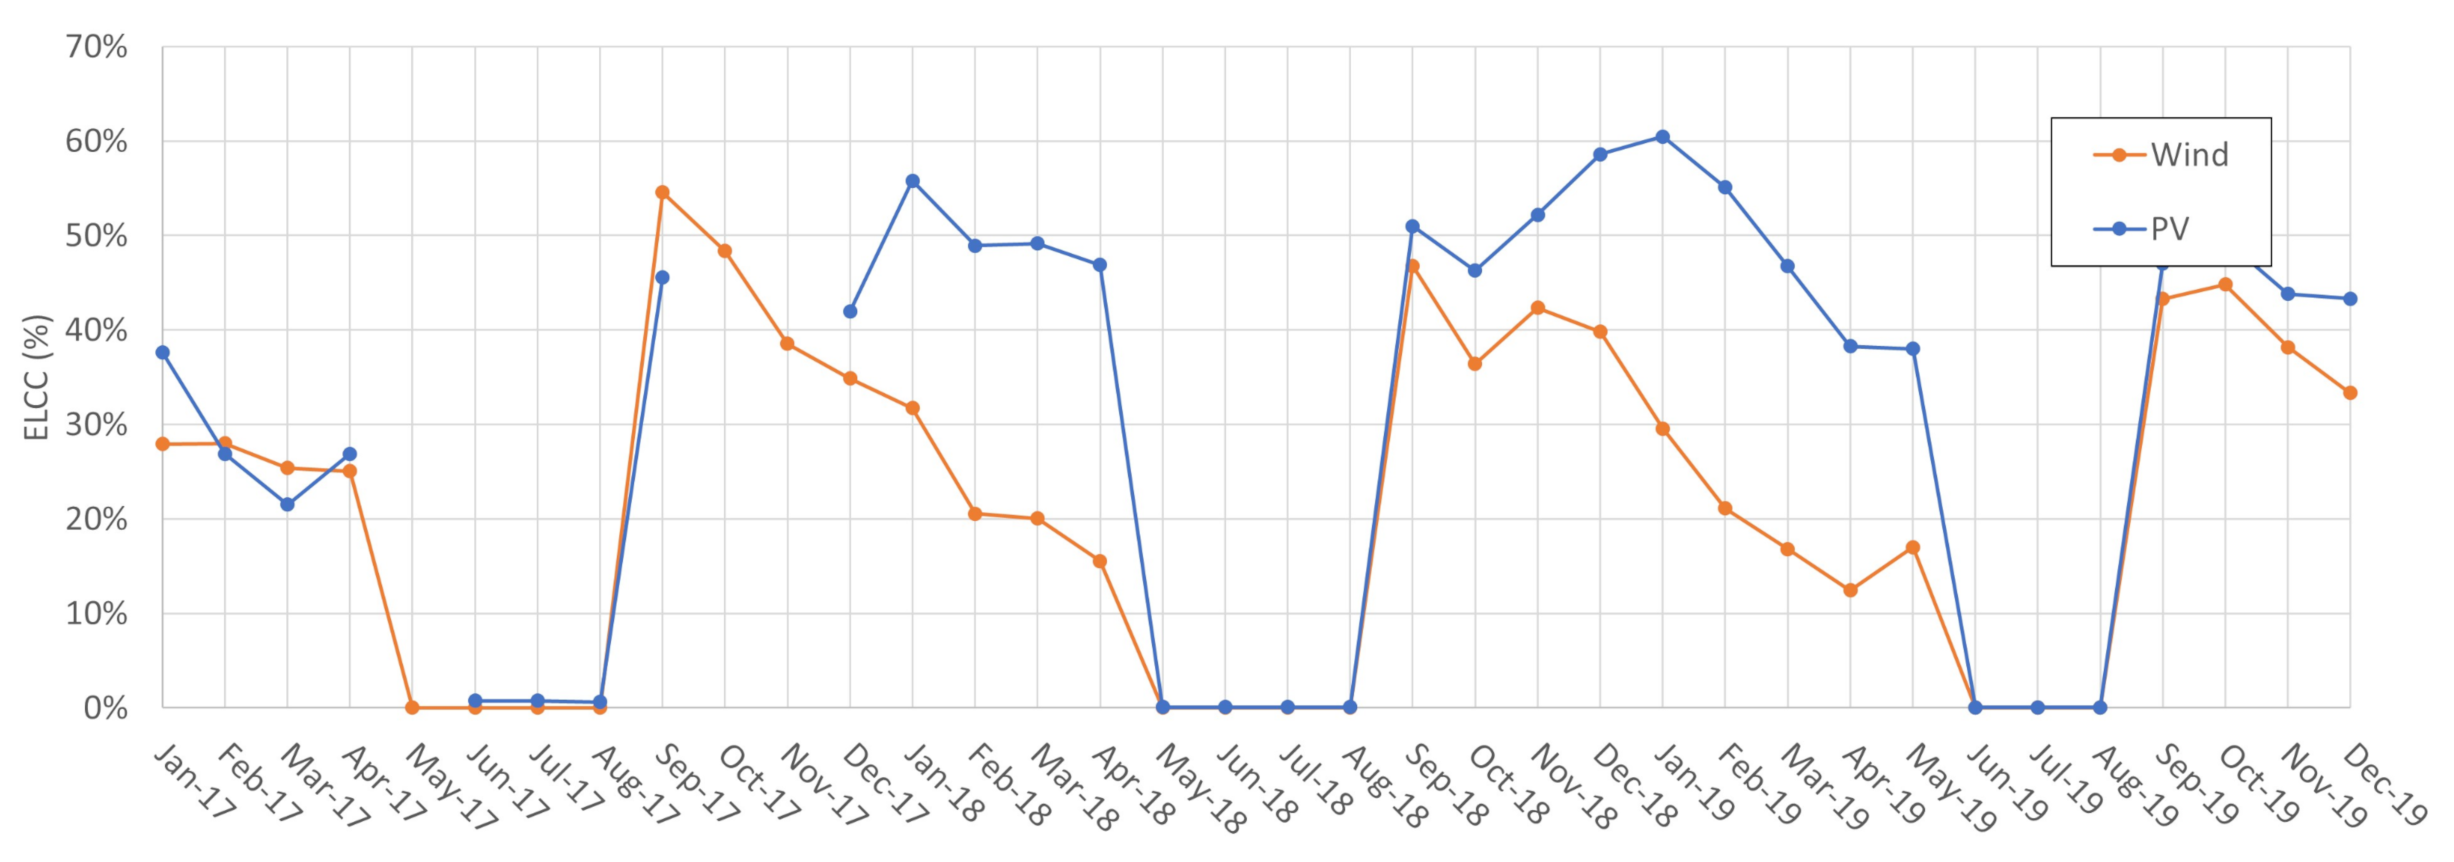
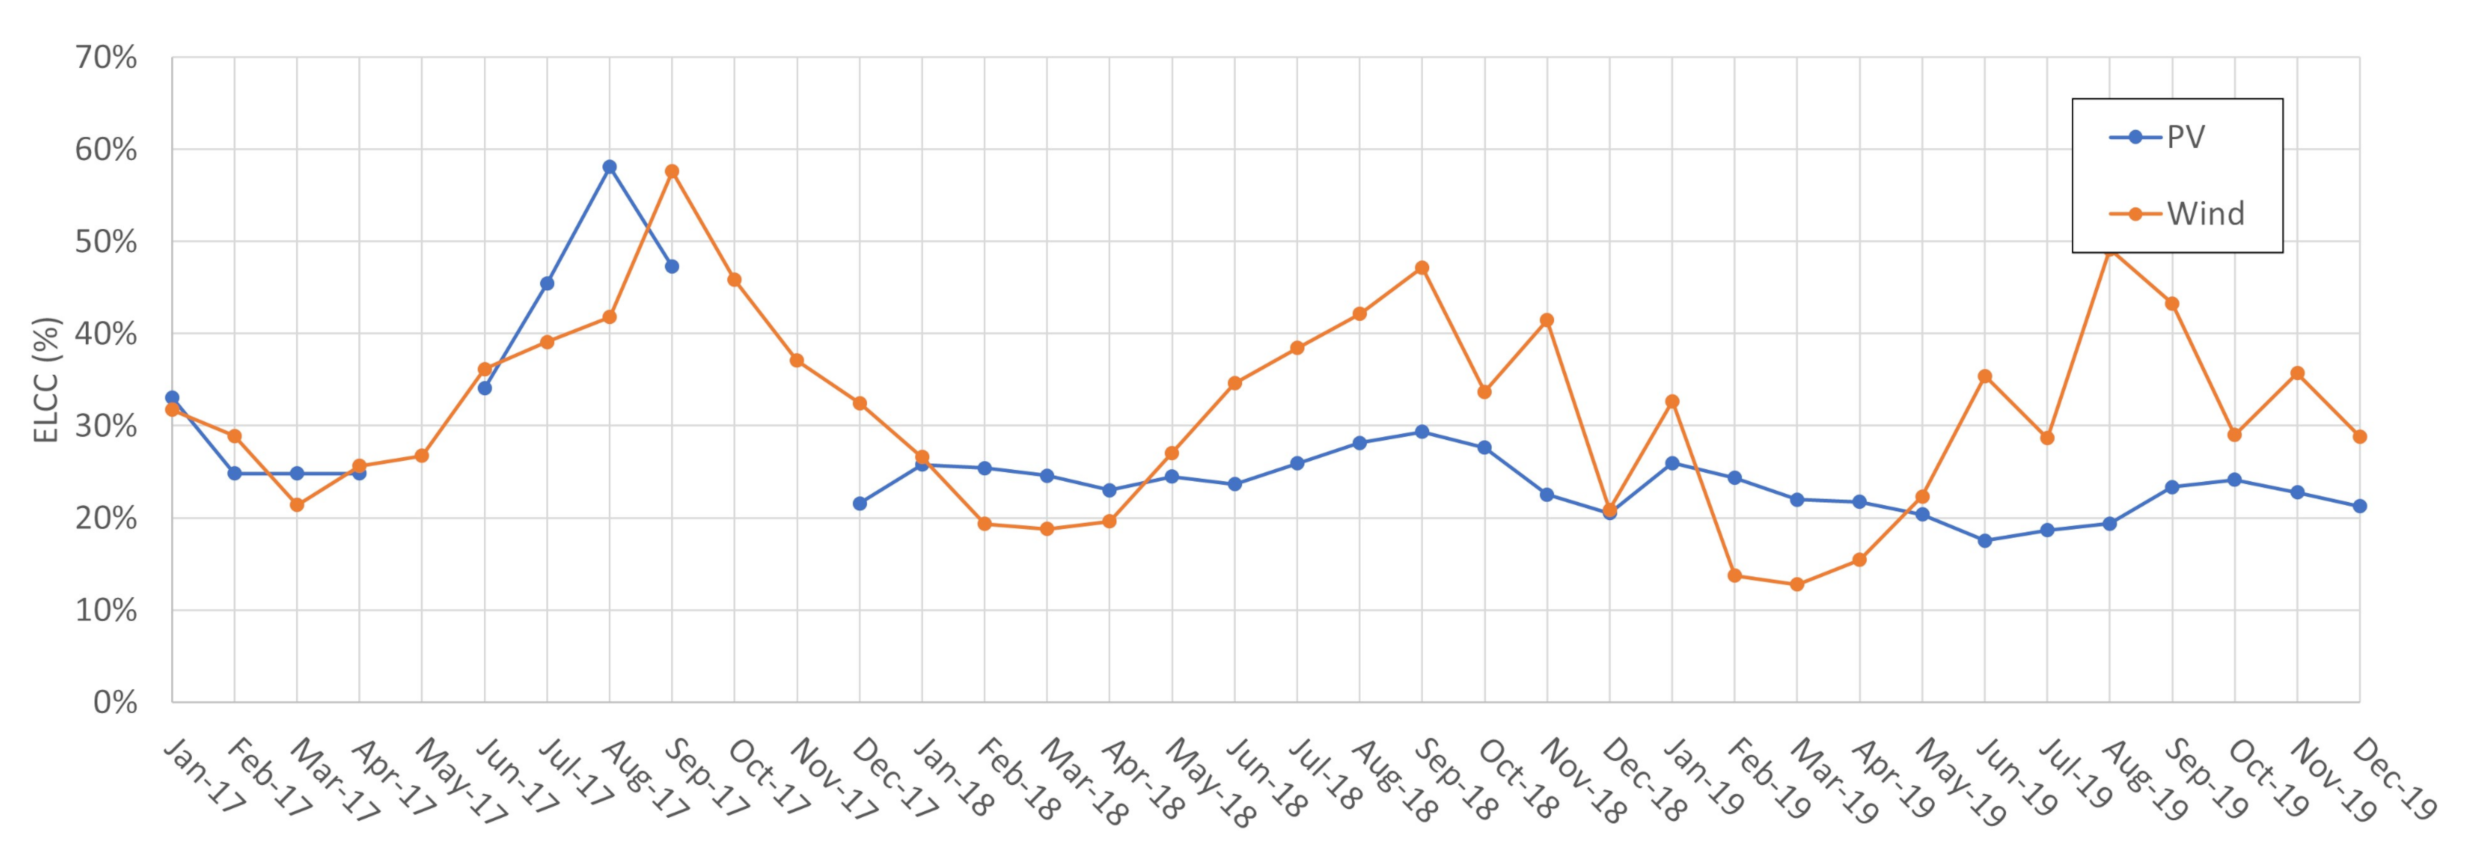
The ELCC can be expressed in terms of power, in kW, MW, or percentual values, dividing its value in power by the source’s installed capacity yielding the source’s capacity credit. Generally, in the literature, capacity credit and capacity value are used as synonyms both being possible to be expressed either in kW or in percentages (dividing the physical value of ELCC by the installed capacity). However, it would be more precise in terminology terms for each term to have a more precise meaning. In this way, it is established in this work that Capacity Credit refers to the ELCC depicted in percentages and capacity value to the ELCC depicted in physical terms. Capacity Credit has the advantage that capacity contribution is independent of the size of the inserted generator. Figure 20 and Figure 21 show wind and PV monthly capacity credit in the SIN and the Northeast subsystem for 2017 to 2019.
Large-scale installation of PV power in Brazil started in 2017 and its initial ELCC capacity credit values are around 30%. In the following years, PV capacity installation increases, and the monthly ELCC starts to show a pattern. In the SIN, the PV power presents a higher capacity credit for non-zero values, while for the Northeast subsystem, wind tends to provide more capacity credit throughout the year. Only in the beginning of the year (from January to May) PV provides more capacity credit given the decrease in wind generation in this period. In Figure 20 and Figure 21, the data for May, October and November of 2017 were excluded as they yielded unrealistic values of capacity credit. This may be explained by an underestimation of the PV’s installed capacity in the SIN and in the Northeast subsystem for these particular months. There seems to be an underestimation of PV installed capacity in those months as the official data shows that the actual generation is considerably higher than the installed capacity [26]. This is not observed for any other months.
In Figure 21, in the year of 2017, the PV capacity credit shows considerable variation, this is explained by the fact that in 2017 there was only a handful of PV plants operating, so the ELCC the whole PV source was highly dependent on these few plants being subjected to great variability, as no dumping effect provided by geographic dispersion was present at that time. As the number of plants increased, the PV capacity credit became more constant as seen in the following years to 2017. The solar resource is more homogeneously distributed throughout the year, so the PV’s capacity credit variation, for non-zero values, has a lower amplitude than wind capacity credit, as the wind resource varies significantly throughout the year. This is observed in the SIN and more notably in the Northeast Subsystem.

4. Discussion

The ELCC simulation indicates the VG’s contribution to resource adequacy. With increasing penetration of intermittent sources, it will be a vital parameter to subsidize energy planning and system operation. In the past, different energy sources were characterized basically by their rated capacity and their capacity factor. Those parameters were enough to infer generator power contribution. This situation has changed with a growing share of non-dispatchable sources. Comparing variable generation sources requires a greater level of detail. For example, a wind plant and a solar plant, both with the same rated capacity and capacity factor, can still contribute differently to resource adequacy if their generation profile differs at critical hours. This possibility is very relevant to orientate energy planning and power system operations in the current context. It is increasingly necessary to effectively measure the capacity contribution of different generation sources, notably the intermittent ones. It requires considering the inserted generation profiles of these sources and load profiles, and all conventional dispatchable generation features.
The ELCC method, among others, has provided an essential advancement in the task of adequately measuring the capacity contribution of intermittent generation. Without this accurate measurement, the economic value of the intermittent sources decreases because only their energy contributions are accounted for. Besides that, without determining capacity contribution from variable sources, it is impossible to determine the optimum level of investment necessary to assure resource adequacy. This situation can lead to excessive risks or over-investment in dispatchable power (often with non-renewable sources). Both paths are undesirable in economic and environmental terms.
Despite its advancements, the ELCC implementation has been limited so far to systems with constant dispatchable capacity. In practice, the premise of constant capacity makes it impossible to evaluate capacity value from variable sources in systems with high participation of hydropower since hydroelectric plants are dispatchable, but their capacity changes over time. In reality, the constant capacity premise captures only the characteristics of conventional power sources, such as thermoelectric plants. In practice, it makes the models used in the planning and operation of power systems unable to represent characteristics of energy-limited resources, including hydroelectric plants and any other flow-dependent resources, such as batteries and CSP. In practice, staying attached to models with no energy-limited variables means making a complete transition to renewable sources unfeasible.
In the Brazilian case, hydroelectric power plants are energy-limited resources essential for providing energy, power, and ancillary services. The integration of increasing levels of variable renewable generation in Brazil requires the detailed characterization of the conventional dispatchable sources to assess potential synergies between them and the intermittent renewables. As shown in Figure 2, the available potential capacity changes daily in Brazil due to the large share of hydropower. The system may be more vulnerable in periods where conventional power is less available. For the same demand, if less conventional power is available, 1MW of variable generation tends to add more ELCC to the system than in situations where conventional power abounds. It is a possibility captured by the ELCC, which considers whether extra power is being generated in times that increase the system’s reliability. For that reason, having the proper characterization of the conventional availability power is crucial in obtaining ELCC values close to the actual contribution towards the reserve margin of a particular variable generation source. This work achieved so by incorporating the hydropower plant availability capacity method obtained in [32] for each day to determine ELCC.
Figure 20 and Figure 21 give an insight as to how the ELCC results can be a tool to orientate energy planning. Figure 20 indicates that the PV capacity credit (ELCC measured in percentage values) is higher than wind capacity credit. This relevant result should be read carefully. First, it is important to notice that each source can provide three major contributions to the power system: energy, capacity and ancillary services. In the specific comparison made, in the current state of PV and wind deployment, the marginal expansion of PV provides more capacity contribution to the system than wind expansion. However, this is only one side of the issue, as the whole contribution to the system of a particular source must be assessed to determine the energy planning. In the Brazilian context it is also important to note that each renewable energy unit produced saves water in hydroelectric reservoirs, and this water will become power in the future. This situation implies that capacity credit and capacity factor of renewable sources should be both integrated in Brazilian energy planning.
There are two factors to explain the greater capacity contribution of PV during the assessed period in the SIN. First, it must be noticed that those sources have different penetration levels in the SIN. In December of 2017, Wind generation comprised 7.9% of the total installed capacity, while PV only 0.6% [26]. It is known that, for a given load level, renewables’ capacity contribution is higher with lower energy level penetration [7,33]. Therefore, the lower solar penetration tends to increase capacity credit from that source. The second factor is the shift in the peak hours that Brazil has experimented given the increasing relevance of air conditioning systems use. Presently the peak hours occur during the late morning until approximately 15 p.m. This parcel of the load tends to be highly aligned with the PV generation, which increases the ELCC of PV power in the SIN context.
It is also worth mentioning that there is no permanent advantage throughout the year from one source to the other. The geographic scope is extremely relevant when assessing that matter. Figure 21 shows that PV and wind have a complementary behavior in the Northeast subsystem context. In the beginning of the year, from January to April, the wind resource capacity credit is lower, and PV power has a greater capacity credit than wind. For the rest of the year, the situation inverts and wind tends to have a greater capacity credit than PV. Therefore, during the first months of the year PV adds more relative value to the system, in terms of ELCC, and throughout the rest of the year wind is more relevant. This behavior is explained by the fact that in this analysis, the Northeast subsystem was considered to be being fully isolated from the rest of Brazil. In that way, the available dispatchable generation in that subsystem is relatively lower than in average terms in the national context. This being so, the Northeast subsystem, as modeled in this study, is much more fragile to power shortages in a way that a greater number of renewable generation hours comes to aid the system in risky periods. That situation implies that the ELCC of the renewables ends up following closely their generation during the whole year and that is why in the beginning of the year the capacity credit of PV is greater than wind and this situation inverts when wind generation increases from May to December.
Although ELCC measurements certainly are important for planning and operations of power systems, it should be used as an auxiliary tool along with other indicators. Possibly, ELCC is even more important for power system operations than for planning. The current procedure for reserve allocation in Brazil adopted by ONS allocates the primary reserves as 1% of the generation responsibility of a particular control area; the secondary upward reserves comprise 4% of the load of the control area added to a fixed parcel to account for the wind variability [34]. For the secondary downward reserves, the values are 2.5% of the load summed with the wind variability parcel [34]. The wind variability parcel, in fact, increases the reserves demand in the control area. This approach may overestimate the reserve needs as it is not known if the wind variability parcel is an adequate number and even if it should be the same value throughout the year. By not considering the contribution that the intermittent generation may add to the reserves, system’s operators are likely to be obliged to allocate larger primary and secondary reserves in generation units that can increase its power and have the speed governor unlocked.
The increasing participation of variable generation in the energy mix requires a novel approach regarding the reserves allocation. The results of this study demonstrates that wind and PV power add capacity towards the reserve margin. This understanding should be included in the operation of the system using a probabilistic approach that considers the reserve provided by the variable generation and the conventional dispatchable sources applied to reach a certain desired reliability target within that operational window. In that way, the reserves allocated in the dispatchable sources will be employed in a complementary manner to the reserves provided by the variable generation. This analysis is not enough to plan the operation as ramping requirements must still be met, but it is part of a novel approach to consider the ELCC of variable generation in the operation.
In addition to the relevance for the planning and operation at the Transmission level, the variable sources’ capacity value measurement tends to be important also in the Distribution. Three central points should be mentioned in this regard. First, although energy is a relevant variable in Distribution planning and operation, the primary variable to orientate Distribution System Operators’ decisions investments is capacity as investment levels are essentially determined by the maximum expected power flows, i.e., power flows determine network costs. The second point is that the flexibility levels available in Distribution are usually lower than in Transmission, making it even more essential to correctly determine capacity limits. Third, the increasing PV competitiveness makes the adoption of variable sources as distributed generation an inescapable fact, making the measurement of capacity value from variable sources an imperative. Thus, although in this article the implications of determining the capacity value from variable sources for the development of distributed generation were not developed, the authors are aware of its relevance.
An important limitation of this research at the current stage is that a deterministic approach regarding the load curves, VG data and the operational data from the hydroelectric plants is adopted when determining the ELCC. To evaluate future capacity contribution, it is necessary to build multiple scenarios, possibly via Monte Carlo experiments, and use them to determine statistics such as expected capacity values. Obviously, such a procedure greatly increases the amount of information that needs to be processed. It is worth mentioning that short-term forecasts (hours, days) regarding the availability of resources tend to be more reliable than forecasts aiming at longer time horizons (years). This opens the possibility of using the contribution calculation of the intermittent sources to organize the short-term operations of the power system. This may allow, for example, increasing the efficiency in the use of transmission lines or of triggering strategies to increase the flexibility of the network in a given region, at a given time of the year. These possibilities reinforce the operational importance of calculating the capacity value.
In theory, to abandon the constant dispatchable capacity hypothesis is an alternative to any energy-limited capacity sources. This suggests that it is possible to apply the approach proposed in this article to other contexts. Therefore, it is rational to expect that the method here developed to study systems with large dispatchable capacity share from hydroelectric sources can be extended to batteries, CSP, and even demand control. In short, the method developed can be seen as an example of the possibility and convenience of overcoming the hypothesis of constant dispatchable capacity.

5. Conclusions

Aggregating the probabilistic reliability view synthesized in the ELCC results in the system’s operation, and planning is essential to exploit the VG’s full capabilities. However, so far, the methods for capacity value evaluation in systems where dispatchable sources have variable capacity were not available. The effort to develop such method is presented in this article. A capacity value determination method that incorporates the daily variability of capacity in hydropower plants was developed by merging the standard ELCC calculation to the detailed hydro modeling of the plants. As the results obtained show, the VG contributes to the system with energy and capacity. This capacity contribution is not static and depends on the employed time unit analyzed, the load and the VG profile, and the set of dispatchable sources. The ELCC enables a proper comparison among different VG sources by analyzing which of them adds more value to the system in terms of capacity and reliability, it may be a tool to guide the capacity reserves allocation, shifting from deterministic methods to probabilistic, which may enhance the allocation of the reserve. The results obtained in this study quantify the capacity contributions from wind and PV generation in Brazil and shows that capacity contribution is not negligible. Not taking it into account in the operation and planning processes may lead to underestimating the actual reserves available in the short term and how much should be planned for deployment in the long term. That may lead to excess costs in the current operation and in the system expansion planning. The ELCC parameter is not enough to address all issues regarding VG’s capacity contributions. For example, ramps evaluation is also crucial for safe operation. Nevertheless, incorporating capacity evaluation in systems with variable dispatchable sources certainly contributes to increase the ability to plan the system and operate within intermittent sources’ higher participation context.
As a route for future research it is observed that the method should be further developed to incorporate some level of detailing and incorporation of transmission restrictions within the SIN, to permit the modeling of ELCC in different geographic scopes. This would allow it without considering a subsystem or sub-region as isolated from the rest of the SIN as was done in this article for the Northeast subsystem. Additionally, the incorporation of different prospective scenarios for predictive analysis must be developed to allow the investigation of future scenarios (long- and short-term). Regarding the standard ELCC calculation, it can be modified and adapted to be applied to the flexibility modeling in the Distribution level. Those prospective elements to be researched may be powerful tools for system’s planners and operators.
Finally, the method demonstrates the convenience and possibility of overcoming constant dispatchable capacity hypothesis. Therefore, it opens a possibility for, in addition to hydroelectric plants, other energy-limited resources to be better represented in the models used in the planning and operation of power systems.
Author Contributions

Conceptualization, N.B.A.; methodology, N.B.A. and E.D.B.P.; software, N.B.A. and E.D.B.P.; validation, N.B.A. and E.D.B.P.; formal analysis, N.B.A. and E.D.B.P.; investigation, N.B.A. and E.D.B.P.; resources, N.B.A., E.D.B.P. and I.L.S.; data curation, N.B.A. and E.D.B.P.; writing—original draft preparation, N.B.A. and E.D.B.P.; writing—review and editing, N.B.A., E.D.B.P. and I.L.S.; visualization, N.B.A. and E.D.B.P.; supervision, I.L.S.; project administration, I.L.S.; funding acquisition, I.L.S. All authors have read and agreed to the published version of the manuscript.

Funding

This research was funded by Institute of Energy and Environment of University of São Paulo (IEE-USP), by Enel Distribuição São Paulo in partnership with the Brazilian Electricity Regulatory Agency (ANEEL) through the Priority Energy and Strategic R&D Program “Energy Efficiency and Minigeneration in Public University Institutions”, grant number 00390-1086/2018, as well by CESP—Companhia Energética de São Paulo, through the Priority Energy and Strategic R&D Program “Technical and Commercial Arrangements for the Insertion of Energy Storage Systems in the Brazilian Electricity Sector”, Grant number PD-0061-0054/2016 also in partnership with the Brazilian Electricity Regulatory Agency (ANEEL).

Data Availability Statement

Acknowledgments

The authors are grateful for discussions with Renato Zambon in which he kindly clarified doubts regarding the Brazilian hydroelectric park.

Conflicts of Interest

The authors declare no conflict of interest.

Abbreviations

The following abbreviations are used in this manuscript:
ANANational Water Regulatory Agency or Agência Nacional de Águas in Portuguese
SINInterconnected National System or Sistema Interligado Nacional in Portuguese
ONSNational System Operator or Operador Nacional do Sistema in Portuguese
VGVariable Generation
PVPhotovoltaic
FORForced Outage Rate
ELCCEffective Load Carrying Capability
SEBBrazilian Electric System or Sistema Elétrico Brasileiro in Portuguese
ECPEquivalent Conventional Power
EFCEquivalent Firm Capacity
LOLELoss of Load Expectation
LOLPLoss of Load Probability
CSPConcentrating Solar Power

Appendix A. Brazil Daily Availability Hydropower Calculation

A notable feature of the Brazilian electric power system is hydropower plants’ heavy participation in the Brazilian mix. In addition to the large participation in the electrical matrix (64.9%, according to [35]), hydroelectric plants, together with the integration of large regions via transmission lines, are the main flexibility resources of the SIN. Such flexibility resources have been important to allow the increasing insertion of variable sources, mainly wind resources, which made up 8.6% of the electricity consumed in Brazil in 2019 [35]. Hydropower, differently from a thermoelectric plant, varies its available capacity over time. This variability comes from changes in the reservoir conditions and must be accounted for to assess the true available electrical power. This allows, for example, to capture the impact of dry seasons and reservoir management strategies on dispatchable generation capacity. The amount of convertible energy is given by the hydraulic head. The head effectively convertible into electrical power is the net head [32]:
h = H h e a d w a t e r H t a i l w a t e r L o s s e s
H h e a d w a t e r e H t a i l w a t e r are respectively headwater level and tailwater level. In the SEB, these quantities are modeled with polynomials of grades up to 4 built based on hydroelectric plants’ data. The downstream polynomial is a fourth-degree polynomial function that correlates the downstream water flow with the tailwater level. This function is expressed as shown in Equation (A2) :
H t a i l w a t e r ( q d o w n s t r e a m ) = C 0 + C 1 . q d o w n s t r e a m 1 + C 2 . q d o w n s t r e a m 2 + C 3 . q d o w n s t r e a m 3 + C 4 . q d o w n s t r e a m 4
where H t a i l w a t e r is the tailwater level and q d o w n s t r e a m is the downstream water flow and the coefficients C n are specific for each plant.
Equation (A1) above also indicates a third term, which refers to hydraulic losses. It can be represented according to 3 different models [32]: (i) Constant losses; (ii) Fixed percentage of head; (iii) Losses modeled with as a function depending on operational parameters of the plant. As information obtained from the official ONS database is being used, hydraulic losses were modeled as constant or as a percentage of the head in this article [27].
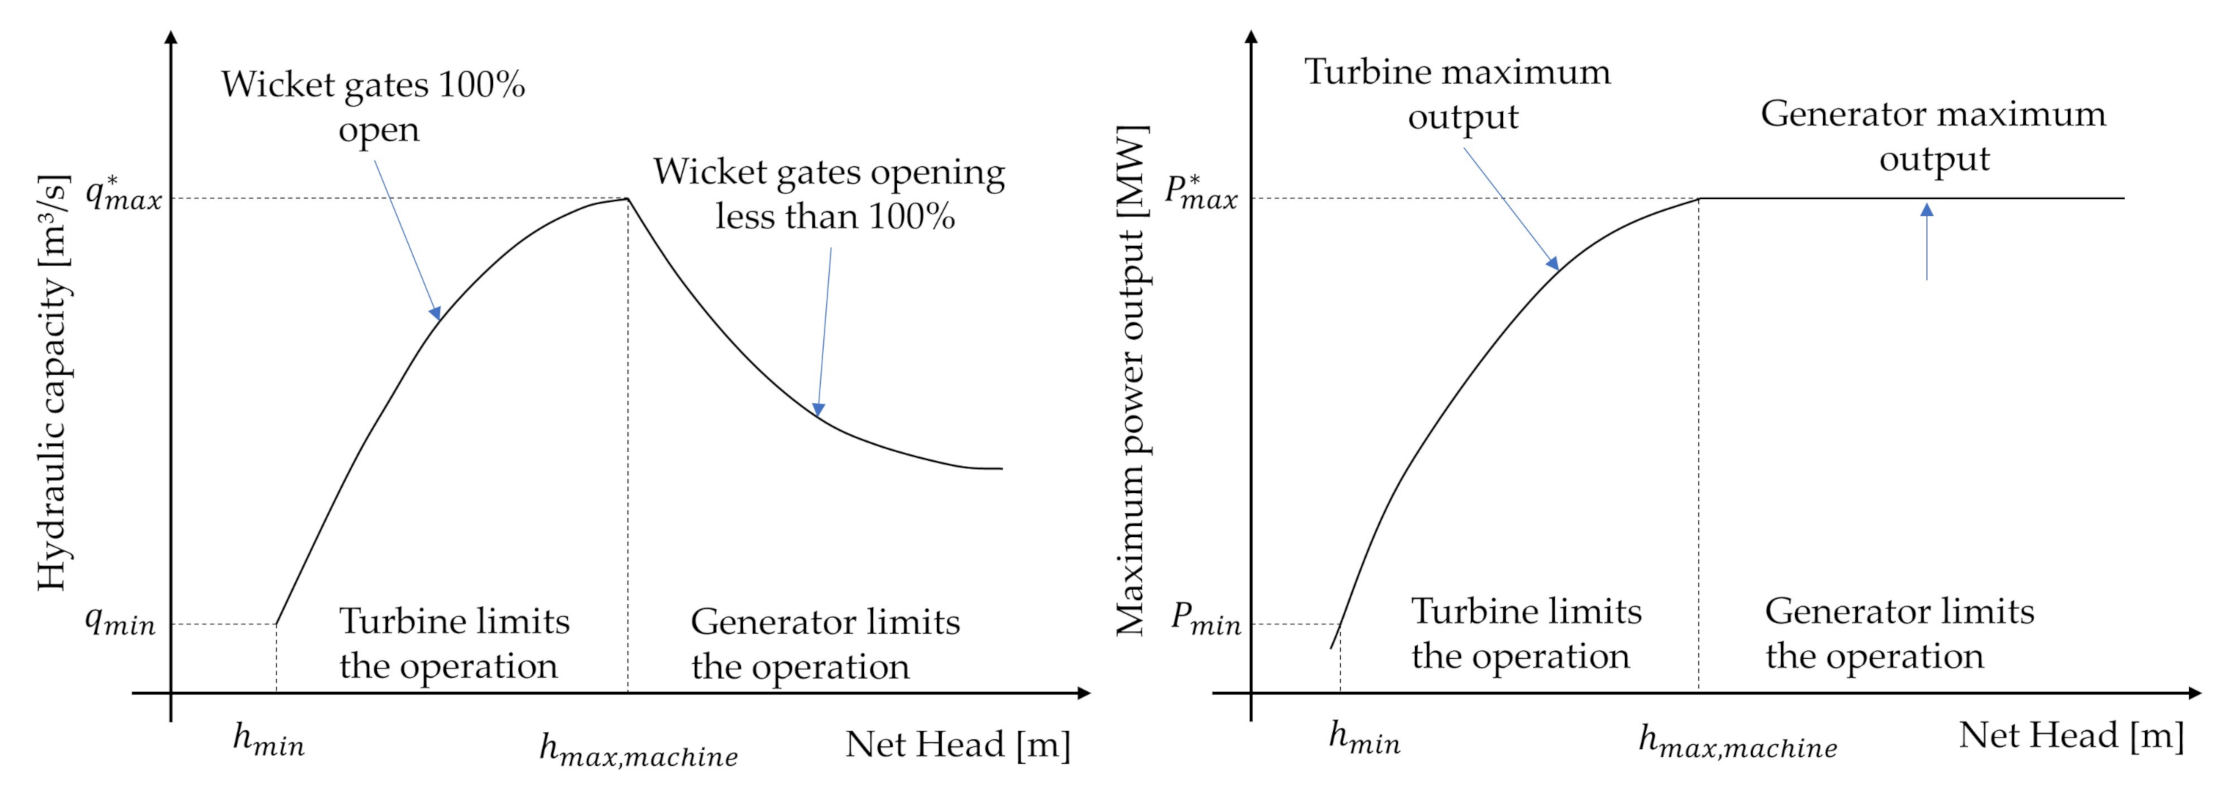
Besides the reservoir state, the power production from the hydroelectric plant also depends on the turbine-generator set. The available power in hydro plants may be limited by the turbine’s hydraulic capacity or the generator’s maximum power output, as detailed in Figure A1. When the net head is lower than h m a x , m a c h i n e , the wicket gates are fully open. In this case, the turbine limits the power output because it cannot supply enough power for the generator to reach its nameplate capacity [32]. If net head is greater than the design net head ( h m a x , m a c h i n e ), the wicket gates must have an opening less than 100 %; otherwise, the turbine would provide more power than the generator’s nameplate capacity [32]. In this condition, the generator limits the power output.
Figure A1. Hydraulic capacity and maximum power output of turbine-generator set as function of net head. Adapted from [32].
Energies 14 03196 g0a1
The head and the net head of a hydro plant vary as the river’s natural upstream flow varies. Furthermore, the amount of turbinated water changes according to the grid’s immediate necessity and the energy production schedule determined in the energy operation planning. Therefore, it is necessary to consider a time-dependant model of hydro power available capacity instead of assuming only the nameplate capacity of each plant. A model for determining the hydraulic capacity, which is the maximum water flow that is allowable through the plant’s turbines, and the maximum power output for a given net head (h) is provided by Equations (A3) and (A4) obtained in [32]:
q m a x , m a c h i n e = h h m a x , m a c h i n e α q m a x * if h < h m a x , m a c h i n e q m a x , m a c h i n e = h h m a x , m a c h i n e 1 q m a x * if h h m a x , m a c h i n e
where q m a x , m a c h i n e is the maximum discharge of a machine for a given net head condition, h is the actual net head, h m a x , m a c h i n e is the design net head and q m a x * is the design maximum discharge. α is 0.5 for Francis and Pelton turbines and 0.2 for Kaplan turbines [32].
P m a x , m a c h i n e = h h m a x , m a c h i n e β P m a x * if h < h m a x , m a c h i n e P m a x , m a c h i n e = h h m a x , m a c h i n e 1 P m a x * if h h m a x , m a c h i n e
where β is 1.5 for Francis and Pelton turbines and 1.2 for Kaplan turbines [32].
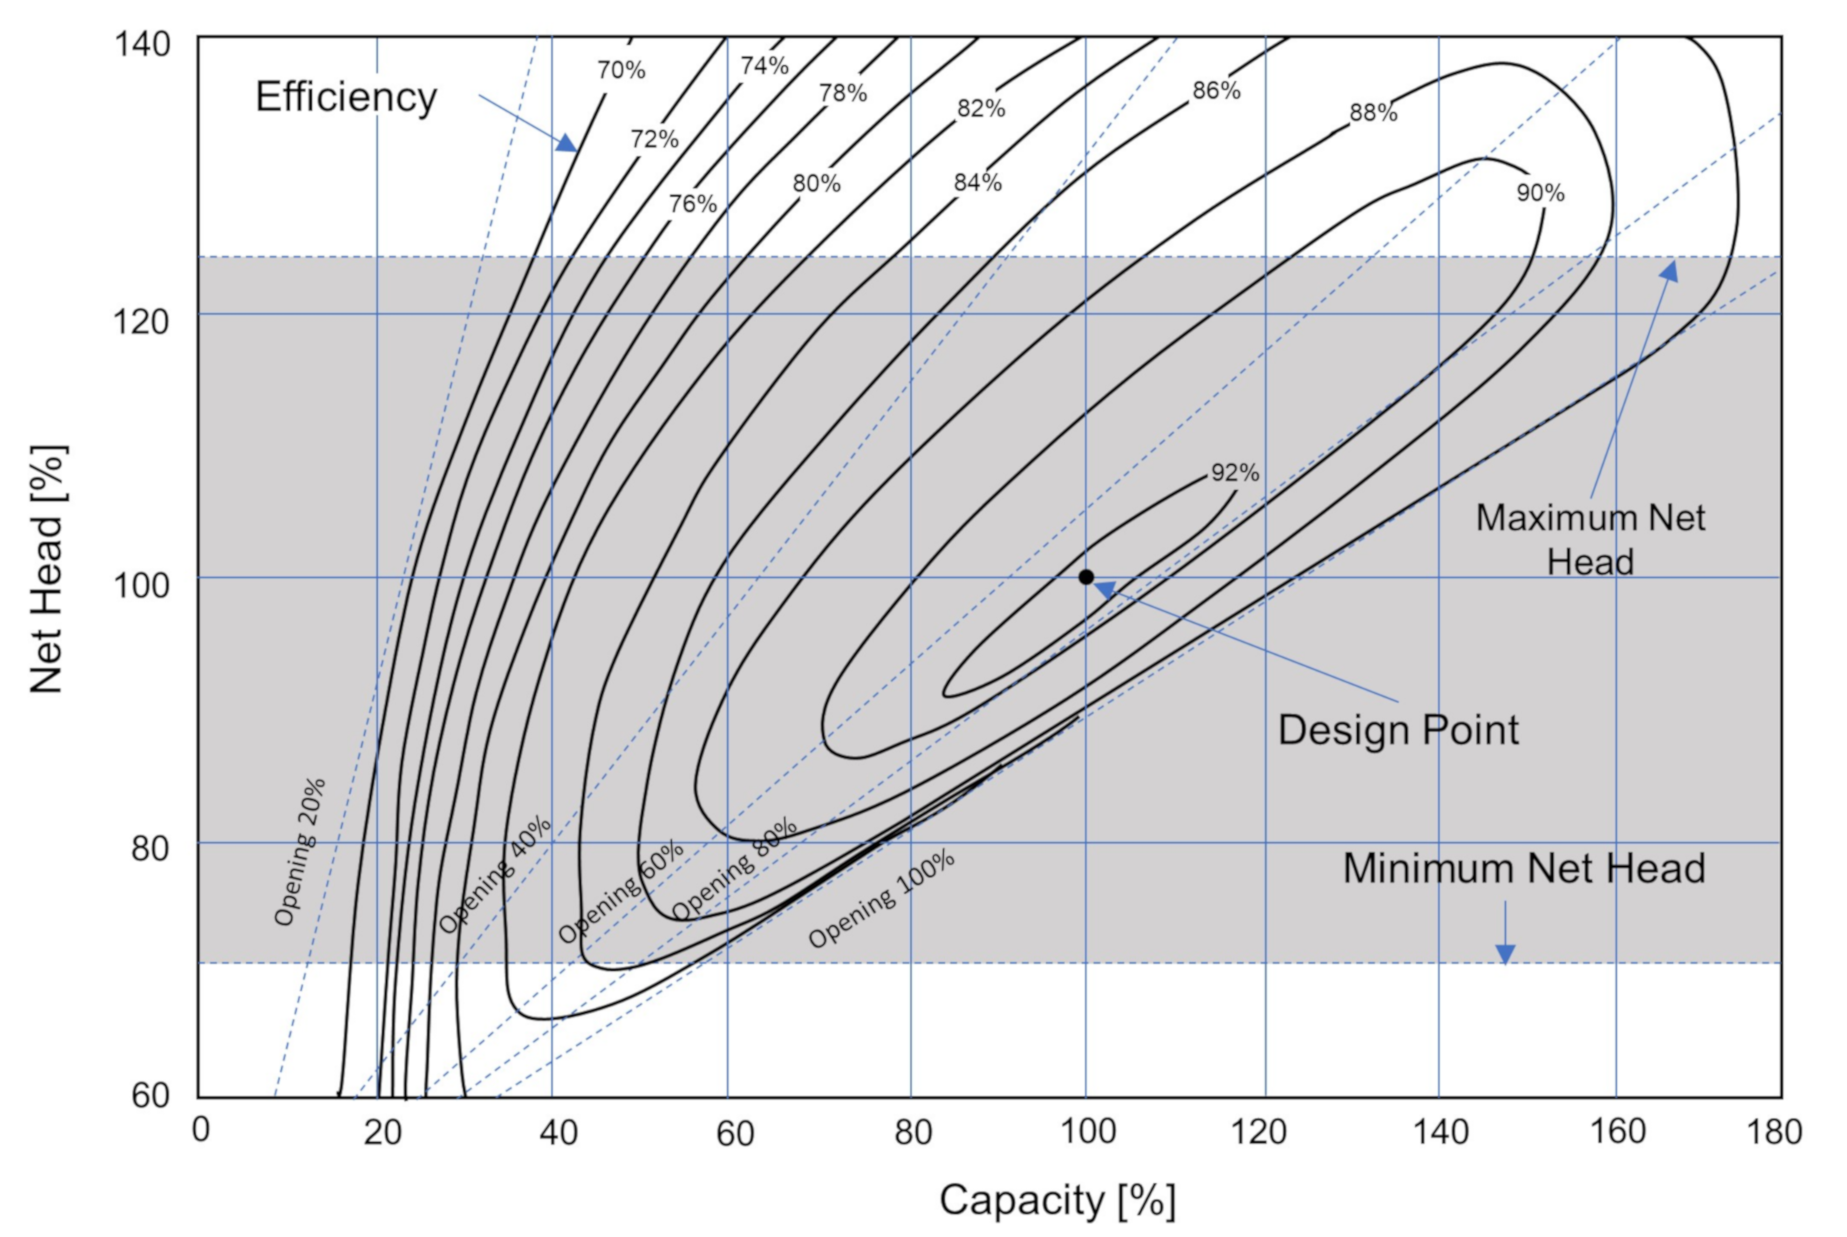
This model is a simplification of the reservoir-turbine-generator system, which for each net head and wicket gates opening pair presents a point at which the conversion of gravitational potential energy into electrical energy occurs, as shown in Figure A2.
It is worth noting that the point with maximum electrical power production is not, in general, the same as maximum efficiency. The plant operator can choose to operate more efficiently or produce more energy, but, generally, cannot have both simultaneously. This study is interested in maximum power output; for this objective, Equations (A3) and (A4) provide a sufficiently robust representation.
Figure A2. Performance curves of a Francis type hydraulic turbine. Adapted from [36].
Energies 14 03196 g0a2
Making Equations (A3) and (A4) functional requires an iterative process which was obtained in [32]. Without the iterative process, a dead end is inevitable: the hydraulic capacity depends on the net head, which depends on the tailwater level and the load losses [32]. However, the tailwater level depends on the actual flow turbinated, which in its turn depends on hydraulic capacity, which is precisely what Equations (A3) and (A4) are supposed to determine [32]. The procedures used to overcome this situation comes from [32]. It is detailed below:
  • By inspection of Equation (A1), it is noticeable that headwater and tailwater values are needed to calculate the head. Headwater values come directly from the National Water Regulatory Agency (ANA) database [29]. The tailwater values are calculated using downstream polynomials and streamflow data, both extracted from the National Water Regulatory Agency (ANA) database [29].
  • Equation (A1) also indicates that net head calculation requires determination of load losses values, which come from the ONS database as a constant value or a percentage of the head calculated in Step 1 [27].
  • Net head value makes it possible to calculate the turbine maximum water intake of one machine (the hydraulic capacity of a single machine) using Equation (A3). In sequence, the maximum water intake of a set of equal hydraulic turbines is determined by multiplying the number of units of that particular set and the maximum water intake of an individual machine, as shown in Equation (A5):
    q m a x , s e t j = n m a c h i n e , j . q m a x , m a c h i n e j
    where q m a x , s e t j is the maximum water intake for all turbines comprised in the set j.
  • The upper limit of the total water intake of the plant is the sum of the maximum water intake of all set of different machines in the plant as shown in Equation (A6):
    q m a x , p l a n t = j = 1 n s e t q m a x , s e t j
  • Assuming that there is no evaporation or infiltration, the net head corresponds only to convertible electrical power. This conversion requires inflows and outflows of water through the reservoir-turbine system. In this context, the mass balance of the reservoir-turbine system requires that:
    I n f l o w O u t f l o w E v a p o r a t i o n = Δ S t o r a g e
    O u t f l o w = S p i l l + T u r b i n e D i s c h a r g e
    Analyzing the mass balance, the outflow is equal to discharged water added to the spilled water. These relationships determine that as long as the hydraulic capacity is greater than the outflow, there is space for increasing the actual discharge flow ( T u r b i n e D i s c h a r g e ). On the other hand, if the hydraulic capacity is lower than the outflow, the turbines are already operating at the maximum discharge point. There is no space for increasing the turbined flow. In this condition, the plant will be spilling. These conditions make it possible to construct the following decision rule as shown in [32]:
    • If q m a x , p l a n t > O u t f l o w , then O u t f l o w = q m a x , p l a n t and q d i s c h a r g e d = q m a x , p l a n t
      Where q d i s c h a r g e d is the actual water flow discharged by the turbines.
    • If q m a x , p l a n t < O u t f l o w , then q d i s c h a r g e d = q m a x , p l a n t . In this case, S p i l l > 0 .
    After analyzing the decision rule, the value for O u t f l o w can be determined. With this value, a new net head is calculated using the downstream polynomial.
  • In step 5, the hydraulic capacity and the net head are recalculated. Step 6 assesses if the difference between net head value in iterations i + 1 and i is greater than an established convergence criterion. In each iteration, the net head is recalculated and compared to the former value. If Δ N e t H e a d = N e t H e a d i + 1 N e t H e a d i is lower than a specified limit, the process stops; otherwise, the process restarts in Step 5 until Δ N e t H e a d meets the desired criterion. In this study Δ N e t H e a d < 10 5 m is adopted as limit criterion.

References

  1. Carden, K.; Wintermantel, N.; Krasny, A. Capacity Value of Energy Storage in PJM; Technical report; Astrapé Consulting: Hoover, AL, USA, 2019; Available online: https://www.astrape.com/publications/ (accessed on 15 January 2021).
  2. Carden, K.; Wintermantel, N. Energy Storage Capacity Value on the CAISO System; Technical report; Astrapé Consulting: Hoover, AL, USA, 2019; Available online: https://www.astrape.com/publications/ (accessed on 23 February 2021).
  3. Li, Y.; Zhang, X.; Gao, W.; Ruan, Y. Capacity credit and market value analysis of photovoltaic integration considering grid flexibility requirements. Renew. Energy 2020, 159, 908–919. [Google Scholar] [CrossRef]
  4. Cai, J.; Xu, Q. Capacity credit evaluation of wind energy using a robust secant method incorporating improved importance sampling. Sustain. Energy Technol. Assess. 2021, 43, 1–12. [Google Scholar] [CrossRef]
  5. Schram, W.L.; Aghaie, H.; Lampropoulos, I.; van Sark, W.G. Insights on the capacity value of photovoltaics, community batteries and electric vehicles. Sustain. Energy Grids Netw. 2021, 26, 1–13. [Google Scholar]
  6. North American Reliability Corporation. Methods to Model and Calculate Capacity Contributions of Variable Generation for Resource Adequacy Planning; Technical report; North American Reliability Corporation (NERC): Princeton, NJ, USA, 2011. [Google Scholar]
  7. Madaeni, S.H.; Sioshansi, R.; Denholm, P. Comparison of Capacity Value Methods for Photovoltaics in the Western United States; Technical report; National Renewable Energy Lab. (NREL): Golden, CO, USA, 2012. [Google Scholar]
  8. Garver, L.L. Effective load carrying capability of generating units. IEEE Trans. Power Appar. Syst. 1966, 910–919. [Google Scholar] [CrossRef]
  9. Dragoon, K.; Dvortsov, V. Z-method for power system resource adequacy applications. IEEE Trans. Power Syst. 2006, 21, 982–988. [Google Scholar] [CrossRef]
  10. Milligan, M.; Parsons, B. A comparison and case study of capacity credit algorithms for wind power plants. Wind Eng. 1999, 23, 159–166. [Google Scholar]
  11. Amelin, M. Comparison of capacity credit calculation methods for conventional power plants and wind power. IEEE Trans. Power Syst. 2009, 24, 685–691. [Google Scholar] [CrossRef]
  12. Mohamad, F.; Teh, J.; Lai, C.M.; Chen, L.R. Development of energy storage systems for power network reliability: A review. Energies 2018, 11, 2278. [Google Scholar] [CrossRef] [Green Version]
  13. Jabir, H.J.; Teh, J.; Ishak, D.; Abunima, H. Impacts of demand-side management on electrical power systems: A review. Energies 2018, 11, 1050. [Google Scholar] [CrossRef] [Green Version]
  14. Rovense, F.; Reyes-Belmonte, M.; González-Aguilar, J.; Amelio, M.; Bova, S.; Romero, M. Flexible electricity dispatch for CSP plant using un-fired closed air Brayton cycle with particles based thermal energy storage system. Energy 2019, 173, 971–984. [Google Scholar] [CrossRef]
  15. Denholm, P.L.; Sun, Y.; Mai, T.T. An Introduction to Grid Services: Concepts, Technical Requirements, and Provision from Wind; Technical report; National Renewable Energy Lab. (NREL): Golden, CO, USA, 2019. [Google Scholar]
  16. Ela, E.; Hytowitz, R.; Helman, U. Ancillary Services in the United States: Technical Requirements Market Designs, and Price Trends; EPRI: Palo Alto, CA, USA, 2019; Available online: https://www.epri.com/research/products/000000003002015670 (accessed on 27 December 2020).
  17. Billington, R.; Allan, R.N. Reliability Evaluation of Power Systems, 2nd ed.; Springer Science & Business Media: New York, NY, USA, 1996. [Google Scholar]
  18. Agência Nacional de Energia Elétrica. Resolução Normativa Nº 614 de 3 de junho de 2014. 2014. Available online: http://www2.aneel.gov.br/cedoc/ren2014614.pdf (accessed on 18 May 2020).
  19. Allan, R.N.; Billinton, R.; Abdel-Gawad, N. The IEEE reliability test system-extensions to and evaluation of the generating system. IEEE Trans. Power Syst. 1986, 1, 1–7. [Google Scholar] [CrossRef]
  20. Gramlich, R.; Goggin, M. Too Much of the Wrong Thing: The Need for Capacity Market Replacement or Reform; Technical report; Grid Strategies LLC: Washington, DC, USA, 2019. [Google Scholar]
  21. Ricosti, J.F.C.; Sauer, I.L. An assessment of wind power prospects in the Brazilian hydrothermal system. Renew. Sustain. Energy Rev. 2013, 19, 742–753. [Google Scholar] [CrossRef]
  22. Schmidt, J.; Cancella, R.; Junior, A.O.P. The effect of windpower on long-term variability of combined hydro-wind resources: The case of Brazil. Renew. Sustain. Energy Rev. 2016, 55, 131–141. [Google Scholar] [CrossRef]
  23. Silva, A.R.; Pimenta, F.M.; Assireu, A.T.; Spyrides, M.H.C. Complementarity of Brazil’s hydro and offshore wind power. Renew. Sustain. Energy Rev. 2016, 56, 413–427. [Google Scholar] [CrossRef]
  24. Yan, J.; Qu, T.; Han, S.; Liu, Y.; Lei, X.; Wang, H. Reviews on characteristic of renewables: Evaluating the variability and complementarity. Int. Trans. Electr. Energy Syst. 2020, 30, 1–21. [Google Scholar] [CrossRef]
  25. Byers, C.; Botterud, A. Additional capacity value from synergy of variable renewable energy and energy storage. IEEE Trans. Sustain. Energy 2019, 11, 1106–1109. [Google Scholar] [CrossRef]
  26. Operador Nacional do Sistema. Histórico da Operação. Available online: http://www.ons.org.br/paginas/resultados-da-operacao/historico-da-operacao (accessed on 10 April 2020).
  27. Câmara de Comercialização de Energia Elétrica. Deck de Preços. Available online: https://www.ccee.org.br/portal/faces/pages_publico/o-que-fazemos/como_ccee_atua/precos/deck_de_precos?_afrLoop=569181767613633&_adf.ctrl-state=xqza9jv3t_1#!%40%40%3F_afrLoop%3D569181767613633%26_adf.ctrl-state%3Dxqza9jv3t_5 (accessed on 10 May 2020).
  28. Operador Nacional do Sistema. Avaliação de Desepenho do SIN. Available online: https://sintegre.ons.org.br/sites/2/21/Paginas/produtos-dinamicos/Taxas-TEIFa-e-TEIP.aspx (accessed on 25 June 2020).
  29. Agência Nacional de Águas. Dados de operação dos Reservatórios SIN. Available online: https://www.ana.gov.br/sar0/MedicaoSin (accessed on 10 January 2020).
  30. Empresa de Pesquisa Energética. Anuário Estatístico de Energia Elétrica 2020: Ano base 2019. 2020. Available online: https://www.epe.gov.br/sites-pt/publicacoes-dados-abertos/publicacoes/PublicacoesArquivos/publicacao-160/topico-168/Anu%C3%A1rio%20Estat%C3%ADstico%20de%20Energia%20El%C3%A9trica%202020.pdf (accessed on 13 April 2021).
  31. Ibanez, E.; Milligan, M. Impact of transmission on resource adequacy in systems with wind and solar power. In Proceedings of the 2012 IEEE Power and Energy Society General Meeting, San Diego, CA, USA, 22–26 July 2012; pp. 1–5. [Google Scholar]
  32. Silva Filho, D.D. Dimensionamento de Usinas Hidroelétricas através de técnicas de Otimização Evolutiva. Ph.D. Thesis, Universidade de São Paulo, São Paulo, Brazil, 2003. [Google Scholar]
  33. Sigrin, B.; Sullivan, P.; Ibanez, E.; Margolis, R. Representation of the solar capacity value in the ReEDS capacity expansion model. In Proceedings of the 2014 IEEE 40th Photovoltaic Specialist Conference (PVSC), Denver, CO, USA, 8–13 June 2014; pp. 1480–1485. [Google Scholar]
  34. Operador Nacional do Sistema. Submódulo 2.3: Premissas, Critérios e Metodologia Para Estudos Elétricos; Procedimentos de Rede: 2020. Available online: http://apps08.ons.org.br/ONS.Sintegre.Proxy/ecmprsite/ecmfragmentsdocuments/Subm%C3%B3dulo%202.3-CR_2020.12.pdf (accessed on 13 April 2021).
  35. Empresa de Pesquisa Energética. Balanço Energético Nacional: Ano Base 2019. 2020. Available online: https://www.epe.gov.br/sites-pt/publicacoes-dados-abertos/publicacoes/PublicacoesArquivos/publicacao-479/topico-528/BEN2020_sp.pdf (accessed on 27 April 2021).
  36. Fortunato, L.A.M.; Neto, T.A.; Albuquerque, J.; Pereira, M. Introdução ao Planejamento da Expansão E operação de Sistemas de Produção de Energia Elétrica; EDUFF: Niterói, Brasil, 1990. [Google Scholar]
Figure 1. A general flowchart of the employed method to determine ELCC in systems with variable dispatchable capacity.
Energies 14 03196 g001
Figure 2. Graph representation of COPT for 2019 for the first day of the selected months.
Energies 14 03196 g002
Figure 3. Graph representation of accumulated probabilities of COPT for 2019 for the first day of the selected months.
Energies 14 03196 g003
Figure 4. Daily, monthly and yearly ELCC for wind power in 2017 for the SIN.
Energies 14 03196 g004
Figure 5. Daily, monthly and yearly ELCC for wind power in 2018 for the SIN.
Energies 14 03196 g005
Figure 6. Daily, monthly and yearly ELCC for wind power in 2019 for the SIN.
Energies 14 03196 g006
Figure 7. Daily, monthly and yearly ELCC for PV power in 2017 for the SIN.
Energies 14 03196 g007
Figure 8. Daily, monthly and yearly ELCC for PV power in 2018 for the SIN.
Energies 14 03196 g008
Figure 9. Daily, monthly and yearly ELCC for PV power in 2019 for the SIN.
Energies 14 03196 g009
Figure 10. Load, PV generation and ELCC in an hourly basis for the first two weeks of 2019.
Energies 14 03196 g010
Figure 11. Load, wind generation and ELCC in an hourly basis for the first two weeks of 2019.
Energies 14 03196 g011
Figure 12. Daily, monthly and yearly ELCC for wind power in 2017 for the Northeast subsystem.
Energies 14 03196 g012
Figure 13. Daily, monthly and yearly ELCC for wind power in 2018 for the Northeast subsystem.
Energies 14 03196 g013
Figure 14. Daily, monthly and yearly ELCC for wind power in 2019 for the Northeast subsystem.
Energies 14 03196 g014
Figure 15. Daily, monthly and yearly ELCC for PV power in 2017 for the Northeast subsystem.
Energies 14 03196 g015
Figure 16. Daily, monthly and yearly ELCC for PV power in 2018 for the Northeast subsystem.
Energies 14 03196 g016
Figure 17. Daily, monthly and yearly ELCC for PV power in 2019 for the Northeast subsystem.
Energies 14 03196 g017
Figure 18. Load, PV generation, ELCC in an hourly basis for the first two weeks of 2019 for the Northeast subsystem.
Energies 14 03196 g018
Figure 19. Load, wind generation, ELCC in an hourly basis for the first two weeks of 2019 for the Northeast subsystem.
Energies 14 03196 g019
Figure 20. Monthly ELCC in percentages for the SIN calculated based on the monthly installed capacity data.
Energies 14 03196 g020
Figure 21. Monthly ELCC in percentages for the Northeast subsystem calculated based on the monthly installed capacity data.
Energies 14 03196 g021
Table 1. Generic Capacity Outage Probability Table (COPT).
Capacity LevelProbabilityAcum. Prob
C 1 P 1 1 1 P n
C 2 P 2 1 2 P n
C 3 P 3 1 3 P n
C n P n 1 n P n
C N P N 1 N P n
Publisher’s Note: MDPI stays neutral with regard to jurisdictional claims in published maps and institutional affiliations.