1. Introduction
Underground exploitation of useful minerals poses a number of problems related to the necessity to fill various types of voids. Some of them, such as the backfilling of goafs, due to their common use in underground mines, can be classified as basic issues in the field of mining technology [
1]. Feng et al. [
2] stated that solid backfilling mining is a green mining technology. Other cases of the necessity to use a backfilling result from the occurrence of failures related to the existing natural hazards, in particular rock bursts, or from special conditions and technology of exploitation, e.g., the need to maintain and strengthen the roadways. Zhang et al. [
3] proved that backfilling reduces the risk of roof-caving face bursts. Wang et al. [
4] pointed out the correct cooperation between geogrid and backfill surfaces even for saturated sand in the case of dynamic loading. Mining backfills are also used to eliminate shallow voids that pose a threat to surface structures. Fly ashes and cement materials are added to the filling mixture in order to improve strength parameters and to counteract surface subsidence [
5]. On the other hand, Wang et al. [
6] stated that the use of hydraulic backfilling is associated with high costs. The variety of special applications of backfillings makes it necessary to use different types and technologies. Lingga et al. [
7] discovered shear strength envelopes for cemented rockfills, which play an important role in blasthole stopping and cut and fill mining methods. Sivakugan et al. [
8] highlighted cemented and uncemented backfilling strategies in underground mining methods. Li et al. [
9] proposed filling the post-excavation space with waste rocks in the longwall panel. Nujaim et al. [
10] studied interaction of barricade and the backfill in relation to the mining excavation. Zhou et al. [
11] suggested adding glass fibers to the cemented paste backfill in order to improve its properties. Hefni et al. [
12] revealed that the new solution in the form of foam mine backfilling may be used in mines. Chen et al. [
13] distinguished materials for hydraulic backfilling into river sand, hill sand, gravel, and gangue and stated that river sand is the best option in order to reduce subsidence. In turn, Huang et al. [
14] divided solid backfilling mining materials into gangue, fly ash, aeolian sand, loess, and mineral waste residue. In some cases, technology is used to eliminate the post-mining space in the case of a highly gaseous rock mass [
15]; in others, it is required to adapt, for example, pneumatic backfilling of shallow voids, or a completely separate technology is developed, for example, to minimize the impact of underground mining on the built-up area of the site [
16]. Huang et al. [
17] stated that backfilling material selection plays a special role in shallow depth. Filling the post-exploitation voids is primarily aimed at equalizing the stress distribution in the whole bed loaded by roof rocks. The use of a backfilling strengthens the inter-room pillars. Mo et al. [
18] strongly indicated correlation between cohesive and non-covesive backfilling in reference to coal pillar strength. Skrzypkowski [
19], by means of numerical modelling, proved that sand backfilling contributes to the increase of the stability of excavations in the room and pillar methods. Backfilling is often used to extract thick deposits. Deng et al. [
20] applied cemented backfilling during coal seam deposit with a thickness 21 m, which was divided into six slices. Wu [
21] stated that for medium-thick ore body, losses and dilution can be reduced by backfilling, especially for sublevel open stopping methods. Furthermore, cemented paste backfilling with aeolian sand in particular is used to recovery of the residual coal pillar [
22]. Wang et al. [
23] projected backfilling strip-mining technique under thick unconsolidated layers. Lu et al. [
24] presented backfilling mining mode for strip in two stages of exploitation and liquidation. Under certain geological and mining conditions, mining methods with backfilling allow for obtaining greater output without leaving operational losses in comparison with strip methods [
25]. Zhao et al. [
26] stated that backfilling is particularly important in the case of strongly inclined deposits. The role of backfilling is to improve the stability of the roof conditions. Gonet et al. [
27] pointed out that the backfilling process is sometimes carried out in a mixed manner, alone and with the addition of a cement binder. Raffaldi et al. [
28] marked that in the underhand cut and fill mining method, the role of backfilling plays a significant role in maintaining the stability of excavations. Dzimunya et al. [
29] presented several backfilling technologies to optimize pillar recovery.
Hydraulic backfilling is one of the technologies of filling post-exploitation voids, consisting in the transport of solids (backfilling material) by means of a stream of water in pipelines to the backfilled space [
30]. Sivakugan [
31] stated that hydraulic backfilling is characterized by good drainage characteristics. A mixture of backfilling materials with water is called a backfill mixture. After the mixture flows into the filling space, the materials sediment and the water flows into the drainage and treatment system. The backfill process continues until the material to be filled is completely filled. During the backfill process, a failure may occur due to clogging of the pipeline. Reasons for a backfilling failure can include non-mixed items entering the backfilling, excessive mixture density, pipeline rupture or gasket failure, insufficient flushing of the pipeline prior to the backfilling process or its late completion, damage to the pipeline by a rock fall, and the formation of air bags. The above-mentioned causes significantly contribute to the increase of the backfilling time; therefore, the formation of blockage is observed by the rapid growth of the mixture in the filling funnel. For the risk of blockage to be eliminated, the backfilling material must meet the requirements of standards and regulations. According to the Polish standard [
32], there are three classes of backfilling material (
Table 1), for which permissible values are defined. Non-combustible and non-toxic material can be used as filling materials: sand, gravel, slag, waste rock, industrial waste, and mixtures of various backfilling materials.
The literature review showed a very small number of studies on the time of backfilling underground excavations. Regardless of the type of backfilling, the tests always concern determination of geotechnical parameters in laboratory conditions, numerical modelling, or industrial research on the behavior of excavations filled with backfilling material. In underground mining, computer-aided design programs are increasingly being used, which are equipped with modules for deposit modeling, mining methods, and scheduling. However, there is still some space to be developed related to the timing of backfilling. Therefore, the article presents for the first time a research model combining analytical calculations and laboratory tests with computer-aided design using the MineScape software. For the prospective zinc and lead ore deposit, this study modeled the deposition of rock mass layers. The thickness of the ore-bearing layer was determined with special distinction, for which mining blocks from 15 to 65 m long and from 15 to 55 m high were designed. Due to the shallow deposition of the ore deposit, about 71÷135 m below the ground surface, a series of laboratory tests was carried out with filling mixture, the purpose of which was to determine the material class. For the first time, sand with a grain size of 0.5 mm was used in the tests, which was also included in the analytical calculations. The use of the MineScape program made it possible to determine the places of arrangement of preparatory and operational excavations, for which the times of backfilling of strip excavations both in one-way and bidirectionally were calculated.
2. BackfillCAD Model
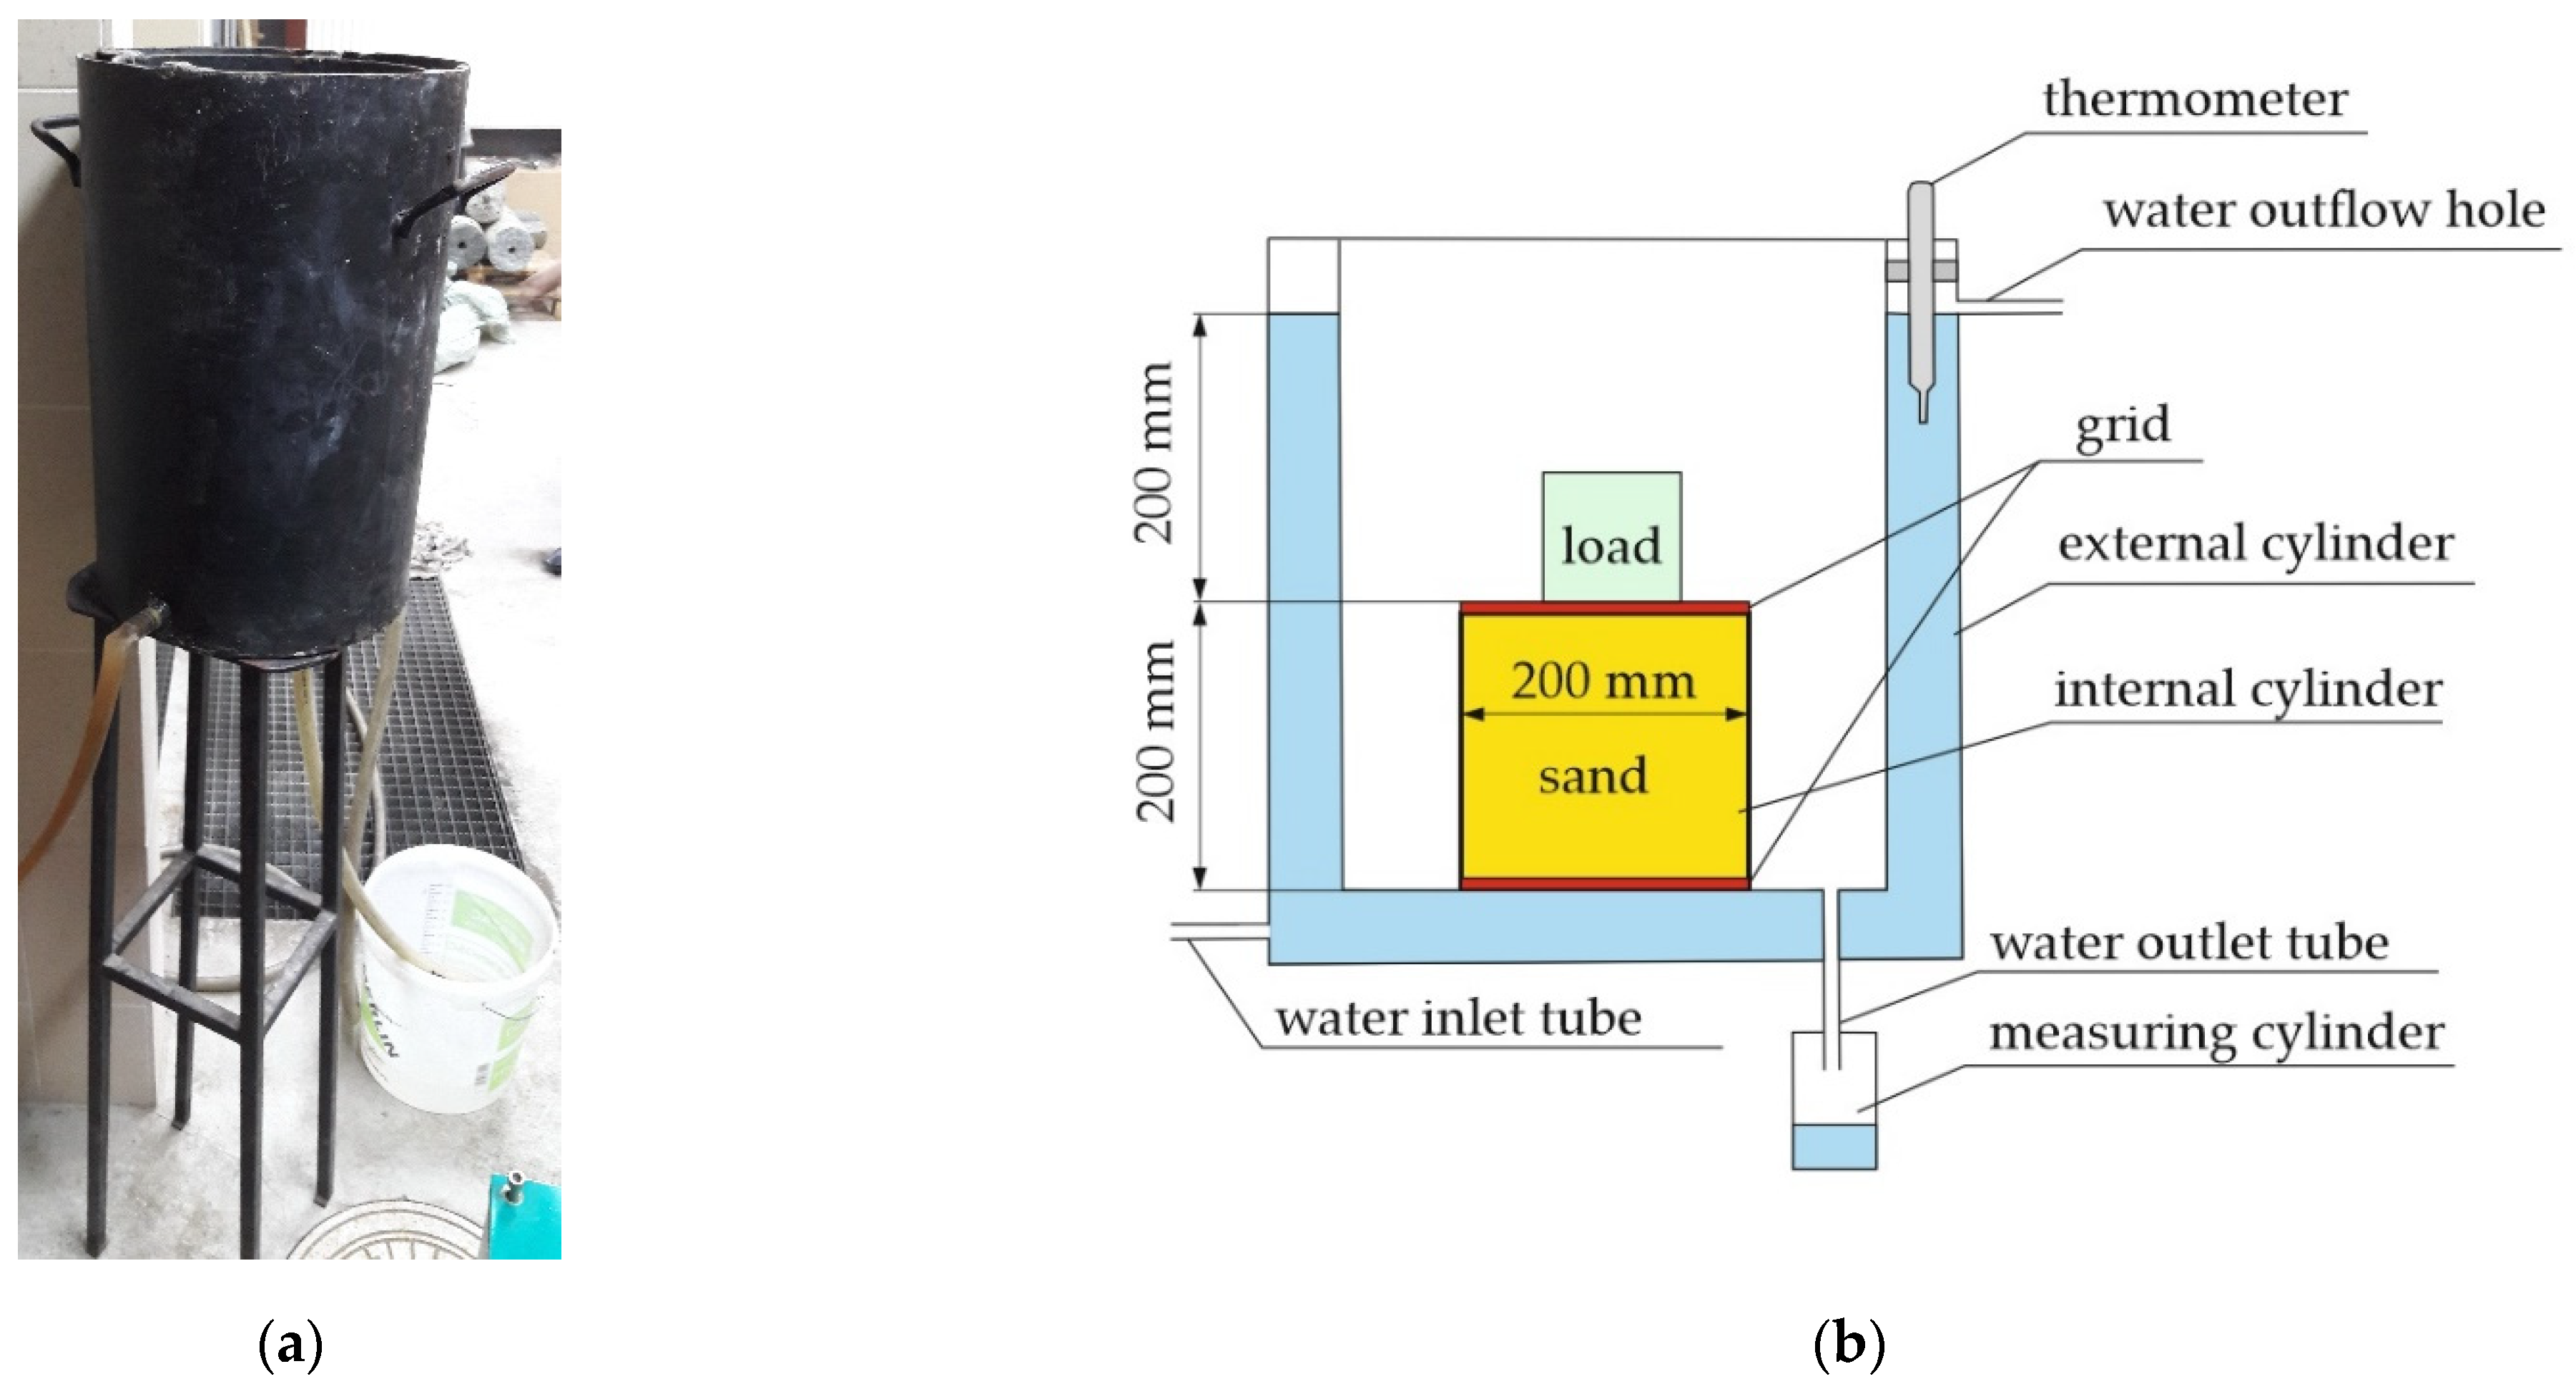
A very important factor in the success of a mining project related to the time of backfilling excavations is building an interdisciplinary model and adapting it to the intended goals. An important component of a correct model is to determine the relationship between individual studies. The model named BackfillCAD consists of four main modules (
Figure 1). The first module deals with building a stratigraphic model using computer-aided design. On the basis of drilling cores taken from the prospective deposit region, this study determined the types of layers that make up the rock mass and the depth of their deposition. The drill holes database was then built and imported into MineScape. By using the stratigraphic module, this study was able to arrange the individual test holes for which the cross-sections were made. The main goal for these cross-sections was to determine the thickness of the ore-bearing layer between individual exploratory drill holes. The second module concerned the determination of the geometry of the strip or room excavation that will be backfilled. After determining the maximum allowable dimensions of the designed excavation, this study started its distribution on the cross-sections made in the MineScape program. The third module is related to laboratory testing of the backfilling mixture. The purpose of the tests was to determine the class of the filling material in accordance with the standard requirements. In particular, tests defined the content of grains below 0.1 mm, in terms of the washability, water-permeability, and compressibility of the backfilling mixture. The fourth module of the BackfiillCAD model is related to the analytical calculations of the backfilling time. In particular, the difference in height between the inlet (surface coordinate) and the outlet (backfill coordinate) of the backfilling mixture must be determined. The shortest and longest flow paths of the backfilling are indicated by means of a stratigraphic model. The parameter, which is also closely related to laboratory tests, is the diameter of the sand grains, which is taken into account in the calculation of the critical velocity and the motion confidence index of the backfilling mixture. After the possibility of the motion of the backfilling mixture is determined, the next step is to determine the backfilling time.
In designing a hydraulic backfilling for filling the post-mining space, this study’s main task was to determine the efficiency of the backfilling installation, as well as the quality of the backfilling material and the flow conditions of the mixture. During the flow of the backfilling mixture, the solids are in a state of continuous or intermittent suspension, dispersed more or less evenly across the cross-section of the flows. Such a state can be achieved only during a turbulent flow of a mixture of solids and water, and the term kinetic specific gravity and volume concentration of the backfilling mixture can be used in relation to this. While the water itself can flow at a very low velocity, a flow velocity greater than the so-called critical velocity below which the solids begin to settle is necessary to keep the solids suspended in the water. The backfilling time for the post-exploitation space can be calculated according to Equation (1) [
33]:
where
—backfill time (h);
—volume of the strip excavation (m3);
—capacity of the backfilling installation (m3/h), according to Equation (2);
—cross-sectional area of the backfilling pipeline (m2);
—working velocity (m/s);
—coefficient of backfilling efficiency, ( = 1.3424).
The value of q is the product of the coefficient 0.839, which is used in Polish underground mines, and the average specific weight of the backfilling material.
In order for it to be concluded that the movement of the mixture in the backfilling installation will be possible, the motion confidence index (
) should be calculated according to Equation (3) With the value of
= 1, a slight increase in local resistance causes a reduction of the operating velocity below the critical value, contributing to the disturbance of operation or even blockage of the pipeline. Therefore, it is assumed that the minimum value of the M index for sand filling should be greater than the value of 1.1.
where
—height difference of the inlet and outlet of the filling mixture (m);
—hydraulic efficiency factor of backfilling installation, ( = 0.8), (/);
—equivalent length of the backfilling installation (m);
—kinetic specific gravity (N/m3).
For the quotient of
and
greater than 6.8, the kinetic specific gravity is 1.8 kN/m
3. However, for a value lower than 6.8, kinetic specific gravity is expressed in the following Equation (6):
where
Critical velocity (
) of the flow filling mixture, taking into account the kinetic specific gravity of the feed and the maximum grain dimensions (N/m
3), is expressed by the Equation (8):
where
4. Backfilling Time for the Future Exploitation Area and Discussion
The deposits of zinc and lead ores in the Olkusz region in Poland have the form of a lens and a pocket. Only the deposits that can be exploited for economic benefit under the existing geological and mining conditions are of economic importance and industrial value. In the case of zinc and lead ore deposits, it is very important to identify the deposit on the basis of which further stages related to preparation and operation can be started. It should be considered that a deposit is not suitable for favorable exploitation if the amount of ore in the deposit is small or if the ore contains too little metal. In the case of the exploitation of zinc and lead ore deposits in Poland, the metal content often changes in individual parts of the deposit (from 1.5% to 3%). On the basis of the exploratory holes made in the Olkusz region, the distribution of individual layers of the rock mass was modeled. MineScape software (Denver, CO, United States of America) in a version 7 was used for modeling, which is more and more often used in underground mining [
35]. A characteristic feature of the MineScape program is, inter alia, its modular structure, which includes creating the geometry of excavations, importing data from various graphic programs and building stratigraphic and block models. Individual modules can operate independently, contributing to the division of duties and assigning tasks for specialists responsible for planning and scheduling mining works. One of the greatest advantages of the program is the possibility of visualizing the spatial arrangement of exploratory drill holes or the entire structure of the mine, including access, preparatory excavations, and mining excavations. Moreover, the program includes functions that make it possible to model discontinuous deformations in the form of faults [
36]. First, a future research area with 21 exploratory drill holes was selected. The area was 1000 m × 1000 m. For this area, drill hole coordinates were entered into MineScape (
Figure 9). The ore deposit named Laski 1 is located in the Olkusz poviat in close proximity to the Pomorzany deposit. The geological resources of the deposit documented in the C1 and C2 categories total 10.76 million Mg of zinc and lead ore, including 424.86 × 10
3 Mg of zinc and 67.81 × 10
3 Mg of lead [
37].
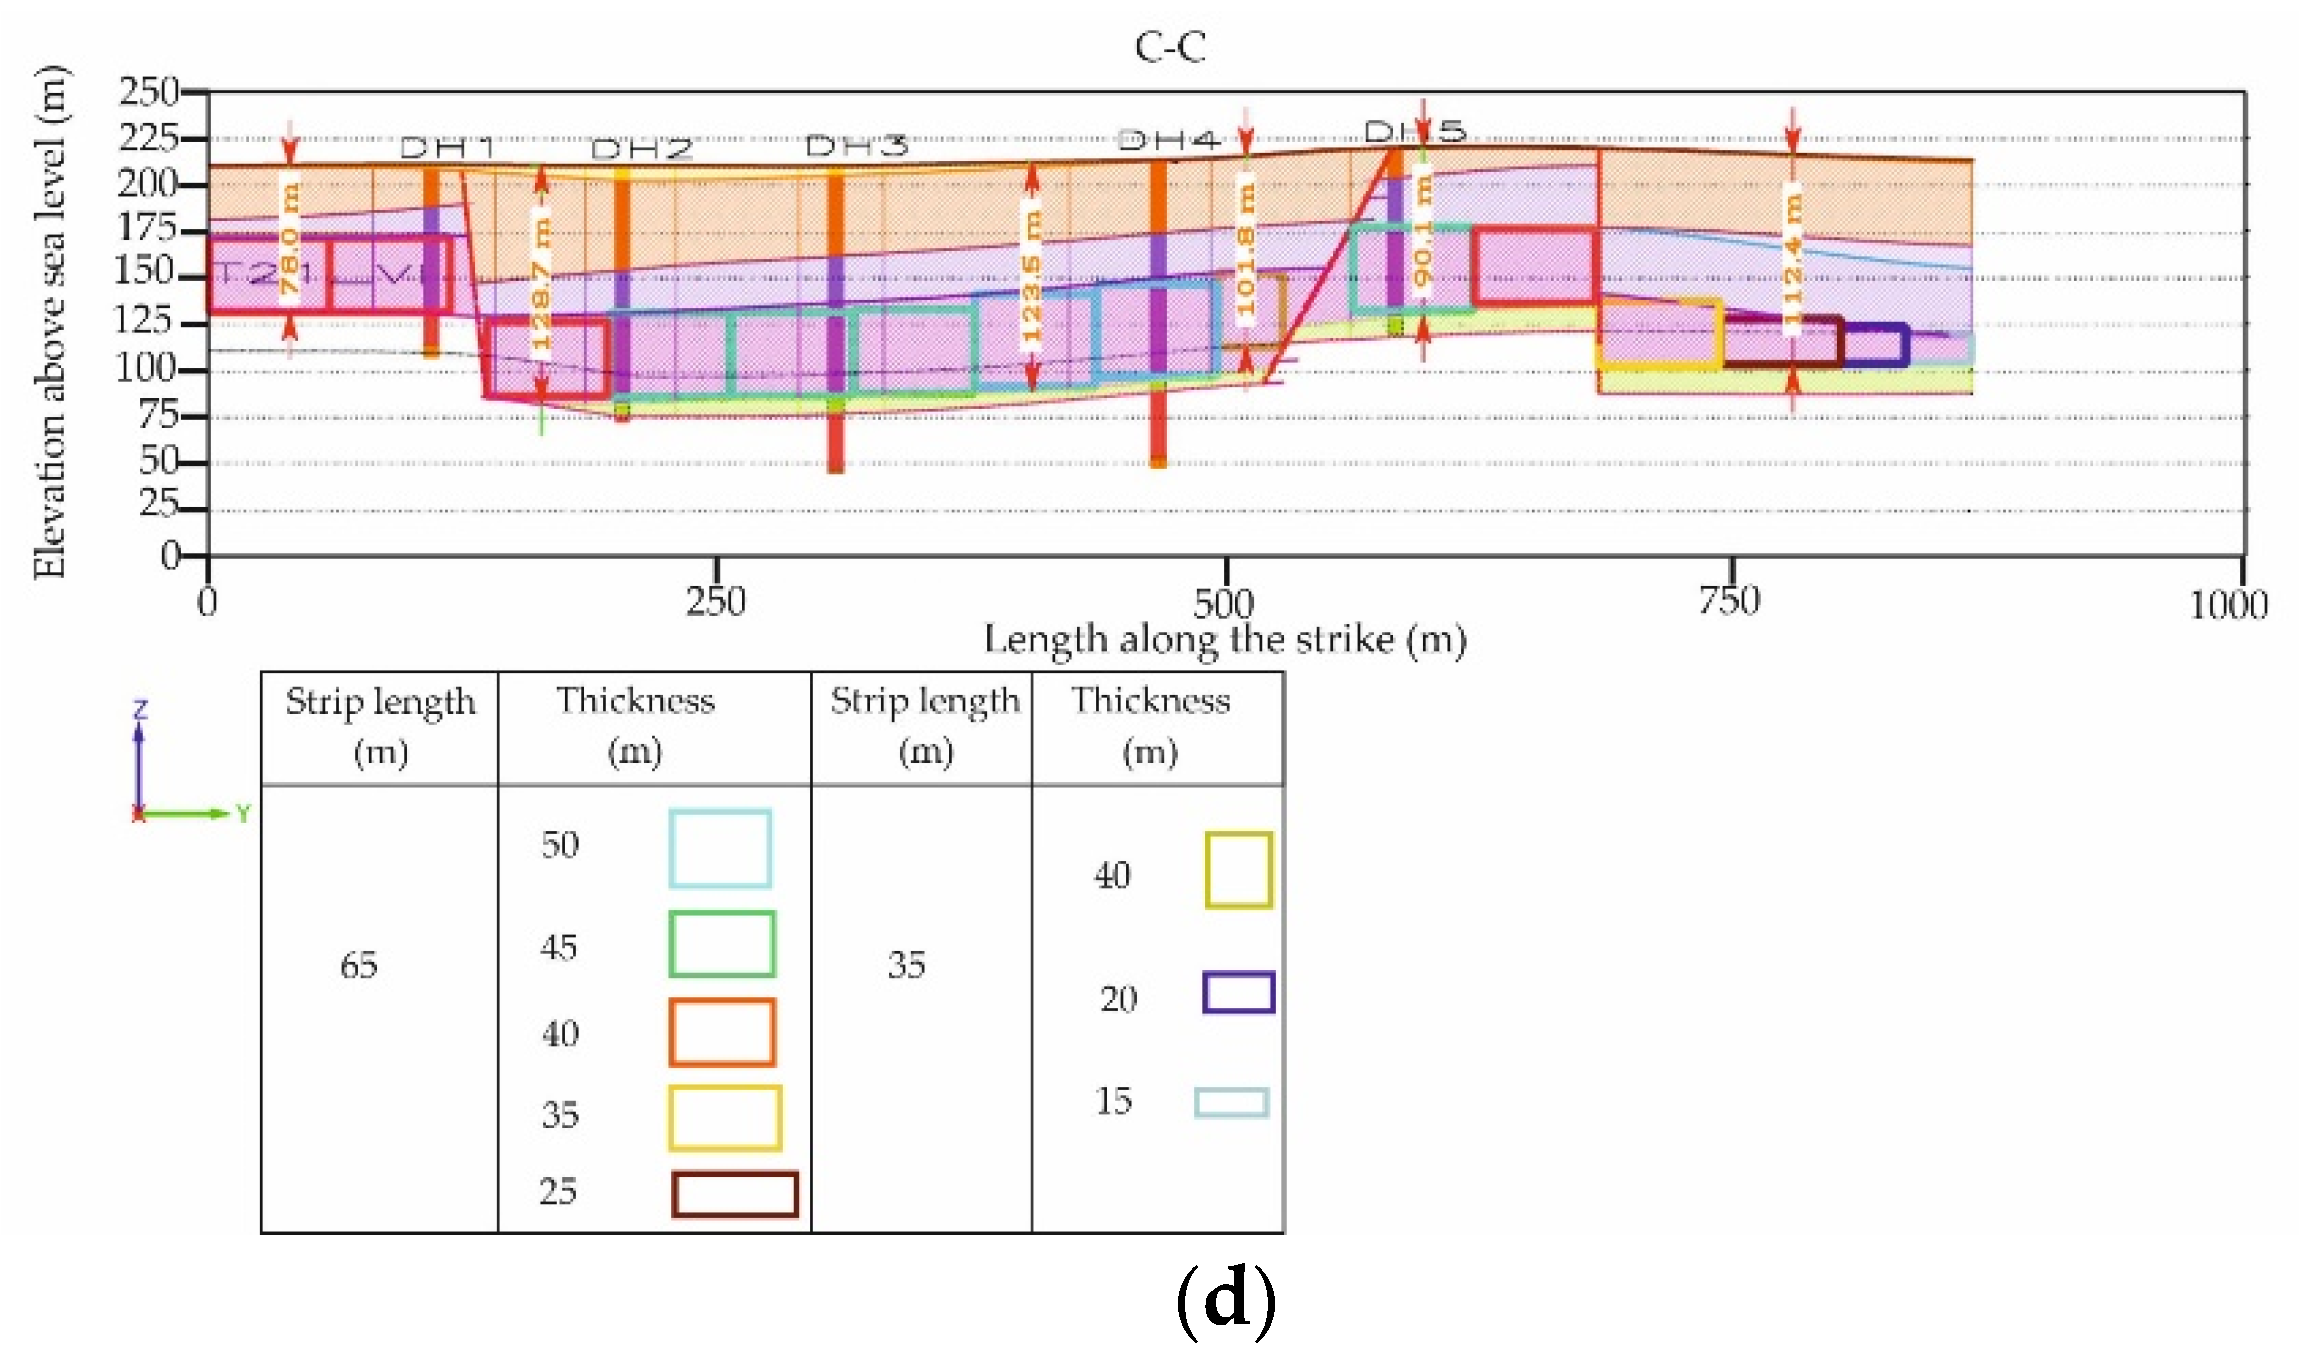
In the selected research area, cross-sections through drill holes A-A, B-B, C-C, and D-D were made, on which the thicknesses of the ore-bearing dolomite layers (layer T21_VI) were marked (
Figure 10a–d). Ore-bearing dolomites occur in the form of gray, fine-crystalline dolomites with an uneven fracture. In the oxidized zones, dolomites are strongly broke, and the voids and fissures are partially or completely filled with zinc, lead, and iron sulfides, as well as waste minerals such as vein calcite; dolomite; and, less frequently, barite and grenocite. In addition, the sections show mining blocks, the width of which included one strip in a one-way direction and bidirectionally, and the width of a haulage room equal to 5 m. Moreover, it was assumed that the thick orebody would be exploited in horizontal layers with a thickness of 5 m. The length of the strip (
), which was equal to the maximum step of backfill, was calculated according to Equation (12) [
38]:
where
—length of the strip excavation (backfilling length) (m);
—thickness of the direct roof rocks (m);
—thickness of the overburden rocks (m);
—unit weight of the direct roof (MN/m3);
—unit weight of the overburden rocks (MN/m3);
—bending strength of the direct roof rocks (bs = 4.62), (MPa).
For the strip with length of 30 m, this study assumed that the block width for a one-way exploitation was 35 m (
Figure 11a), while for bidirectional mining it was equal to 65 m (
Figure 11b). However, the width of the strip (
) was calculated according to Equation (13):
where
—width of the strip excavation, (m);
—rock refraction angle for mines in the Olkusz region ( = 60), (°);
—creep coefficient for deposit rocks ( = 0.8), (−);
—compressive strength of the direct roof ( = 35) (MPa);
—distance between the main fissure systems ( = 0.4), (m);
—unit weight of the direct roof ( = 0.026) (MN/m3);
—cosine trigonometric function;
—the angle of inclination of the stratification ( = 5), (°).
The strip width was 5.11 m. For further calculations, the result was rounded down to 5 m.
Figure 10.
Cross-section through the exploratory drill holes: (a) A-A section; (b) B-B section; (c) C-C section; (d) D-D section; T21_V1—ore-bearing dolomites; DH1-21—numbers of drill holes.
Figure 10.
Cross-section through the exploratory drill holes: (a) A-A section; (b) B-B section; (c) C-C section; (d) D-D section; T21_V1—ore-bearing dolomites; DH1-21—numbers of drill holes.
Figure 11.
Block diagram of the strip-mining excavation: (a) one-way; (b) bidirectional.
Figure 11.
Block diagram of the strip-mining excavation: (a) one-way; (b) bidirectional.
Depending on the extent of dolomitization, the average thickness of ore-bearing dolomites determined in the MineScape program was very variable and ranged from 15 to 55 m. The bottom of the T21_VI layer was also located at different depths. The maximum depth of deposition was 136.8 m, while the lowest was 69.1 m. Due to the shallow deposition of the deposit, this study required the use of mining systems with roof protection. For this purpose, the mixture of sand and water, which is a hydraulic backfill, was tested in laboratory conditions. In the backfilling time calculation for the strip-mining method, this study assumed that the backfilling mixture would be transported in a 150 mm diameter backfilling pipeline. From the 130 m long backfilling shaft, the mixture would be transported by gravity to the 250 m long drift. Then, the mixture would flow to the transportation roadway, which would be connected to four inclined drifts spaced from each other every 250 m. From four inclined drifts, each 500 m long, haulage room would be made (
Figure 12), from which one-way or bidirectional strip excavations would be made.
The calculations assumed that the operation would start from half of the future production block. For sections A-A, B-B, C-C, and D-D (
Figure 10a–d), the mean depths of deposition were 91.5, 120.3, 93, and 123.5 m, respectively. For these depths, the backfilling times were calculated, taking into account the length of the strips 15, 20, 25, 30, 35, and 65 m. The data for the calculations were placed in Equation (1). The results of the calculations are shown in
Figure 13.
Comparing the average depths of the ore-bearing dolomite layer presented in
Figure 10a–d, this study found that for the sections A-A and C-C, the depths were practically the same. The difference was only 1.5 m. A similar situation can be observed for sections B-B and D-D, where the difference was only 3.2 m. It would seem that the filling times should be similar. Meanwhile, the backfilling time depended directly on the number of preparatory excavations. On the basis of
Figure 11, one can conclude that the backfilling time for the driving excavation for the A-A cross-section was 24.56% greater in relation to the C-C cross-section. It was directly related to the longest distance that the backfilling mixture must travel from the shaft to the placement site. In the case of the B-B and D-D sections, the difference was significantly smaller. The backfilling time for the B-B section was 13.1% shorter than for the D-D section. Very similar times for backfilling were obtained for the B-B and C-C sections. The difference was only 2.33%. Despite the significant difference in the height of the deposit, over 27 m, the decisive parameter determining the backfilling time was the length of the installed pipelines.
Exploitation of a single layer of the deposit causes deformations of the terrain surface, the size of which is a function of the surface of the exploited deposit, depth, and thickness of the layer. For a specific method of liquidation of the post-exploitation space, the coefficients characterizing the influence of exploitation on the ground surface should be determined. In engineering calculations, this most often includes values of the maximum subsidence, slope, and horizontal deformation of the terrain. In order to calculate these values, one must know the exploitation coefficient and the angle of the main influence range. In the conditions of underground exploitation of zinc and lead ore deposits with a hydraulic backfilling in the Olkusz region, these parameters were equal to 0.15 and 60°, respectively [
38]. Calculating the terrain inclination by dividing the maximum subsidence (the product of exploitation coefficient and the thickness of selected layer) and the radius range of principal influence (the quotient of the depth of exploitation and the tangent of angle of the main influence range), one finds that for the shallowest and the deepest mining of 69.1÷136.8 m (
Figure 10) for selecting the first layer with a thickness of 5 m, the inclination values will be 18.79 and 9.49 mm/m for the shallowest and deepest exploitations, respectively. The permissible inclination values for the third category of surface protection ranged from 5 to 10 mm/m, while for the fifth category, they were values above 15 mm/m [
39]. The fifth category of surface protection concerns undeveloped areas, i.e., forests and meadows, while the first category had the greatest restrictions (historic buildings). Mining thick deposits of zinc and lead ores lying at shallow depths requires the division of the deposit into layers so as to accurately fill the post-mining space. It is worth noting that the selection of subsequent layers is significantly delayed in time, which contributes to the gradual delamination of the roof, which is often the reason why it is difficult to select higher layers. The use of a hydraulic backfilling to use in the post-mining space undoubtedly stiffens the spatial structure and reduces the deformation of the main roof and contributes to the reduction of surface deformation. Nevertheless, the surface protection categories should be taken into account and the exploitation system should be adjusted to the limit values.
5. Conclusions
The article presents the BackfillCAD model, which is a combination of analytical laboratory tests and computer-aided design, the purpose of which is to determine the backfilling time. By combining the various stages of the research, this study specified four characteristic modules: stratigraphic, geometry of strip excavations, laboratory tests of the backfilling mixture, and the backfilling time. The original contribution to the research was the creation of a model for the backfilling process adequately to the level of deposit recognition and, above all, the performance of tests minimizing the risk associated with the incorrect selection of the backfilling material. The model provides the basis for planning and organizing the preparation of the deposit for exploitation, and therefore it has a direct impact on the method of managing the process of backfilling in post-mining areas.
On the basis of the laboratory tests for the backfilling mixture consisting of sand with a grain size of 0.5 mm and water in a 1:1 volume ratio, this study concluded that
The average percentage contribution of particles for 0.1 mm grain class was 1.2% and the average cumulative percentage contribution of particles was 9.7%;
The average value of the compressibility of the backfilling mixture at a pressure of 15 MPa was 4.5%;
The mean value of the water-permeability was 0.033 cm/s.
On the basis of the design research using the MineScape program for the prospective zinc and lead ore deposit in the Olkusz region in Poland, this study concluded that
The minimum and maximum depths of ore-bearing dolomites modeled in the MineScape program ranged from 69.1 to 136.8 m;
Deposit thickness was very variable and ranged from 15 m to 55 m;
The maximum length of the strip excavation was 35 m.
The time to fill in was found to be most influenced by height difference of the mixture inlet and outlet of the backfill; equivalent length of the backfilling installation; kinetic-specific gravity; and unit energy losses, working velocity, critical velocity, and maximum grain size. Calculated backfilling times did not take into account the time associated with shortening the pipeline as the backfilling was filled. In addition, when calculating the total time needed to eliminate the selected post-mining space, one should also take into account the technological processes related to the flushing time of the backfilling installation, which takes into account the actual length and diameter of the pipeline and the construction of backfilling dams. The presented BackfillCAD model can be useful at the planning and scheduling stage for both operating mining plants and, above all, for new prospective deposits of mineral resources.


