1. Introduction
Differential interferometry synthetic aperture radar (DInSAR) is a well-known, efficient method of monitoring ground deformation on the basis of SAR data from a satellite of an airborne radar [
1,
2,
3]. It is used to detect vertical ground deformations with high spatial and temporal resolutions and is applied for instance in monitoring of volcanic activity [
4], earthquakes [
5], or anthropogenic deformations resulting from underground mining [
6]. The study is focused on the Upper Silesian Coal Basin (USCB), where subsidence triggered by mining is causing significant damage to the surface and subsurface infrastructure. Every year, coal mines spend even more than a few million euros to repair mining-related damage in a single town or city [
7]. Mining has harmful effects on buildings and public infrastructure such as roads, railways, gas and water pipes, power lines, and sewage systems. The damage is expensive to repair, and, in some cases, it can be dangerous for human life and health (e.g., building collapse or gas explosion).
Substantial subsidence of the land and changes to the landform also cause unfavorable changes to the water relations in the area, i.e., disturbances in surface runoff, progressive waterlogging, flooding, and floodplains in subsidence. Flooding is not only caused by the size and distribution of post-mining subsidence but also by hydrotechnical activities undertaken by mines to repair the damage caused [
8].
Early detection of subsidence allows for taking preventive measures. On a small scale, they could include filling voids or strengthening the site. On a large scale, they could mean relocating people or the infrastructure [
9].
Monitoring and studying the environmental effects of mining over large areas is difficult and depends on the size of the area and its location. It is also time-consuming and costly [
10]. A far better solution that has been used in recent years is monitoring using DInSAR technology. It can be carried out without ground/field measurements such as surveying, geotechnical engineering, or mining. DInSAR is currently being used by some of the municipalities in the Upper Silesian Coal Basin, located in the impact zone of a coal mine.
The DInSAR technique utilizes two images from the same area that were taken by the same SAR system at different times. First, the images must be co-registered, and then the phase difference (Δϕ) is calculated for each pixel of the image. In that way, a flattened interferogram is obtained. The digital elevation model (DEM) is used in order to remove the component related to the topography of the studied region from Δϕ. DEM is converted into a synthetic interferogram that, in turn, is subtracted from the flattened interferogram. As a result, a so-called differential interferogram is obtained. Its phase properties can be directly related to the ground deformation. Subsidence connected among others with mining usually manifests itself in differential interferograms in the form of elliptical interferometric fringes (
Figure 1).
A large number of methods are used to detect subsidence troughs in DInSAR images, namely, Gabor transformation [
7], Hough transformation [
11], template recognition [
12], convolutional neural networks [
13], or circlet transform [
14]. Each of them have their limitations that render subsidence detection in noisy satellite images inefficient. Most of them can be used to aid subsidence detection in large SAR images but they are insufficient for fully automated work.
The authors propose a new subsidence detection method based on interferogram area searching, where pixels form planes with a slight slope and a relatively high entropy. At the first stage, the effectiveness of the method was tested for 134 interferogram fragments (512 × 512 px) with subsidence troughs. Next, two larger (1400 × 2000 px) areas of the USCB were selected. Due to intensive mining in that area, the subsidence troughs found there are characterized by various extensions and various spatial sizes. As subsidence troughs occur both in urban and rural areas, they can be more or less affected by temporal decorrelation. Such a diversity of the patterns in the interferograms allows for a high-quality verification of the proposed automated method of subsidence detection.
2. Methodology
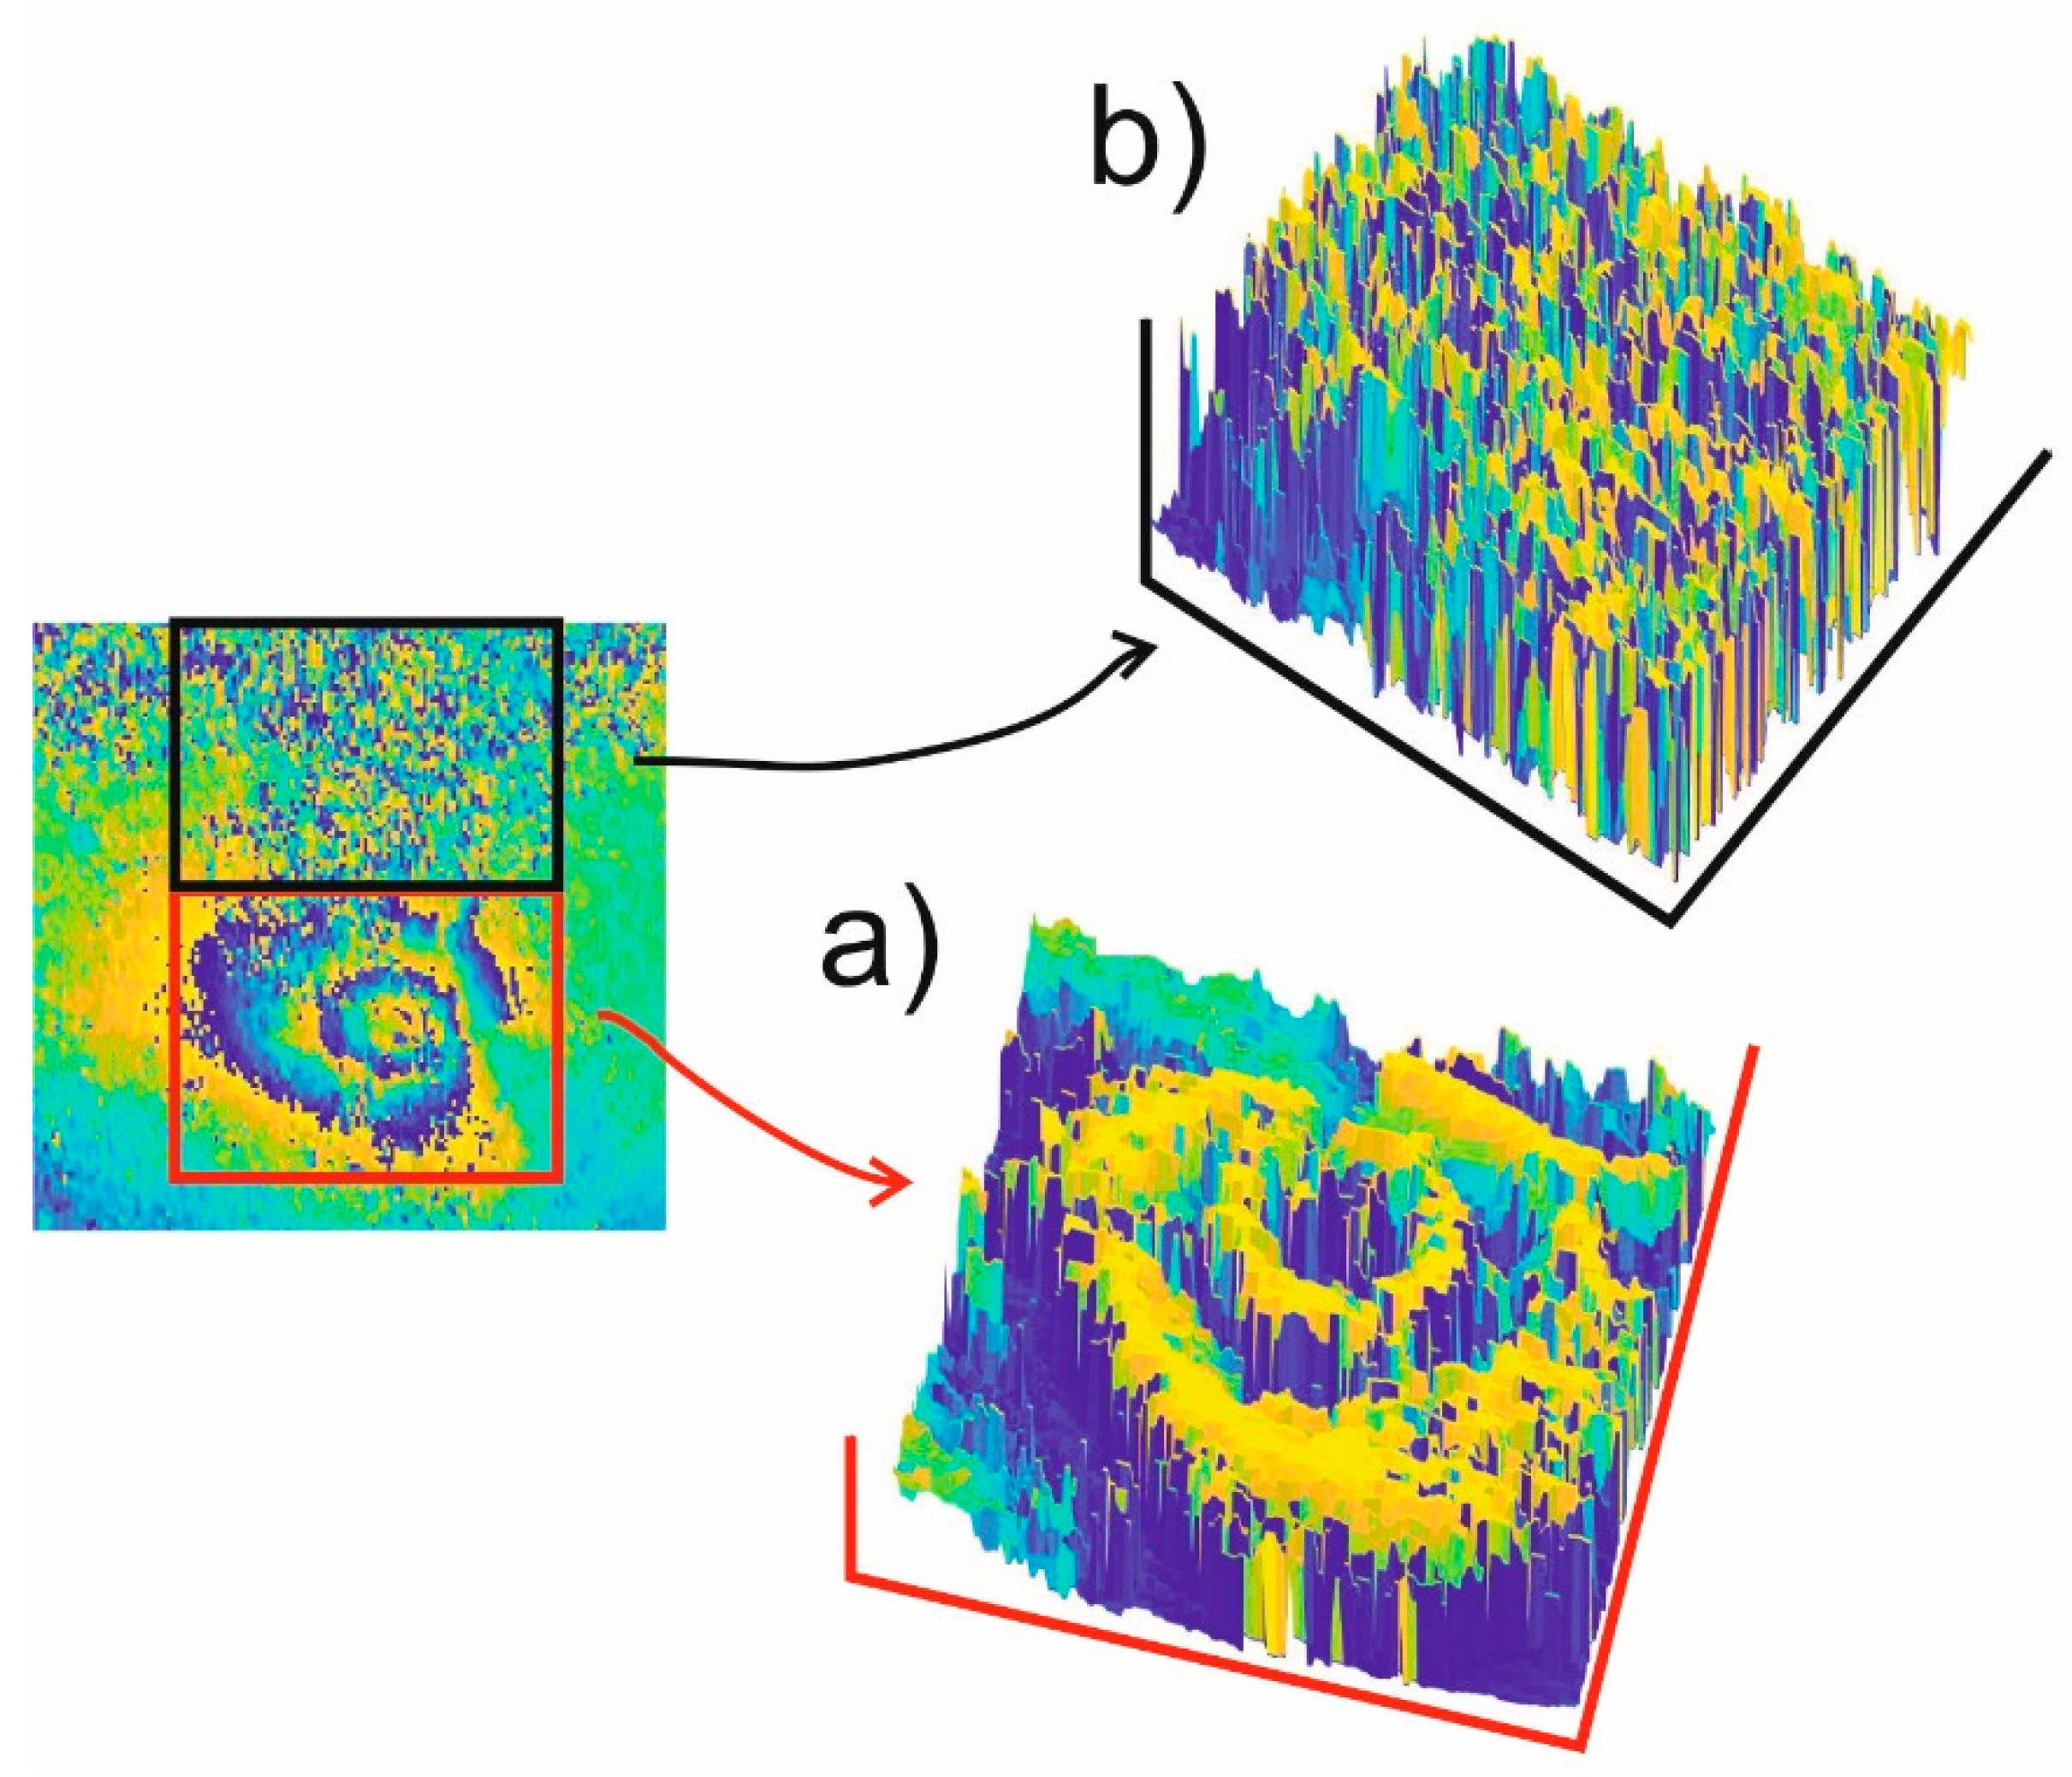
In interferograms, subsidence troughs take the shape of elliptical areas with a characteristic radial variability of the phase value. The phase value in the areas of subsidence changes monotonically from
to
. After that monotonic increase of the value, a rapid change of the phase value from
to
takes place (
Figure 2a). In the interferometric images of the areas without subsidence, the phase value is constant or takes random values in the range of
(
Figure 2b).
Classic methods of subsidence searching utilize the elliptical shape of a trough (Hough). Very often, troughs do not meet that criterion, if at all (e.g., only a part of the trough is visible). The method presented here uses the fact that within a step change, the phase increases linearly from −π to π. The other criteria (entropy, standard deviation, or the flatness of the phase histogram) are used to eliminate areas of linear phase change but not related to the subsidence.
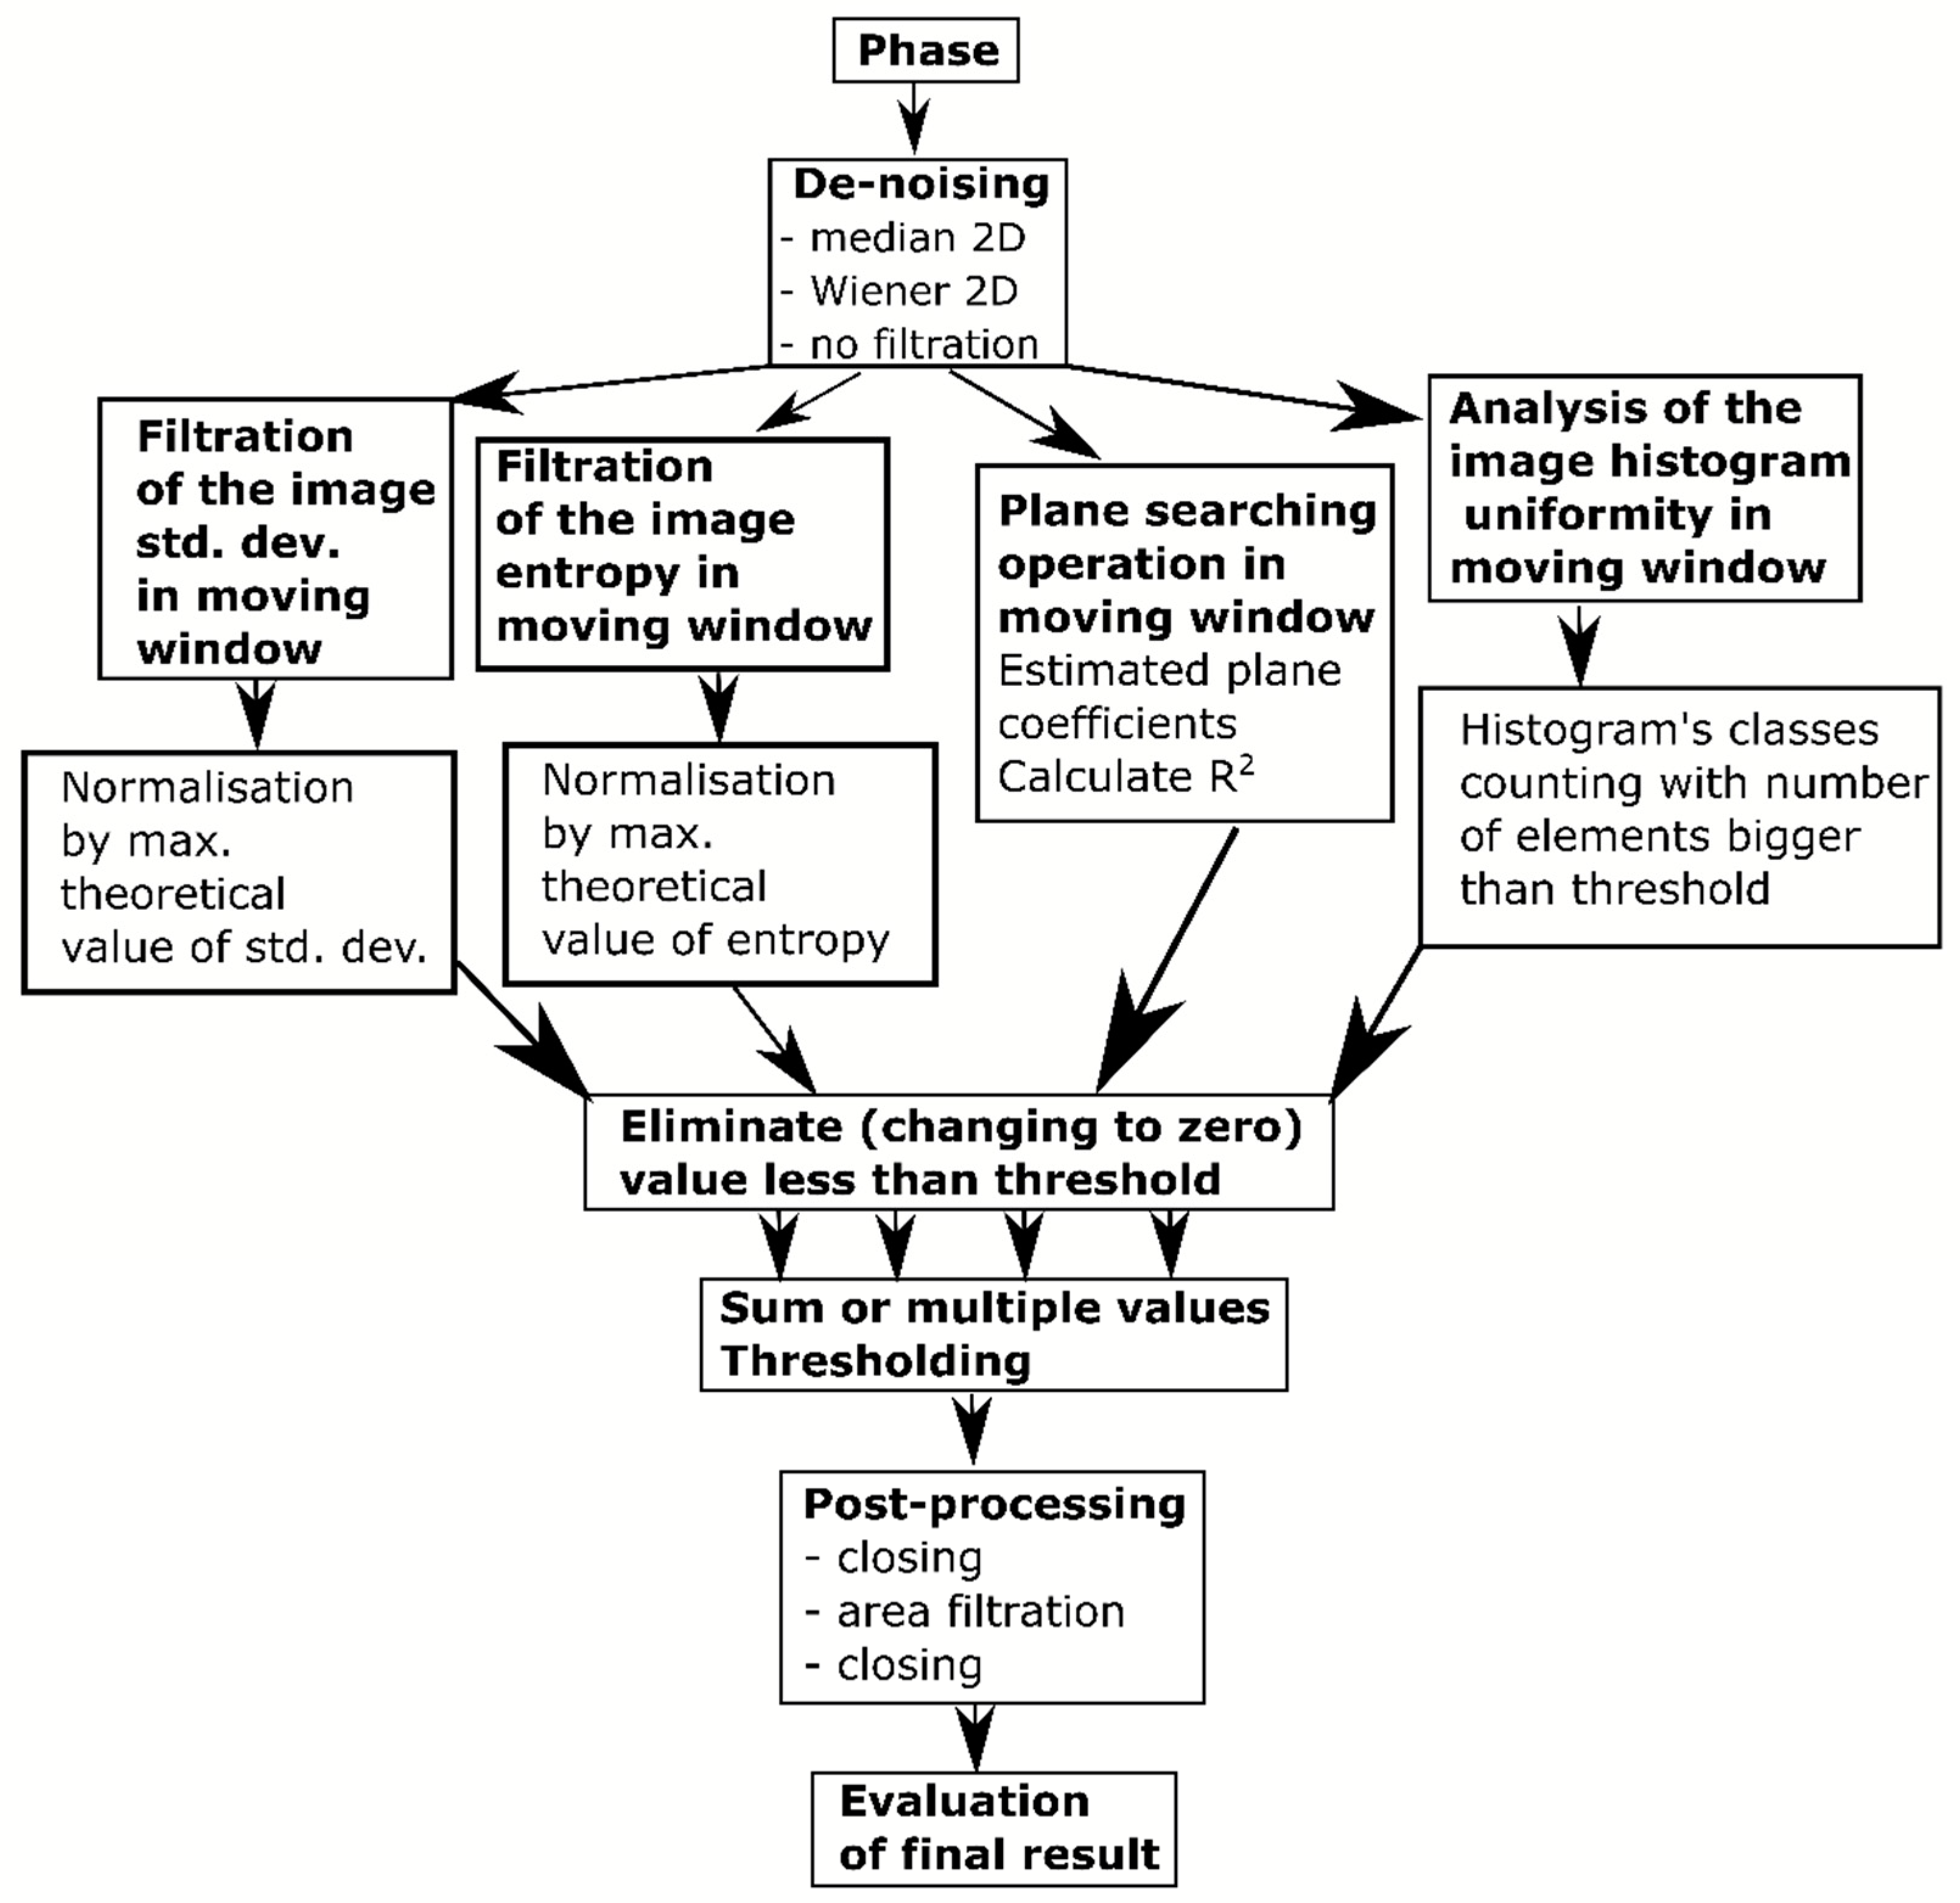
The detailed diagram of the algorithm working principle is presented in
Figure 3.
First, noise is removed from the image using the median or the adaptive Wiener filters. Next, the image is used as input for a number of simultaneous processes:
filtration of the standard deviation of the interferogram;
filtration of the image entropy;
analysis of the image histogram uniformity;
plane searching operation.
The areas with a phase value step change (from to ) are identified by standard deviation filtration procedures and entropy filtration in a square, moving window. In both cases, such areas of the interferogram are searched for where the normalized standard deviation and entropy value is higher than the threshold value.
The analysis of the phase histogram uniformity is carried out in order to eliminate areas where a phase step change occurs that is not preceded by a monotonic increase of the phase value from do . This analysis is carried out for a specific subarea of the interferogram and for a specific class number. The subareas whose histograms considerably differ from the uniform distribution do not contain a monotonic change of the phase value. Thus, they are classified as subareas where subsidence troughs do not occur.
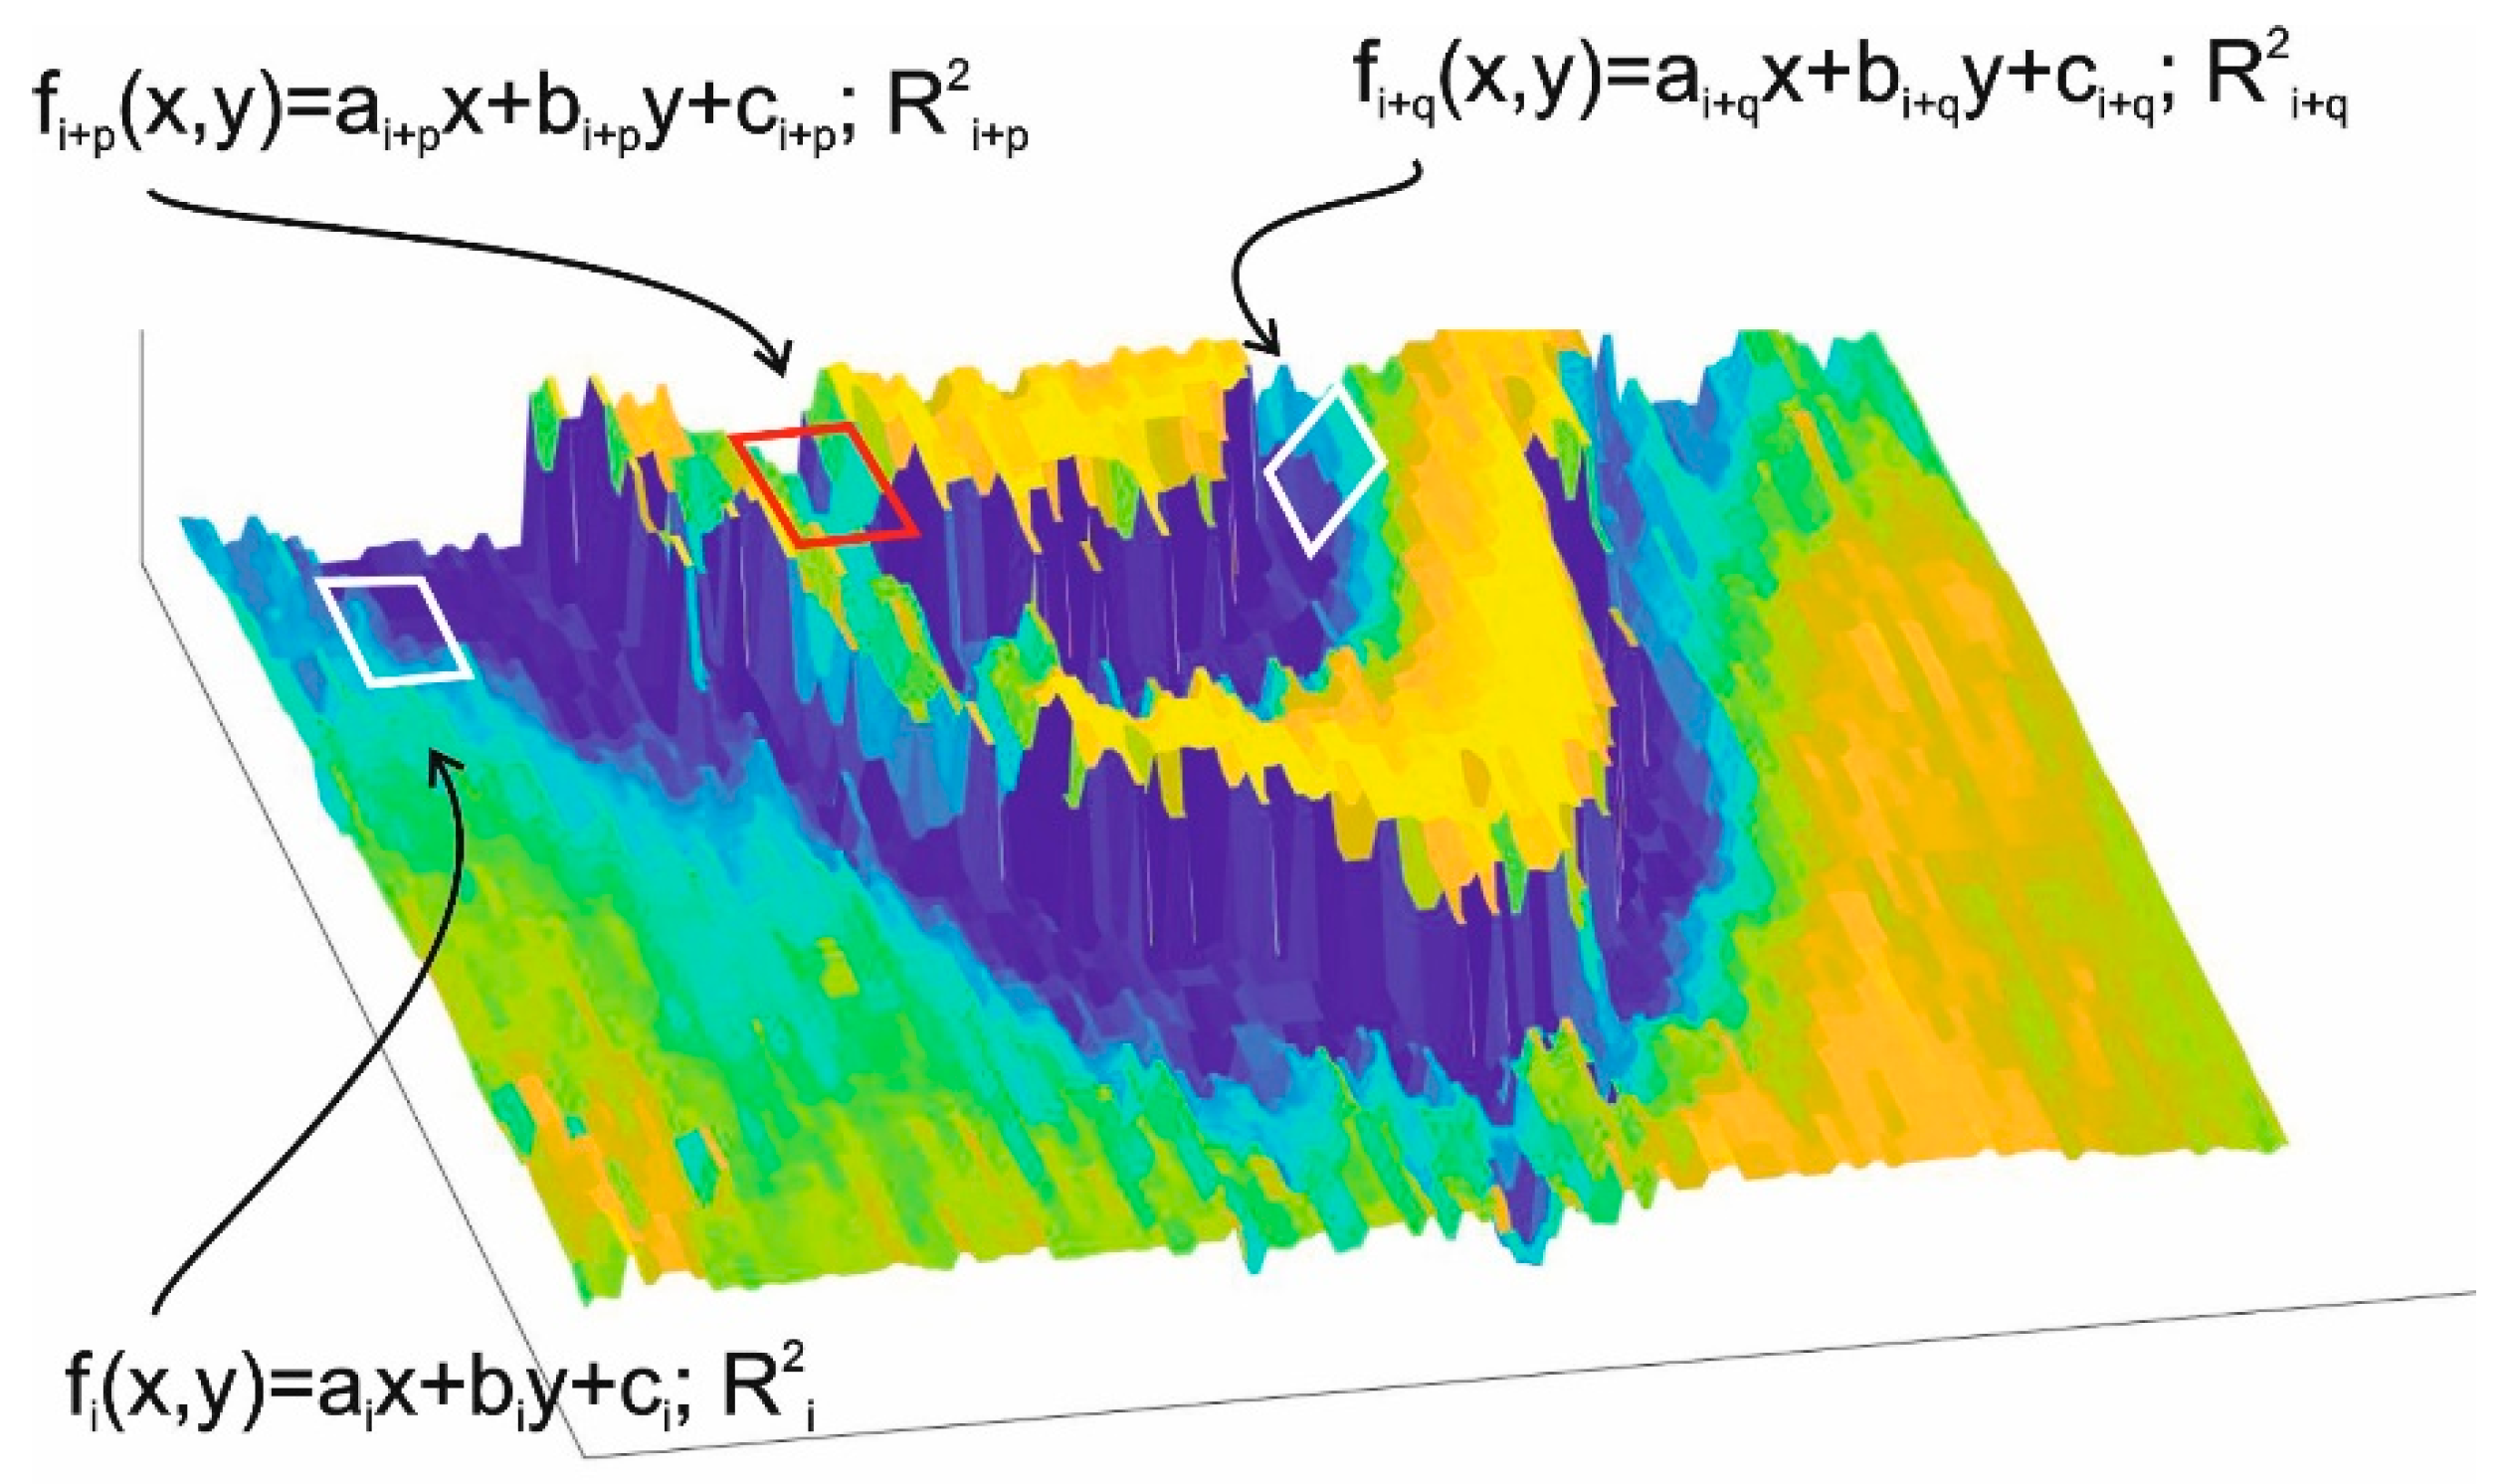
The procedure of plane detection is the most important element of the presented algorithm of subsidence detection in interferograms. Its aim is to identify those fragments of an interferogram whose phase values can be approximated by the equation of the plane with a particular slope angle. A fragment of the interferogram is approximated by a plane described by Equation (1)
where (
x,y) are the local coordinates of the interferogram. A fragment is classified as an area where a monotonic change of the phase value occurs if the
a and
b coefficient absolute values of the approximating equation as well as the value of the fitting coefficient
R2 of the approximated plane and the phase values of the analyzed fragment are within the assumed range of values.
Figure 4 shows the approximation of three fragments of the interferogram by the plane described by Equation (1).
The results of all the procedures presented above were taken into account when constructing the output image. In addition, the output image was subjected to final processing that consisted in removing small-area elements and morphological closing. The latter was to remove areas lying closely to one another and to fill small holes in those areas.
3. Experimental Analysis
The algorithm was analyzed using MathWorks MatLAB 2020b software. It was tested for two interferogram sets, which differed in the place where the radar images were taken, the time of their taking, and the size of the areas from which the interferograms were computed. The aim was to find the optimal value of the algorithm parameters, allowing for the detection of all the subsidence troughs occurring in the analyzed sets with the number of false classifications as low as possible. The following parameters determining the efficiency of the algorithm were tested:
window sizes of median and Wiener filtration (
Table 1, columns 2 and 3);
threshold value adopted at the stage of phase entropy filtration (
Table 1, column 4);
threshold value adopted at the stage of filtration of interferogram phase standard deviation (
Table 1, column 5);
size of the interferogram fragment approximated by Equation (1), fitting threshold value R
2, the weight with which the results of detection of monotonic phase variation areas were taken into account when constructing the resulting map (
Table 1, columns 6–8);
number of histogram classes used at the stage of distribution uniformity analysis (
Table 1, column 9);
resulting map computing method (
Table 1, column 10);
post-processing parameters for removing small areas and morphological closing (
Table 1, columns 11 and 12).
The values of the tested parameters for each of the 35 combinations are presented in
Table 1.
3.1. Aplication of the Proposed Algorithm for the First Dataset Covering a Small Area
The algorithm of subsidence detection was analyzed using a test set of 134 images, 512 × 512 px. The images were selected from the interferograms computed from radar images recorded during the Sentinel-1 mission—the first of the European Space Agency missions developed for the Copernicus initiative. The test sets were selected from the Sentinel data products recorded in the years 2017–2018 in the USCB, published under an open access license. The test set comprised interferogram fragments containing as many distinct troughs as possible. An example of three visible troughs from the test set is presented in
Figure 1. Each of the images was thoroughly analyzed, which allowed for manual determination of subsidence troughs. The spatial coordinates and the size of 286 such identified troughs in the analyzed test set constituted the so-called reference set. The reference set was used to test the trough detection algorithm. The results of the algorithm—the coordinates of the troughs—were compared with the reference indications, and on that basis, the effectiveness of the algorithm was measured.
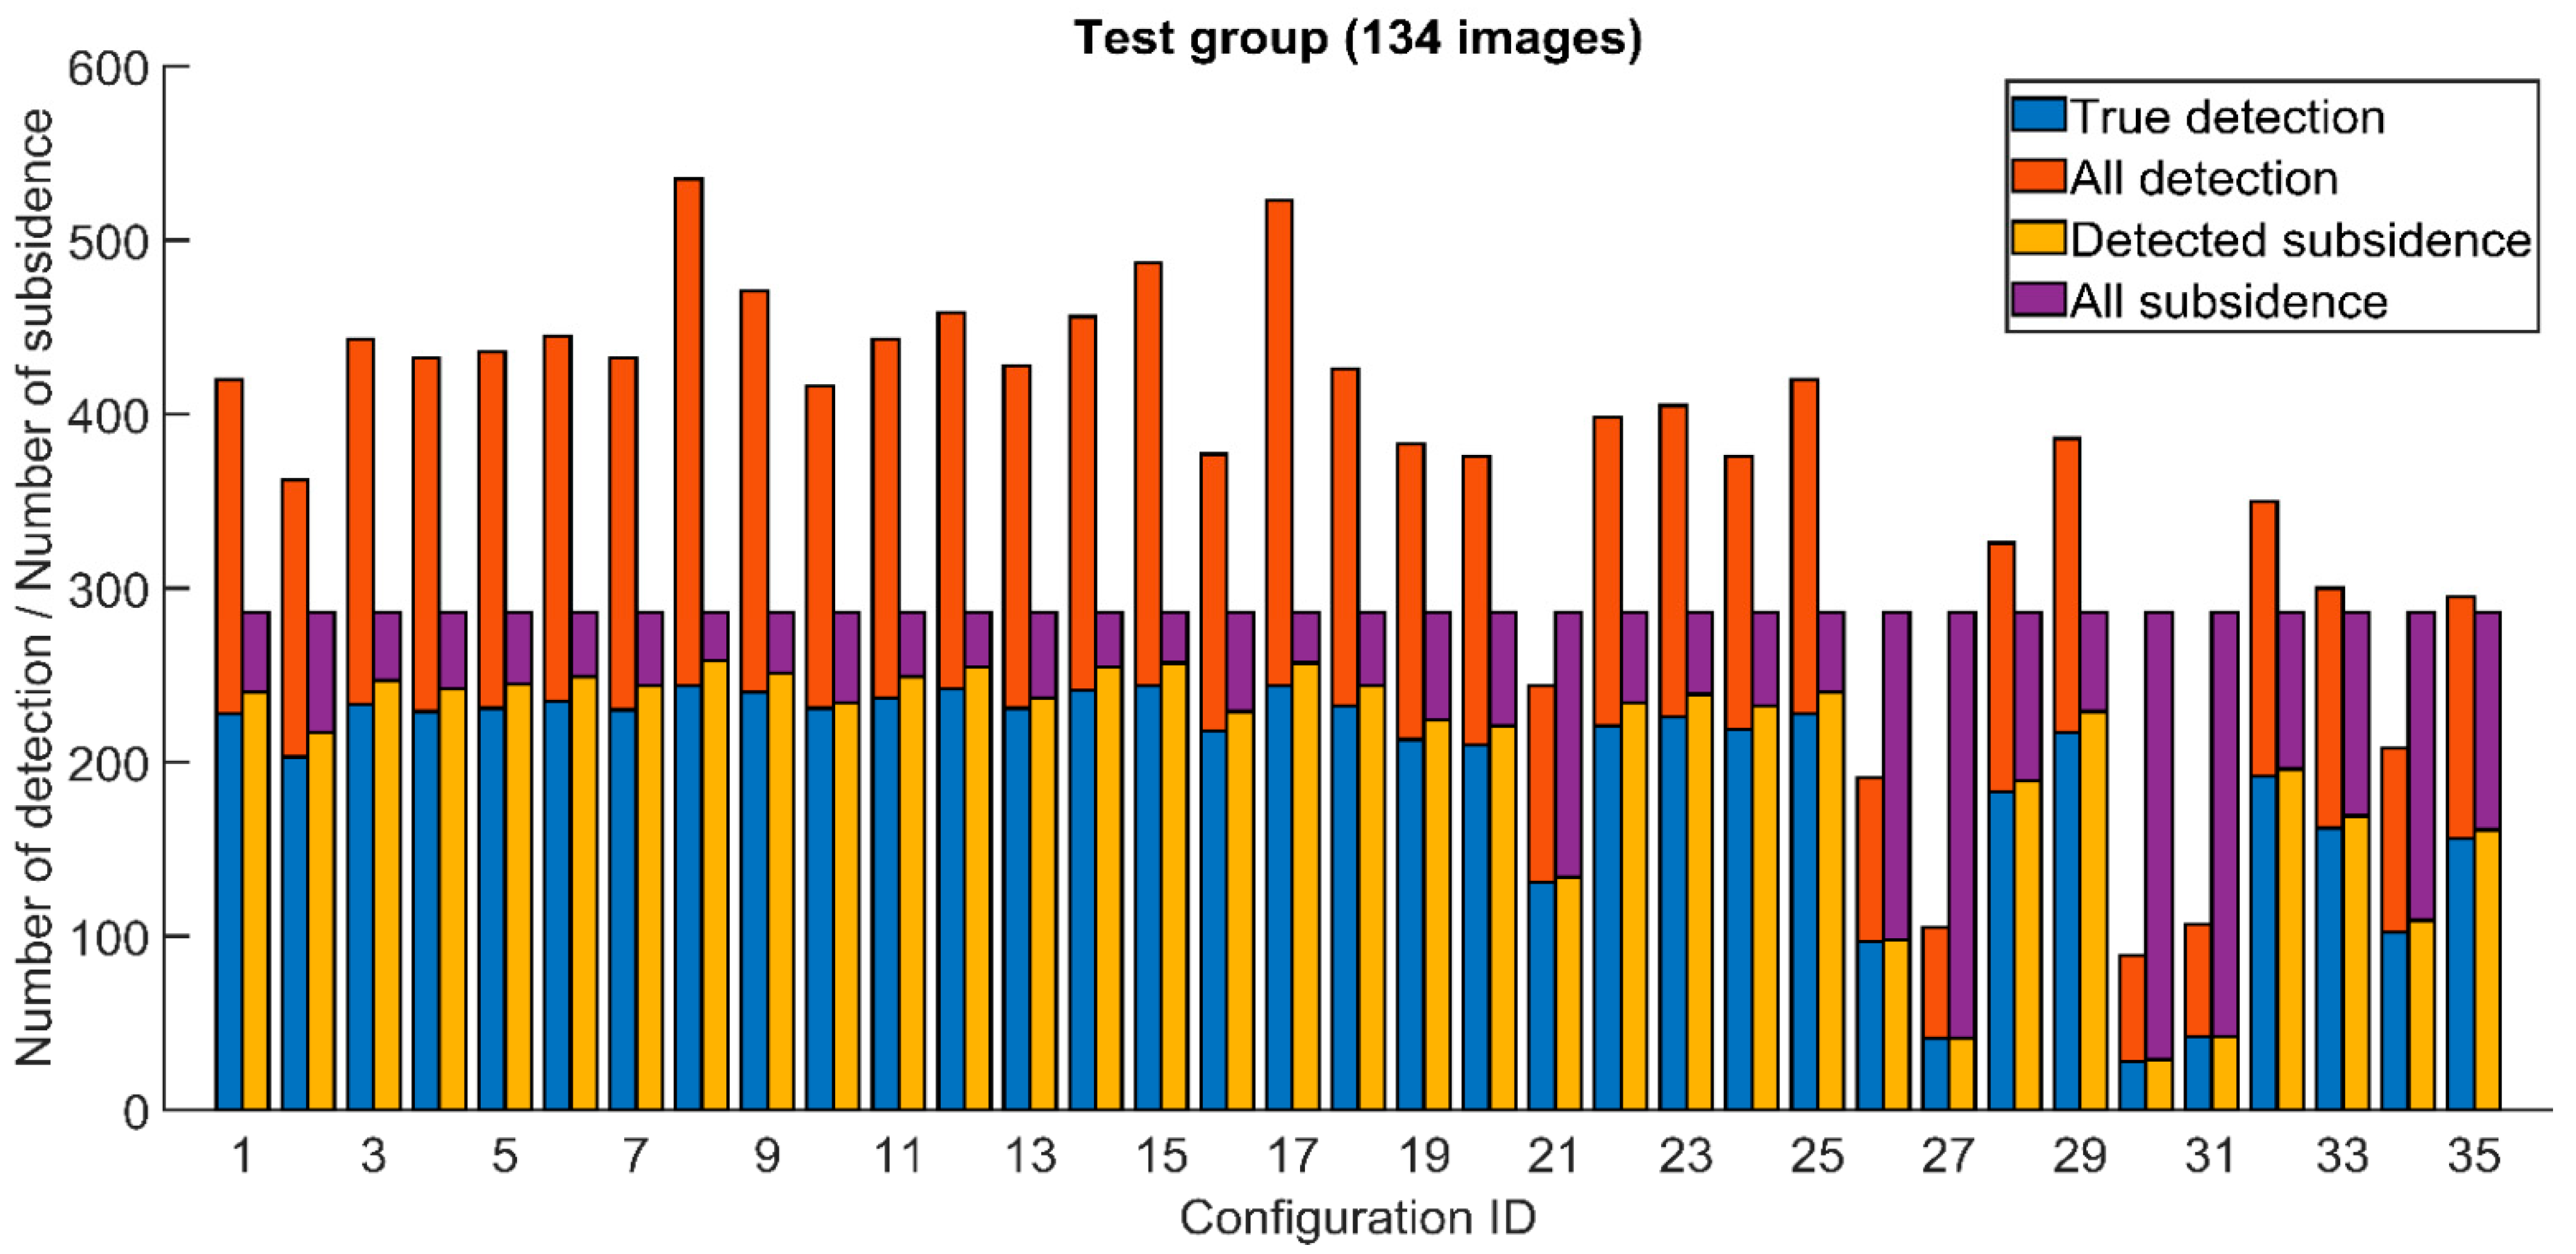
The trough detection algorithm was tested not only for its efficiency—the number of detected troughs—but also for false detections, identifying some interferogram parts as troughs. A subsidence trough was considered located correctly if it contained at least a 25-pixel area classified by the algorithm as a subsidence trough. Other interferogram areas classified as troughs that were inconsistent with those determined manually were considered incorrect detections—so-called false alarms. Additional parameters used in the assessment of the algorithm were the number of all detections and the overall area of the interferogram that was classified by the algorithm as subsidence. The algorithm efficiency results for the adopted 35 parameter value combinations (
Table 1) are presented in
Figure 5.
The presented results show a strong relationship between the parameter values and the efficiency of the algorithm. None of the 35 tested combinations resulted in the detection of all the 286 subsidence troughs. The highest number of troughs was detected using combination 8 but it was at the cost of all detections (535) and a high rate of false alarms (54.4%). In general, for the majority of the tested configurations, it was evident that as the algorithm efficiency increased so did the number of all detections and false detections. The above conclusion does not apply to the cases where the detection number was much lower than the number of existing subsidence areas (particularly configurations 26, 27, 30, and 31). It must be noted that in many cases the number of detected troughs was higher than the number of correct detections of the algorithm. This occurred when subsidence areas were close to one another and the area classified by the algorithm as subsidence matched more than one trough manually indicated in the interferogram.
The efficiency result of the subsidence detection algorithm with an emphasis on the results of particular algorithm operations is presented in
Figure 6 and
Figure 7.
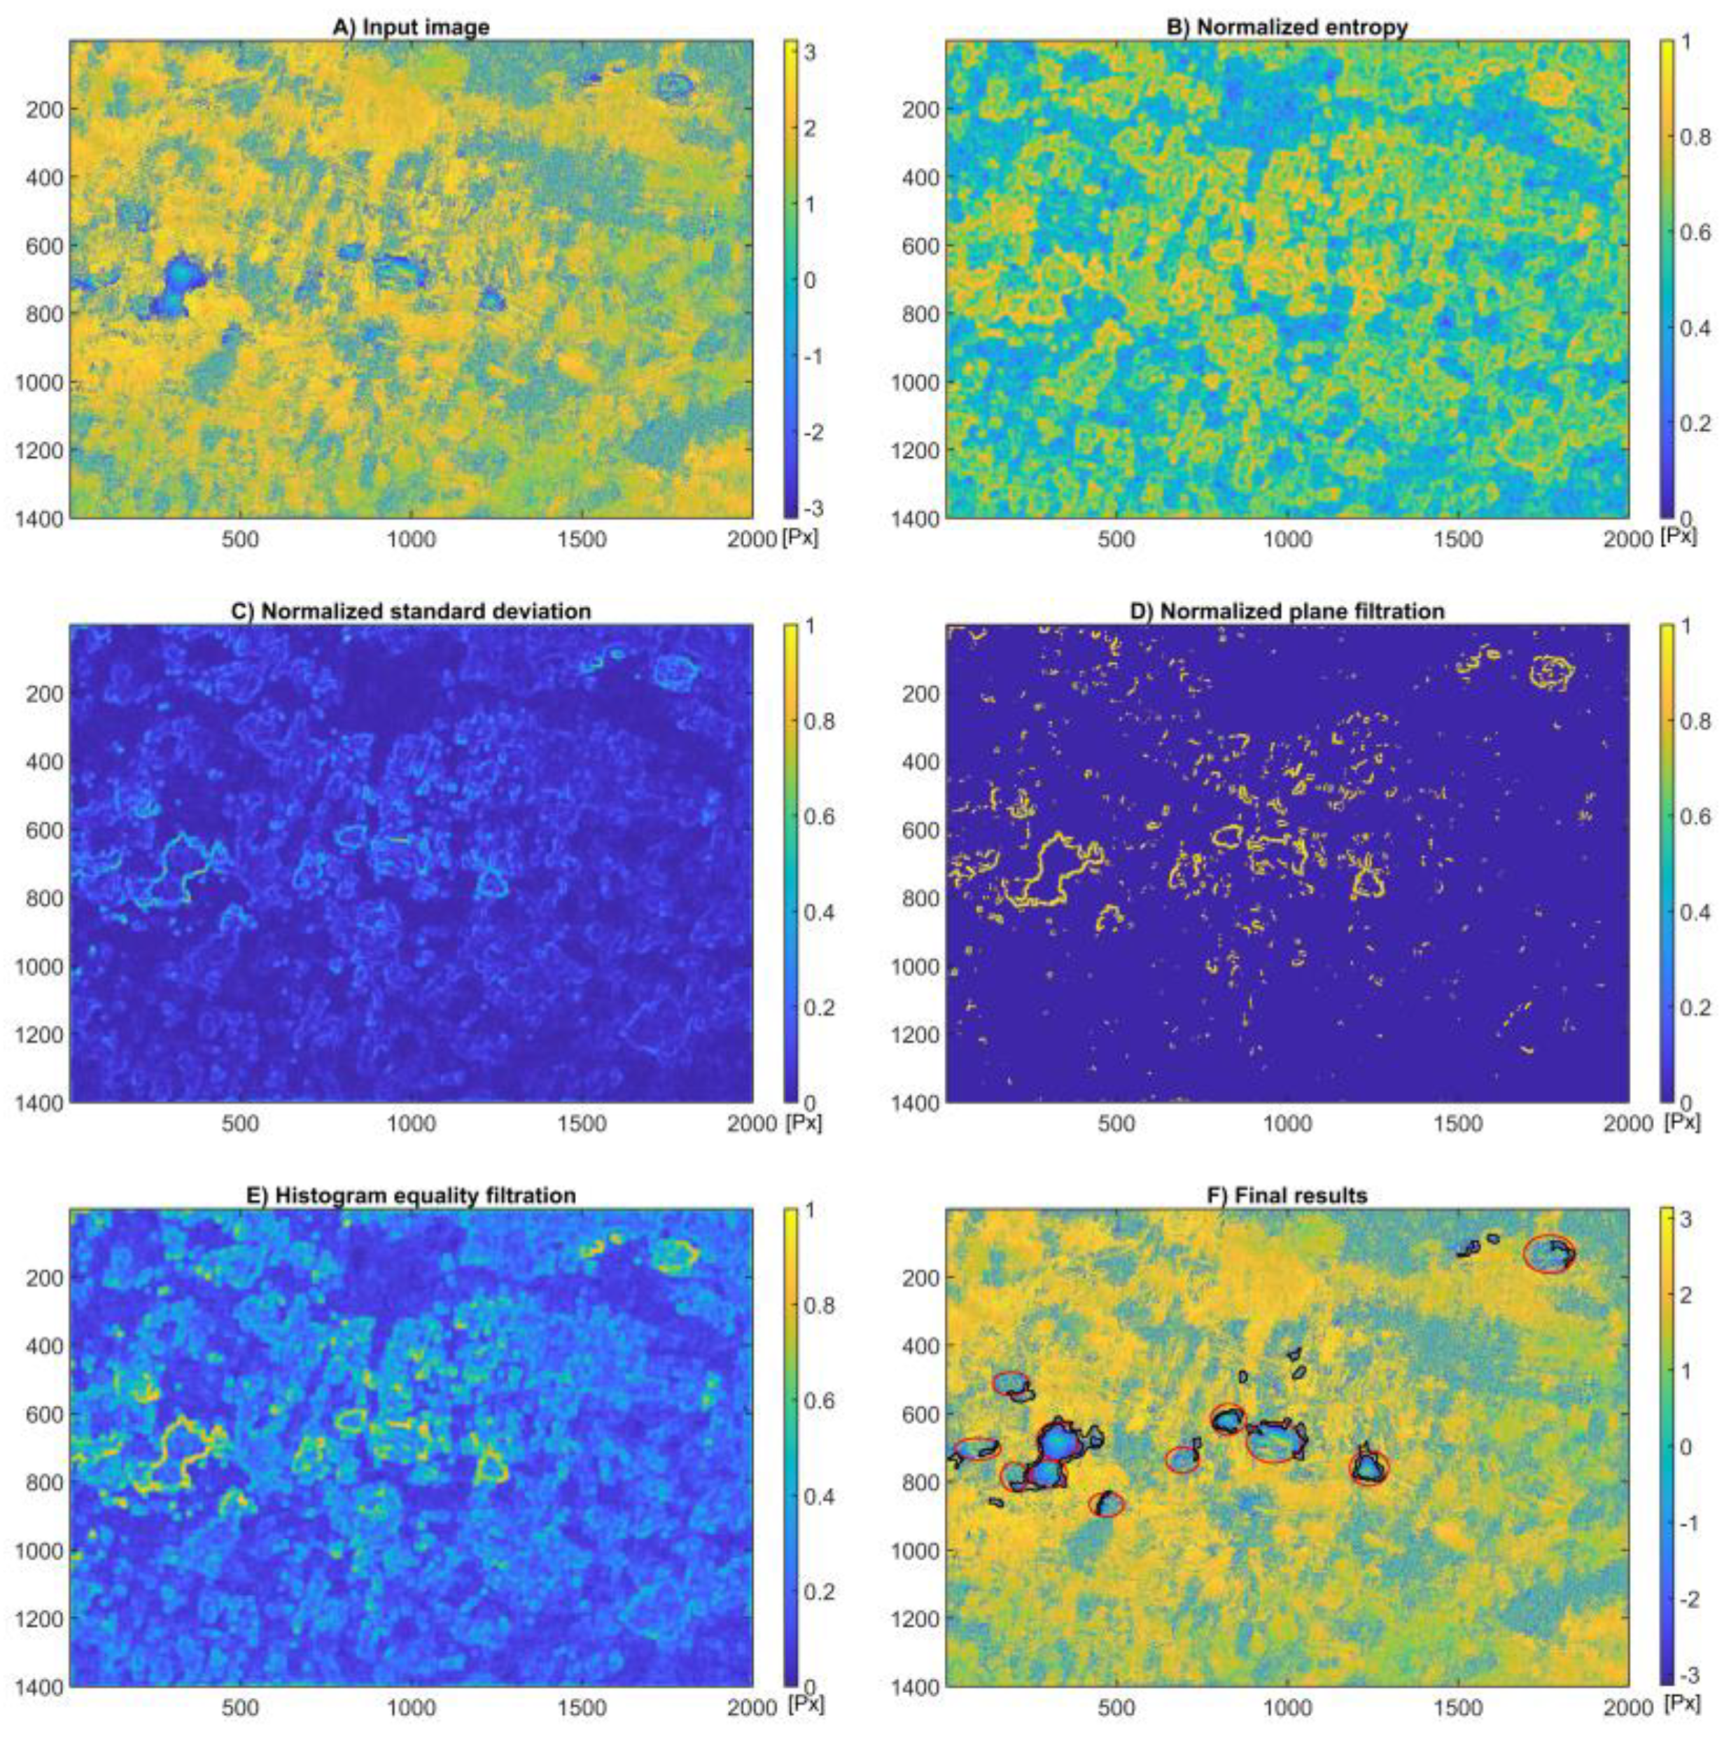
In the subsidence detection, parameter values for combination 14 were used (
Table 1), which was characterized by a relatively high detectability (255 detected troughs out of 286 existing ones), an average number of all detections (435), and an average coefficient of false detections (215 out of 456).
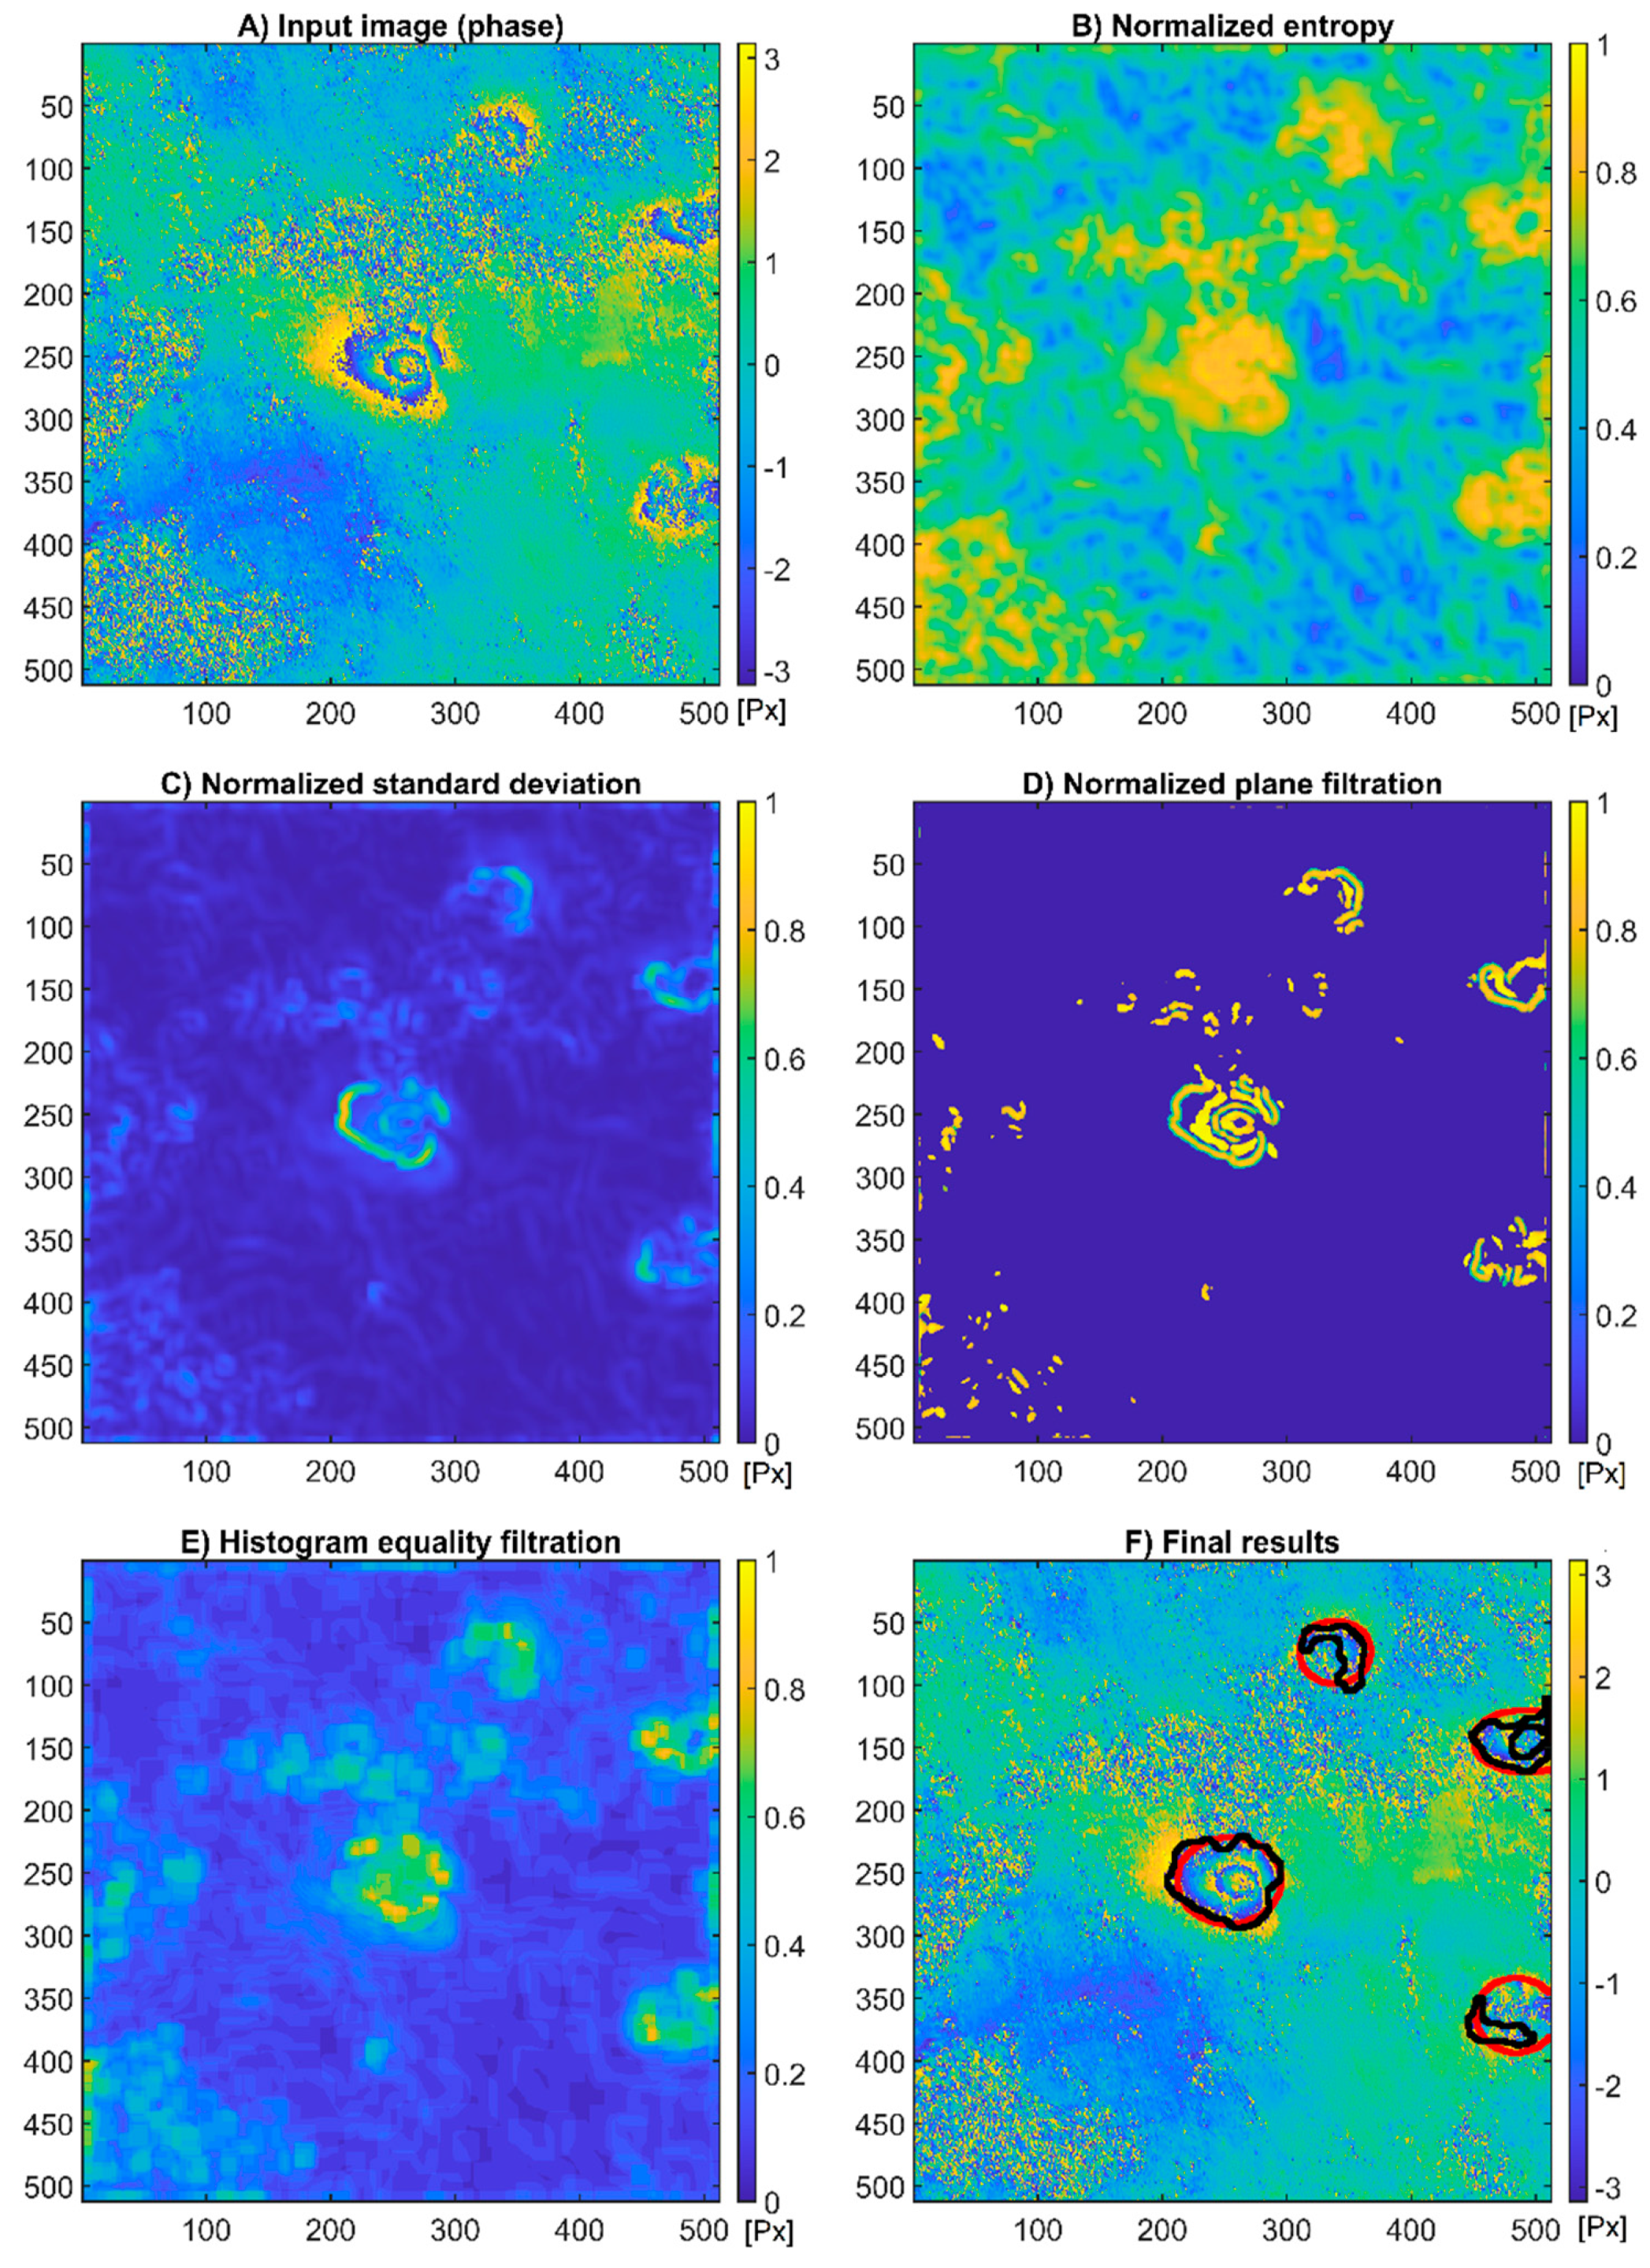
Figure 6 shows an interferogram with four subsidence areas of various degrees of development and noise. Those areas were identified manually and marked with a red line (
Figure 6F). In the central part of the interferogram, there was a well-developed trough with two clearly marked phase jump lines—phase value changes from
to
. In the east and northeast part, three more troughs were visible, but they were fragmentary and noisy.
Figure 6B–E show the results of each of the four algorithm operations. Apart from the true detections, the particular operations also indicated areas without subsidence. The areas incorrectly classified as subsidence troughs were either small or fragmented. Fragmented areas were weakened in the final image construction phase. Single, small areas classified as troughs were removed as a result of the final image postprocessing. The result of the subsidence detection algorithm operations is marked in
Figure 6F with a black line.
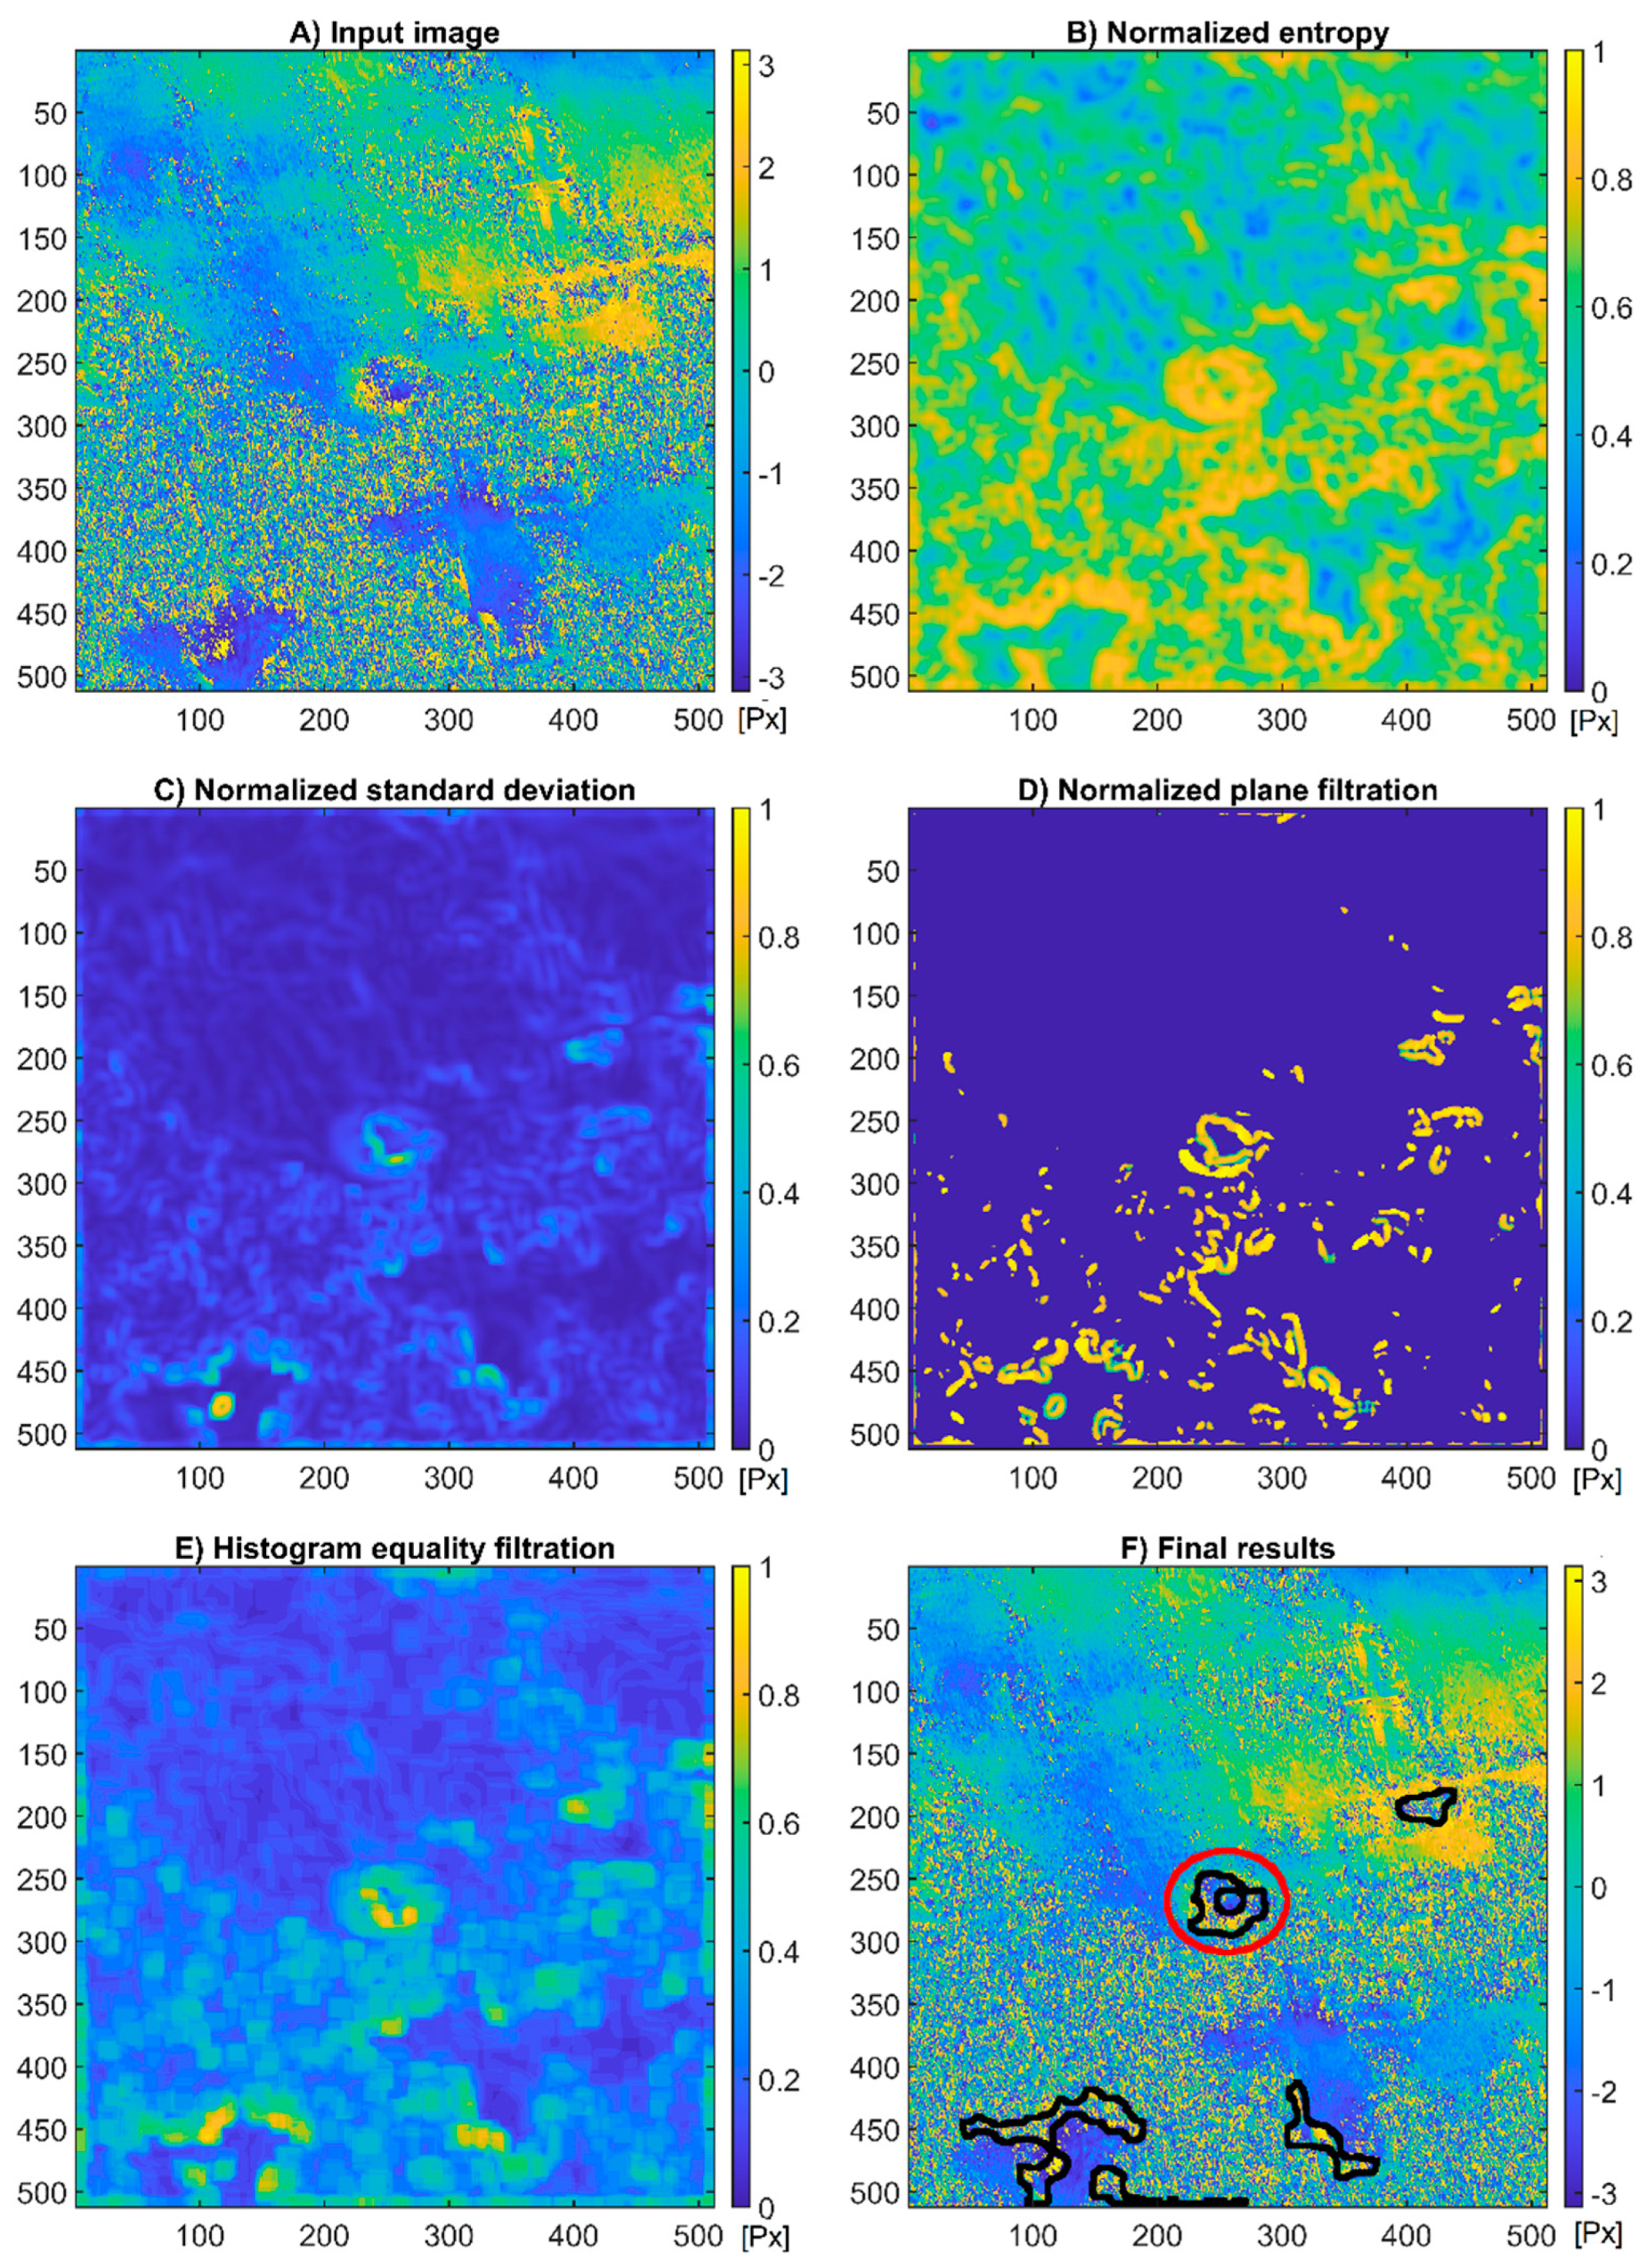
In the case of very noisy images (
Figure 7), the algorithm correctly classified subsidence areas. The algorithm detections contained all true detections as well as false detections (
Figure 7). It occurred when uniform areas lay close to noisy areas. In
Figure 7A,F, uniform areas with a low phase value were visible in the southern part of the interferogram (vast, blue areas), whereas uniform areas with high phase values, marked with a yellow line, were found in the northeast part.
The incorrect classification was due to the low-pass filtration, which resulted in the formation of areas with a linear phase change at the junction of uniform value zone and the high noise area. These areas can be approximated by a plane equation.
Figure 7 shows a detection result for a very noisy interferogram, where apart from the existing trough in that area (red line), four other areas were incorrectly classified as subsidence troughs.
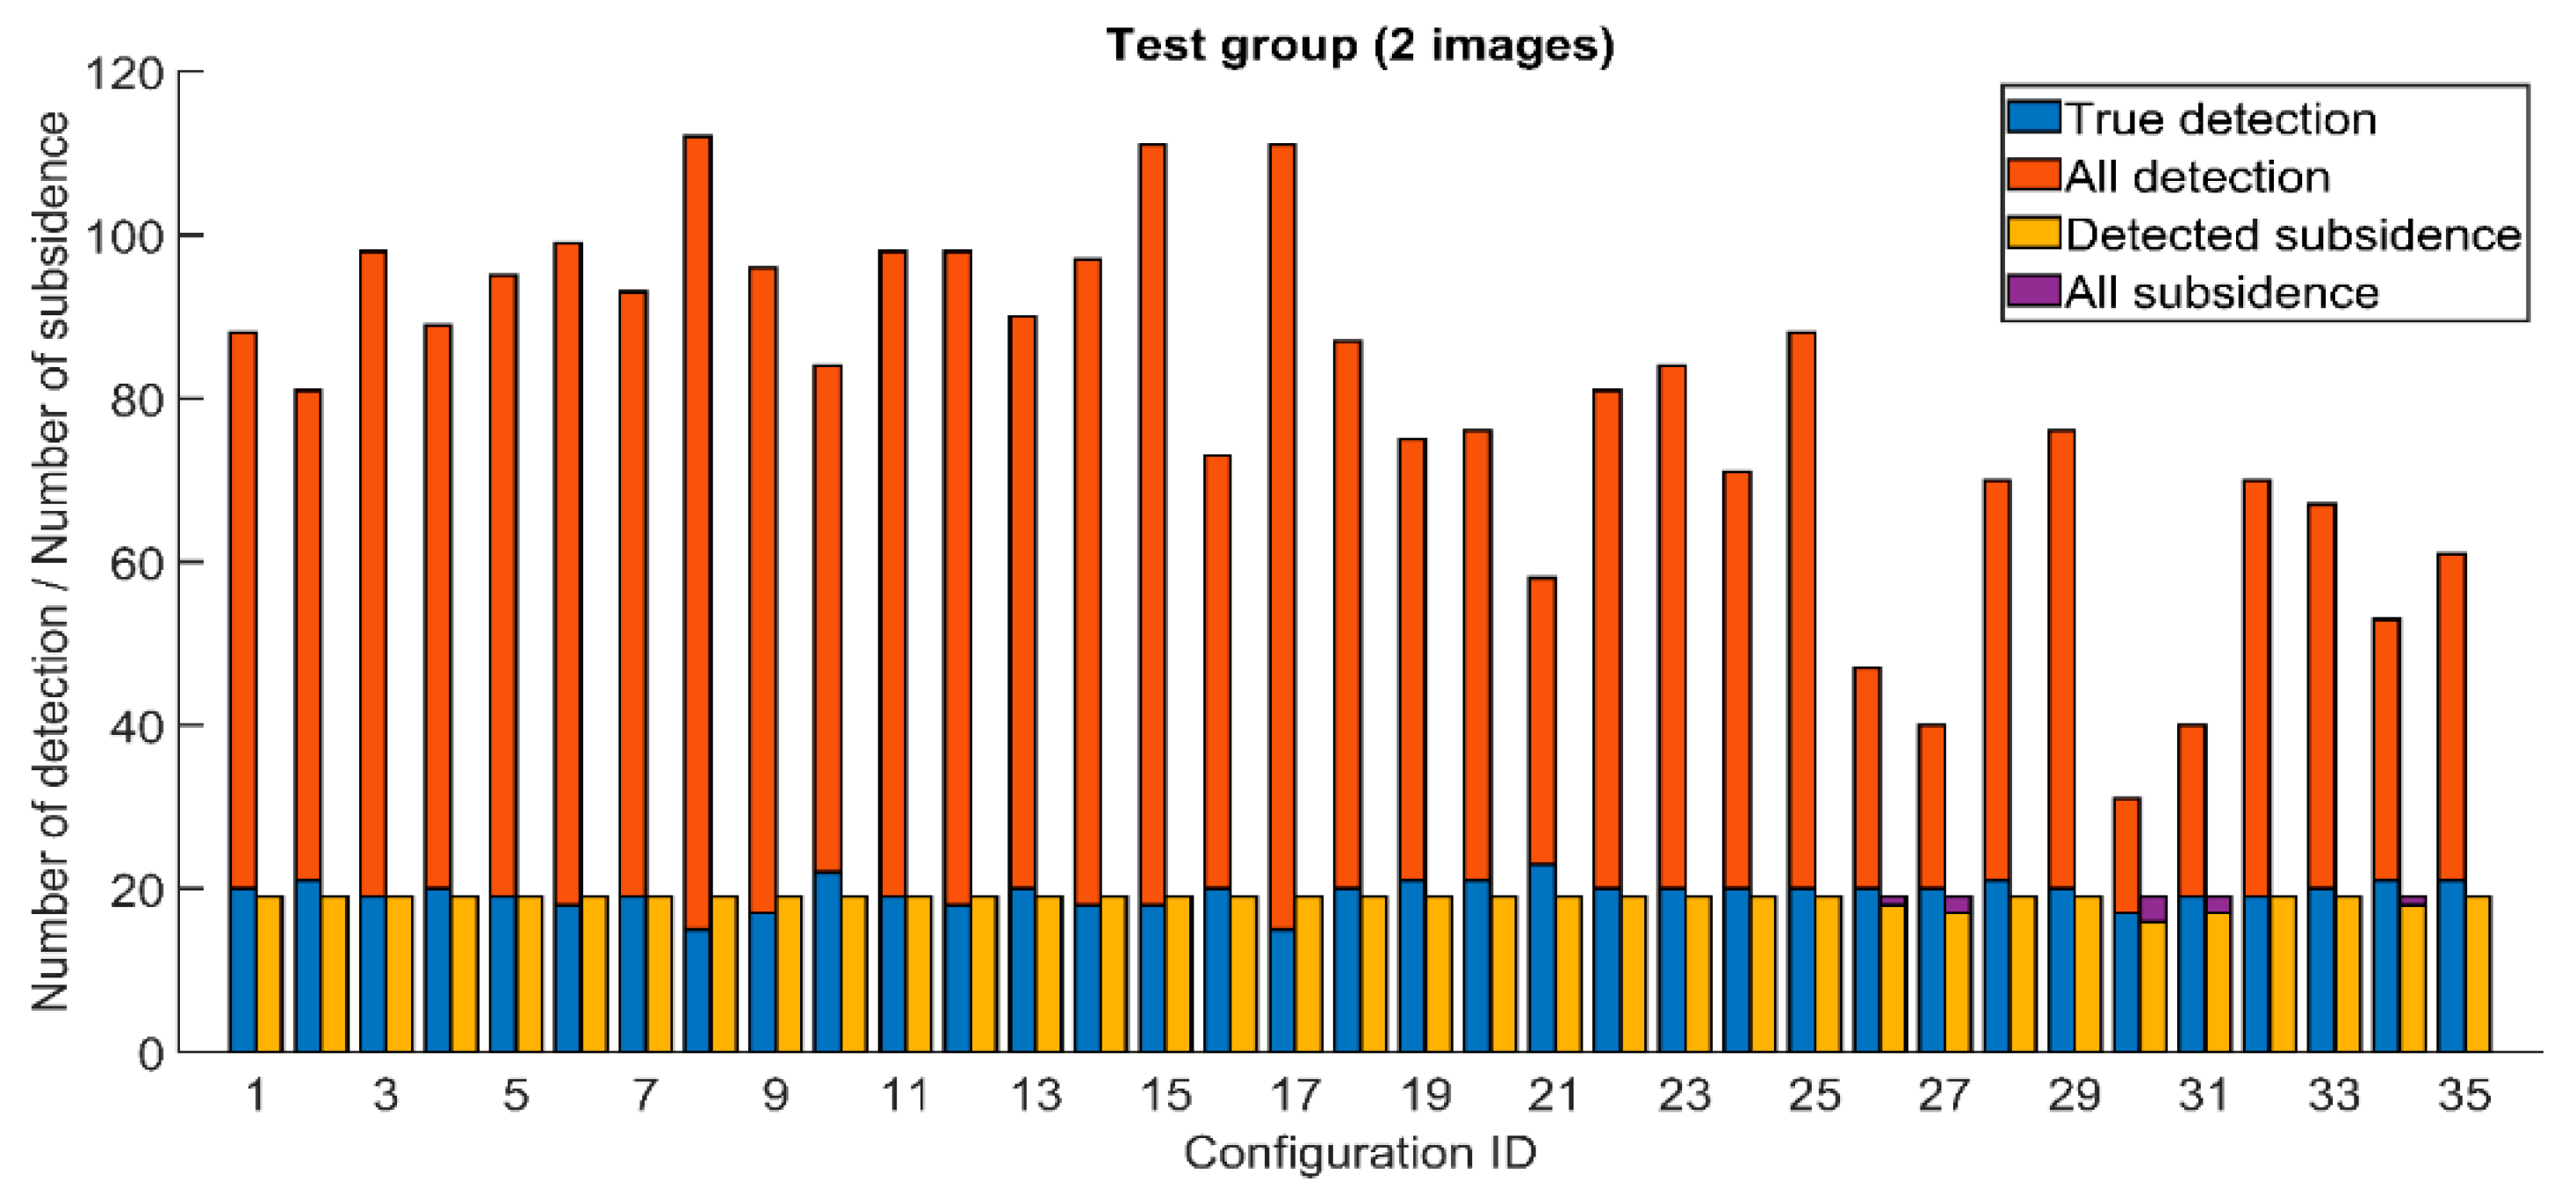
3.2. Aplication of the Proposed Algorithm for the Second Dataset Covering a Large Area
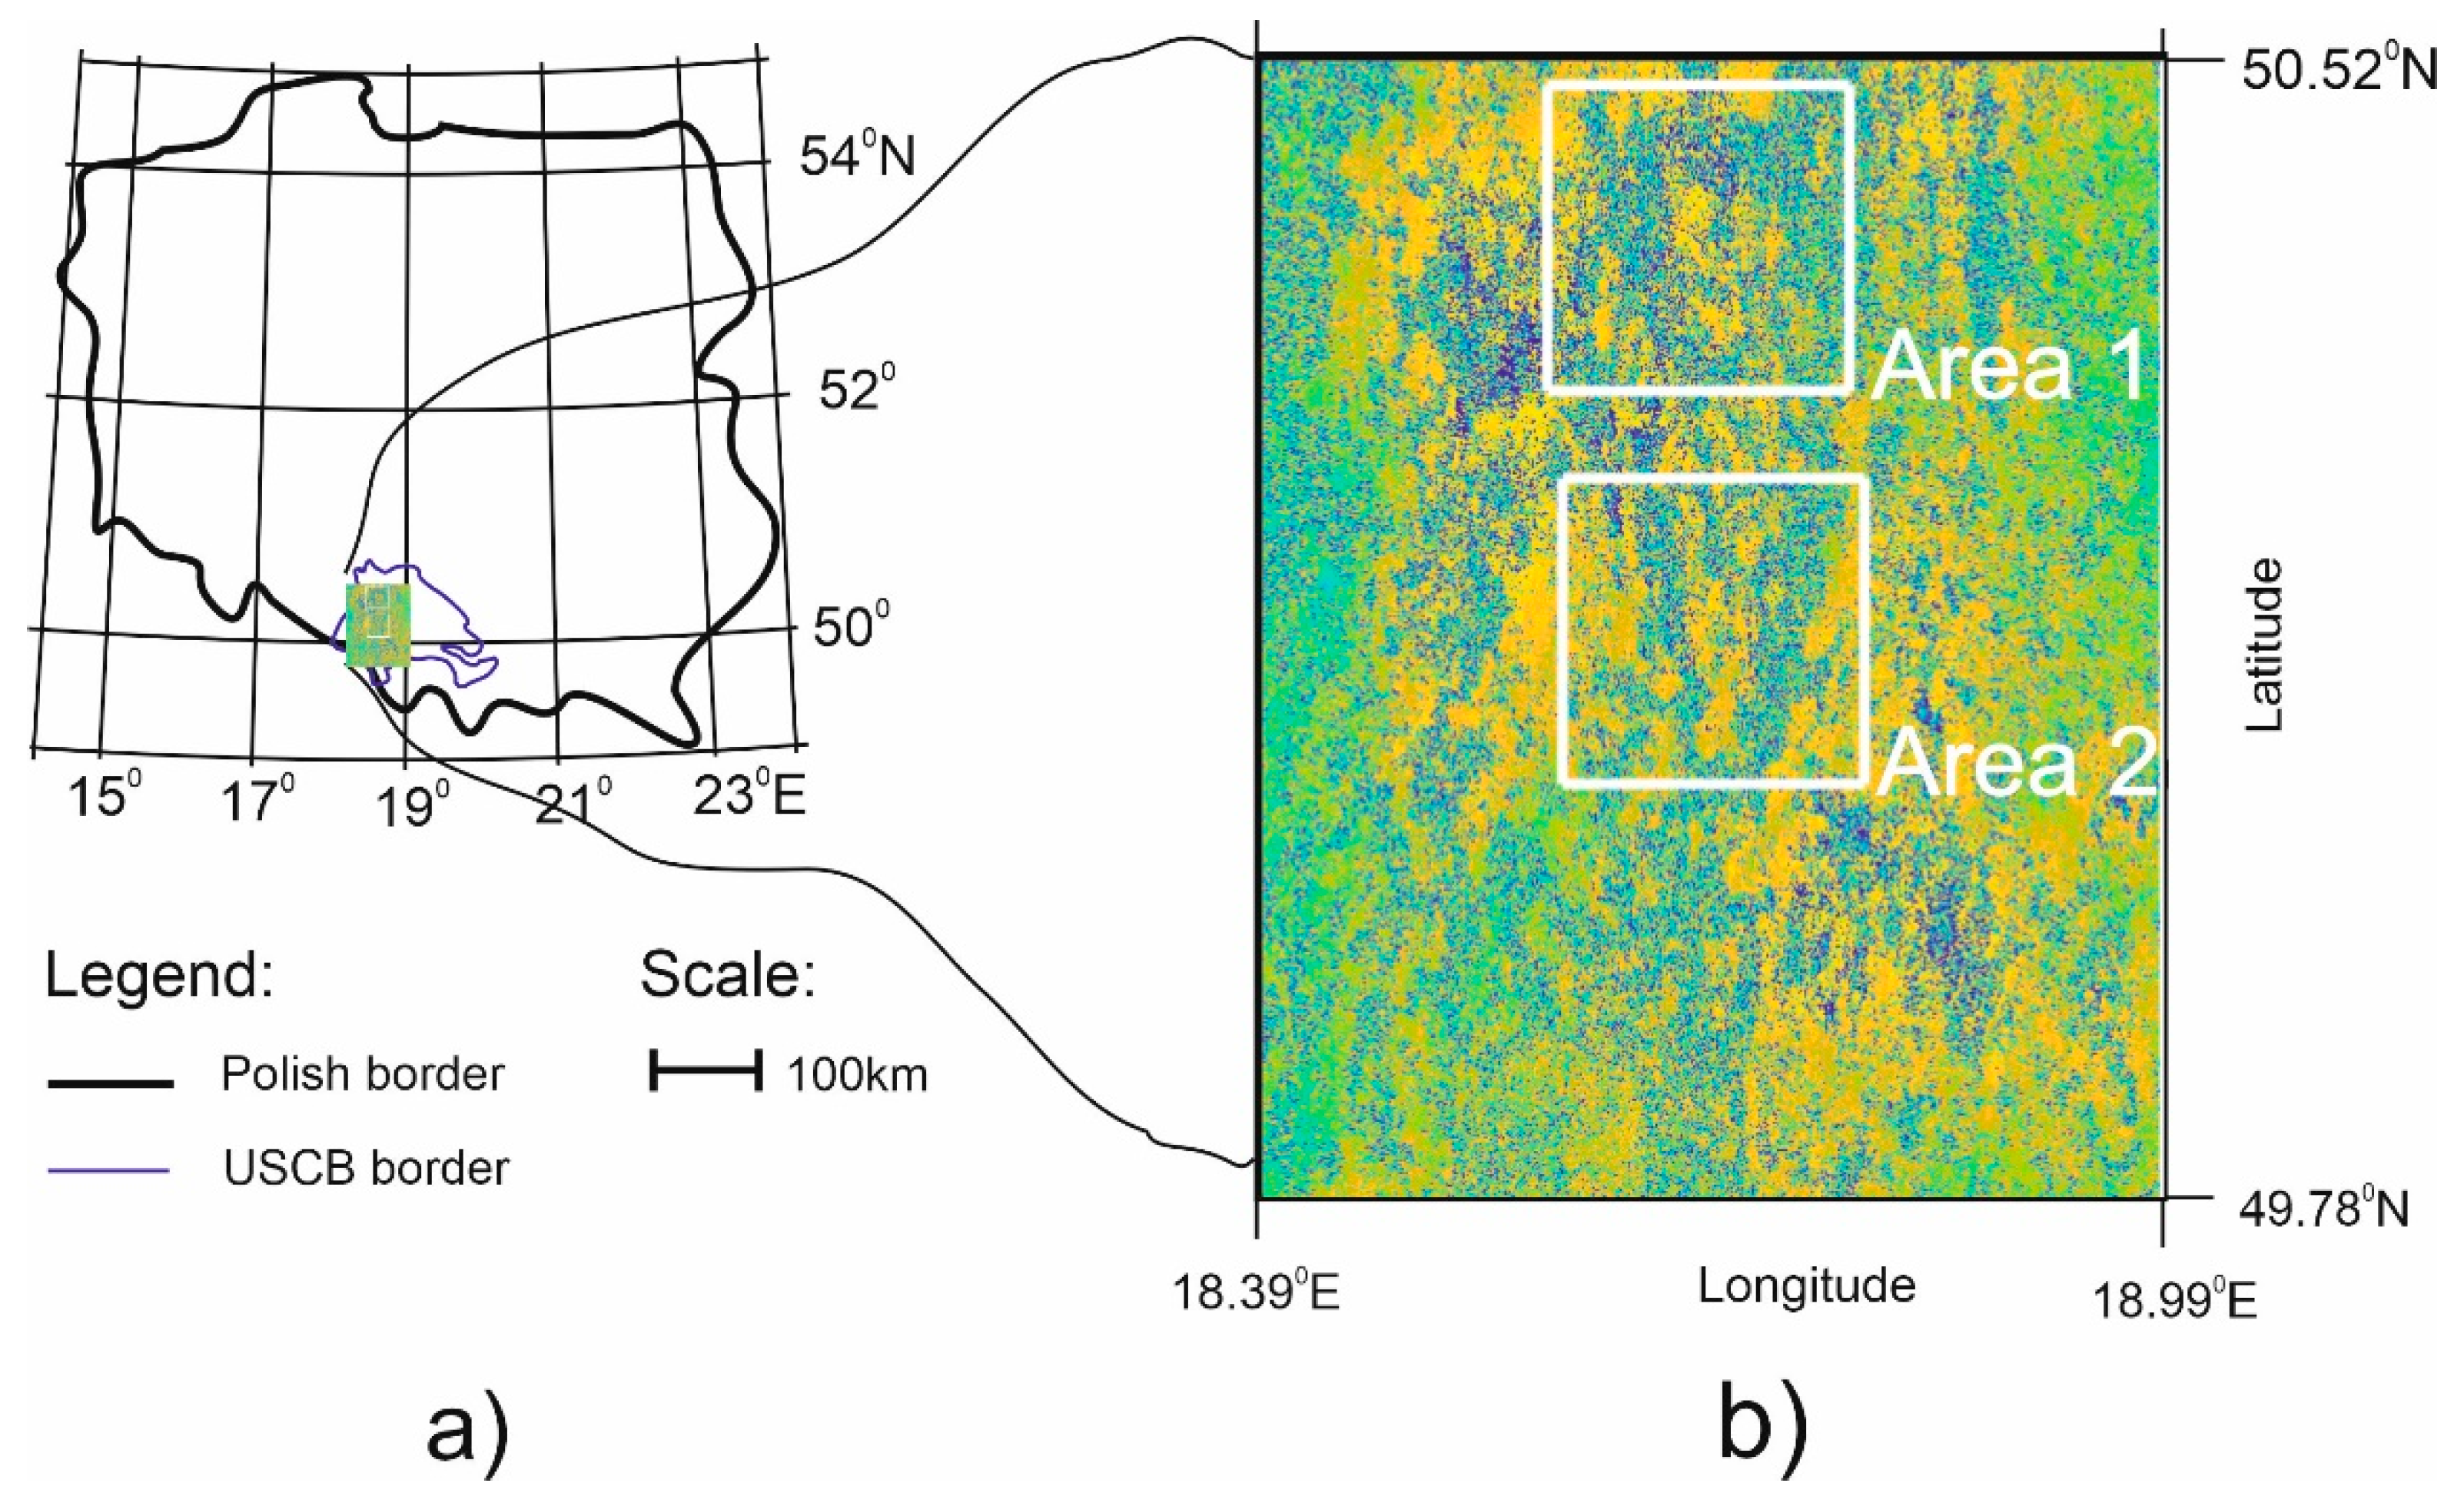
The subsidence detection algorithm was also tested for a test set covering a large area. The tests were carried out on two large (1400 × 2000 px each) interferograms (Area 1 and Area 2) with a high concentration of subsidence troughs. The interferograms were computed from images recorded for the Upper Silesian Coal Basin (USCB). The location of the USCB in Poland is shown in
Figure 8.
Like for the test set containing a lot of small sections, the test stage was preceded by a manual location of subsidence visible in the interferograms. As a result, 19 subsidence areas were identified and marked. Like for the first set, 35 combinations of the parameter values shown in
Table 1 were tested. The results are presented in
Figure 9.
For the majority of the tested parameter combinations (30 out of 35), all the existing troughs were detected (
Table 1). The results of the algorithm efficiency obtained for particular parameter combinations differed in the number of classified areas as subsidence areas and in the number of false detections. The 100% efficiency of the algorithm was also related to the increase in the false classifications. In test set 1, 48% of the detections made by the algorithm were incorrect. In test set 2, that figure was 73%.
Figure 10 shows the results of the analysis of particular algorithm operations for parameter configuration 21. When tested with the use of this parameter combination, the algorithm showed 100% detection efficiency, maintaining the lowest number of incorrect detections out of all the analyzed cases (35 out of 58).
In the analyzed image, both manually located troughs and the algorithm-detected troughs were concentrated mainly in the middle lane of the image. Most of the false detections occurred in high-noise parts surrounded by areas of uniform phase values.
4. Discussion
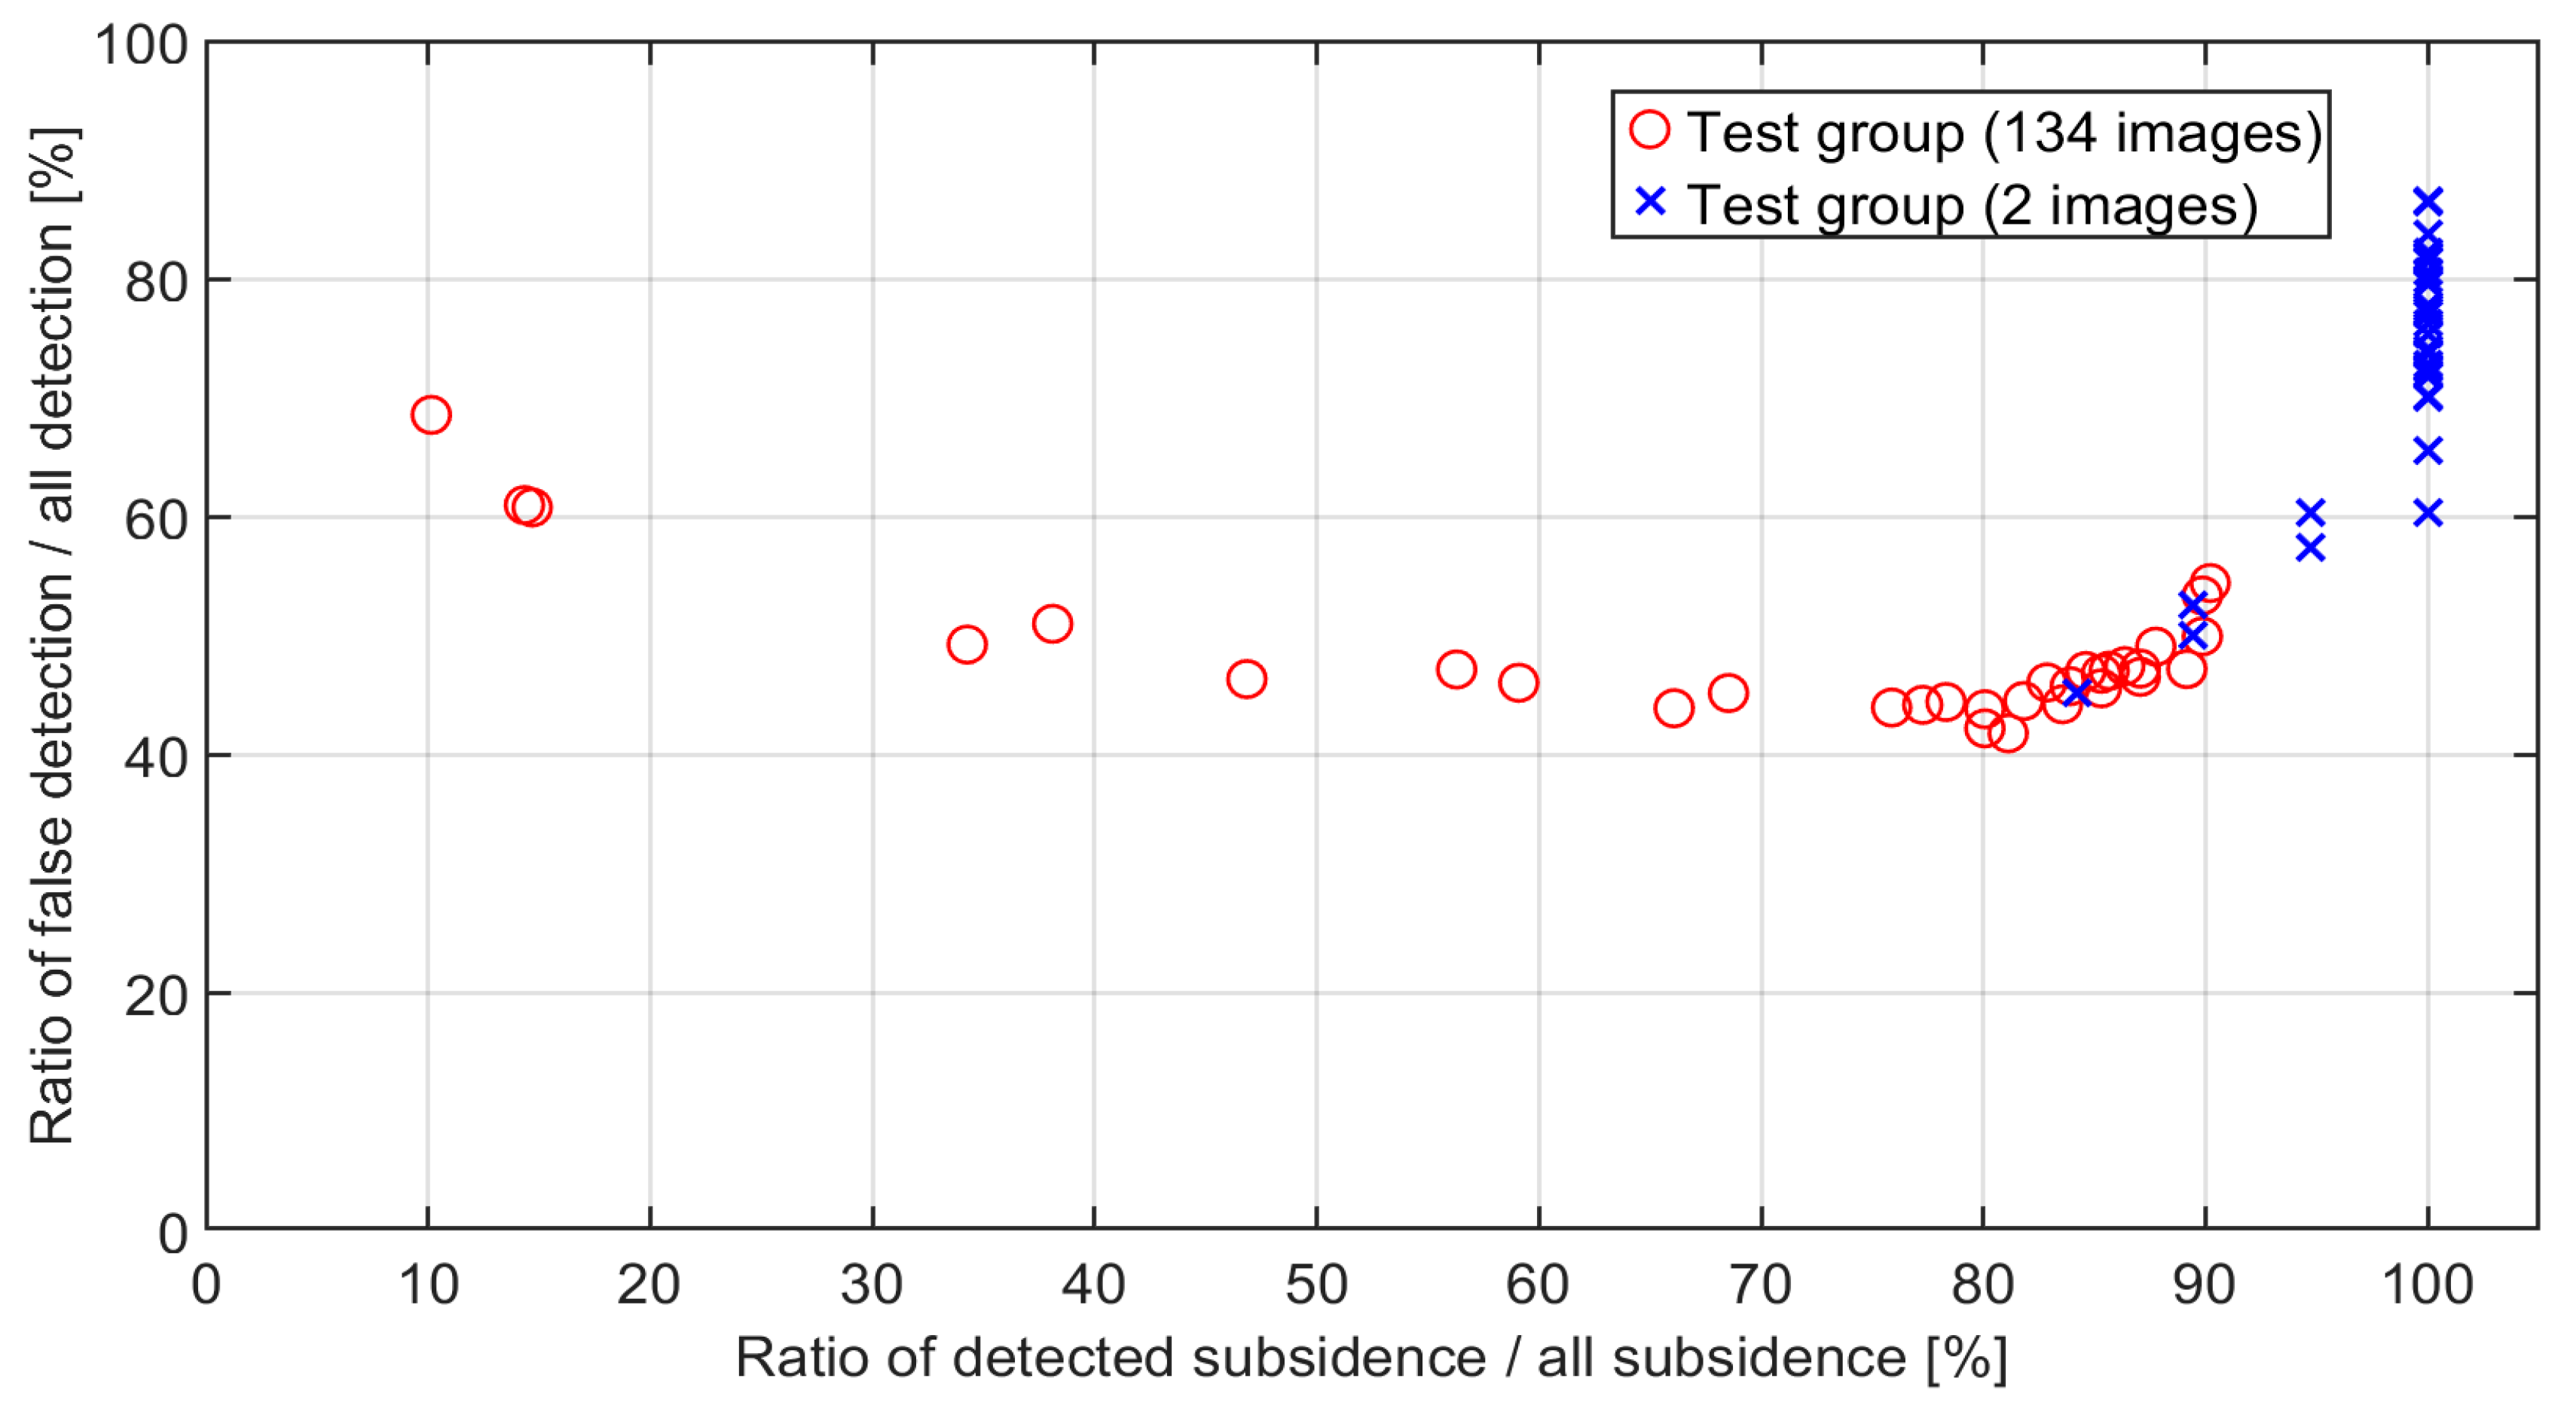
The efficiency of the subsidence detection algorithm depends on the parameters describing its operations. The research carried out in this paper showed that for both test sets there were parameter value combinations that ensured very high efficiency in subsidence detection. One optimal parameter combination that would guarantee high efficiency for both test sets was not found. The comparison of the subsidence detection results for both test sets is shown in
Figure 11.
The graph shows the relationship between the percentage of the correct classifications of subsidence and the percentage of the incorrect classifications of the interferogram fragments as subsidence areas. The comparison was made for both test sets and for all the parameter combinations that determine the efficiency of the algorithm. The results obtained for both datasets are characterized by a different dynamic of change, which may indicate that both sets were disjoint and there was no one optimal algorithm parameter combination that can be used for any test set that would guarantee satisfactory efficiency in trough detection. The selection of the optimal parameter value combination should be made individually for each area.
As the algorithm efficiency increased so did the percentage of areas that the algorithm incorrectly classified as subsidence. It was observed that the false detections were of the same nature in both test sets. The vast majority of them occurred at the boundaries of noisy parts surrounded by uniform areas with the phase value amounting to or . A considerable percentage of false detections also occurred when small areas of a constant phase value were surrounded in the interferogram by noisy areas.
The efficiency of the algorithm was low when troughs were located in noisy interferogram fragments or if the phase change line from to was not fully formed.
5. Conclusions and Further Works
The algorithm presented in this article is highly efficient in subsidence detection. It was proved that for both test sets, there was a parameter combination for which the algorithm showed 80–100% subsidence detection efficiency with 40–50% false alarms. The application of the algorithm made it possible to considerably decrease the area that would have had to be controlled manually. It should be emphasized at the same time that due to the cyclical nature of the study and the fact that a subsidence process is long, a false detection in one test does not preclude correct ones in subsequent tests. It particularly applies to high-noise areas that either imitated subsidence or made it impossible to detect it correctly.
What helps to reduce the area for manual analysis is also the fact that both correct detections and false alarms are concentrated in small areas. In such a case, it is vital that the number of detections are not significantly higher than the actual number of subsidence troughs.
The method also showed that its parameters should be adjusted to the parameters of the area. It was proved that thresholding and pre-filtering are of huge importance. In the next stage, the authors plan to create a method of automated parameter selection for particular areas (subareas) and to refine the method of false detection elimination by adding other verification methods such as machine learning algorithms.
Author Contributions
Conceptualization, M.D., A.F., J.B.; methodology, M.D.; software, M.D.; validation, M.D., A.F., J.B.; formal analysis, M.D., A.F., J.B.; investigation, M.D., A.F., J.B.; resources, J.B.; data curation, M.D., A.F., J.B.; writing—original draft preparation, A.F.; writing—review and editing, J.B.; visualization, M.D., A.F.; supervision, J.B.; project administration, A.F.; funding acquisition, M.D., A.F., J.B. All authors have read and agreed to the published version of the manuscript.
Funding
This work was supported by the Faculty of Geology, Geophysics and EnvironmentalProtection, AGH University of Science and Technology, as a part of statutory project.
Institutional Review Board Statement
Not applicable.
Informed Consent Statement
Not applicable.
Data Availability Statement
The data can be accessed upon request from any of the authors.
Conflicts of Interest
The authors declare no conflict of interest.
References
- Gupta, R.P. Remote Sensing Geology, 3rd ed.; Springer: Berlin, Germany, 2017. [Google Scholar]
- Sedighi, M.; Arabi, S.; Nankali, H.R.; Amighpey, M.; Tavakoli, F.; Soltanpour, A.; Motagh, M. Subsidence Detection Using InSAR and Geodetic Measurements in the North-West of Iran. In Proceedings of the 2009 Fringe Workshop, Frascati, Italy, 30 November–4 December 2009. [Google Scholar]
- Porzycka, S.; Strzelczyk, J. Preliminary results of ground deformations monitoring within mining area of “Prosper-Haniel” coal mine. In Proceedings of the 12th International Multidisciplinary Scientific GeoConferences (SGEM), Albena, Bulgaria, 17–22 June 2012; pp. 895–899. [Google Scholar]
- Lu, Z.; Dzurisin, D. InSAR Imaging of Aleutian Volcanoes: Monitoring a Volcanic Arc from Space; Springer Science & Business Media: Chichester, UK, 2014. [Google Scholar]
- Stramondo, S.; Chini, M.; Bignami, C.; Salvi, S.; Atzori, S. X-, C-, and L-band DInSAR investigation of the April 6, 2009, Abruzzi earthquake. IEEE Geosci. Remote Sens. Lett. 2010, 8, 49–53. [Google Scholar] [CrossRef]
- Nádudvari, A. Using radar interferometry and SBAS technique to detect surface subsidence relating to coal mining in Upper Silesia from 1993–2000 and 2003–2010. Environ. Socio Econ. Stud. 2016, 4, 24–34. [Google Scholar] [CrossRef]
- Porzycka-Strzelczyk, S.; Rotter, P.; Strzelczyk, J. Automatic Detection of Subsidence Troughs in SAR Interferograms Based on Circular Gabor Filters. IEEE Geosci. Remote Sens. Lett. 2018, 15, 873–876. [Google Scholar] [CrossRef]
- Król, Ż.; Mikrut, S.; Gabryszuk, J.; Postek, P.; Mazur, A. Changes in the structure of land use in the areas of mining damage. Ecol. Eng. 2015, 44, 26–33. [Google Scholar] [CrossRef]
- Gamble, J.C.; Gray, R.E. Mine subsidence control. In General Geology, Encyclopedia of Earth Science; Springer: Boston, MA, USA, 1988. [Google Scholar]
- Kopeć, A.; Trybała, P.; Głąbicki, D.; Buczyńska, A.; Owczarz, K.; Bugajska, N.; Kozińska, P.; Chojwa, M.; Gattner, A. Application of Remote Sensing, GIS and Machine Learning with Geographically Weighted Regression in Assessing the Impact of Hard Coal Mining on the Natural Environment. Sustainability 2020, 12, 9338. [Google Scholar] [CrossRef]
- Klimczak, M.; Bała, J. Application of the Hough Transform for subsidence troughs detection in SAR images. In Proceedings of the 17th International Multidisciplinary Scientific GeoConferences (SGEM), Albena, Bulgaria, 29 June–5 July 2017; pp. 819–826. [Google Scholar]
- Huang, J.; Deng, K.; Fan, H.; Lei, S.; Yan, S.; Wang, L. An Improved Adaptive Template Size Pixel-Tracking Method for Monitoring Large-Gradient Mining Subsidence. J. Sens. 2017, 2017, 3059159. [Google Scholar] [CrossRef]
- Rotter, P.; Muron, W. Automatic Detection of Subsidence Troughs in SAR Interferograms based on convolutional neutral networks. IEEE Geosci. Remote Sens. Lett. 2021, 18, 82–88. [Google Scholar] [CrossRef]
- Bała, J.; Dwornik, M.; Franczyk, A. Automatic subsidence troughs detection in SAR interferograms using circlet transform. Sensors 2021, 21, 1706. [Google Scholar] [CrossRef] [PubMed]
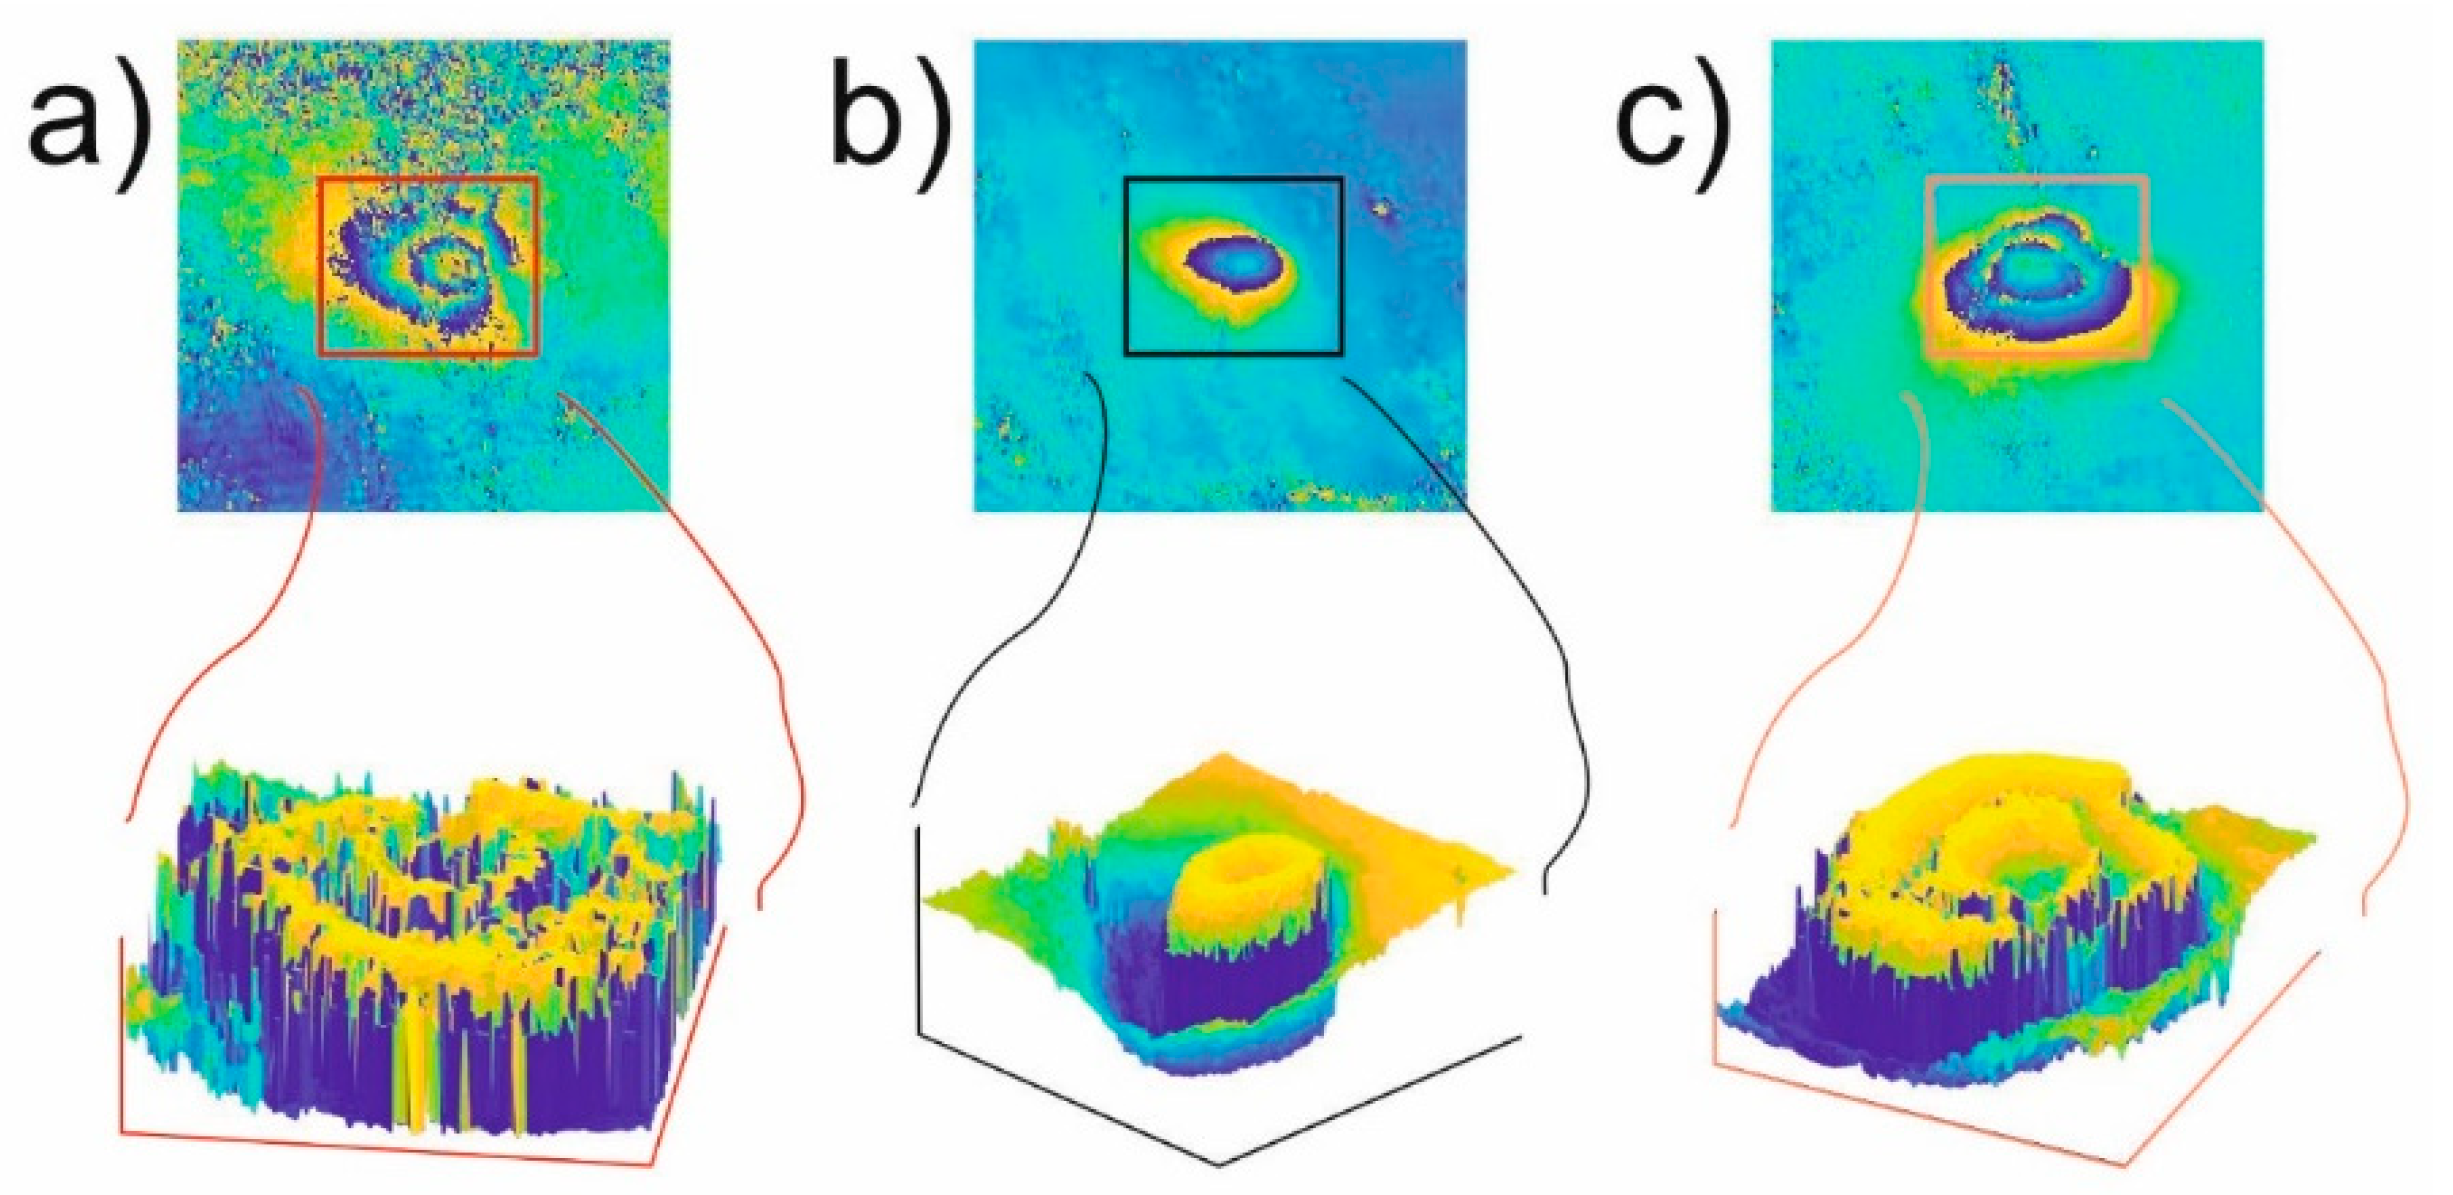
Figure 1.
Examples of subsidence troughs visible on interferograms computed for radar images recorded on 4 April 2017 and 16 April 2017 (a,b) and 24 December 2017 and 5 January 2018 (c) for the area of the Upper Silesian Coal Basin, Poland (Sentinel-1A, descending).
Figure 1.
Examples of subsidence troughs visible on interferograms computed for radar images recorded on 4 April 2017 and 16 April 2017 (a,b) and 24 December 2017 and 5 January 2018 (c) for the area of the Upper Silesian Coal Basin, Poland (Sentinel-1A, descending).
Figure 2.
An example of linear monotonic change of the phase value preceded by a step change in its value in interferograms computed from subsidence (a) and the random change of the phase value in interferograms characteristic for areas with no subsidence (b). The interferogram was computed from radar images taken on 4 April 2017 and 16 April 2017 for the area of Upper Silesia.
Figure 3.
Working principle of the algorithm detecting subsidence troughs in interferometric images.
Figure 3.
Working principle of the algorithm detecting subsidence troughs in interferometric images.
Figure 4.
Fitting of interferogram fragments to the plane equation. White squares indicate significant monotonic phase value variability (a, b, and R2 values high enough). The a, b, and R2 values of the red square are too low. The presented fragment of the trough was located in the interferogram computed from the radar images recorded on 4 April 2017 and 16 April 2017 for the area of the Upper Silesian Coal Basin, Poland (Sentinel-1A, descending).
Figure 5.
Efficiency of the trough detection algorithm for the 134-element test set for all 35 combinations of parameter values (
Table 1).
Figure 5.
Efficiency of the trough detection algorithm for the 134-element test set for all 35 combinations of parameter values (
Table 1).
Figure 6.
An example of subsidence detection algorithm efficiency with a particular focus on the results of particular algorithm operations. The interferogram computed from the radar images recorded on 4 April 2017 and 16 April 2017 for the area of the Upper Silesian Coal Basin, Poland (Sentinel-1A, descending).
Figure 7.
Efficiency of subsidence detection algorithm with a particular focus on the results of its particular operations. The interferogram computed from the radar images recorded on 21 July 2017 and 2 August 2017 for the area of the Upper Silesian Coal Basin, Poland (Sentinel-1A, descending).
Figure 7.
Efficiency of subsidence detection algorithm with a particular focus on the results of its particular operations. The interferogram computed from the radar images recorded on 21 July 2017 and 2 August 2017 for the area of the Upper Silesian Coal Basin, Poland (Sentinel-1A, descending).
Figure 8.
Differential, unwrapped interferogram generated for recordings performed on 10 and 22 October 2016. It was computed from radar images of the Upper Silesian Coal Basin area, Poland (a). White squares in the interferogram (b) indicate areas with a high concentration of interferometric fringes. These two areas (Area 1 and Area 2) were selected for testing the proposed detection method.
Figure 9.
The result of the subsidence detection algorithm operations on a test set covering a large area for 35 parameter combinations.
Figure 9.
The result of the subsidence detection algorithm operations on a test set covering a large area for 35 parameter combinations.
Figure 10.
Example of trough detection algorithm with a special focus on the results of particular algorithm operations. The interferogram was computed for radar images recorded on 10 October 2016 and 22 October 2016 for the area of the Upper Silesian Coal Basin, Poland (Sentinel-1A, descending).
Figure 10.
Example of trough detection algorithm with a special focus on the results of particular algorithm operations. The interferogram was computed for radar images recorded on 10 October 2016 and 22 October 2016 for the area of the Upper Silesian Coal Basin, Poland (Sentinel-1A, descending).
Figure 11.
The comparison of the subsidence detection results for both test sets and all the parameter value combinations determining the algorithm efficiency.
Figure 11.
The comparison of the subsidence detection results for both test sets and all the parameter value combinations determining the algorithm efficiency.
Table 1.
Parameter values adopted at the stage of subsidence detection algorithm tests.
Table 1.
Parameter values adopted at the stage of subsidence detection algorithm tests.
| ID | Preprocessing | Thresholds | Plane Filtration | Hist | Sum | Final |
|---|
| | Med. | Wnr | Entr. | St. dev. | Size | Thresh | Weight | Class | Mult | Thresh | Area |
|---|
| 1 | 7 | 9 | 0.2 | 0.2 | 13 | 0.025 | 0.5 | 25 | S | 3 | 500 |
| 2 | 7 | 9 | 0.2 | 0.2 | 17 | 0.025 | 0.5 | 25 | S | 3 | 500 |
| 3 | 7 | 9 | 0.2 | 0.2 | 9 | 0.025 | 0.5 | 25 | S | 3 | 500 |
| 4 | 7 | 9 | 0.2 | 0.2 | 11 | 0.03 | 0.5 | 25 | S | 3 | 500 |
| 5 | 7 | 9 | 0.2 | 0.2 | 9 | 0.03 | 0.5 | 25 | S | 3 | 500 |
| 6 | 7 | 9 | 0.2 | 0.2 | 9 | 0.025 | 0.5 | 20 | S | 3 | 500 |
| 7 | 7 | 9 | 0.2 | 0.2 | 9 | 0.025 | 0.5 | 40 | S | 3 | 500 |
| 8 | 5 | 9 | 0.2 | 0.2 | 9 | 0.025 | 0.5 | 25 | S | 3 | 500 |
| 9 | 5 | 9 | 0.2 | 0.2 | 9 | 0.03 | 0.5 | 25 | S | 3.1 | 500 |
| 10 | 7 | 9 | 0.2 | 0.2 | 9 | 0.03 | 0.5 | 25 | M | 0.25 | 500 |
| 11 | 7 | 9 | 0.2 | 0.2 | 9 | 0.03 | 0.5 | 25 | M | 0.2 | 500 |
| 12 | 7 | 9 | 0.2 | 0.2 | 9 | 0.03 | 0.5 | 25 | M | 0.18 | 500 |
| 13 | 7 | 9 | 0.2 | 0.2 | 9 | 0.03 | 0.2 | 25 | M | 0.18 | 500 |
| 14 | 7 | 9 | 0.2 | 0.2 | 9 | 0.03 | 0.7 | 25 | M | 0.18 | 500 |
| 15 | 7 | 9 | 0.2 | 0.2 | 9 | 0.03 | 0.7 | 25 | S | 3.1 | 450 |
| 16 | 7 | 9 | 0.2 | 0.2 | 9 | 0.03 | 0.5 | 25 | S | 3.1 | 550 |
| 17 | 7 | - | 0.2 | 0.2 | 9 | 0.03 | 0.5 | 25 | S | 3 | 500 |
| 18 | 7 | - | 0.2 | 0.2 | 9 | 0.03 | 0.5 | 25 | S | 3.2 | 500 |
| 19 | 7 | 9 | 0.2 | 0.2 | 13 | 0.035 | 0.5 | 25 | S | 3 | 500 |
| 20 | 7 | 9 | 0.2 | 0.2 | 13 | 0.035 | 0.5 | 40 | S | 3 | 500 |
| 21 | 7 | 9 | 0.2 | 0.2 | 13 | 0.03 | 0.5 | 25 | S | 3.3 | 500 |
| 22 | - | 9 | 0.2 | 0.2 | 13 | 0.03 | 0.5 | 40 | S | 3 | 500 |
| 23 | - | 9 | 0.2 | 0.2 | 13 | 0.03 | 0.5 | 25 | S | 3 | 500 |
| 24 | 7 | 5 | 0.2 | 0.2 | 13 | 0.025 | 0.5 | 25 | S | 3 | 600 |
| 25 | 7 | 5 | 0.2 | 0.2 | 13 | 0.025 | 0.5 | 25 | S | 3 | 500 |
| 26 | 7 | 9 | 0.2 | 0.2 | 13 | 0.03 | 0.5 | 40 | S | 3.3 | 500 |
| 27 | 7 | 9 | 0.2 | 0.2 | 17 | 0.03 | 0.5 | 40 | S | 3.3 | 500 |
| 28 | 7 | 9 | 0.2 | 0.2 | 15 | 0.03 | 0.5 | 40 | M | 0.25 | 550 |
| 29 | 7 | 9 | 0.2 | 0.2 | 15 | 0.03 | 0.5 | 40 | M | 0.15 | 500 |
| 30 | 9 | 11 | 0.2 | 0.2 | 17 | 0.03 | 0.5 | 40 | S | 3.3 | 500 |
| 31 | - | - | 0.2 | 0.2 | 9 | 0.03 | 0.5 | 25 | S | 3.5 | 500 |
| 32 | - | - | 0.2 | 0.2 | 9 | 0.03 | 0.5 | 25 | S | 3.3 | 500 |
| 33 | - | - | 0.25 | 0.25 | 13 | 0.03 | 0.5 | 25 | S | 3.3 | 500 |
| 34 | - | - | 0.25 | 0.25 | 13 | 0.03 | 0.5 | 25 | M | 0.4 | 550 |
| 35 | - | - | 0.25 | 0.25 | 13 | 0.03 | 0.5 | 25 | M | 0.35 | 550 |
| Publisher’s Note: MDPI stays neutral with regard to jurisdictional claims in published maps and institutional affiliations. |
© 2021 by the authors. Licensee MDPI, Basel, Switzerland. This article is an open access article distributed under the terms and conditions of the Creative Commons Attribution (CC BY) license (https://creativecommons.org/licenses/by/4.0/).


