Abstract
Hydrogen production is a topical issue in an energy scenario where decarbonization is a priority, especially with reference to the transport sector that has a great weight on global emissions. Starting from this consideration, GIF (Generation-IV International Forum) investigated the possibility to produce hydrogen by nuclear energy. The “classic” strategy is based on the use of nuclear as energy source for the electrolysis; but on the medium-long term, a more sustainable and smart approach could be founded on the use of thermochemical processes (e.g., I-S) that require a direct coupling of a chemical plant to a nuclear reactor. In order to develop this strategy, it is mandatory to design and optimize all the key components involved in this complex plant. In this study, we developed the 3D-CAD and CFD models of the intermediate heat exchanger (IHX) installed in the Japanese HTTR nuclear power plant. This component is extremely important for both the safety of the two plants and the stability of the whole hydrogen production plant. Initially, our model (developed by AutoCAD 3D and implemented in Star CCM+) was validated on the basis of experimental data available in literature; then, an initial optimization of the IHX testing innovative materials, such as Alloy 617 and ODS–MA754, and a different primary coolant (supercritical CO2) was performed.
1. Introduction
Decarbonization is one of the main final targets in any field of energy production in the present and in the future decades. The contribution to CO2 footprint of all the most energy consuming human activities is not evenly distributed all around the world and one can recognize some peculiar patterns in those countries which are characterized by peculiar energy mix, like, as an example, countries in which nuclear and renewables play a strong role. One of the next steps of this innovation will consist in the switch from fossil fuel-based technologies to cleaner ones. In transport, it is possible to recognize this process in the rush for the development of new kind of engines that could exploit primary energy sources with low impact in terms of CO2 emissions and research and application focus on electric and hybrid vehicle as well as on fuels with a lower CO2 footprint.
In this frame, it is important to recall that hydrogen is an “energy carrier” and not a primary energy source and the effectiveness of its use as low impact fuel depends strongly on the technology which is used to produce the hydrogen itself, in order to generate a positive effect on transport, whose incidence is growing more and more [1,2,3].
It is essential to highlight that a great change is underway to solve the problem; there has been and there will be a great conversion of the automotive market from fossil fuels to electric. However, electric vehicle big issues such as “power to weight” ratio and development of “green” processes for batteries production are not yet fully addressed. For these reasons, it is useful to find alternative strategies to address these drawbacks. A potential solution comes out from the use of hydrogen as an innovative energy vector that could replace traditional fossil fuels.
Hydrogen has several interesting and peculiar characteristics. For example, it is easy to create combustible mixture with hydrogen, or it is interesting to evaluate the type of flame that is generated by the combustion. On the other hand, however, hydrogen has problems related to storage which is more complex when compared with other gases [4].
There is a worldwide interest in assessing the possibility of developing novel hydrogen processes that could fit to the energy profile of each single country, connected in a complex network of energy balance [5]. In Kaplan et al. [6], the authors claim that there are some available technologies that are not far from being already profitable, but also that cost-effectiveness strongly depends on prices of the heat sources, hydrogen and CO2 allowances, as well as on capital expenditures and on the costs related to carbon capture. The great commitment to R&D in the field of hydrogen is aimed at making it sustainable, in the medium and long term, the use of green hydrogen, also from an economic point of view, and, in this context, all current hydrogen production processes play a fundamental role [7,8].
As already recalled, a fundamental prerequisite is that hydrogen must be produced. This is possible by many different methods like traditional ones as water electrolysis [9] or methane steam reforming (that has the problems related to relevant quantity of CO2 produced [10]). We may use also thermo-electrolysis or photolysis; finally, with the aim of producing hydrogen through sustainable processes, nuclear power becomes equally interesting. In fact, in a global scenario which has as its main objective the decarbonization of the energy sector, GIF (Generation-IV International Forum) has identified several potential alternatives suitable for this purpose [11]. The selected nuclear plants will be used according to the logic by which not all the heat generated by the reactor’s cores will be used exclusively to produce electricity but will also have other applications (cogeneration approach). Nuclear power can be used to produce hydrogen if it is integrated as a thermal source in modified versions of the standard methods recalled before; alternatively, with the aim to further reduce global emissions, it is interesting to explore the possibility of using the heat extracted from the reactor’s core in the frame of innovative approaches as the I-S thermochemical process [12]. In this frame, HTR/VHTR, due to their features [11], may offer some advantages [13,14,15]. They could reach an efficiency, nearly 50% adopting a regenerative Brayton cycle. In addition, HTR/VHTR have the considerable advantage to have a high core coolant outlet temperature (even higher than 950 °C) that meets the requirements for many industrial applications, including the production of hydrogen by the I-S thermochemical process.
The I-S process is fundamentally based on three chemical reactions to dissociate water in hydrogen and oxygen; a large amount of heat and a lower electrical energy (equal to 20% of the total energy and necessary to activate all the components such as pumps, compressors, etc. needful for the system operation [3]) are used as “input” and the only “consumed” resource is water. If you look at the whole process as a “black box”, you see the “net” reaction 2H2O → 2H2 + O2: substantially, it is a cyclical process and does not generate any greenhouse gases. For these reasons, there is a great interest in developing nuclear technologies in order to make achievable and sustainable the production of hydrogen through this thermochemical process. The main I-S process steps are the following [3]:
- I2 + SO2 + 2H2O → 2HI + H2SO4 (exothermic reaction at around 20 ÷ 150 °C, known as Bunsen reaction).
- HI and H2SO4 are then separated by distillation or liquid/liquid gravity separation.
- 2H2SO4 → 2SO2 + 2H2O + O2 (endothermic reaction at around 800 ÷ 1000 °C).
- Water, SO2, and residual H2SO4 must be separated from the oxygen byproduct by condensation.
- 2HI → I2 + H2 (endothermic reaction at around 300 ÷ 500 °C).
- Iodine and any accompanying water or SO2 are separated by condensation, and the hydrogen product remains as a gas.
It is precisely in this area that our research is placed; in fact, a fundamental component that allows to transfer the heat generated inside HTR/VHTR to the chemical part of the system is the Intermediate Heat Exchanger (IHX). It is essential not only because it is the interface between the chemical and nuclear parts of the plant, but also because it is the only component that physically separates them; so, it avoids that potential safety problems on the chemical side could affect the nuclear one and vice versa. Furthermore, IHX is a key component in order to supply heat at the temperature levels required by the chemical part of the system.
A detailed description of the plant, which encompasses an accurate report of the materials, can be found in Hori [16] which is a review of the existing experimental facilities. In this paper, we primarily focus our attention on two of the most interesting ones:
- The first plant is the Chinese HTR-10 where an IHX is used to remove heat from primary helium that passed through the reactor. In this case, the heat exchanger shall be used with a different purpose: the primary helium that comes out from the reactor’s core would heat another gas (nitrogen) and then, this secondary fluid, would flow inside a turbine to produce electric energy [17].
- The second plant takes on a more prominent role in our research because it is the one that we have focused on in our studies; in particular, we have considered the IHX installed inside the HTTR Japanese test reactor (Figure 1).
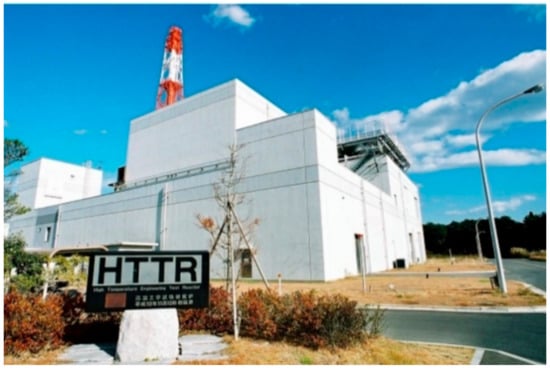 Figure 1. HTTR nuclear plant.
The HTTR is a high temperature, gas cooled (helium) test reactor that produces 30 MWt in its core. This experimental plant has been designed with the idea of being coupled with a chemical plant through a vertical counterflow helical coil heat exchanger. Its main specifications are reported in Table 1.

Table 1.
Specification of coolant of the IHX [18].
It is important to note that in the Japanese case, the experimental prototype is the entire facility: For this reason, the researchers of JAEA were able to test performances and to reproduce components for the commercial applications; besides, they published very useful experimental results together with technical datasheets with geometrical dimensions.
As partially shown in Figure 2, primary helium enters from the bottom of the heat exchanger and flows upwards inside the inner shell. Then, fills the lower dome and rises upwards in the space between the central duct and the external insulation. In this way, primary helium flows to the top of the heat exchanger lapping the helical bundle and then fills the upper dome. There, it is forced to flow out through a manhole on the left side of the external vessel directed to the PGC (Primary Gas Circulator). Helium backs then from the PGC, flows downward through the gap between the internal and external shell until it reaches the bottom of the component again and returns to the nuclear plant. On the other side, secondary helium enters from the top of the component in the gap between the central duct and the upper dome, flows downward to the cold head through the collector and, by means of perforated plates, is distributed inside the tubes. The gas flows down inside the helical coil absorbing heat from primary helium, increases its temperature, and at the bottom of the component reverses its motion thanks to 90-degree curved fittings. In this way, it returns back to the top of the heat exchanger and flows out through the central duct directed to the chemical plant [16]. As mentioned before, this component was installed inside the nuclear plant and the entire system was tested to verify different performances including those of IHX. First of all, the helical coil’s material was tested to verify the correct thickness to adopt for them [19]. Then, the next two different periods of operation (30 and 50 days) were started in sequence. The first one had an objective to verify the minimum-security requirements of the plant, while the second one wanted to demonstrate the possibility of the practical use of the system. Interesting data were obtained from the 50-day operational test but just in terms of the thermal power disposed [20]. For the next validation phase and preliminary optimization, we refer to these data and, also, to the project ones. On the other hand, it is important to highlight the technical sheets we extracted from the literature to reproduce the 3D-CAD model of the IHX.
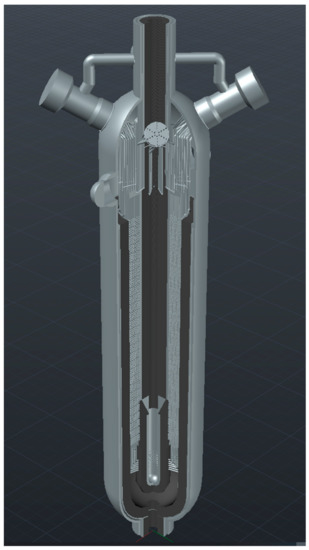
Figure 2.
Sketch of the Japanese IHX.
To obtain a comprehensive definition of the tridimensional models, the authors gathered data from many different papers to reproduce accurately the component (see, as an example, Takeda et al. [21]). Some sketches help us in modeling the hot head and its insulation thickness [22] and with the plates for enhancing heat exchange [18]. In our simulations, we assume to use this component coupled to a I-S thermochemical system; however, it is important to underline that this heat exchanger can be used for each application that required a high temperature reactor (HTR, VHTR) coupled with a high temperatures chemical process. Additionally, as detailed in the next paragraph, we have created the entire 3D-CAD IHX model and then we imported the parts of interest in a CFD software to simulate heat exchange, validating it and performing a preliminary optimization.
2. Materials and Methods
In this section, the main steps of the process for the development of the CAD and the CFD models of the IHX are presented.
2.1. 3D-CAD Modeling
To create the three-dimensional IHX model, it was necessary to use the sketches already presented also in addition to the geometrical information reported in some of the papers cited in the introduction section.
The heat exchanger was modeled by assembling its main parts, namely:
- Upper dome with manifolds, cold header, and perforated plates to distribute the secondary fluid.
- Lower dome with the two holes of the central duct for the inner and outer shells.
- Central duct with its insulant and its dimensional changes along the height.
- All the 96 helical coils with the heat exchange enhancing plates and the fittings tubes that connect the helical bundle to the cold head.
- Internal and external vessel with insulation and different manholes for different aims.
There were many critical issues to obtain these final results because, in the available sketches, there were not all the details needed for the accurate modeling. Nevertheless, by combining the available data from all the sources, a very accurate model of the IHX was created. It is interesting to notice that the material represented in a light color is the metal one while the dark one is the insulant.
Finally, it is important to highlight that we have deliberately left out some small details that would be much more significative in a structural analysis but that are not so relevant in a pure thermal fluid dynamic one. A global result is shown in Figure 3.
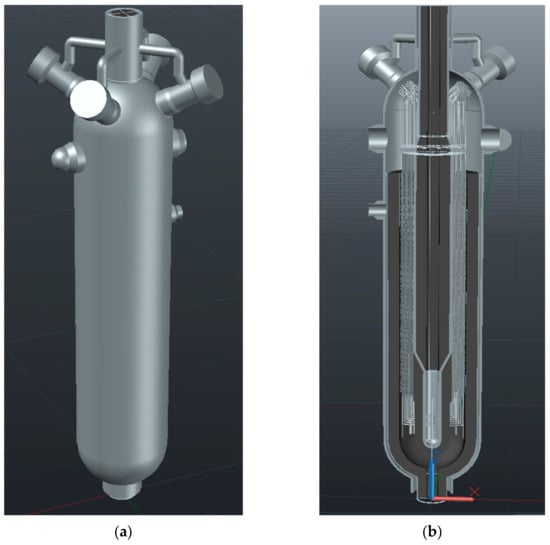
Figure 3.
(a) 3D CAD of the entire IHX; (b) Half IHX sectioned.
Having thus a complete model of the exchanger, it became possible to proceed with the creation of a CFD representative model that would help to replace the experimental simulations with the (cheaper and faster to set) numerical ones.
2.2. CFD Geometrical Model
The complete CAD model was partially imported in Siemens Star-CCM+ 2020.2 (Linux version) [23].
The first annulus of the primary side was defined as the reference model; this was enclosed between the central duct and the first plate for enhancing the heat exchange; all the 16 coils contained in it were explicitly included into the model (Figure 4).
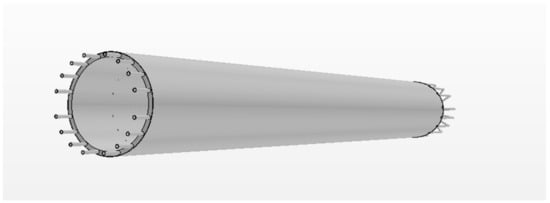
Figure 4.
First model of the heat exchanger.
In order to use this kind of geometrical input model to perform CFD simulations, we had to assume two simplifications (Figure 5):

Figure 5.
Modified model.
- We concentrated on a quarter of the heat exchanger, taking advantage of symmetry; so, we made a crosscut to isolate a single dial.
- We did not physically import the central duct and the external plate due to the boundary condition that we are to apply.
After the import in Star-CCM+, we created all the fluid’s volumes. Then, after having created the mesh on both fluid and solid regions and initialized the solution, unfortunately, some computational issues occurred; it is important to stress that, despite using a quite powerful workstation for performing these simulations (64 GB of RAM and 96 processors), just before the “launch” of the simulation, we had already occupied 40 GB of RAM memory. Hence, we chose to further reduce the model at the “minimal” representative unit of the IHX (Figure 6).
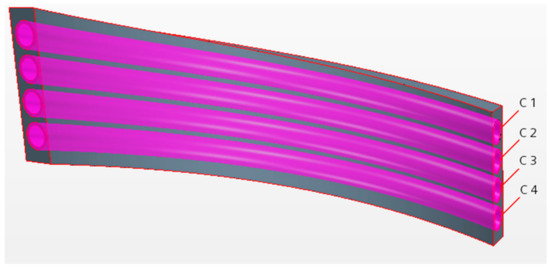
Figure 6.
Basic IHX reference module (where Cx is the secondary He channel n. x).
As consequence, the input geometrical model used for CFD is composed of 4 parts of helical coils, an external primary helium volume, and the internal secondary helium volumes (one volume of fluid per each tube), as shown in Figure 6.
In order to obtain significative results, we simulated this basic module in three significant positions of the heat exchanger:
- (a)
- The first one is at the bottom in correspondence of the hot head just over the 90-degree band where the temperatures are the highest.
- (b)
- The second one is in the middle of the IHX.
- (c)
- The last one was at the top of it, just below the coils exits, where the temperatures are the lowest.
In this way, although we have not been able to analyze the interaction between the fluids over the whole height, we still have a global view of the heat exchanger behavior.
In the following, we present only the results referred to the case (a); we chose this one for two reasons: the results, in term of validation, are the most significant; in addition, as told before, the next stage of optimization is based on the search of innovative materials suitable for high temperatures. Finally, it is important to highlight that results obtained for the other two cases will be anyhow presented in summary tables.
2.3. Calculations
This section reports the choices, the simplification, and the main assumptions which were made to perform a reliable computational thermal fluid dynamic analysis of each module of the heat exchanger. The commercial Siemens software StarCCM+ [23] was used to solve the standard Reynolds Averaged Navier Stokes (RANS) Equations for continuity, momentum, energy, turbulent kinetic energy, k and its dissipation ε, for discrete control volumes, at steady state conditions [24]. A long trial and error process led to the selection of the set geometry-mesh-boundary conditions that give a robust solution.
A preliminary refinement of the model was done, as soon as it was imported, thanks to the geometry refinement tools available in in Star-CCM+. Then, the mesh for the primary helium volume, the secondary helium volume, and for each coil was generated. For all the three modules in the three positions, the mesher set-up was the same.
The results are shown in Figure 7 where the focus is on a single coil and on its relative external and internal fluid regions.
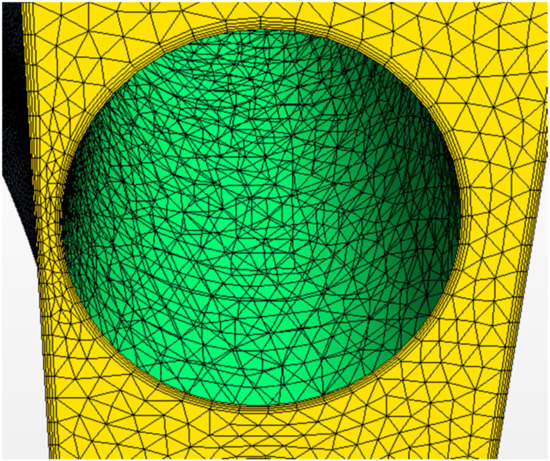
Figure 7.
A detail of the internal volume’s mesh.
For the external fluid, the base size of the cell is reduced from the standard measure (1 m) to 0.25 cm, the number of prism layers to 4, and thin layer to 3.
In this way, we created a correct number of cells in the gap between the coil and the central duct. The total number of cells for this volume was 1,961,611.
For the secondary helium inside the coils (Figure 8), we just changed the base size of the single cell to 0.04 m; we also increased the number of prism layer to 6. In this way, we have a high number of cells close to the wall and also thickness of each cell increases as we move away from the boundary. The models adopted in this case for the definition of mesh remain unchanged.
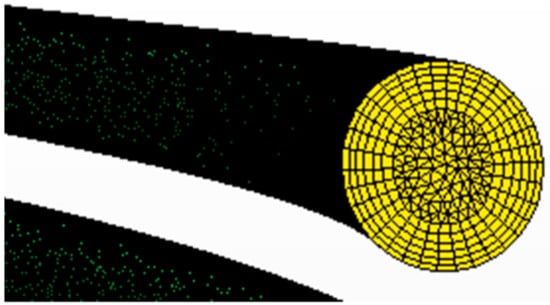
Figure 8.
A detail of the internal volume’s mesh.
The elements’ total number for all four volumes was 176,897.
For the coils, the base size of the element was reduced to 4 cm because of their complex geometry due to the small thickness. All the other properties have not been changed.
The number of elements was approximatively 23,000 cells for each coil (Figure 9).
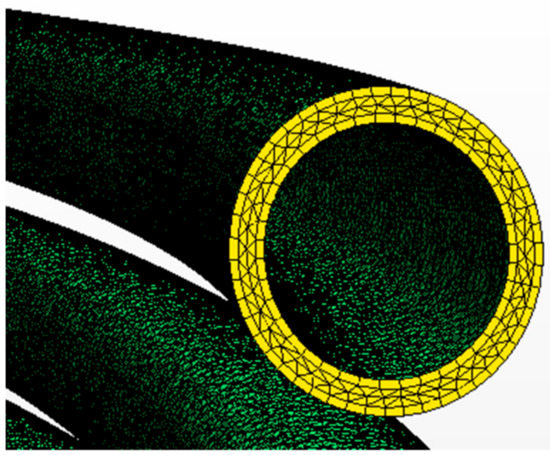
Figure 9.
A detail of the internal volume’s mesh.
Despite that the model we are studying is relatively simplified, the total number of cells (2,229,742) was not negligible.
Next, we move to the description of the physical properties adopted for the calculations.
For primary and secondary helium, we selected the gas properties from the standard library of Star-CCM+. In this way, all the main properties of the gas were automatically imported. After that, we chose the hypotheses to adopt:
- Stationary analysis.
- Tridimensional.
- Incompressible ideal gas with a reference pressure of 3.91 MPa for primary helium and 4.02 MPa for secondary helium. We considered the gas as incompressible; although, the variations of density with the temperature were not neglected.
- Turbulent regime simulated by the turbulence model “k-epsilon realizable two layer”. To choose the proper turbulence model, we performed a sensitivity analysis to identify the best among all the models available in the software.
- Segregated logic: to solve separately and sequentially the momentum and the mass conservation equations from the energy equation in order to minimize the RAM request.
- Segregated energy (i.e., to solve the energy equation with temperature as unknown parameter, to find the temperature values, and to replace them in the equation of state to identify the enthalpy values).
For the solids, such as coils and central duct, we introduced new material properties libraries, one for each specific material used for the IHX. In the initial case, we created the new material Hastelloy-X library by defining the material main properties: constant density, specific heat, and thermal conductivity variable with temperature. The relationships between these properties and temperature were found in the catalogues of the main manufacturers [25].
Subsequently, the assumptions we adopted are:
- Solid material with constant density.
- Stationary case.
- Tridimensional.
- Segregated solid energy.
Eventually, we assigned the helium physical model to the internal and external fluid volume, while for the coils and central duct, we selected the new solid material introduced before.
Later, we chose the initial condition to initialize the solution; in particular, we changed the initial temperature respectively to 670 and 580 °C for primary and secondary helium. In addition, we set an initial velocity value for both fluids according to the three vector components: primary helium moved upwards (so the only vector velocity component was the one along the z-axis), while secondary helium moved downwards but was also characterized by a contribution along the x-axis and y-axis due to the helical coil.
At this stage, it is important to illustrate which boundary conditions we adopted. They were different for each position.
To explain all the chosen BC, we present an image of the reference module (Figure 10) that has a numbering for each surface; thus, when we refer to each of the surfaces, we recognize them by the corresponding number.
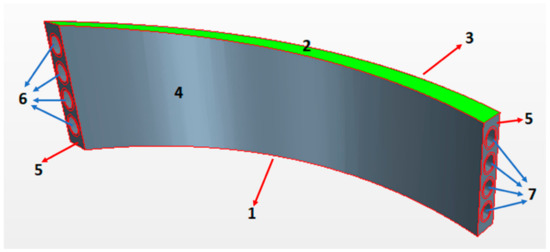
Figure 10.
Module with numbered surfaces (numbers are referred to different model zones).
For the module located at the bottom of the heat exchanger, we chose the following boundary condition:
- Primary helium surface facing downwards (1—Figure 10): for this surface, we chose the “mass flow inlet” boundary condition. We imposed the mass flow rate of primary helium (0.139 kg/s) and the inlet temperature (950 °C) defined on the base of the experimental data.
- Primary helium surface facing upwards (2—Figure 10): for this surface, we chose the “outlet” boundary condition; so, having assigned unit value to the split ratio, all the fluid is forced to exit through this section.
- Primary helium surface facing plates for enhancing heat exchanger (3—Figure 10): in this case, we chose an “adiabatic” boundary condition because we assumed that on the other side, there will be primary helium with about the same temperature and in the same quantity.
- Primary helium surface facing central duct (4—Figure 10): for this surface, we chose the “environment” boundary condition. With this particular BC, it is helpful to simulate a heat exchange with a region outside the computational domain. For this purpose, it was necessary to select different parameters: the temperature of the fluid in the external region (secondary helium at 580 °C); the thermal resistance (1.052 m2 K/W) generated by the central duct (55 mm of thickness with a thermal conductivity of 26.7 W/mK) and its insulation (210 mm of thickness with a thermal conductivity of 0.2 W/mK); also, the convection heat transfer coefficient (122.7 W/m2K) evaluated by Dittus–Boelter correlation referring to secondary helium at 580 °C and 4.02 MPa.
- Primary helium surfaces almost orthogonal to the coils (5—Figure 10): for these surfaces, we created a periodic contact. In particular, it was a roto-translational type; in this way, the program considered the helical coil without having been physically imported.
- Primary helium interfaces with coils: for these surfaces, no other boundary conditions were necessary except to create contact interfaces between fluid and solids.
- Secondary helium interfaces with coils: we created interfaces between internal fluid and each coil. No other conditions are needed.
- Secondary helium surfaces on the left side (6—Figure 10): for each surface of each hole, we assigned a “mass flow inlet” boundary condition. In this case, we knew the mass flow rate (0.035 kg/s), but we did not know the inlet temperature. To calculate it, we assumed the temperature trends as linear along the height of the exchanger: each fluid had a temperature variation from inlet to outlet of 560 °C and the logarithmic mean temperature in each section was 90 °C. For these reasons, we can evaluate the temperature in each section as:where the apex indicates the cold fluid, the total variation of temperature is 560 °C, and the number of modules is 27. So, in this way, the inlet temperature of secondary helium in this module is 839.3 °C.
- Secondary helium surfaces on the right side (7—Figure 10): these surfaces are the outlet of the secondary helium, so we applied an “outlet” boundary condition that has the same logic described for primary helium surfaces.
- Coil’s surfaces on right and left side of the module: as made for primary helium, for these solid surfaces, we created periodic contacts to recreate virtually the entire helical coil.
To be precise, we repeat the same description also for the other modules in other positions; in these cases, we present only the differences related to each module.
For the module located in the middle of the heat exchanger, all the types of boundary conditions remained unchanged. We modified the inlet temperature of both fluids (670 °C for primary helium, 580 °C for secondary helium) but we also added other periodic contacts. In particular, we virtually connected: inlet (zone 1—Figure 10) and outlet (zone 2—Figure 10) of primary helium with a translational periodic contact type while all the inlet and outlet surfaces of the secondary helium had a roto-translational periodic contact. In this way, we simulated the fluid motion as fully developed for both primary and secondary fluid. After that, we chose the correct interfaces that were generated; in particular, they were chosen as “fully developed interface” mass flow rate defined.
This was the correct way to also study the fluid dynamics and to understand how the fluid moves in the module; for the secondary helium, it was easy to imagine the results (because it is a fluid motion inside a tube), while for the primary helium, it was more complex due to the position of coils and also to the gap between them.
For the module located at the top of the heat exchanger, we had the same boundary conditions, interfaces, and periodic contacts as the bottom one. This was not a proper correct assignation because the fluid arrives as fully developed also at the top of the component. Due to some problems related to the temperature profiles that were created when we choose a periodic contact, we decided to remove these conditions with the aim to validate the heat exchange. The only changes we made are related to the inlet temperature of primary and secondary helium: primary fluid had 410.7 °C as inlet temperature while secondary helium had 300 °C.
3. Results
In this section, we present all the results by dividing them into two groups. In the first part, the results related to the validation process are reported; since, however, a real model of the heat exchanger already exists and it is working, we do not dwell on this part, but we present just the results for the module at the bottom of the exchanger because they are the most significant.
We analyze in a more detailed way the results related to the preliminary optimization process because they are instead totally new.
3.1. Validation
As mentioned before, in this section, the results related to the validation process are presented.
In the following, only a detailed analysis of the results obtained for the CFD calculations of the reference module placed at the bottom of the IHX is reported; we do not report the results for the other two modules positions because they look qualitatively very similar to the previous ones.
The first result that we point out is an inlet and outlet temperature contour of primary helium obtained on the corresponding surfaces (Figure 11).
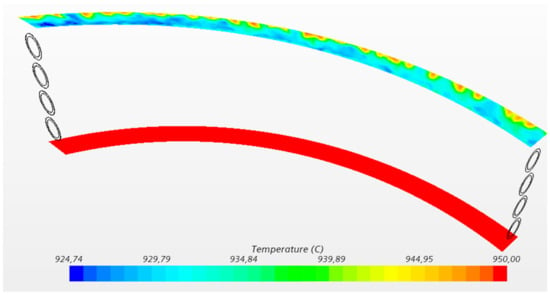
Figure 11.
Contour’s temperatures of primary helium.
As we can see, we have a uniform temperature profile on the inlet section due to the boundary condition imposed. While on the outlet section, we have a sort of temperature profile depending on the boundary condition imposed on the two lateral surfaces: primary helium came out hotter on the surface that is in contact with the adiabatic wall than to the opposite (non-adiabatic) one.
Looking at this contour, it is easy to define the inlet temperature but not the outlet one; for this reason, we evaluated the primary helium’s temperature by means of a temperature report weighted on the mass flow rate. We obtained an outlet temperature of 937.26 °C.
Likewise, we display the temperature results for the secondary helium with a contour on the inlet and outlet surfaces (Figure 12).
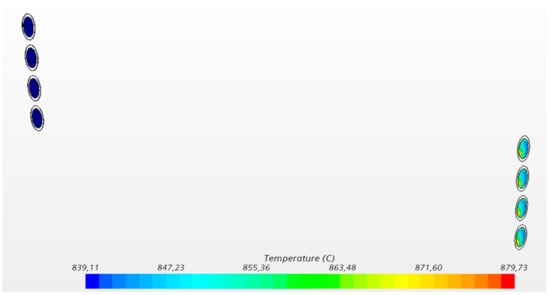
Figure 12.
Contour’s temperature of secondary helium.
We can notice that the inlet temperature is well defined by the boundary condition applied and the temperature profile is uniform. While on the outlet surfaces, we have a non-uniform distribution. So, we created a mass flow rate report by which we defined a mean outlet temperature of 851.7 °C.
To validate this model, we compared the obtained numerical results with the theorical ones evaluated with the linear distribution theory presented in the previous chapter. The theorical values were respectively 929.2 °C for primary helium and 860 °C for secondary helium. So, from the comparison of these, we can notice a non-negligible difference in the results.
These differences were caused by the fact that we neglected some important aspects:
- Radiant heat exchange.
In each simulation, we did not consider one of the mechanisms by which heat transfer occurs: radiant heat exchange. To evaluate this contribution, we performed a simplified analysis based on the thermal resistances as shown in Figure 13.
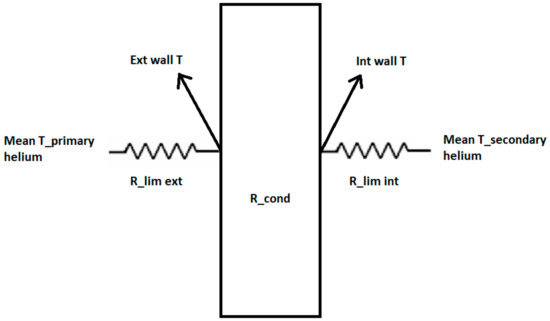
Figure 13.
Coil’s thermal resistances.
We evaluated the difference between the thermal transmittance calculated without and with the radiant contribution. As a first step, we measured the fluid temperatures of both fluids and they are reported in Table 2.

Table 2.
Average fluid temperatures.
The next step was to evaluate the thermal resistance on the internal and external side of the coil. The results are reported in Table 3.

Table 3.
Evaluation of thermal resistances.
Because the external resistance was bigger than the internal one, we introduced the apparent radiant heat transfer coefficient in that component. This coefficient was evaluated by the equation:
assuming a value of emissivity like 0.8.
With this method, we evaluated the new value of the thermal transmittance by the equation:
where the thermal conductivity was derived from the table of the material presented before.
The results are presented in the Table 4.

Table 4.
Evaluation of the new external resistance and total thermal transmittance.
We can observe that introducing this heat exchange mechanism reduces the difference between the numerical and theoretical temperature values. In fact, the primary helium exits colder than the value obtained before, while the secondary helium exits hotter due to the increase of thermal transmittance.
- Heat flux through the surface faced to the central duct.
Due to the boundary condition imposed, there was a heat flux from the circular crown of primary helium directed to the central duct through its material and its insulant (Figure 14).
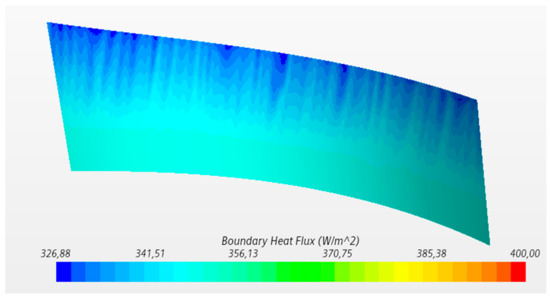
Figure 14.
Heat flux through the surface faced to the central duct.
This flux was evaluated by a report as thermal power and has been estimated to be 386.8 W. This means that a portion of the heat coming out of the primary fluid is given to the secondary helium rising in the central duct and not to that inside the coils.
To evaluate what was the loss, we changed the boundary condition on this surface and assigned an adiabatic one; we noticed a secondary helium temperature recovery of about 2 °C. This further reduced the difference between theorical and numerical values.
- Position of the coils inside the module.
During the 3D-CAD modeling phase, we chose to collocate the coils, not in the center of the circular crown, but closer to the wall faced to the central duct. Such a choice was made to simulate a critical heat transfer condition for the module.
In this way, there was a lack of uniformity in the heat exchange: only half of each coil’s surface exchanges properly. This fact can be highlighted by having a look at Figure 14; in fact, the temperature profile of the secondary helium in the outlet section reflected this aspect with its color graduated scale. In correspondence of the surface that exchanged less, the helium remained colder while it was warmer on the other part of the surface.
For this reason, we returned to the standard configuration with coils centered; in this manner, we simulated the correct thermal exchange and did not notice that all the surface of the coil exchanged better than in the previous case. Finally, we spotted that there was another recovery in term of secondary helium temperature of 2 °C.
By combining all the aspects mentioned above, the difference between the numerical result and the theorical one has been drastically reduced.
By this approach, we reevaluated the results initially obtained by each module. For the central one, the only difference is that there was not a heat flux through the central duct because the fluid’s temperatures on the two sides were similar. So, in this case, the module was considered as adiabatic on both surfaces. However, it was important to highlight the differences between the transmittance values with or without the radiant component: they value respectively 354.1 and 414.32 W/m2K. So, there was an increase in the difference between the two conditions (around the 17%) with an effect on fluids temperature similar to what was described before.
For the module at the top of the exchanger, the heat flux had an opposite direction with respect to the bottom case; the reason was that fluid temperature into the circular crown was lower than the temperature inside the central duct. It was also interesting to notice that in this case, due to the small temperature differences, the radiant component is less relevant than in the other cases. In fact, without this component, the transmittance was 353.67 W/m2K, while with the radiant component it increased to 376.89 W/m2K. So, the gain was very small: just over 5%.
3.2. Optimization
This paragraph reports the most original findings of our research because we analyzed the results obtained during the optimization phase. In fact, since HTTR IHX was realized in 1990s, it is important to consider some of the improvements that could be implemented in future similar applications.
3.2.1. Materials
The first optimization started from the consideration that in the frame of GEN IV Initiative, a lot of research studies were carried forward with the goal to develop plants that were safe, efficient, and fit within the logic of cogeneration. This included the whole phase of R&D on innovative materials suitable to withstand high temperature. So, looking in particular to these last issues, we decided to replace the reference material of the exchanger (Hastelloy-X) with a more innovative and recent Alloy 617 [26] and ODS (Oxide Dispersion-Strengthened) [27].
The Alloy 617 is an innovative material that is mainly composed of nickel, chromium, and molybdenum and thanks to its chemical composition, it is very durable at high temperature and can withstand high temperature phenomena (like corrosion and oxidation). Moreover, it has a high resistance to corrosion phenomenon, and it can be welded using conventional techniques. If these main features with high temperature applications are combined, it is obvious why this material is used for pipes, hot ducts, and parts of power plants.
The ODS (and specifically MA 754) are matrixes of metallic material in which very small particles of oxide (e.g., aluminum or yttrium) are inserted. The result is a material with a high resistance to corrosion and good mechanical behavior at high temperatures. These materials have a good resistance to creep phenomenon, not only due to the addition of the micro-particles but also due to the proper elongated shape of the grain.
We introduced these new materials in Star-CCM+ library with their main characteristics such as constant density, specific heat, and thermal conductivity (temperature dependent).
For each module located in each position of the exchanger, there was a change in the numerical value of thermal resistances due to the different thermal conductivity of each new material. All the modifications are reported in the Table 5 and Table 6.

Table 5.
Modifications on thermal resistances values for each module (Alloy 617).

Table 6.
Modifications on thermal resistances values for each module (MA 754).
These new values, as mentioned, are a function of the thermal conductivity values of each material as shown in Figure 15.
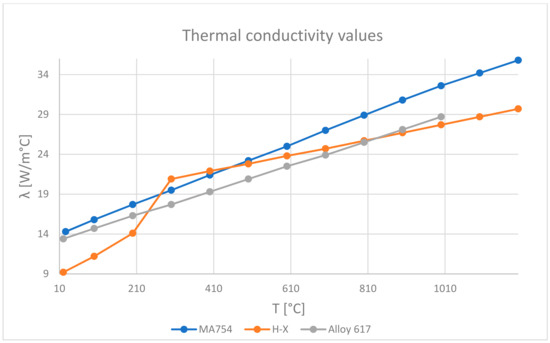
Figure 15.
Thermal conductivity trends for each material.
So, the thermal conductivity of Hastelloy-X is on average lower for all the temperatures; for this reason, we can imagine that thermal exchange will be better with these new materials than for the reference one.
After this preliminary analysis, we simulated the thermal exchange for each module in each position and the results are summarized in Table 7. We continue to report the Hastelloy-X results just as a term of comparison.

Table 7.
Results and comparison for every module in three position.
It is important to highlight the fact that we did not have any experimental data about these new materials. For this reason, the only thing we could do was to compare the results obtained with the reference material with those of new materials.
We can notice different interesting aspects. Starting with the module located at the bottom of the exchanger, we can observe that the outlet temperature of the primary helium decreases both with Alloy 617 and MA 754; while the outlet temperature of the secondary helium increases when compared with the reference case.
This was caused by the small increase of the thermal power exchanged through the coils because of the variation of the thermal resistance values.
For the module located in the middle of the heat exchanger, things are different: as we can see from Table 7, thermal power exchanged assumes always lower values if compared to the other position and the lowest value is related to the Alloy 617 (using MA 754 the thermal power is similar with the one obtained with Hastelloy-X). This is reflected on the outlet temperature’s values of each fluid; in fact, they are worse if compared to the reference case: primary helium remains hot while secondary helium remains cold.
However, for the module located at the IHX top, even if the thermal resistances change, the results are similar to those obtained in the reference case.
Other interesting conclusions came out from the comparison of the thermal transmittances of each module for every material in all the three positions (Table 8). It is interesting to notice how the transmittance values have changed considering again the radiant component. In order to evaluate the new values, we followed the same approach adopted in the validation paragraph.

Table 8.
Comparison of thermal transmittances.
The variations of all the other contributes (heat flux through the central duct and non-centered position of the coils) are instead not so relevant.
The trend of the radiant component is correct and is associated to the temperature’s differences that we have. Additionally, the radiant component increases in each case and the highest value is obtained with the ODS material.
In conclusion, we could say that the ODS material behaves better than the standard ones. In fact, against a slight modification of the convective heat exchange, the radiant heat exchange component varies much more significantly.
The main issue related to this new material is that is not common as the standard alloys; in fact, in literature, it is more difficult to find experimental data on the application of the ODS if compared to the standard alloy.
3.2.2. S-CO2 as Primary Coolant
In this second optimization, we decided to modify one of the used coolants. The idea was born trying to find a fluid with better thermal capacity than helium; in this way, we could use less fluid, the speeds would have been reduced, and we would have more time available for the thermal exchange process.
However, fluids with better thermal capacity than helium do not exist, unless we decided to use liquid instead of gases. The problem of the liquids is related mainly to the chemical compatibility and this would have required very accurate research work to define each property; in addition, from the plant point of view, we would have to redesign significatively some parts of the installation.
For these reasons, we have preliminarily decided to remove helium and replace it with supercritical carbon dioxide. This decision was made for three reasons:
- CO2 (as all the other gases) is chemically inert.
- It is more economic as raw material.
- It is not completely “new” in nuclear plants.
In fact, there were different CO2 applications in supercritical condition in the nuclear plant: predominantly as a secondary coolant [28], but also as primary fluid [29].
In terms of CO2 supercritical condition, we respect only the temperature one but not the pressure one. For this reason, we had two possibilities:
- (1)
- Replace primary helium with CO2.
- (2)
- Replace secondary helium with CO2.
We decided upon the first option for two reasons: nuclear power plants that work with high pressure gases are well known while we preferred to not substantially modify the chemical plant.
So, on the basis of what is reported in literature [28,29], we decided to increase the primary gas pressure from 3.91 to 7.8 MPa.
An immediate consequence of this choice is that a change in coil geometry (thickness) is required. In fact, there is an inversion of the pressure gradient between internal and external fluids; the helical tubes will no longer be in pressure but will be in compression.
So, it will be necessary to identify the new minimum thickness to be adopted to withstand such stresses. A preliminary analysis on this issue is reported in the Appendix A.
The first thing to do after the replacement of the primary helium with carbon dioxide was to evaluate the correct mass flow rate of CO2 that would have ensured proper heat exchange with secondary helium. To do this, we reasoned on the thermal capacity:
where all the thermophysical properties were calculated at the average temperature and pressure defined before. The mass flow rate of carbon dioxide is 0.563 kg/s.
After changing this value in Star-CCM+, we created the new physical continuum and selected the gas with its properties defined by the software.
Another important modification was related to the insulant located into the central duct; we decided to replace it with a better one to further reduce the heat flux through the central duct in both directions. Reasoning on operating temperatures, we adopted the “Excelfrax 1800 Flexliner” that had a better thermal conductivity value (0.036 W/mK) [30].
All these changes were made for all the three modules which had Hastelloy-X as reference material; then, we simulated the thermal exchange. The results are shown in Table 9.

Table 9.
Comparison of the results of the S-CO2/He cycle.
In terms of temperature, all cases are worst if compared to the reference case. So, the primary helium remains hotter than the one in the He/He cycle, while the secondary helium remains colder than the reference one. These results are caused by a 35% decrease in the thermal power exchanged through the coils.
We can notice also that the thermal resistance of the central duct increased a lot due to the new insulant that was more performant if compared to the reference one. Thermal resistance of coils remained unchanged.
It is interesting to notice how the radiant contribution to the heat exchange increased: for example, for the module at the bottom of the exchanger, the radiant component weighed more than the 75%. If we compare this percentage with the one of the reference case, there is a difference between them around 45%. This means that we not only recover the lower convective heat exchange through coils but also improve the operating conditions.
The same logic remains valid for all the other modules in the other position.
4. Discussion and Conclusions
In this work, we have come to define a detailed tridimensional model of the heat exchanger, thanks to the cross-study of the many articles available in literature, sometimes in mother language, in order to develop a detailed analysis of the heat transfer inside this unconventional component, since it is a key component of the existing facilities and can become a critical component for the direct exploitation of nuclear energy, aimed at the hydrogen production. The modeling presented, although partially using existing methods, may be important in guiding future nuclear hydrogen design (in terms of error sources, challenges, outcomes, etc.) as highlighted by our analysis and results.
The study focused on the thermal and fluid-dynamic behavior of a single repetitive module that can be picked out of the whole heat exchanger. The thermal performances of the module were evaluated and compared to the experimental results available in literature, considering that the module would be located at three different position of the IHX: bottom, middle height, and top.
It is very important to deepen the thermal aspects as well as the fluid dynamic aspects in order to analyze some peculiar features, such as for example, the fluid flow in the superior dome and other critical points. A fluid dynamic analysis was made just for the module in the center of the exchanger using a simplified approach; to account for the symmetry and the periodicity of the geometry, the fluid flow was considered as fully developed. For the secondary helium inside the coils, it was very easy to verify the correct motion, while for the external fluid (primary helium), it was more complicated. In fact, assuming that helium entered normally into the inlet surface, a lot of swirling appeared when fluid impacted on coils. They were mainly caused by the sudden variation of the cross section that the fluid encounter due to the component of the velocity perpendicular to the pipes axis.
Before proceeding to a further step, the activity was aimed at validation of CFD results with the evidence available in literature. The validation was performed mainly for the reference module because all its boundary conditions were more significative than in all the other cases.
Finally, in the last phase, the effects of using innovative materials and an innovative cycle were evaluated and it was found that they could increase the performances of the component. In particular, it was found that ODS MA 754 is the best material to withstand critical conditions and due to its better thermal conductivity factor, it shows higher heat transfer performances. On the other hand, the S-CO2 as a secondary fluid, as an alternative to He, has an immediate consequence in the increase of the pipe thickness. With the new thickness that could resist high external pressure, new evaluations have to be done. The increase of the thickness of the coils impacts either the internal cross section available for the primary fluid flow or the gaps between frames and coils, which determine the complex cross section of the external path of the secondary fluid flow. In these conditions, it is interesting to notice that the thermal conductivity of the materials, which are currently available, are definitely lower than the one of the insulating material used in the experimental facility and this implies that a less thick layer of newer insulation could replace the existing one. This action seems to be a viable solution to compensate the need of higher pipe thickness, induced by the different pressure of the secondary fluid.
Author Contributions
Writing—original draft preparation: L.B., F.D., G.L.; writing—review and editing: L.B., F.D., G.L. All authors have read and agreed to the published version of the manuscript.
Funding
This research received no external funding.
Institutional Review Board Statement
Not applicable.
Informed Consent Statement
Not applicable.
Conflicts of Interest
The authors declare no conflict of interest.
Appendix A. Preliminary Analysis on Coils’ Thickness
In the previous paragraphs, the possibility of replacing primary helium with S-CO2 was studied and it implies that we had to increase the primary pressure to have carbon dioxide in a supercritical condition. In the new set point, the pressure is 7.8 MPa, hence it was necessary to evaluate the new operating condition. In fact, the pressure difference between the internal fluid and external fluid was inverted: if with the He/He cycle, we had an internal pressure of 4.02 MPa and an external pressure of 3.91 MPa, now with the CO2/He cycle, we have the same internal pressure but a double pressure on the external side. For this reason, it was necessary to estimate the correct thickness of coils that could have resistance to these stresses.
We made a preliminary evaluation using the material properties of the Hastelloy-X and referring to the circumferential stress. In fact, the circumferential stress is defined as:
where
We evaluated the stress both at the internal and external radius and we brought the highest one (internal circumferential stress—8.99 MPa) as the reference value. After that, using its definition, we evaluated the minimum thickness accepted and then we increased it to consider a precautionary condition. The new thickness of each coil was estimated to be 6.5 mm.
So, if we compare this result to the initial thickness value (3.5 mm), we have an increase that must be considered in different aspects:
- (1)
- Having this new thickness implies the highest thermal resistance of the coil and that surely influences the heat exchange between external and internal fluids.
- (2)
- We must verify if, with that geometry, the overall dimensions are respected or we need an accurate modification of the component.
- (3)
- If the overall dimensions are ok, we must consider how the fluid dynamic will change and how this reflects on the heat exchange.
Of all this consideration, we have just focused on the first one. In fact, we have introduced the new thickness value as a new contact thermal resistance between the fluids and coil’s wall (Figure A1).
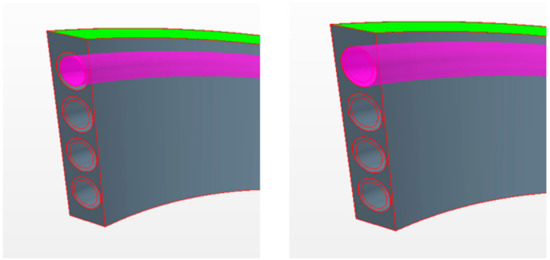
Figure A1.
Thermal conductivity trends for each material.
All the other conditions remain unchanged and all the results we obtained are compared with the reference S-CO2/He cycle with standard thickness in the table below (Table A1).

Table A1.
Comparison of the results.
Table A1.
Comparison of the results.
| Standard S-CO2/He Cycle | S-CO2/He Cycle with Thickness Increased | |
|---|---|---|
| T1 | 1223.2 K | 1223.2 K |
| T2 | 1213.1 K | 1213.5 K |
| T1′ | 1112.4 K | 1112.4 K |
| T2′ | 1120.4 K | 1119.9 K |
| Q | 1330 W | 1263.6 W |
| Thermal resistance CC | 5.835 m2 K/W | 5.835 m2 K/W |
| Thermal resistance coil | 0.000131 m2 K/W | 0.000243 m2 K/W |
| Thermal transmittance 1 | 192.05 W/m2K | 181.64 W/m2K |
| New thermal transmittance 2 | 345.45 W/m2K | 321.42 W/m2K |
| Percentage increase | >75% | >75% |
1 Is the value without the radiant component. 2 Consider the radiant component.
We can observe that both primary and secondary fluid came out with worst condition: primary gas remains hot while the secondary one remains cold. This fact is proved by a minor heat exchange through the coil verified by the thermal power exchanged.
As we can see, the thermal resistance of the coil is increased due to the new thickness added before.
References
- Muntean, M.; Guizzardi, D.; Schaaf, E.; Crippa, M.; Solazzo, E.; Olivier, J.; Vignati, E. Fossil CO2 Emissions of All World Countries—2018 Report; EUR 29433 EN; Publications Office of the European Union: Luxembourg, 2018; ISBN 978-92-79-97239-3. [Google Scholar] [CrossRef]
- Crippa, M.; Oreggioni, G.; Guizzardi, D.; Muntean, M.; Schaaf, E.; Lo Vullo, E.; Solazzo, E.; Monforti-Ferrario, F.; Olivier, J.G.J.; Vignati, E. Fossil CO2 and GHG Emissions of All World Countries—2019 Report; EUR 29849 EN; Publications Office of the European Union: Luxembourg, 2019; ISBN 978-92-76-11100-9. [Google Scholar] [CrossRef]
- Lomonaco, G.; Castagnola, L.; Marotta, R. Nuclear Systems for Hydrogen Production: State of Art and Perspectives in Transport Sector. Glob. J. Energy Technol. Res. Updat. 2014, 1, 4–18. [Google Scholar] [CrossRef]
- Campos, W. Hydrogen Fuel Cell Engines and Related Technologies, Module 1: Hydrogen Properties. Hydrogen Fuel Cell Engines. College of the Desert. 2001. Available online: https://www.energy.gov/sites/default/files/2014/03/f12/fcm01r0.pdf (accessed on 25 May 2021).
- Chaube, A.; Chapman, A.; Shigetomi, Y.; Huff, K.; Stubbins, J. The Role of Hydrogen in Achieving Long Term Japanese Energy System Goals. Energies 2020, 13, 4539. [Google Scholar] [CrossRef]
- Kaplan, R.; Kopacz, M. Economic Conditions for Developing Hydrogen Production Based on Coal Gasification with Carbon Capture and Storage in Poland. Energies 2020, 13, 5074. [Google Scholar] [CrossRef]
- Noussan, M.; Raimondi, P.; Scita, R.; Hafner, M. The Role of Green and Blue Hydrogen in the Energy Transition—A Technological and Geopolitical Perspective. Sustainability 2020, 13, 298. [Google Scholar] [CrossRef]
- Strategy. The Dawn of Green Hydrogen—Maintaining the GCC’s Edge in a Decarbonized World. 2020. Available online: https://www.strategyand.pwc.com/m1/en/reports/2020/the-dawn-of-green-hydrogen/the-dawn-of-green-hydrogen.pdf (accessed on 26 April 2021).
- Millet, P.; Grigoriev, S. Water Electrolysis Technologies. Renew. Hydrogen Technol. 2013, 19–41. [Google Scholar] [CrossRef]
- Grbovic, J.M.D. Hydrogen Economy: Modern Concepts, Challenges and Perspectives. In Hydrogen Energy—Challenges and Perspectives; IntechOpen: London, UK, 2012. [Google Scholar]
- Cerullo, N.; Lomonaco, G. Generation IV reactor designs, operation and fuel cycle. Nucl. Fuel Cycle Sci. Eng. 2012, 333–395. [Google Scholar] [CrossRef]
- Zhang, K.; Bao, W.; Chang, L.; Wang, H. A review of recent researches on Bunsen reaction for hydrogen production via S–I water and H2S splitting cycles. J. Energy Chem. 2019, 33, 46–58. [Google Scholar] [CrossRef]
- Cerullo, N.; Lomonaco, G. Corrosion Issues in High Temperature Gas-Cooled Reactor (HTR) Systems; Elsevier: Amsterdam, The Netherlands, 2012; pp. 731–772. [Google Scholar]
- Chersola, D.; Lomonaco, G.; Marotta, R. The VHTR and GFR and their use in innovative symbiotic fuel cycles. Progress Nucl. Energy 2015, 83, 443–459. [Google Scholar] [CrossRef]
- Kępisty, G.; Oettingen, M.; Stanisz, P.; Cetnar, J. Statistical error propagation in HTR burnup model. Ann. Nucl. Energy 2017, 105, 355–360. [Google Scholar] [CrossRef]
- Hori, M. Hydrogen production using nuclear energy. J. At. Energy Soc. Jpn. 2001, 43, 30. [Google Scholar] [CrossRef]
- IAEA. Current Status and Future Development of Modular High Temperature Gas Cooled Reactor Technology; IAEA-TECDOC-1198; IAEA: Vienna, Austria, 2001. [Google Scholar]
- Tochio, D.; Nakagawa, S. Thermal Performance of Intermediate Heat Exchanger during High-Temperature Continuous Operation in HTTR. J. Nucl. Sci. Technol. 2011, 48, 1361–1368. [Google Scholar] [CrossRef]
- Yan, X.L.; Hino, R. Nuclear Hydrogen Production Handbook; CRC Press: Boca Raton, FL, USA, 2018; 939p, ISBN 9781138074682. [Google Scholar]
- Tochio, D.; Hamamoto, S.; Inoi, H.; Shimazaki, Y.; Sekita, K.; Kondo, M.; Saikusa, A.; Kameyama, Y.; Saito, K.; Emori, K.; et al. Result of Long-Term Operation of HTTR. High-Temperature/Parallel-Loaded 50-Days Operation; JAEA-Technology: Ibaraki, Japan, 2010. [Google Scholar]
- Takeda, T.; Nakagawa, S.; Tachibana, Y.; Takada, E.; Kunitomi, K. Analytical Evaluation on Loss of Off-Site Electric Power Simulation of the High Temperature Engineering Test Reactor; JAERI-RESEARCH--2000-016; Japan Atomic Energy Research Institute: Ibaraki-ken, Japan, 2000. [Google Scholar]
- Koikegami, H.; Maruyama, S.; Kunitomi, K.; Ohkubo, M. Design and Fabrication of He-He Intermediate Heat Exchanger for HTTR. In Proceedings of the 3rd JAERI Symposium on HTGR Technologies, Oarai, Japan, 15–16 February 1996. [Google Scholar]
- Simcenter STAR-CCM+. Available online: https://www.plm.automation.siemens.com/global/it/products/simcenter/STAR-CCM.html (accessed on 14 May 2021).
- Tu, J.; Yeoh, G.-H.; Liu, C. Computational Fluid Dynamics. Automot. Emiss. Control 2013. [Google Scholar] [CrossRef]
- Hastelloy, X.A. Physical Properties. Available online: https://www.hightempmetals.com/techdata/hitempHastXdata.php (accessed on 25 May 2021).
- Special Metals. INCONEL Alloy 617. Available online: https://www.specialmetals.com/documents/technical-bulletins/inconel/inconel-alloy-617.pdf (accessed on 25 May 2021).
- Special Metals. INCONEL Alloy MA754. Available online: http://specialmetals.ir/images/technical_info/nickel-base-alloy/Inconel-alloy-MA754.pdf (accessed on 25 May 2021).
- Oh, C.H. Development of a Supercritical Carbon Dioxide Brayton Cycle: Improving VHTR Efficiency and Testing Material Compatibility—Final Report; Idaho National Lab. (INL): Idaho Falls, ID, USA, 2006. [CrossRef]
- Qi, H.; Gui, N.; Yang, X.; Tu, J.; Jiang, S. The application of supercritical CO2 in nuclear engineering: A review. J. Comput. Multiph. Flows 2018, 10, 149–158. [Google Scholar] [CrossRef]
- Excelfrax. Microporous Insulation. Available online: https://www.unifrax.com/wp-content/uploads/2018/08/C-1500.pdf (accessed on 25 May 2021).
Publisher’s Note: MDPI stays neutral with regard to jurisdictional claims in published maps and institutional affiliations. |
© 2021 by the authors. Licensee MDPI, Basel, Switzerland. This article is an open access article distributed under the terms and conditions of the Creative Commons Attribution (CC BY) license (https://creativecommons.org/licenses/by/4.0/).