Abstract
Widespread interest in environmental issues is growing. Many studies have examined the effect of distributed generation (DG) from renewable energy resources on the electric power grid. For example, various studies efficiently connect growing DG to the current electric power grid. Accordingly, the objective of this study is to present an algorithm that determines DG location and capacity. For this purpose, this study combines particle swarm optimization (PSO) and the Volt/Var control (VVC) of DG while regulating the voltage magnitude within the allowable variation (e.g., ±5%). For practical optimization, the PSO algorithm is enhanced by applying load profile data (e.g., 24-h data). The objective function (OF) in the proposed PSO method considers voltage variations, line losses, and economic aspects of deploying large-capacity DG (e.g., installation costs) to transmission networks. The case studies validate the proposed method (i.e., optimal allocation of DG with the capability of VVC with PSO) by applying the proposed OF to the PSO that finds the optimal DG capacity and location in various scenarios (e.g., the IEEE 14- and 30-bus test feeders). This study then uses VVC to compare the voltage profile, loss, and installation cost improved by DG to a grid without DG.
1. Introduction
An international agreement was signed in Paris to maintain the global temperature increase below 2 °C. Countries worldwide are increasing the number of distributed renewable energy resources to reduce greenhouse gas emissions. Thus, many studies have been conducted to design a reliable and stable connection between distributed renewable energy resources and the system. For example, a study found that connecting distributed generation (DG) to the system could reduce line losses [1]. Such a reduction in line losses creates economic benefits for the entire system. Accordingly, studies based on technical and economic considerations have been conducted on optimizing DG capacity and location [2]. In these studies, it is efficiently feasible to use DG that has a positive effect on the system [3,4,5,6,7].
In various DG types, some generations are difficult to control the amount of power generated by itself such as photovoltaic (PV) and wind power generation. As these generators increase in the grid, they start to impact on grid operations because they need to gain power grid flexibility that deals with their variability and uncertainty. One of the suggested solutions is reactive power control. Reactive power control has been studied in various directions [8,9,10,11]. In this paper, Volt/Var control (VVC) was adopted as a method of controlling reactive power and applied to the system. VVC usually operates through an inverter installed in each DG and supplies or consumes reactive power depending on the voltage of the bus on which DG is installed [12]. This process stabilizes the grid voltage and increases its flexibility. In this paper, we place importance on the operation of these inverters. It is also assumed that all DG systems contain these functions and the simulation proceeds.
DG systems supply power to part of the load instead of the main generator. The load on the grid is not constant and this should be considered when allocating DG systems. In this paper, DG is optimally allocated to the system by reflecting the load usage of each hour. This allows the more practical allocation of DG. For example, in one study, the effect of DG on the grid was improved by applying a load profile to the optimization of a reactive power generator [13]. Another study also presented the composition of loads and DGs based on load profiles [14]. This study presented the composition of the DG using load data and optimized the reactive generator. This study aims to increase the practicality of the algorithm through the load profile in common with the previous studies. In applying the load data, it is similar to [13], but this study has a difference in that it optimizes the distributed power supply including VVC, not the reactive generator.
In order to optimize DG, various methodologies have been applied. For example, studies have been conducted to control the reactive power of DG, capacitor bank, and DG using the genetic algorithm (GA) as an example of the meta-heuristic methods [15,16,17,18]. These studies have used GA to optimize DG, but GA may be slow to converge and complex to implement compared to the other heuristic methods. A heuristic method on the optimization of DG was presented via the Monte Carlo algorithm [19]. Like GA, the Monte Carlo algorithm can be complex and have the disadvantage of slow convergence. Another study used Kalman filtering for the optimal capacity and placement of DG [20]. Additionally, the placement and capacity of DG were optimally selected by a harmonious search algorithm with multiple objective functions (OFs) [21]. Similarly, various OFs have been presented in [22,23]. In addition to the heuristic method, the purpose of the study was achieved through random forest classification in [24] and a machine learning approach in [25].
In this study, PSO is used, which is simpler than the methods used in the previous studies and has an improved convergence speed. Using this PSO, one study optimized the location of DG when power losses were minimized depending on the number of DG systems [26]. Unlike [26], we consider all three variables by normalizing the losses, voltage variations, and installation costs in the OF in the proposed PSO algorithm.
1.1. Contributions and Findings
This study solves a DG optimization problem (e.g., the capacity and placement of DG) using PSO, one of the meta-heuristic methods. PSO has the advantage of being faster and requires relatively few parameters than other heuristic methods. Therefore, in this paper, PSO is used to solve the optimal allocation problem of DG. The difference between previous studies and this study is that the proposed PSO algorithm has not only a VVC function added to stabilize the voltage on the grid but also a load profile (e.g., 24-h data) that increases the feasibility of DG allocation. Additionally, it shows the difference from the previous studies by considering the voltage magnitude variations, losses, and installation costs of DG in the OF. Therefore, this study optimally allocates DG in a more feasible way than the previous studies.
Many studies have optimized DG with the ability of VVC, but no research has suggested an algorithm that applies both VVC and load profiles to PSO. Thus, the objective of this study is to not only discover the optimal DG capacity and location using PSO but also enhance it to optimize DG when reflecting load profiles. The proposed OF considers the economic benefits in installation costs and line losses in conjunction with the voltage regulation. The case studies verify the proposed method by optimizing DG in the known test feeders (e.g., the IEEE 14- and 30-bus test feeders). The case study results compare voltage profile improvements that determine the effect of the VVC of optimized DG on voltage. Additionally, the optimization results are compared to the optimization solution of the GA.
1.2. Structure
The remainder of this paper is organized as follows. Section 2 lists considerations necessary to connect DG to systems. Section 3 describes existing PSO and GA methods without VVC, while Section 4 presents the proposed methodology with VVC and load profiles. Section 5 introduces the case studies and their results (e.g., the IEEE 14- and 30-bus test feeders). Finally, Section 6 presents the major findings of this paper.
2. Problem Statement
DG reduces peak load due to active power injection and can reduce line losses if appropriately coordinated with the system. DG can also compensate for the shortcomings of the centralized energy system, which requires high construction costs and a long construction period. This study optimally allocates DG capacity and location by considering the following:
- Location and VVC. DG can be installed on all buses except for a slack bus. Buses to which DG systems are connected can participate in VVC. A target voltage magnitude is set at 1.00 p.u to maximize the effect of VVC on the system.
- Capacity. In this paper, it is assumed that DG systems are connected to the transmission system in the form of a large-capacity energy resource (e.g., conventional generators, PV, or wind farms). However, the capacity of DG does not exceed the system’s base MVA (e.g., Sbase).
- Load profile. The optimization should be in conjunction with load profile data.
For this purpose, this study combines a PSO algorithm that includes the VVC ability of DG. For practical optimization, the PSO algorithm is enhanced by applying load profiles. The focus of this paper is to stabilize the voltage of the system by using DG and to minimize the line losses and installation costs of DG. That is, the OF in the proposed PSO method considers voltage variations, line losses, and economic aspects of deploying DG (e.g., installation costs).
3. Previous Method
3.1. Distributed Generation
The installation costs of DG should be considered when placing DG in the system. Moreover, connecting DG systems to all the buses is not feasible. The DG reactive and active power should exist within the minimum and maximum values of each DG source.
where
- i = bus location (e.g., bus number),
- Pimax = maximum active power of ith DG,
- Pimin = minimum active power of ith DG,
- PDG,i = active power of ith DG,
- Qimin = minimum reactive power of ith DG,
- Qimax = maximum reactive power of ith DG,
- QDG,i= reactive power of ith DG.
The sum of the DG and generator capacities should be equal to the sum of loads and losses.
where
- PDG,i = generation output of ith DG,
- Pg,i = generation output of the ith generator,
- Pload,i = load or demand of the ith bus,
- Plosses,i = line loss of branch i.
The voltage regulation of bus i is within ±5%,
where
- Vimin = minimum voltage magnitude of the ith bus,
- Vimax = maximum voltage magnitude of the ith bus,
- Vi = voltage magnitude of the ith bus.
3.2. Particle Swarm Optimization
A PSO algorithm can be used to solve the problem of obtaining optimized capacity and location for DG systems. PSO attempts to discover an optimal solution through a candidate particle. Particles remember the property of velocity and position, whose locations are repeatedly calculated by Equation (4) while reproducing the velocity vector. The best particle position (Pbest) is created through an iterative process and converges to the best swarm position (Gbest),
where
- v = velocity,
- x = position,
- w = coefficient of inertia,
- rand = random number,
- c1 and c2 = weight coefficient value.
Based on the iterative equation, x is closer to an optimum (e.g., Gbest). Figure 1 shows the workflow of a typical PSO algorithm for optimal DG allocation.
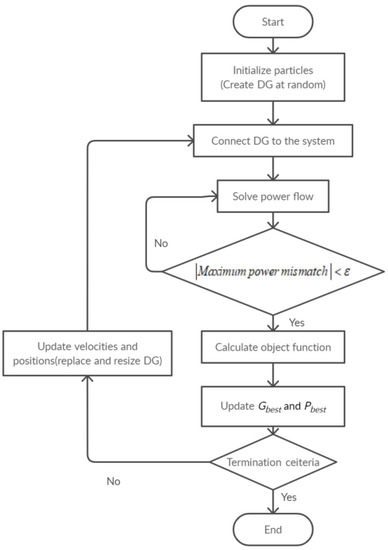
Figure 1.
Flowchart of the proposed PSO.
The parameters that make up the PSO play an important role in expressing the outcome of the PSO. Therefore, it is necessary to properly adjust the inertia weight w and the acceleration constants c1 and c2. The values of the parameters are set as follows:
- wmin = 0.4,
- wmax = 0.9,
- c1 and c2 = 2.
The number of particles = 100 and the number of iterations = 100.
3.3. Volt/Var Control
In large-capacity PV and wind farms, which can be seen as a type of DG, inverters are included when connected to the grid. VVC works in this inverter. That is, the inverter either supplies or consumes reactive power by the droop control method according to the voltage of the corresponding bus. The detailed control method of VVC is shown in Figure 2 and Equation (6). Due to the nature of distributed power supply, utilizing the function of VVC works effectively in solving the local voltage problem [27].
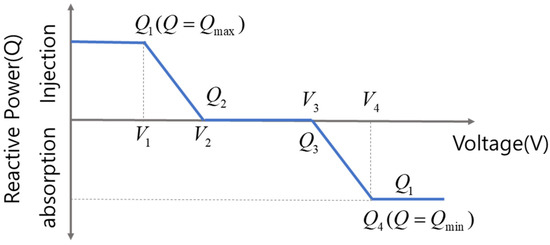
Figure 2.
Example of Volt/Var control.
VVC improves a voltage magnitude profile in the power system where DG is connected. Both the injection and absorption of reactive power depends on the voltage magnitude of a bus to which DG is connected. Such a VVC method is expressed in Figure 2, and Equation (6) describes the operation of VVC.
If the bus voltage drops below the set value (i.e., V2), the bus is supplied with reactive power from the DG. If the voltage rises above the set value (i.e., V3), the bus consumes reactive power. The controlled reactive power is obtained as the pu value from the result of Equation (7). Injected reactive power is used in the power flow equations. That is, the reactive power is either injected or consumed in the buses while iteratively adjusting the voltage magnitude within the set value. For example, Q(V) determined by Equation (6) iteratively calculates the new active and reactive power set point () of DG that participates in VVC.
where
- = rated complex power of DG,
- = complex power set point of DG at iteration (i + 1),
- Q(i) = reactive power injected by DG at iteration i.
The VVC method should be implemented using a power-flow algorithm because Q in Equation (6) depends on V. Thus, this paper implements the established Newton–Raphson method. The detailed power-flow method is presented in the Appendix A.
4. Proposed Method
4.1. Load Profile
The electric load changes by time because of changes in various factors such as demand, weather, and season. Thus, it is necessary to consider the variability of the load. Many studies have optimized DG with the ability of VVC but applying both VVC and load profile data to PSO is rarely examined [17,28]. For practical optimization, moreover, the PSO algorithm is enhanced by applying load profile data. Figure 3 shows the variation of the load for 24 h, obtained from the load fluctuation for one year in [29]. The load data are used as an input for DG optimization. The load at the peak time (1 p.m.) is set to 1 pu.
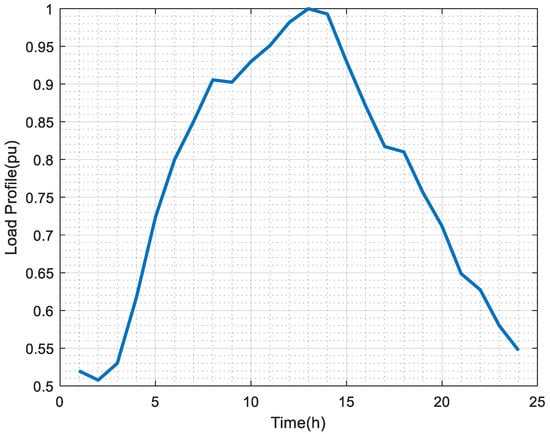
Figure 3.
Typical load profile data.
4.2. PSO with VVC
4.2.1. Objective Function
This study optimizes DG with the ability of VVC by PSO. In the optimization process, load profile data are applied. That is, the proposed PSO algorithm optimally determines the location and capacity of DG while taking all the load data into account in the OF. The OF of the proposed PSO method for the optimal allocation of DG systems includes voltage magnitude regulation, installation costs, and line losses.
The voltage magnitude variation is calculated by the Newton–Raphson power-flow calculation method when DG systems participate in VVC. Thus, either injected or consumed reactive power (i.e., Q) maintains the optimal voltage magnitude as close to the unity value (i.e., 1.0) as possible. Maintaining voltage in the power system is very important for stability. For example, the optimal allocation of DG considered voltage stability in [30]. The voltage magnitude range that must be maintained can be formulated by
where
- Vi,h = voltage at bus i and time h,
- N = the last number of buses in the test feeder,
- T = total hours,
- h = hour.
The test feeder is equipped with DG systems, but the proposed method does not limit the number and capacity of DG systems. However, if many DG systems are installed, the installation cost of the OF will increase and function as a penalty. Thus, the system adds an adequate installation capacity cost of DG (i.e., Ccost) to the OF.
where CDG is the average installation cost of DG in USD/kW (e.g., 3.975 USD/kW) and M is the last number of DG.
If optimal DG are added to the system, they can decrease line losses because of the reverse power flow. If the losses increase, it will negatively affect the system. Thus, the losses (e.g., Sloss, i, h) are also added to the OF.
where B is the last number of branches in the test feeder and Sloss is the complex loss of branch i.
4.2.2. Normalization
The factors defined in the OF vary, so normalization is necessary. This study examines the worst case of each component and divides each value by the worst-case value. For example, the voltage magnitude should be within ±5% [31] or ±10% [32] according to the standards, so the worst case is when the voltage magnitude of all the buses is 10% away from the unity value. The worst case of losses is when the loss occurs at 10% of the base MVA (e.g., Sbase) in all branches.
The worst-case installation cost is assumed when the maximum capacity of DG is installed in all the buses. Therefore, normalization is equivalent to,
4.2.3. Objective Function Evaluation
Each element of the OF either improves or deteriorates as DG is installed. The reflection rate is equally adjusted through the normalization of all three elements in the OF. Therefore, the OF value is expressed as the sum of the three normalized elements. Finally, the proposed PSO algorithm combined with VVC and load profile data finds the optimal allocation of DG to minimize the sum of these three factors (14) and (15) that represent the final OF value. That is, the proposed method is to minimize the sum of each OF element from (11) to (13). In other words, each element with normalization is reflected in the following OF at the same rate,
4.3. Workflow of the Proposed Method
This study optimally allocates the capacity and location of DG with the ability of VVC by PSO. In the PSO process, load profile data are also applied. Figure 4 is a flowchart of the proposed PSO/VVC algorithm, which includes the Newton–Raphson method implementing the proposed VVC algorithm. The OF of the PSO algorithm reflects the improved voltage magnitude and reduced line losses through VVC. The calculated OF determines the optimal location and capacity of DG with the ability of VVC in the iterative PSO process. For example, until all the load profile data are applied, the VVC loop in Figure 4 repeats the calculation of power flow and the evaluation of the OF. As a result, this study optimizes DG when considering all the load data. The following case studies, which use the proposed PSO/VVC algorithm, include the IEEE 14- and 30-bus test feeders to confirm the proposed methods and optimize DGs location and capacity with VVC.
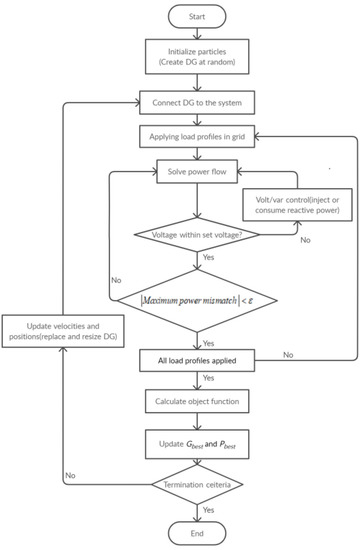
Figure 4.
Proposed VVC and load profile included in the PSO algorithm.
5. Case Studies
5.1. IEEE 30-Bus Test System
This study validates the proposed PSO method incorporated by the ability of VVC of DGs and load profile data by optimizing the DGs in the test systems (i.e., the IEEE 14- and 30-bus test systems) in Figure 5. The test systems representing an approximation of the American Electric Power system were proposed for research and educational purposes in 1962. One of them, the IEEE 30-bus test system in Figure 5, includes 30 buses, 21 loads, 5 P-V buses, and 4 tap-changing transformers. Table 1 illustrates the detailed operation data points for VVC, which are defined in Figure 2 and Equation (6). Slack and P-V buses are simulated with a target voltage of 1.00 pu to minimize a variation in the voltage magnitude to the unity value.
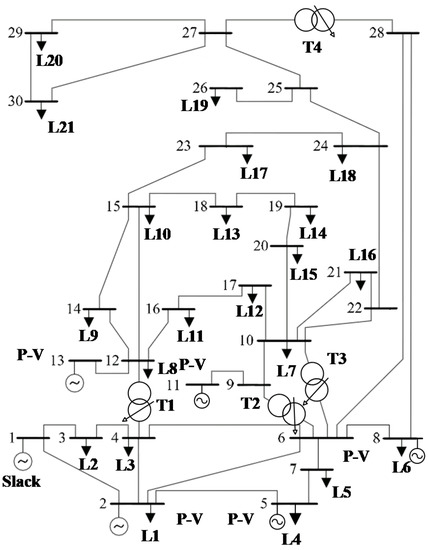
Figure 5.
IEEE 30-bus test system [33].

Table 1.
Volt/Var control setpoint.
In the first validation step, Figure 6 shows the OF values of the previous and proposed methods. All the OF values converge as iteration progresses. To prevent PSO from approaching the local optimum or converging to an incorrect value, if power flow calculation does not converge, the OF value was set high so that it could be excluded from the optimal convergence value. Therefore, the values representing the error were gradually removed, in other words, naturally dropping out of the optimal solution. In the case study of this paper, the OF values that ensure the convergence of PSO are summarized. The first previous method includes neither VVC nor the load profile in PSO. In other words, only the peak load is used in the first method. The second previous method applies only load profile data to PSO. The proposed method includes both VVC and load profile to minimize the OF value. In addition to PSO, to validate the optimization of the proposed method, it is compared to the value calculated by GA using the same objective function. For this purpose, a GA is implemented to verify the proposed PSO method for an optimal DG allocation problem. The GA includes initialization, suitability determination, new population creation (e.g., crossover and mutation), and iterations. This study uses arithmetic crossover per offspring = 0.9, uniform mutation = 0.1, the number of generations = 100, and the number of population members = 100, which is determined by the trial-and-error method. In Figure 6, the converged OF value of the proposed method is the lowest. Table 2 presents the optimal location and capacity of DG as a result of PSO simulated in the IEEE 30-bus test feeder, and the result of GA is presented in Table A1 in Appendix A.2. By applying a load profile to each model, the voltage magnitude profiles are shown in Figure 7. The proposed method maintains the voltage magnitude closest to the unity value compared to the previous methods. Figure 8 shows the total line losses for 24 h. Table 3 indicates the detailed OF in (14).
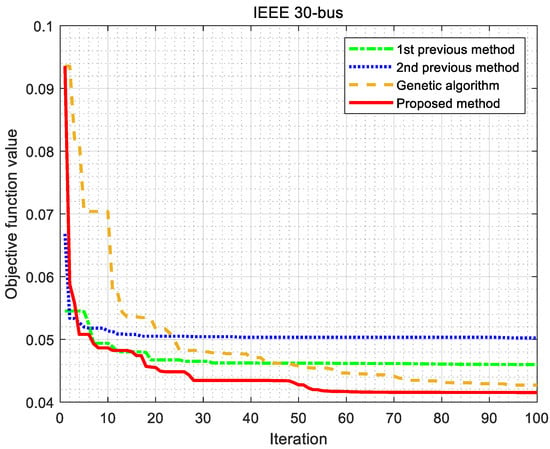
Figure 6.
Convergence of objective function (IEEE 30-bus test feeder).

Table 2.
Optimal location and capacity of DG (IEEE 30-bus test feeder).
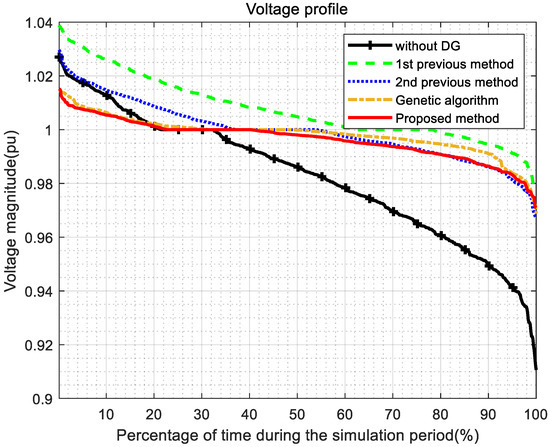
Figure 7.
Voltage profile (the IEEE 30-bus test feeder). All the bus locations for 24 h.
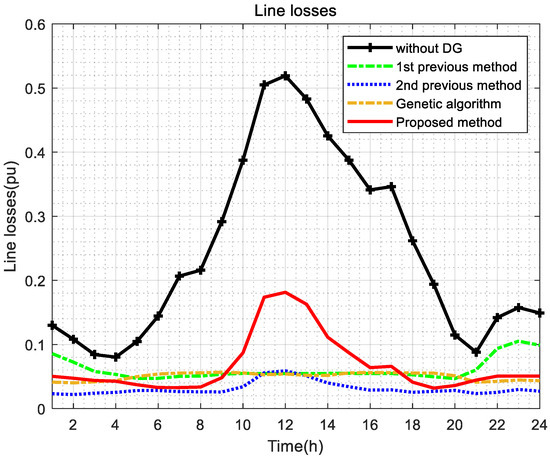
Figure 8.
Line losses profile.

Table 3.
Detailed objective function values (the IEEE 30-bus test feeder).
The first model does not include DGs, but load profile data are applied, which is denoted as “without DG.” In Figure 7, the case indicates the severest voltage variation. In Figure 8, the case also shows the highest line losses. Although the installation cost of the case in Table 3 is zero, the converged OF value is highest (i.e., 0.0936). Thus, the case is set to the base value (i.e., 100%) for comparison.
In Figure 7, the first previous method (with PSO without VVC and load profiles) presents the second severest variation in the voltage magnitude because VVC is not applied. In fact, since this model includes neither the load profile data nor VVC in the process of PSO, this study produces Figure 7 by applying the load profile data after the optimization of DG via PSO. In Figure 6, the OF value of the first previous model converges to 0.0637. However, when the load profile data are applied to this model, the OF has a higher OF value compared to the previous second and proposed methods. The result of the GA in Figure 6 represents a larger value than the proposed method, so it validates the effectiveness of the proposed method.
For comparison, the second previous method applies load profile data to PSO but VVC is not applied. In Figure 7, as DG is optimally installed, the voltage profile improves, which is comparable to [17,34,35]. In Figure 8, the line losses reduce significantly over 24 h because only the load profile is applied to PSO. That is, as a result of optimally selected DG, the line losses reduce, which is comparable to [13]. Compared to the model without DG as a reference, the voltage variation reduces to 36.52%, and line losses reduce to 12.89% in Table 3. However, in Figure 7, the voltage variation is higher than the proposed method because VVC is not applied. In Figure 8, the proposed method shows higher line losses than the first, second previous, and GA methods. However, in Table 3, the proposed method improves the voltage profile and reduces installation costs. In Table 3, the voltage variation decreases to 26.01% and line losses to 21.32% compared to the model without DG. The voltage variation and line loss of the GA are 0.0152 and 0.004, respectively, which are lower than the proposed method, but the installation cost is 0.0236, which is higher than the proposed method. Therefore, with a slight difference, the result of the proposed method shows a lower OF value than the GA method. Since the converged OF value of the proposed method is the lowest, it meets the objectives of this paper.
5.2. IEEE 14-Bus Test System
The second validation uses the IEEE 14-bus test feeder in Figure 9. The 14-bus test feeder includes a slack bus, four P-V buses, and nine P-Q buses. The detailed system data of the test feeder are available in [36]. The methods presented in the previous case study are also applied to the IEEE 14-bus test feeder. Figure 10 shows the convergence of OF values of the previous and proposed methods. Figure 11 indicates the voltage magnitude profiles of each method. Figure 12 presents the total line losses. The optimal location and capacity of DG systems are presented in Table 4. The detailed OF values of each method are shown in Table 5. In Figure 10, the proposed method converges fastest. Similar to the previous case study, since the proposed method contains VVC, the voltage variation is lower than the other two methods (e.g., “without DG” and the first previous model) in Figure 11. In Figure 12, the total line losses of the proposed method are not low because of reactive power either injected or absorbed by VVC when compared to the first and second previous methods. However, the converged OF value of the proposed method (i.e., 0.0500 in Table 5) is the lowest compared to the other methods (i.e., 0.0698 and 0.0568 in Table 5). This is because the installation cost of the proposed method with less DG capacity than the other methods is the lowest. For example, Figure 11 shows that the voltage magnitude of the proposed method is within 5% for the entire simulation period. Although the voltage variation of the proposed method is not the lowest (e.g., 0.0216 of the second case study versus 0.0218 of the proposed method in Table 5), the installation cost of the proposed method is the lowest. The voltage variation and line losses of the GA are lower than the proposed method. However, because the installation cost is higher, the OF of the GA shows a higher value than that of the proposed method, with a slight difference. In Table 5, as a result, the line losses and voltage variation of the proposed method reduce to 51.38% and 53.56% compared the case without DG, respectively. The converged OF value of the proposed method is the lowest, which means that enough optimization has been achieved.
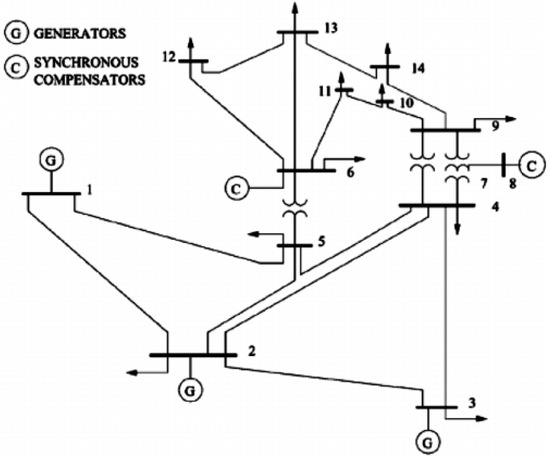
Figure 9.
IEEE 14-bus test system [36].
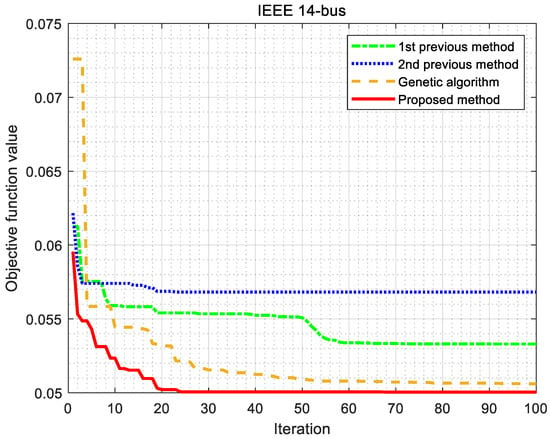
Figure 10.
Convergence of the objective functions (IEEE 14-bus test feeder).
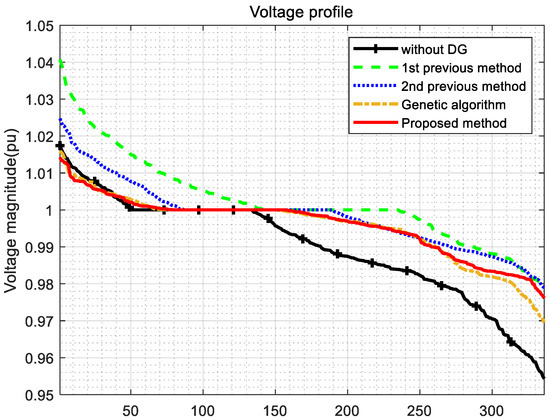
Figure 11.
Voltage profile (the IEEE 14-bus test feeder). All the bus locations for 24 h.
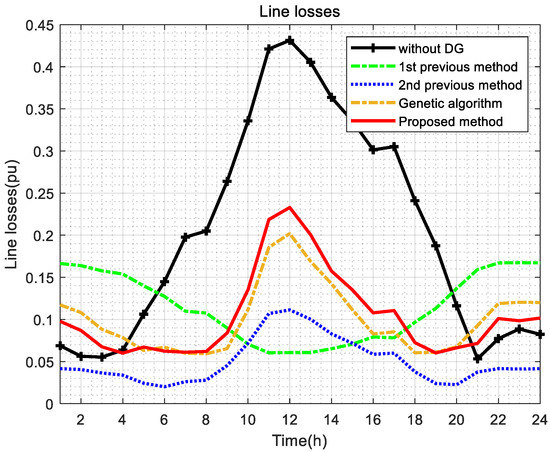
Figure 12.
Line losses profile.

Table 4.
Location and capacity of DG systems for the IEEE 14-bus test feeder.

Table 5.
Value of the objective function (the IEEE 14-bus test feeder).
6. Conclusions
In this paper, we aimed to find the location and capacity of DG that minimize the OF value consisting of voltage variation, line losses, and installation costs by applying VVC and load profile to PSO. We compared five models in two test systems to verify the validity of the algorithms presented in this paper. The first comparison model without DG (denoted as “without DG”) is a fundamental model of the test system and presents the highest voltage variation and line losses. Despite the installation cost being zero, its OF value is the highest. The second model (denoted as the first previous model) does not include VVC and load profile in PSO. This model applies only the peak load, resulting in the low line losses at the peak time. However, the voltage variation and overall line losses are higher than the other models. The third model (denoted as the second previous model) uses the 24-h load profile data. Additionally, this model to which VVC is not applied presents lower line losses and OF value than the previous models (“without DG” and the first previous model). GA and proposed models include VVC and load profile data. The two models show similar OF values, but the proposed method shows a lower OF value. The objective of this study is to enhance the PSO by using both VVC and load profile data. In the two test systems, the proposed method successfully optimizes DG to grid by reducing voltage variation and line losses by more than 50% over the conventional model without DG.
Tests in this paper were conducted on only the IEEE 14- and 30-bus test feeders. The IEEE-14 and 30-bus test feeders are large transmission systems (e.g., a base capacity of 100 MVA). Thus, large-capacity PV and wind farms, an example of large-capacity DG, can be optimally allocated in the transmission networks via the proposed PSO algorithm. However, it may be different from the results of this study in small distribution grids, which can be future work. That is, extension studies for grids with more complex and small capacity systems, longer-period load profile data, and unbalanced three-phase systems (e.g., 8760 h) are required as another future work. In addition, since the system tested in this paper is a theoretical test feeder, there is a limitation in directly applying the proposed PSO algorithm to an actual system. Therefore, in order to be applied to a real system, it is necessary to expand the proposed PSO algorithm to simulations based on actual field data.
Author Contributions
Conceptualization, I.K. and D.L.; methodology, D.L.; validation, D.L. and S.S.; formal analysis, D.L.; investigation, S.S.; writing—original draft preparation, D.L.; writing—review and editing, I.K.; supervision, I.K. All authors have read and agreed to the published version of the manuscript.
Funding
This work was also supported by the National Research Foundation of Korea, Basic Science Research Program (NRF-2019R1F1A1061259).
Data Availability Statement
The datasets generated during the current study are available from the corresponding author on reasonable request.
Conflicts of Interest
The authors declare no conflict of interest.
Nomenclature
| DG | distributed generation |
| IC | installation cost |
| GA | genetic algorithm |
| OF | objective function |
| PSO | particle swarm optimization |
| pu | per unit |
| PV | photovoltaic |
| VVC | Volt/Var control |
Appendix A
Appendix A.1. Newton–Raphson Method Power Flow
This study implements the established Newton–Raphson method. The method initially defines the solution set (x), including the angle (δ) and the magnitude (V) of the voltage,
where P and Q are the active and reactive power balance equations, respectively.
The method also defines the Jacobian matrix (J):
where Δy is the mismatch between active and reactive power balance. The slack bus is assumed to be the first bus. After starting with the initial solution set (e.g., x(0)), the method continues to satisfy the following convergence:
The method repeats Equations (A3)–(A6) until the power mismatch reaches within a specific value.
Appendix A.2. Result of Genetic Algorithm

Table A1.
Optimal location and capacity of DG (GA).
Table A1.
Optimal location and capacity of DG (GA).
| Location (bus) | Capacity (MVA) | |
|---|---|---|
| IEEE 30-bus | IEEE 14-bus | |
| 1 | 0 | 0 |
| 2 | 0 | 0 |
| 3 | 5.52 | 0 |
| 4 | 1.44 | 10.91 |
| 5 | 0 | 0.10 |
| 6 | 23.25 | 29.82 |
| 7 | 20.47 | 0.42 |
| 8 | 0 | 4.82 |
| 9 | 10.37 | 4.40 |
| 10 | 8.91 | 5.17 |
| 11 | 11.26 | 0.19 |
| 12 | 1.01 | 0 |
| 13 | 88.33 | 0 |
| 14 | 5.00 | 5.89 |
| 15 | 3.59 | - |
| 16 | 1.63 | - |
| 17 | 2.28 | - |
| 18 | 0.20 | - |
| 19 | 5.76 | - |
| 20 | 2.33 | - |
| 21 | 1.26 | - |
| 22 | 0.90 | - |
| 23 | 0.92 | - |
| 24 | 1.51 | - |
| 25 | 0.25 | - |
| 26 | 2.44 | - |
| 27 | 3.18 | - |
| 28 | 6.56 | - |
| 29 | 1.04 | - |
| 30 | 2.76 | - |
This paper does not consider the variation of the power generation and load of DG that changes over time, and in the future, it is necessary to study the location and capacity of DG considering these points and more detail variation factors.
References
- Chiradeja, P. Benefit of Distributed Generation: A Line Loss Reduction Analysis. In Proceedings of the 2005 IEEE/PES Transmission & Distribution Conference & Exposition: Asia and Pacific, Dalian, China, 18 August 2005; pp. 1–5. [Google Scholar]
- Kroposki, B.; Sen, P.K.; Malmedal, K. Optimum sizing and placement of distributed and renewable energy sources in electric power distribution systems. IEEE Trans. Ind. Appl. 2013, 49, 2741–2752. [Google Scholar] [CrossRef]
- Bollen, M.H.J.; Sannino, A. Voltage control with inverter-based distributed generation. IEEE Trans. Power Deliv. 2005, 20, 519–520. [Google Scholar] [CrossRef]
- Wang, Y.; Zhao, T.; Ju, C.; Xu, Y.; Wang, P. Two-Level Distributed Voltage/Var Control using Aggregated PV Inverters in Distribution Networks. IEEE Trans. Power Deliv. 2019, 35, 1844–1855. [Google Scholar] [CrossRef]
- Shang, W.; Zheng, S.; Li, L.; Redfern, M. A new volt/VAR control for distributed generation. In Proceedings of the 2013 48th International Universities’ Power Engineering Conference (UPEC), Dublin, Ireland, 2–5 September 2013; pp. 1–5. [Google Scholar]
- Biserica, M.; Besanger, Y.; Caire, R.; Chilard, O.; Deschamps, P. Neural networks to improve distribution state estima-tion—Volt var control performances. IEEE Trans. Smart Grid 2012, 3, 1137–1144. [Google Scholar] [CrossRef]
- Jabr, R.A. Robust Volt/VAr Control with Photovoltaics. IEEE Trans. Power Syst. 2019, 34, 2401–2408. [Google Scholar] [CrossRef]
- Ohnishi, T. Three phase PWM converter/inverter by means of instantaneous active and reactive power control. In Proceedings of the IECON ’91: 1991 International Conference on Industrial Electronics, Control and Instrumentation, Kobe, Japan, 28 October–1 November 1991; Volume 91, pp. 819–824. [Google Scholar] [CrossRef]
- Hcbson, E. Network Constrained Reactive Power Control Using Linear Programming. IEEE Trans. Power Appar. Syst. 1980, PAS-99, 868–877. [Google Scholar] [CrossRef]
- Cagnano, A.; De Tuglie, E.; Liserre, M.; Mastromauro, R.A. Online Optimal Reactive Power Control Strategy of PV Inverters. IEEE Trans. Ind. Electron. 2011, 58, 4549–4558. [Google Scholar] [CrossRef]
- Patidar, R.; Singh, S. Active and reactive power control and quality management in DG-grid interfaced systems. ARPN J. Eng. Appl. Sci. 2009, 4, 81–90. [Google Scholar]
- Chen, G.; Lewis, F.L.; Feng, E.N.; Song, Y. Distributed Optimal Active Power Control of Multiple Generation Systems. IEEE Trans. Ind. Electron. 2015, 62, 7079–7090. [Google Scholar] [CrossRef]
- Kim, I. The Optimization of the Location and Capacity of Reactive Power Generation Units, Using a Hybrid Genetic Algo-rithm Incorporated by the Bus Impedance Power-Flow Calculation Method. Appl. Sci. 2020, 10, 1034. [Google Scholar] [CrossRef]
- Asare-Bediako, B.B.; Kling, W.W.; Ribeiro, P.P. Future residential load profiles: Scenario-based analysis of high penetration of heavy loads and distributed generation. Energy Build. 2014, 75, 228–238. [Google Scholar] [CrossRef]
- Pereira, B.R.; da Costa, G.R.M.; Contreras, J.; Mantovani, J.R.S. Optimal distributed generation and reactive power allocation in electrical distribution systems. IEEE Trans. Sustain. Energy 2016, 7, 975–984. [Google Scholar] [CrossRef]
- Jahangiri, P.; Aliprantis, D.C. Distributed Volt/VAr control by PV inverters. IEEE Trans. Power Syst. 2013, 28, 3429–3439. [Google Scholar] [CrossRef]
- Kim, I. Optimal distributed generation allocation for reactive power control. IET Gener. Transm. Distrib. 2017, 11, 1549–1556. [Google Scholar] [CrossRef]
- Talaat, H.E.; Al-Ammar, E. Optimal allocation and sizing of Distributed Generation in distribution networks using Genetic Algorithms. In Proceedings of the 11th International Conference on Electrical Power Quality and Utilisation, Lisbon, Portugal, 17–19 October 2011; pp. 1–6. [Google Scholar]
- Martinez, J.A.; Guerra, G. A Parallel Monte Carlo Method for Optimum Allocation of Distributed Generation. IEEE Trans. Power Syst. 2014, 29, 2926–2933. [Google Scholar] [CrossRef]
- Lee, S.H.; Park, J.-W. Optimal Placement and Sizing of Multiple DGs in a Practical Distribution System by Considering Power Loss. IEEE Trans. Ind. Appl. 2013, 49, 2262–2270. [Google Scholar] [CrossRef]
- Nekooei, K.; Farsangi, M.M.; Nezamabadi-Pour, H.; Lee, K.Y. An Improved Multi-Objective Harmony Search for Optimal Placement of DGs in Distribution Systems. IEEE Trans. Smart Grid 2013, 4, 557–567. [Google Scholar] [CrossRef]
- Liu, K.; Zou, C.; Li, K.; Wik, T. Charging Pattern Optimization for Lithium-Ion Batteries With an Electrothermal-Aging Model. IEEE Trans. Ind. Inform. 2018, 14, 5463–5474. [Google Scholar] [CrossRef]
- Liu, K.; Hu, X.; Yang, Z.; Xie, Y.; Feng, S. Lithium-ion battery charging management considering economic costs of electrical energy loss and battery degradation. Energy Convers. Manag. 2019, 195, 167–179. [Google Scholar] [CrossRef]
- Liu, K.; Hu, X.; Zhou, H.; Tong, L.; Widanalage, D.; Marco, J. Feature Analyses and Modelling of Lithium-ion Batteries Manufacturing based on Random Forest Classification. IEEE/ASME Trans. Mechatron. 2021, 1. [Google Scholar] [CrossRef]
- Liu, K.; Wei, Z.; Yang, Z.; Li, K. Mass load prediction for lithium-ion battery electrode clean production: A machine learning approach. J. Clean. Prod. 2021, 289, 125159. [Google Scholar] [CrossRef]
- Farh, H.M.H.; Al-Shaalan, A.M.; Eltamaly, A.M.; Al-Shamma’A, A.A. A Novel Crow Search Algorithm Auto-Drive PSO for Optimal Allocation and Sizing of Renewable Distributed Generation. IEEE Access 2020, 8, 27807–27820. [Google Scholar] [CrossRef]
- Cabrera-Tobar, A.; Bullich-Massagué, E.; Aragüés-Peñalba, M.; Gomis-Bellmunt, O. Active and reactive power control of a PV generator for grid code compliance. Energies 2019, 12, 3872. [Google Scholar] [CrossRef]
- Kim, I.; Harley, R.G.; Regassa, R. Optimal distributed generation allocation on distribution networks at peak load and the analysis of the impact of volt/var control on the improvement of the voltage profile. In Proceedings of the 2014 North American Power Symposium (NAPS), Fargo, ND, USA, 9–11 September 2018; pp. 1–5. [Google Scholar]
- Dugan, R.C.; Arritt, R.; Smith, J.; Rylander, M. OpenDSS Training Workshop; Electric Power Research Institute, University of North Carolina at Charlotte: Charlotte, NC, USA, 2013. [Google Scholar]
- Araujo, F.B.; Prada, R.B. Distributed generation: Voltage stability analysis. In Proceedings of the 2013 IEEE Grenoble Conference, Grenoble, France, 16–20 June 2013; Institute of Electrical and Electronics Engineers (IEEE): Piscataway, NJ, USA; pp. 1–4. [Google Scholar]
- IEEE Std 1547a-2014 (Amendment to IEEE Std 1547-2003). IEEE Standard for Interconnecting Distributed Resources with Electric Power Systems—Amendment 1; IEEE Standards Association, 2014; Available online: https://ieeexplore.ieee.org/servlet/opac?punumber=6818980 (accessed on 1 August 2019).
- Voltage Characteristics of Electricity Supplied by Public Distribution Systems; European Committee for Electrotechnical Standardization: Brussels, Belgium, 2005.
- Dabbagchi, I. IEEE 30-Bus System. American Electric Power System. Available online: http://www.ee.washington.edu/research/pstca/pf30/pg_tca30bus.htm (accessed on 1 August 2019).
- Kim, I. Optimal capacity of storage systems and photovoltaic systems able to control reactive power using the sensitivity analysis method. Energy 2018, 150, 642–652. [Google Scholar] [CrossRef]
- Kim, I.; Harley, R.G. Examination of the effect of the reactive power control of photovoltaic systems on electric power grids and the development of a voltage-regulation method that considers feeder impedance sensitivity. Electr. Power Syst. Res. 2020, 180, 106130. [Google Scholar] [CrossRef]
- Dabbagchi, I. IEEE 14-Bus System. American Electric Power System. Available online: http://labs.ece.uw.edu/pstca/pf14/pg_tca14bus.htm (accessed on 1 August 2019).
Publisher’s Note: MDPI stays neutral with regard to jurisdictional claims in published maps and institutional affiliations. |
© 2021 by the authors. Licensee MDPI, Basel, Switzerland. This article is an open access article distributed under the terms and conditions of the Creative Commons Attribution (CC BY) license (https://creativecommons.org/licenses/by/4.0/).