1. Introduction
Transportation infrastructures (TIs) have a pivotal role in ensuring citizens’ liveability, safety, security, and health in urban settings. In the environment, modern critical infrastructures have become more competent in the way they operate, function, and interact with citizens, customers, and between each other, leading to the birth of smart cities (SCs). The smart city can now be defined as a complex network of technologically advanced critical infrastructures connected in a digital environment, characterized by a massive and increasing presence of IoT objects and underlying technologies [
1]. A TI becoming smarter involves regular operation and use, making it more adaptive, more intelligent, and more connected. Moreover, in the case of excessive optimization, it could also make TIs more vulnerable and subject to cascading effects, and therefore less resilient. Following recent disruptive human-made and natural events, including the COVID-19 pandemic, it has become clear that the smart city itself is not sufficient to protect citizen life, and shall move to an upgraded and more secure version of itself: the resilient city [
1].
The population inhabiting metropolitan areas around the world is increasing at an alarming rate. In 2008, 50% of the world’s population lived in urban areas, and was growing exponentially. By 2050 [
2], it is expected that 70% of the world’s population will live in metropolitan regions. Due to this rapid population growth, cities will face new challenges [
3], such as increased waste, pollution, traffic congestion, and road accidents.
Traffic management is a topic the research community has been tackling for more than 40 years [
4]. Cities’ policymakers approach this problem by integrating new technologies in their solutions, such as sensors, video images, microwave radar, infrared sensors, laser sensors, audio sensors, and Global positioning System (GPS) sensors equipped in smartphones and vehicles, which provide large quantities of data. With appropriate data science methodologies, scientists can now predict real-time traffic trajectories and patterns based on historical data [
5].
The availability of such data sources with open access has led to new data-driven approaches, cost-effective mobile services, and applications that stand as the cornerstone of intelligent transportation systems (ITSs). Road traffic congestion is a problem that leads to delays, energy consumption, and environmental pollution [
6]. ITSs can improve citizens’ sustainable urban mobility and quality of life, providing solutions to pollution and traffic congestion, promoting reduction of road accidents [
7] and energy consumption. ITSs can contribute to key public policy and systematic management, reducing traffic congestion and energy consumption in urban areas.
The World Health Organization (WHO) estimates road accidents are the ninth leading cause of death globally across all age groups, and are the main cause of death among people aged between 15 and 29 years. Road accidents are a cause of life losses, and bring health and socioeconomic costs [
8].
All over the globe, countries are adopting measures to decrease road fatalities. Speed management, infrastructure design and improvement, enforcement of traffic laws, leadership on road safety, vehicle safety standards, and post-crash survival are some of the currently ongoing initiatives that aim to mitigate this hazard [
8]. A large number of road accidents occur due to various factors that directly or indirectly affect conditions on the road for drivers, passengers, and pedestrians [
9]. Factors such as gender and age, or environmental factors such as low brightness (dawn or dusk) and adverse weather conditions [
10], influence the world’s global number of road accidents.
In Portugal, drivers spend a daily average of 42 min in urban traffic and an average of 160 h each year in traffic jams [
11]. Traffic congestion is one of the causes of road accidents. This is considered one of the most serious problems in today’s Portuguese society and a public health issue. According to Autoridade Nacional de Segurança Rodoviária (ANSR) [
12], compared to 2018, the number of accidents with victims increased by 4% in 2019, with a reduction of 9% in the number of fatalities. Despite this fall in fatalities, serious injuries increased by 9%. The geographic distribution of road traffic victims in 2019 shows that Lisbon and Porto have approximately 40% of the country’s total number of victims.
Our research aim was to analyze and visualize data of two traffic phenomena: traffic congestion and road accidents, with Lisbon as a case study. Lisbon is the capital of Portugal, with a population of 508,368, and 2 million people (20% of Portugal’s population) living in the urban metropolitan area commute to Lisbon. Around 370,000 vehicles enter Lisbon every day, adding to the 200,000 vehicles that already circulate in the city. We investigated and constructed an overview of traffic congestion and road accidents in Lisbon by analyzing 2019 data. Our main research goal was to correlate traffic and road accidents, identifying how people move in a city and how weather conditions affect traffic congestion and road accidents, with a multivariable analysis and visualization. Furthermore, our research goal aimed to provide data-driven guidelines and knowledge about traffic and road accidents in Lisbon to the city authorities and policymakers in the framework of a traffic management and visualization tool to help them mitigate such phenomena.
Our study addresses the following research questions:
RQ1: How can we characterize Lisbon’s road traffic patterns?
RQ2: How can we characterize road accident patterns in Lisbon, and what are the external factors that contribute the most to this phenomenon?
RQ3: With a better understanding of Lisbon’s traffic and road accident patterns, how can we identify how citizens move in Lisbon with the help of data visualization?
The paper is structured as follows:
Section 2 presents our literature review. In
Section 3, Data-Driven Solution for Decision Support, we introduce the adopted cross-industry standard process for data mining (CRISP-DM) methodology and the application to our Lisbon case study, particularly the business and data understanding, data preparation and fusion, and data visualization phases. In
Section 4, we provide a comparative analysis of traffic and road accidents, discuss our findings and compare them to the literature review, and analyze our approach to addressing the research questions. We also identify research gaps and the limitations of our research. Finally, in
Section 5, we present conclusions and draw lines for further research.
2. Literature Review
Our literature survey covered traffic congestion and road accidents in urban areas. We found just a few articles in these fields, with a focus on data analysis and visualization of traffic congestion and road accident. On the other hand, we found that most articles used prediction models to address how external factors influenced traffic and road accidents in cities.
Studies [
7,
8,
11,
13] on road accidents in Spain, India, and the United States of America (Washington) showed different approaches and results. Palazón-Bru [
10] studied Spain road accident data from 2015, and considered variables associated with the accident, the vehicle, and individuals. This information could be used by both police authorities and health services to make predictions and determine where to undertake possible interventions to reduce death risk. Factors like not using a seat belt; unfavorable lighting; interurban roads where greater speed is reached; and small vehicles driving alongside buses or trucks, which, in the event of a small vehicle rollover, could cause its occupants’ death, were the more prevalent. The authors concluded that individuals younger than 60 years had lower mortality rates.
In India, road accidents were analyzed [
9], and the authors concluded that the period between 3 p.m. and 6 p.m. corresponded to the peak traffic hours, but this changed between states in India. The study [
9] showed that two-wheeled vehicles are involved in accidents more, and over 80% that occurred were the driver’s fault. These authors also concluded that accident severity was growing due to the increase in the number of vehicles. Another interesting result was that 61% of accidents occurred on the weekend (Friday and Saturday), which correlated well with alcohol consumption.
Combining data analytics with data visualization allows effective communication of research insights and provides visualization tools to policymakers and public authorities. According to Chen [
14], a pipeline of traffic visualization is an adequate tool to assess traffic data properties and discover hidden patterns in the data. Chen [
14] proposed an analysis based on four factors: temporal, spatial, spatio-temporal, and multivariable.
Traffic congestion analysis and visualization combined with factors such as car trajectories in peak hours [
15] has proven to be an interesting tool to understand mixed traffic conditions. A multivariable analysis of vehicle types and car flow models improves mixed traffic-flow trajectories.
Multivariable analysis has shown effectiveness in communicating data insights by providing visualizations of road accidents within a time range and city areas [
16] where they most occur. Moreover, it can be combined with data regarding type of vehicle, lighting conditions, weather conditions, month of the year, and day of the week.
Other factors can be analyzed in a multivariable analysis and visualization regarding road conditions [
17] and how they affect traffic congestion and road accidents. Tools such as RetinaNet enhance results by training images and providing better performance metrics of road conditions.
The impacts of traffic congestion on road accidents are a common study field, as congestion can trigger road accidents. Studies [
18,
19] showed the application of Poisson–Gamma models to modeling road accidents. Wang [
19] specifically looked at this correlation to measure congestion using Poisson nonspatial and spatial models. Aguero-Valverde [
20] looked at road-accident frequency with spatial models using a Bayesian hierarchical approach to identify spatial correlations.
Visual analytics provides the ability to analyze several tasks, such as traffic congestion detection, accident monitoring, and flow-pattern recognition. These tools are essential to what constitutes an intelligent transportation system (ITS). According to Zhang [
21], having access to large quantities of data obtained through multiple sensor sources facilitates the development of a data-driven ITS based on vision, multisource, and machine algorithms. Such a visual-analytics approach is particularly efficient at predicting and managing traffic flows in urban areas.
Using visual analytics to aid in the interpretation of forecasting models is becoming the norm. Andrienko [
22] used visual-analysis techniques to study the relationship between traffic intensities and speeds practiced on the roads by using mathematical models. These models could be used to predict everyday traffic situations, as well as to simulate future events. According to this author, visualization, as a tool for prediction, should be developed evolutionarily and iteratively through a cycle of data analysis, model development, and analysis of predictions.
As mentioned at the beginning of this section, most of the analyzed traffic and road accident papers presented their analysis and prediction methodologies combined. For this reason, we will also discuss how the scientific community has addressed traffic and road accident prediction in their studies.
The research community in traffic frequently uses two specific machine-learning techniques for predicting traffic flow. Those are the long short-term memory (LSTM) and recurrent neural networks (RNNs).
ITS systems are considered essential tools for mitigating automobile traffic, and because of that, providing a good forecast of automobile flow is essential for this system’s effectiveness. Several authors have proposed hybrid models for better traffic prediction in the city due to conventional machine-learning models’ weak adaptability.
A specific traffic-flow-prediction framework was proposed by Xiangxue [
23] by combining LSTM and RNN models to evaluate two urban networks. The results showed that this approach brought better quality than other machine-learning models.
Current prediction models have problems such as poor stability, significant data needs, and poor adaptability. Liu [
24] defined a model derived from the RNN that combined long short-term memory (SDLSTM) with auto-regressive integrated moving average (ARIMA). The end result presented excellent adaptability and higher precision than common machine-learning methods. This hybrid model integrated computer vision and machine learning in a cloud-computing environment.
Zheng [
25] used another LSTM model and compared it with the conventional machine-learning models such as ARIMA and BPNN (back-propagation neural network), and obtained substantially superior results.
Regarding road accidents, Norros [
26] found that factors such as weather, traffic, and location could be included as variables when creating models to predict road accidents. Driver characteristics do not depend on the time of day, traffic, or weather, but weather and other external conditions affect traffic intensity and constitution.
Tang [
13] used the Washington Incident Tracking System and applied a combined analysis using eight methods: four statistical methods (accelerated failure time (AFT), finite mixture (FM), random parameters hazard-based duration (RPHD), and quantile regression (QR); and four machine-learning methods (K-nearest neighbor (KNN), support vector machine (SVM), BPNN, and random forest (RF)) used in traffic-incident clearance-time analysis. All showed that temporal factors like day of the week, time of day, and month of year influence accidents.
Table 1 summarizes our literature review analysis, with a focus on the papers’ dimensions and applications.
3. Data-Driven Solution for Decision Support
The Cross-Industry Standard Process for Data Mining (CRISP-DM), which was adopted in our research, is a methodology that aims to create a standard approach to data-mining projects to reduce costs and increase reliability, repeatability, and manageability, making the data-mining process more efficient [
27]. CRISP-DM [
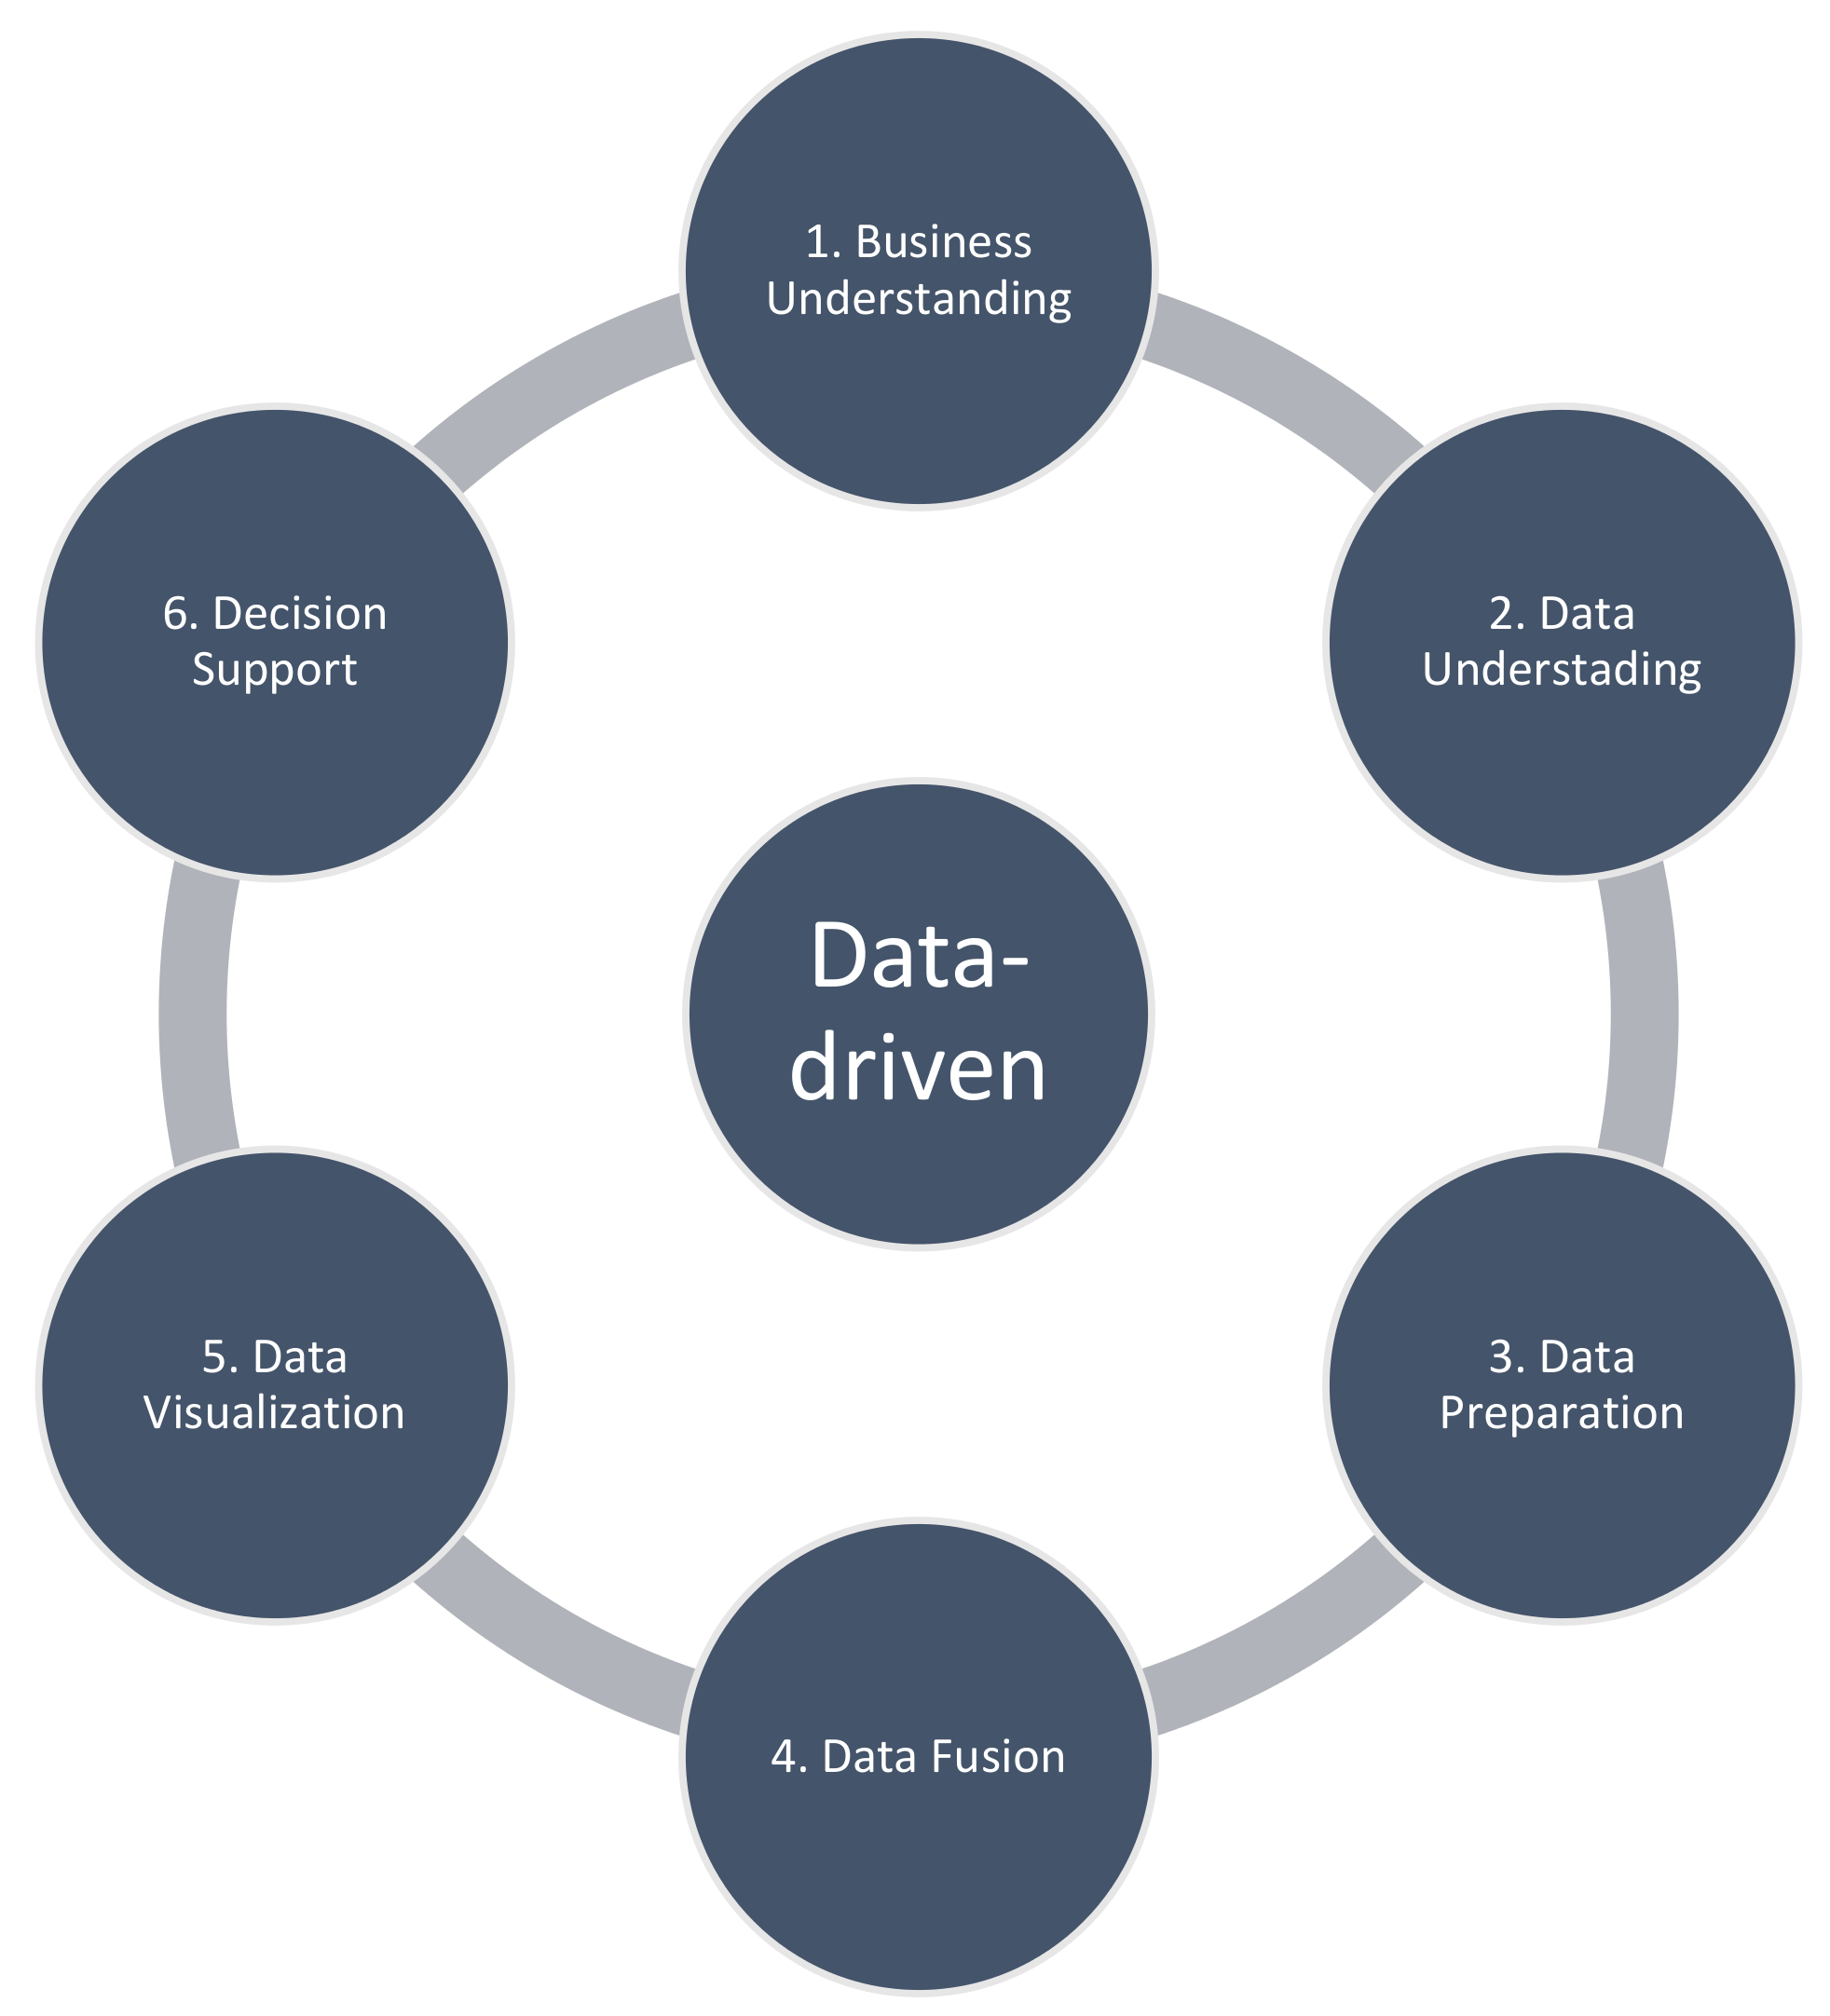
28] is composed of six phases, and we changed the process toward specific data visualization, taking into account data fusion from different sources (
Figure 1). The first and second phases, business understanding and data understanding, are when the initial data are collected, described, explored, and verified. In the third phase, data preparation, data are selected and cleaned, exploring and verifying data quality, integration, and format. In the fourth phase, data fusion, we selected the data sources, like traffic, accidents, weather, city infrastructure, pollution, and data warehouse. In the fifth phase (data visualization), we defined visualization templates to automatically visualize temporal and spatial data to define goals based on municipalities’ needs. Finally, the last-step decision and the big picture were provided to competent decision-making authorities.
Applying CRISP-DM involved business understanding by looking at the aim of the challenges proposed by the Lisbon City Hall (CML) in the framework of Lisboa Inteligente—LxDataLab [
29]. It also required the definition of our strategy to address the research questions. In the data-understanding phase, traffic and road accident data sets were described and categorized in features. This was followed by the data-preprocessing phase, in which the collected data were cleaned and normalized, generating new data sets to be used in the modeling phase comprising analysis and visualization.
3.1. Business Understanding
Our study addressed the challenges of “General traffic index and indexes for the main Lisbon city entrances” [
30] and “Identification of road accidents patterns and correlation with external factors” [
31], both launched by Lisboa Inteligente—LxDataLab [
29] for academia. Our study’s objective was to investigate and identify traffic and accident patterns in Lisbon’s metropolitan area, define when and where traffic congestion and accidents road occur and how they relate, and how external factors such as weather and pandemics affect such phenomena.
3.2. Data Understanding
The data-understanding phase aimed to collect, describe, explore, and verify the data’s quality. This step was structured in three subphases: describe, explore, and verify data quality.
Traffic congestion and road accident data sets were provided and collected from Lisboa Inteligente—LxDataLab [
29] on the scope of the challenges launched for academia, as mentioned previously.
3.2.1. Traffic Data Understanding
The data-understanding phase aimed to collect, describe, explore, and verify the quality of the data available. This step contained three subphases (describe, explore, and verify data quality).
The traffic-congestion data set included Waze data [
30], preprocessed by Lisboa Inteligente—LxDataLab [
29], with data from traffic jams in the Lisbon metropolitan area, in the period of 1 January 2019 to 30 July 2020. The provided data set had a table structure with 25 columns and 12,619,459 rows in the comma-separated values (CSV) file format.
The data set provided had already been preprocessed before extraction. Some columns needed to be removed, and minor alterations and improvements in the data quality were made. Some duplicated columns with no values (Endnode, pubmillis, Roadtype, turnType, turntype, Typeentity) and some columns (Bbox, entity_location, entity_type, fiware_service, fiware_servicepath, and pubMillis) deemed irrelevant by the CML were removed. Additionally, the Country column was removed because all data were from Lisbon (Portugal).
Table 2 shows the Waze data schema, and each column corresponds to the column name, description, the removed columns (excluded columns), and the reasons for removal.
After removing the columns, an assessment of the data quality was executed on the remaining columns, and although the data was consistent and no significant problems were found, some adjustments had to be made in the next step of the CRISP-DM methodology.
3.2.2. Road Accident Data Understanding
In the scope of the Lisboa Inteligente—LxDataLab [
29] challenge 51, the provided data set was a single Excel file with aggregated data from Agência Nacional para a Segurança Rodoviária (ANSR), Polícia de Segurança Pública (PSP), and Guarda Nacional Republicana (GNR), with a list of road accidents (RSB) events in Lisbon involving vehicles and motorcycles from January to December 2019. The Excel file included four sheets with the following structure: accidents (
Table 3) with 37 columns and 2768 rows; vehicles involved and their driver (
Table 4), with 18 columns and 4834 rows; passengers (
Table 5), with eight columns and 631 rows; and pedestrians (
Table 6), with seven columns and 700 rows.
3.3. Data Preparation and Fusion
3.3.1. Traffic Data Preparation and Fusion
This phase of the CRISP-DM methodology was subdivided into four subphases: data selection, data cleaning, feature selection, and data integration. All columns were selected except for Country, Typeentity, and Validity_ts. The Country column had no value, since the data all were from Lisbon, Portugal. The Typeentity column had only five levels: NONE (12,531,806 entries), Small (46,417 entries), Medium (25,794 entries), Large (15,313 entries), and Huge (129 entries), with NONE being the value in almost all of the rows; for that reason, this column was removed. The Validity_ts column also was removed, given that this work’s main focus was on the occurrence of each event and not the archive date, so the Entity_ts column was used to the detriment of Validity_ts (date of LxDataLab archive—
Table 1).
After the final column selection, all the columns were carefully inspected [
32,
33], and we made a few improvements in the data quality, as depicted in
Table 7.
When the traffic level was 5, the Delay column had the value “−1”, and this value could not be used for analysis. To surpass this problem without impacting the column values, “−1” was treated like missing data and replaced with a value prediction using a Pearson correlation and linear regression [
24,
25].
Table 8 shows the Pearson correlation between all variables. The variables Length, Level, and Road Type were selected to find the missing values because of the high correlation with the variable Delay.
When applying the values predicted by the linear regression algorithm to the original data set, we could observe an increase in the mean and median, and a decrease in the standard deviation, which could be explained by the increase in traffic occurrences with a high delay (level 5 traffic level).
Table 9 shows the impact of the application of predicted values to the original dataset:
According to the terms of the proposed challenge by the Lisbon City Hall, which stated that the aim was to “evaluate the traffic, the main entry points, and the main roads within the capital that are freeways”, we filtered the main entry points of the city to include only road types 2 and 3 (primary streets and freeways, respectively), reducing the total number of rows to 5,123,746, or 4,982,407 primary streets and 141,339 freeways.
With the reduced dimensionality [
32,
33], we created new features to improve the display of information:
entity_Date: Conversion of the entity_ts from UNIX time to standard date format (year-month-day hour:minute:second).
Traffic Level: Level of the traffic according to the variable Traffic:
- ◦
1 = Low traffic
- ◦
2 = Low to medium traffic
- ◦
3 = Medium traffic
- ◦
4 = High traffic
- ◦
5 = Traffic jam
length_KM: Length of the traffic in kilometers
delay_M: Delay in minutes
delay_H: Delay in hours
Date_key: Date identification in a format yyyymmdd
3.3.2. Road Accident Data Preparation and Fusion
We performed data cleaning and preprocessing in Python, using the Spyder platform [
34] and Python libraries, such as Numpy [
35], Pandas [
36], Matplotlib [
37], and Seaborn [
38].
From the initial data set comprising 4 Excel sheets, four corresponding new data sets were generated: ‘acidentes’, referring to accidents; ‘veíc-cond’, referring to vehicles involved; ‘passageiros’, corresponding to passengers; and ‘peões’, meaning pedestrians.
In the next step, data cleaning, we replaced some strings with null values since they did not add value. For example, ‘NÃO DEFINIDO’ was replaced by ‘nan’. Some columns were deleted (acidentes: IdAcidente, Sentidos, Pov Próxima, Km; veíc-cond: IdAcidente, id_veiculo, certificado_adr; passageiros: IdAcidente, id_veiculo, id_passageiro; peões: IdAcidente, id_peao), while others were renamed and then converted for the string type. In addition, in the data cleaning, due to the occurrence of a large number of ‘nan’ in the categoria_veiculo column, regarding the veíc-cond data frame, ‘nan’ values were replaced, taking into account the values in the tipo_veiculo column. The data set was divided by type of accident: mislead (despiste), collision (colisão), and runover (atropelamento). The Datahora column was divided in date and hour to show on what day of week and what hour of the day more accidents occurred, or even in what season of the year (spring, summer, autumn, or winter). From the Datahora, we therefore created hora (hour) and mes (month), as well as new columns: nome_estacao (season) and momentoDia (moment of the day), to analyze the moment of the day and the moment of the year when accidents were more likely to happen. In the veíc-cond, passageiros, and peões data sets, age was aggregated to create an average column. A new data set was created with latitude and longitude columns to visualize the Lisbon map’s geographic coordinates.
3.4. Data Visualization
3.4.1. Traffic Model
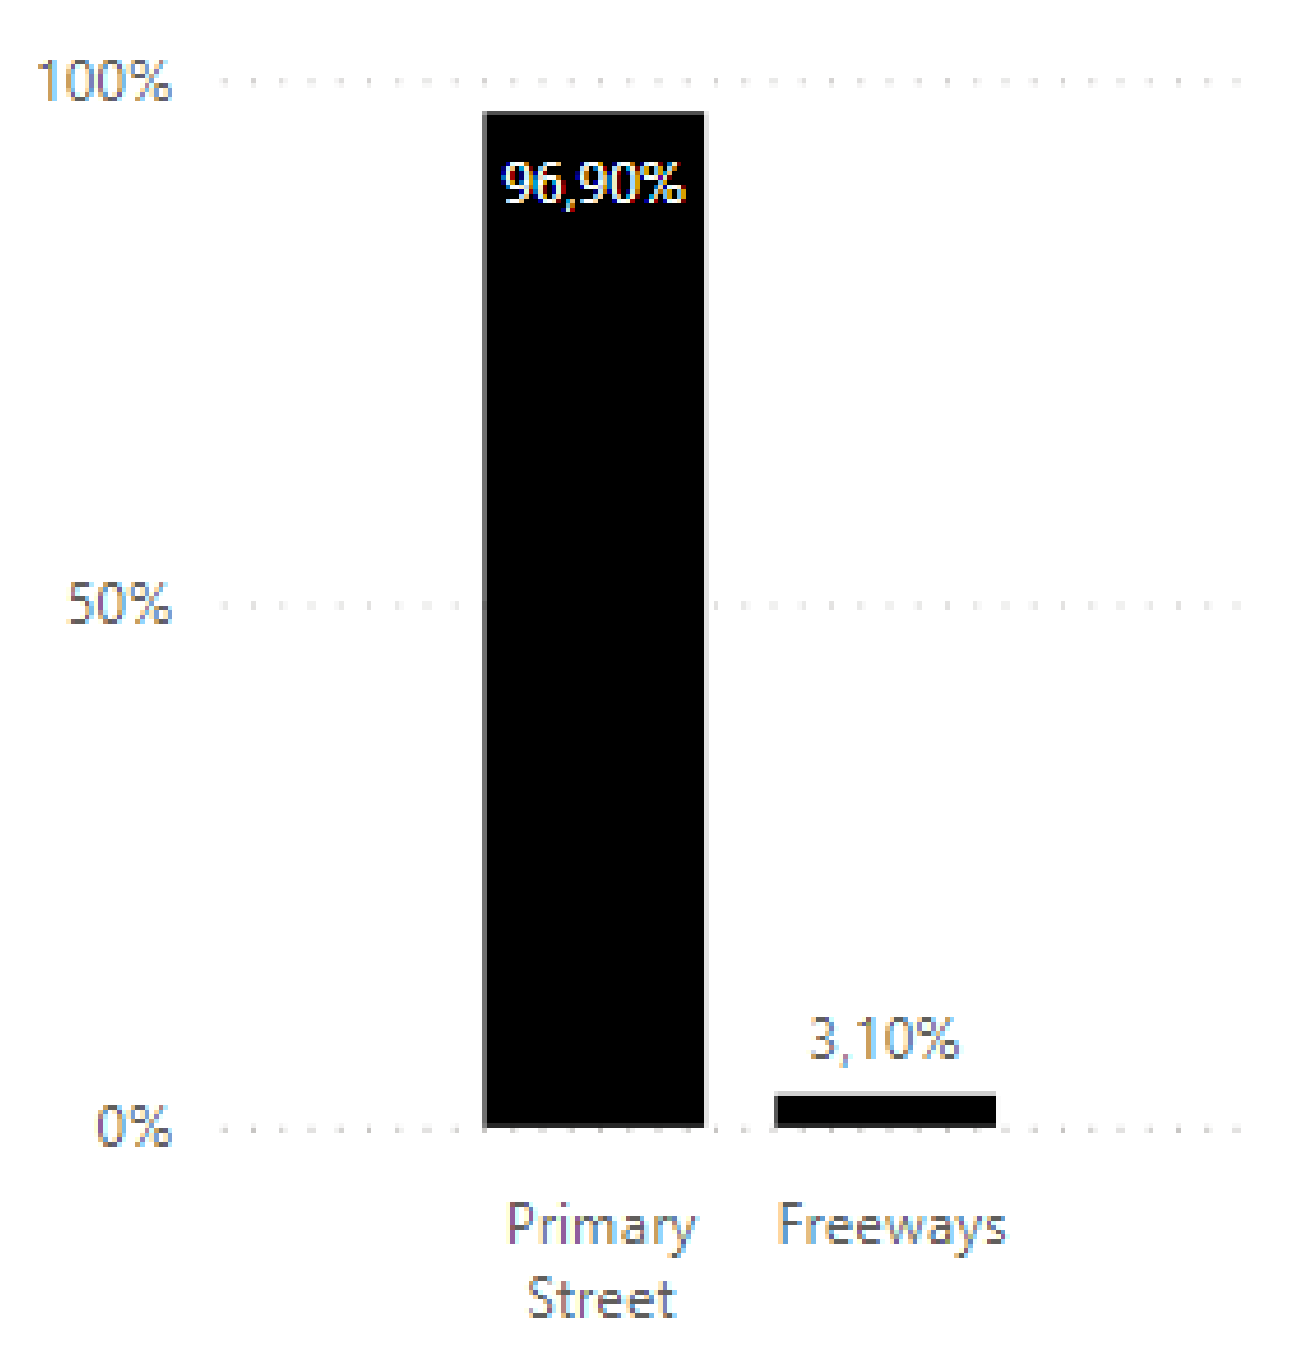
Our modeling results showed that in 2019, 96.90% of the traffic congestion occurred on primary streets, and 3.10% of the traffic congestion occurred on freeways, as shown in
Figure 2.
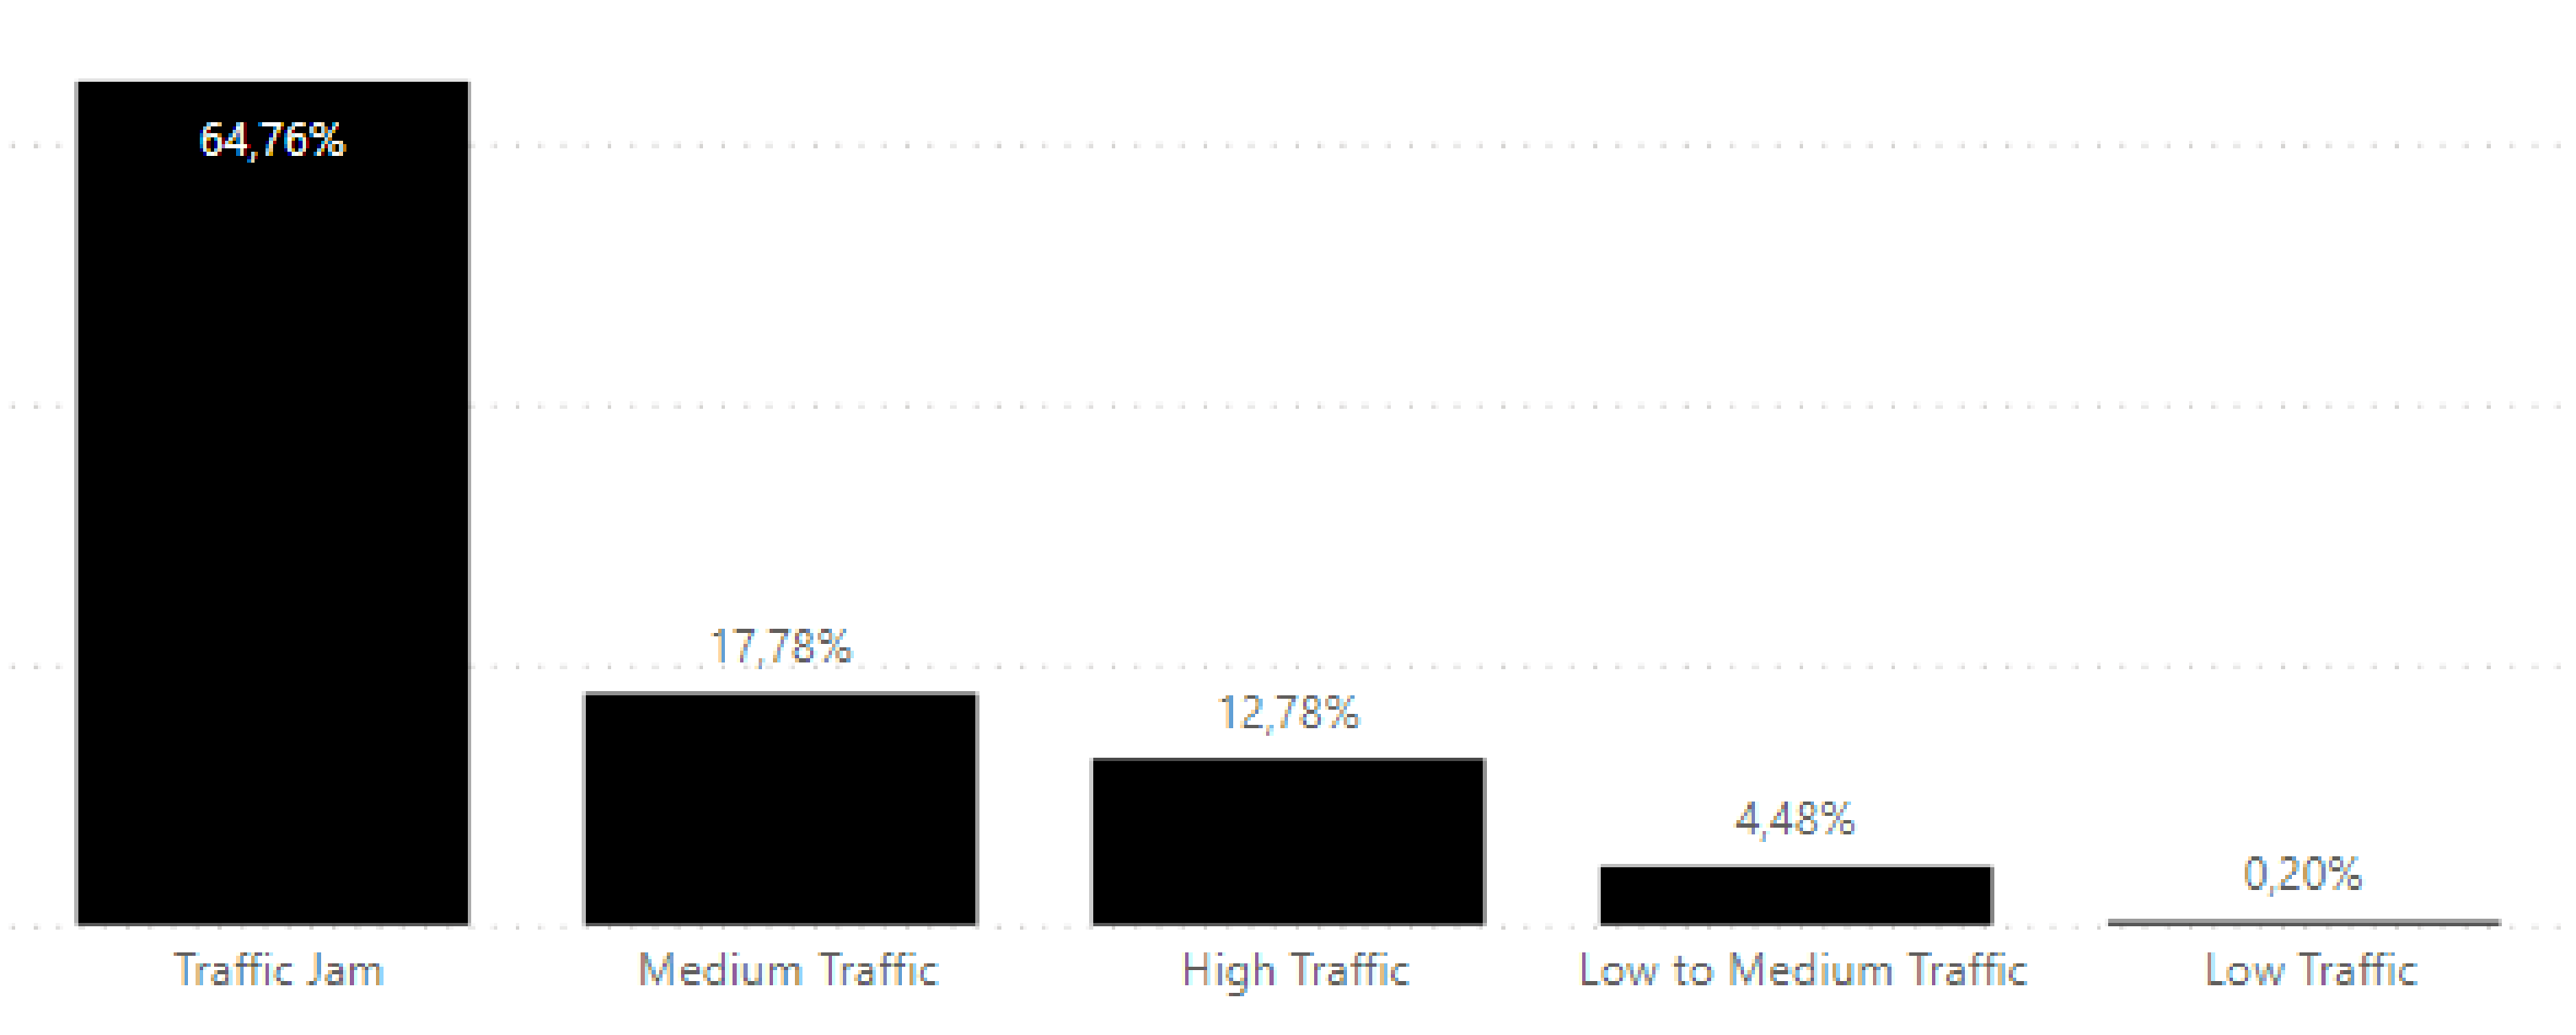
Figure 3 displays the distribution of traffic levels presented for both freeways and primary streets: 64.76% of the traffic corresponded to a level 5 occurrence (traffic jam), 17.78% to level 3 (medium traffic), 12.78% to level 4 (high traffic), 4.48% to level 2 (low to medium traffic), and only 0.20% to level 1 (low traffic).
Our data analysis showed that 5.39% of level 5 traffic occurrences happened on freeways versus 66.66% on primary streets, and 34.30% of level 4 traffic occurred on freeways versus 12.09% on primary streets. The data also showed that traffic level 3 traffic was more common on freeways, with 44.28% vs. 16.93% on primary streets, and level 2 traffic was more common on freeways, with 14.62% compared to primary streets with 4.16%. The model also showed that level 1 traffic was the least-common traffic on both freeways (1.41%) and primary streets (0.16%).
The average traffic length on freeways was 1.71 km, and the average delay was 5.27 min. In comparison, primary streets had an average traffic length of 0.19 km and an average delay of 3.86 min.
Table 14 displays the average traffic delay and length distributed by road type and traffic level.
According to our analysis, rush hours in Lisbon occur between 8 a.m. and 9 a.m. in the morning and between 5 p.m. and 6 p.m. in the evening, and make up 24.77% of daily traffic occurrences (11.34% in the morning and 13.43% in the afternoon).
Lisbon boroughs Paço do Lumiar, Sacavém, Lumiar, Ajuda, and Belém together displayed 80.93% of the Lisbon metropolitan area’s traffic occurrences. In 2019, the months with higher traffic were October (16.61%), November (16.91%), and December (15.95%), and the months with lower traffic were April (1.83%), February (2.76%), and January (2.88%).
Our analysis also showed that the freeway IC17 and CRIL had a higher percentage of traffic occurrences (26.61%) and an average delay of 4.84 min, followed by A5 with 22.16% and an average delay of 4.53 min. The freeway with the highest delay was IP7/Eixo N-S, with an average delay of 8.07 min, followed by IC-19, with an average delay of 5 min.
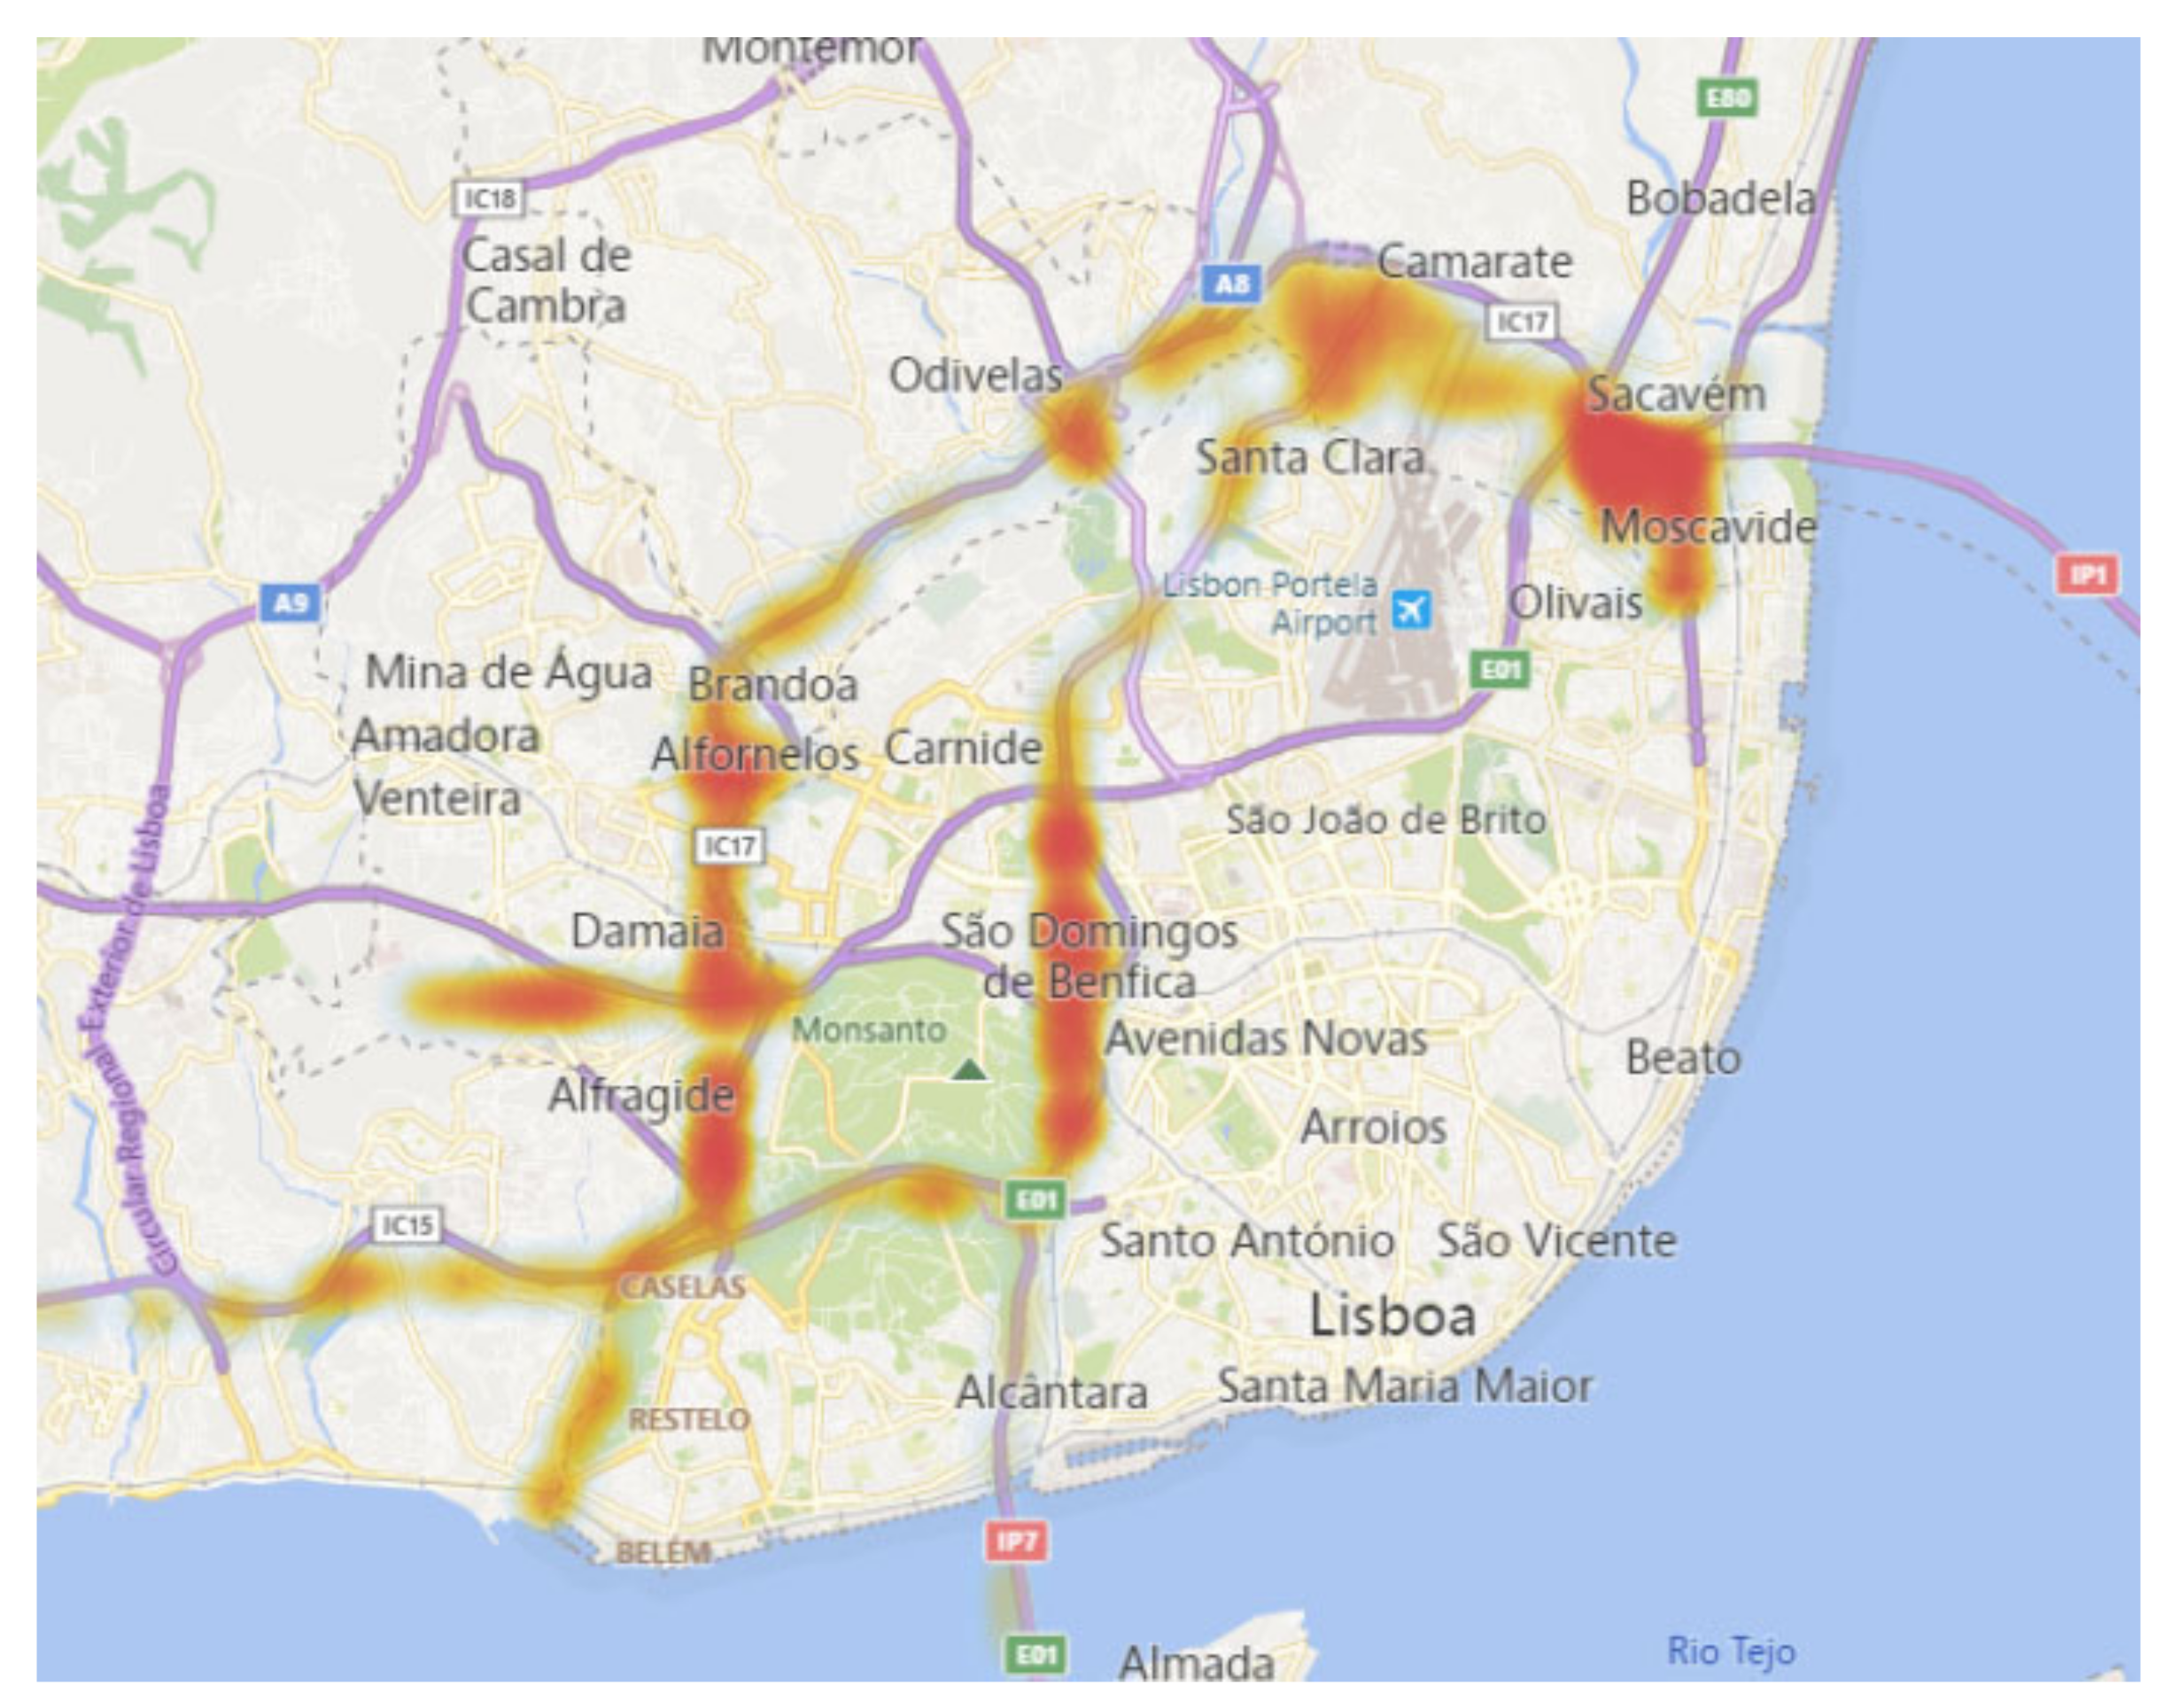
Figure 4 shows the distribution of traffic on Lisbon freeways.
Analysis of primary roads showed that Rua Direita in Lumiar, Rua Auta da Palma Carlos in Sacavém, and Calçada da Ajuda in Ajuda combined to make up 54.75% of the traffic occurrences on Lisbon’s primary streets. According to the data, these streets were also the ones with the highest delays, where drivers experienced an average delay of 5 min.
Figure 5 shows the distribution of traffic on primary streets.
3.4.2. Road Accident Model
Modeling, which involved analysis and visualization, was performed in Python with the Spyder platform. Python libraries such as Numpy [
35], Pandas [
36], Matplotlib [
37], and Seaborn [
38] were used for statistical analysis, and Folium [
39] and Geopandas [
40] were used for spatial analysis visualization.
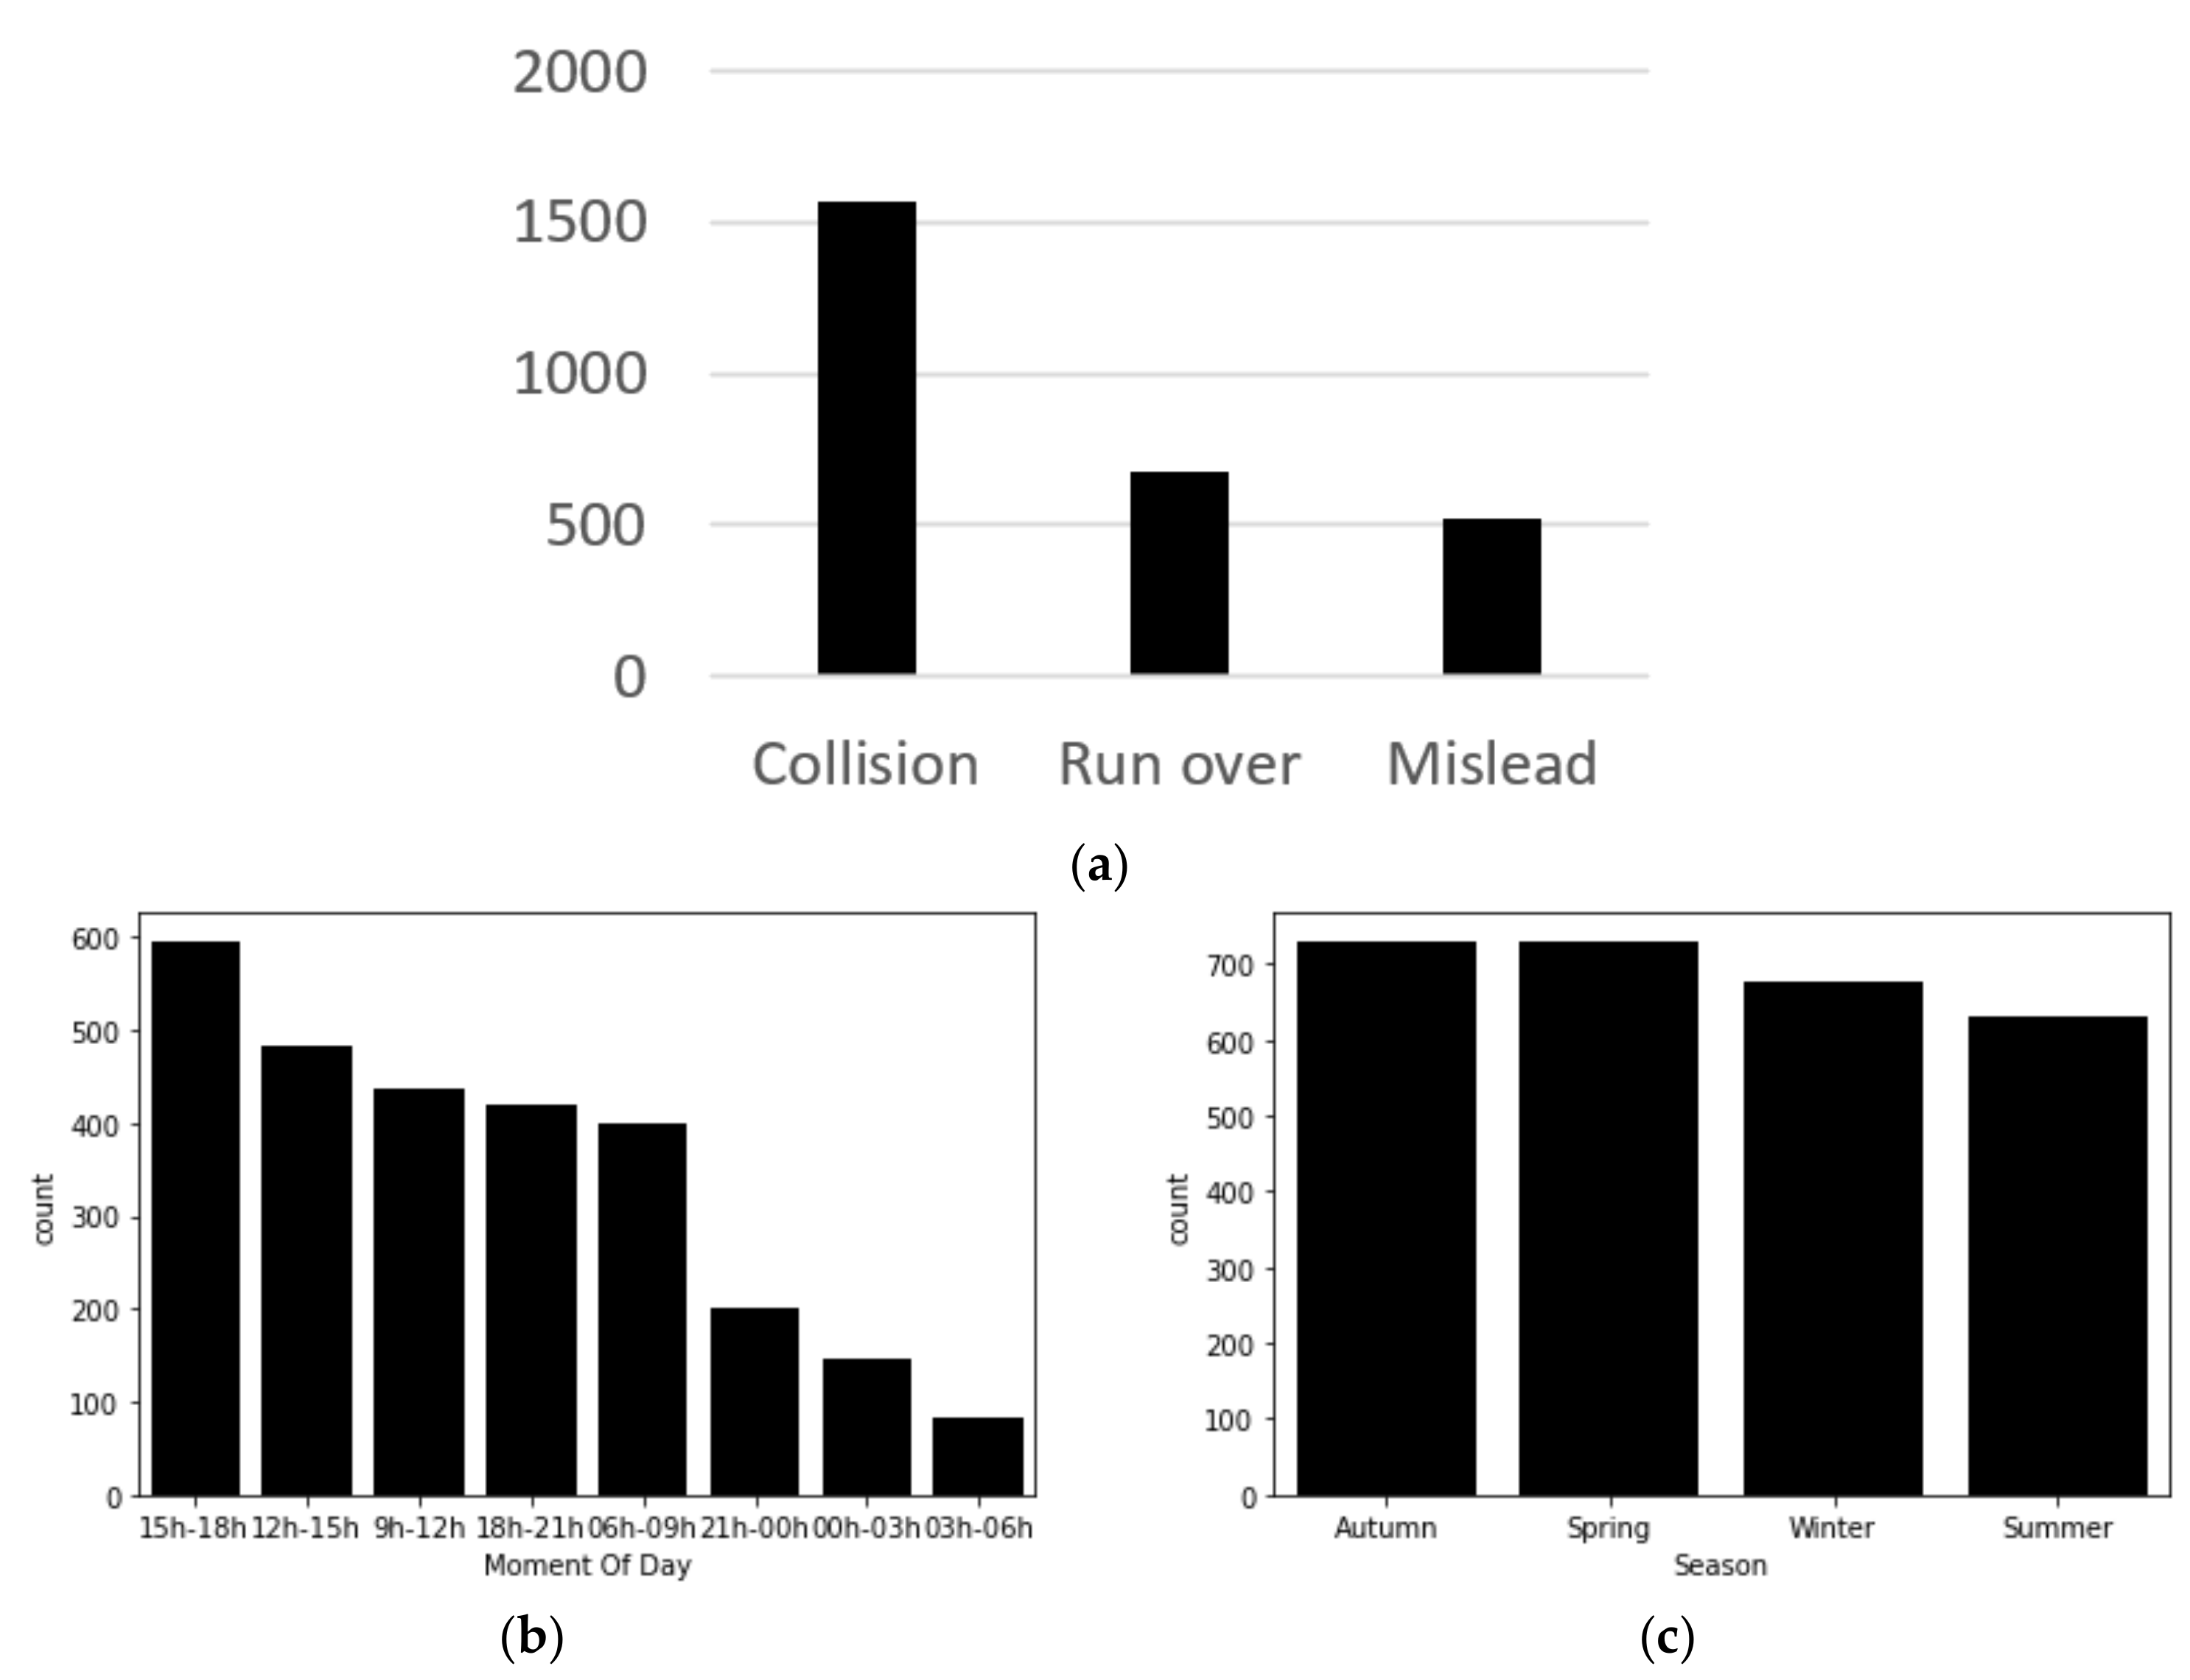
In the entire universe of accidents, we could gauge that 56.8% of the accidents were collisions, 24.3% were runovers, and 18.8% were misleads. Accidents that occurred during the day represented 66%, mainly between 3 p.m. and 6 p.m. It was also identified that 52% of accidents occurred in autumn and spring.
Figure 6a–c shows the road accident distribution by type, hour of the day, and season of the year.
October and November were the months where 30% of misleads happened; of these, 54% were in broad daylight, and 39% were at night but with illumination. On Thursday and Saturday, there was a higher prevalence of misleads; this was lesser on Sunday.
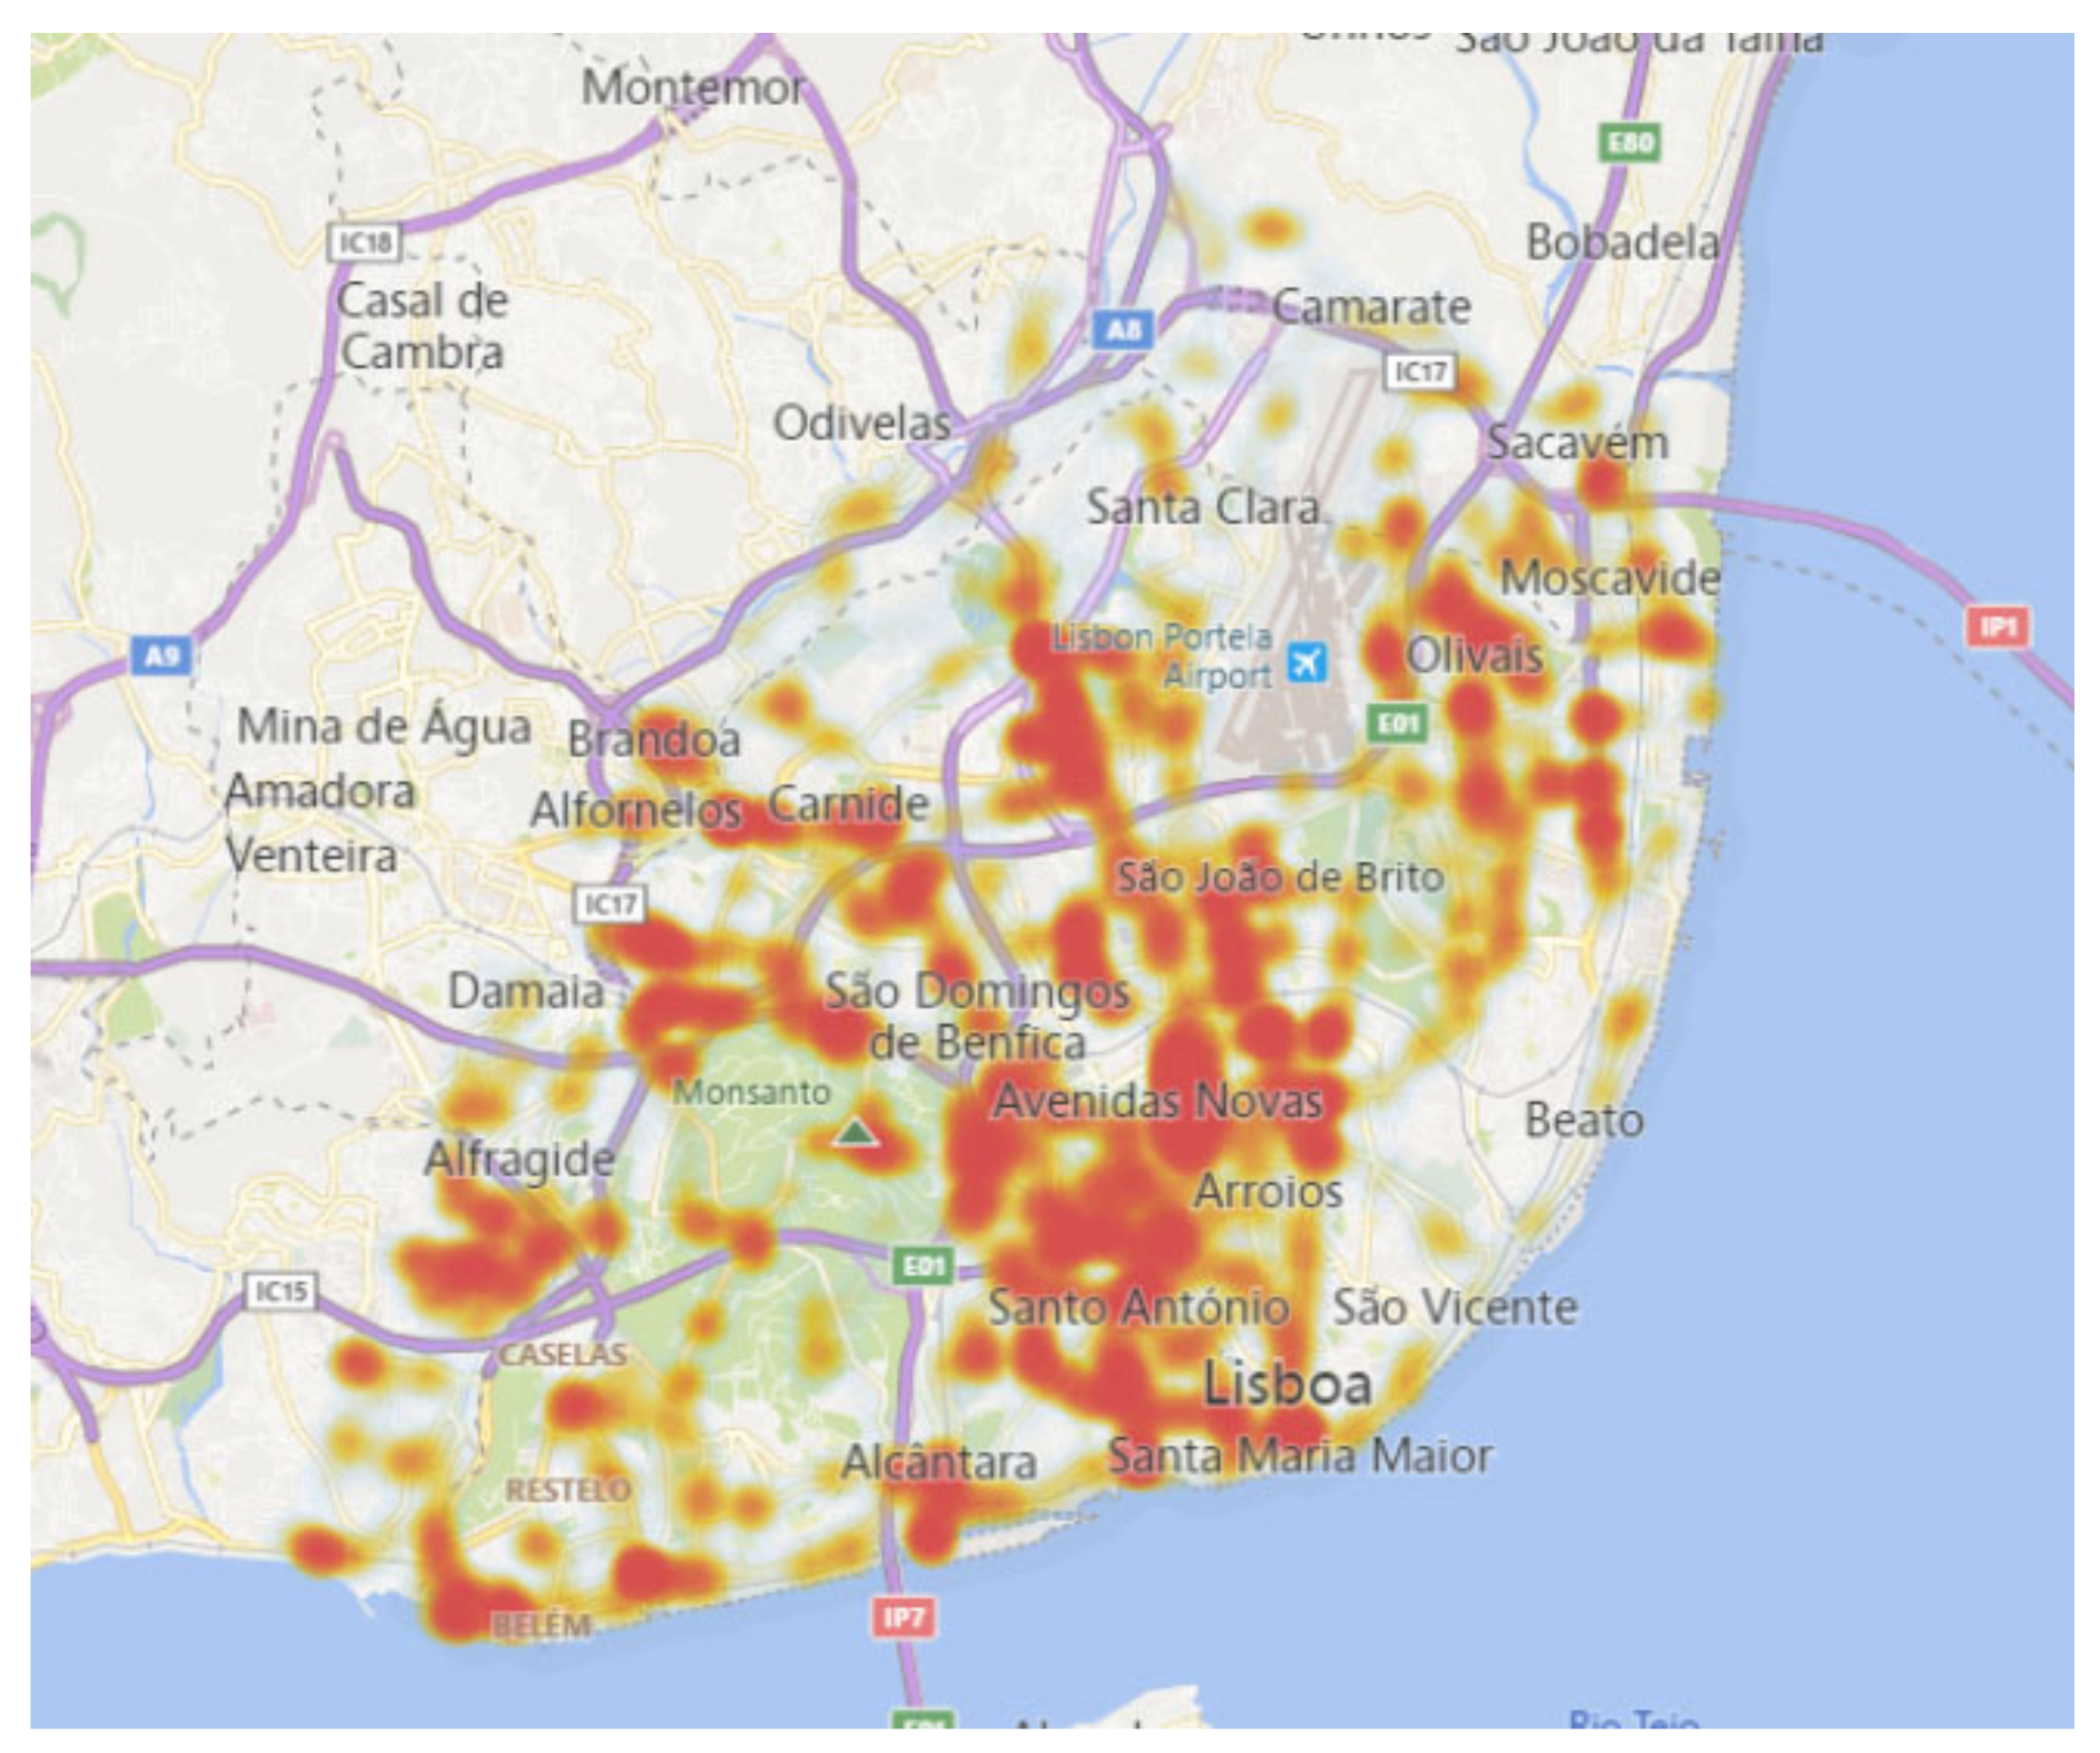
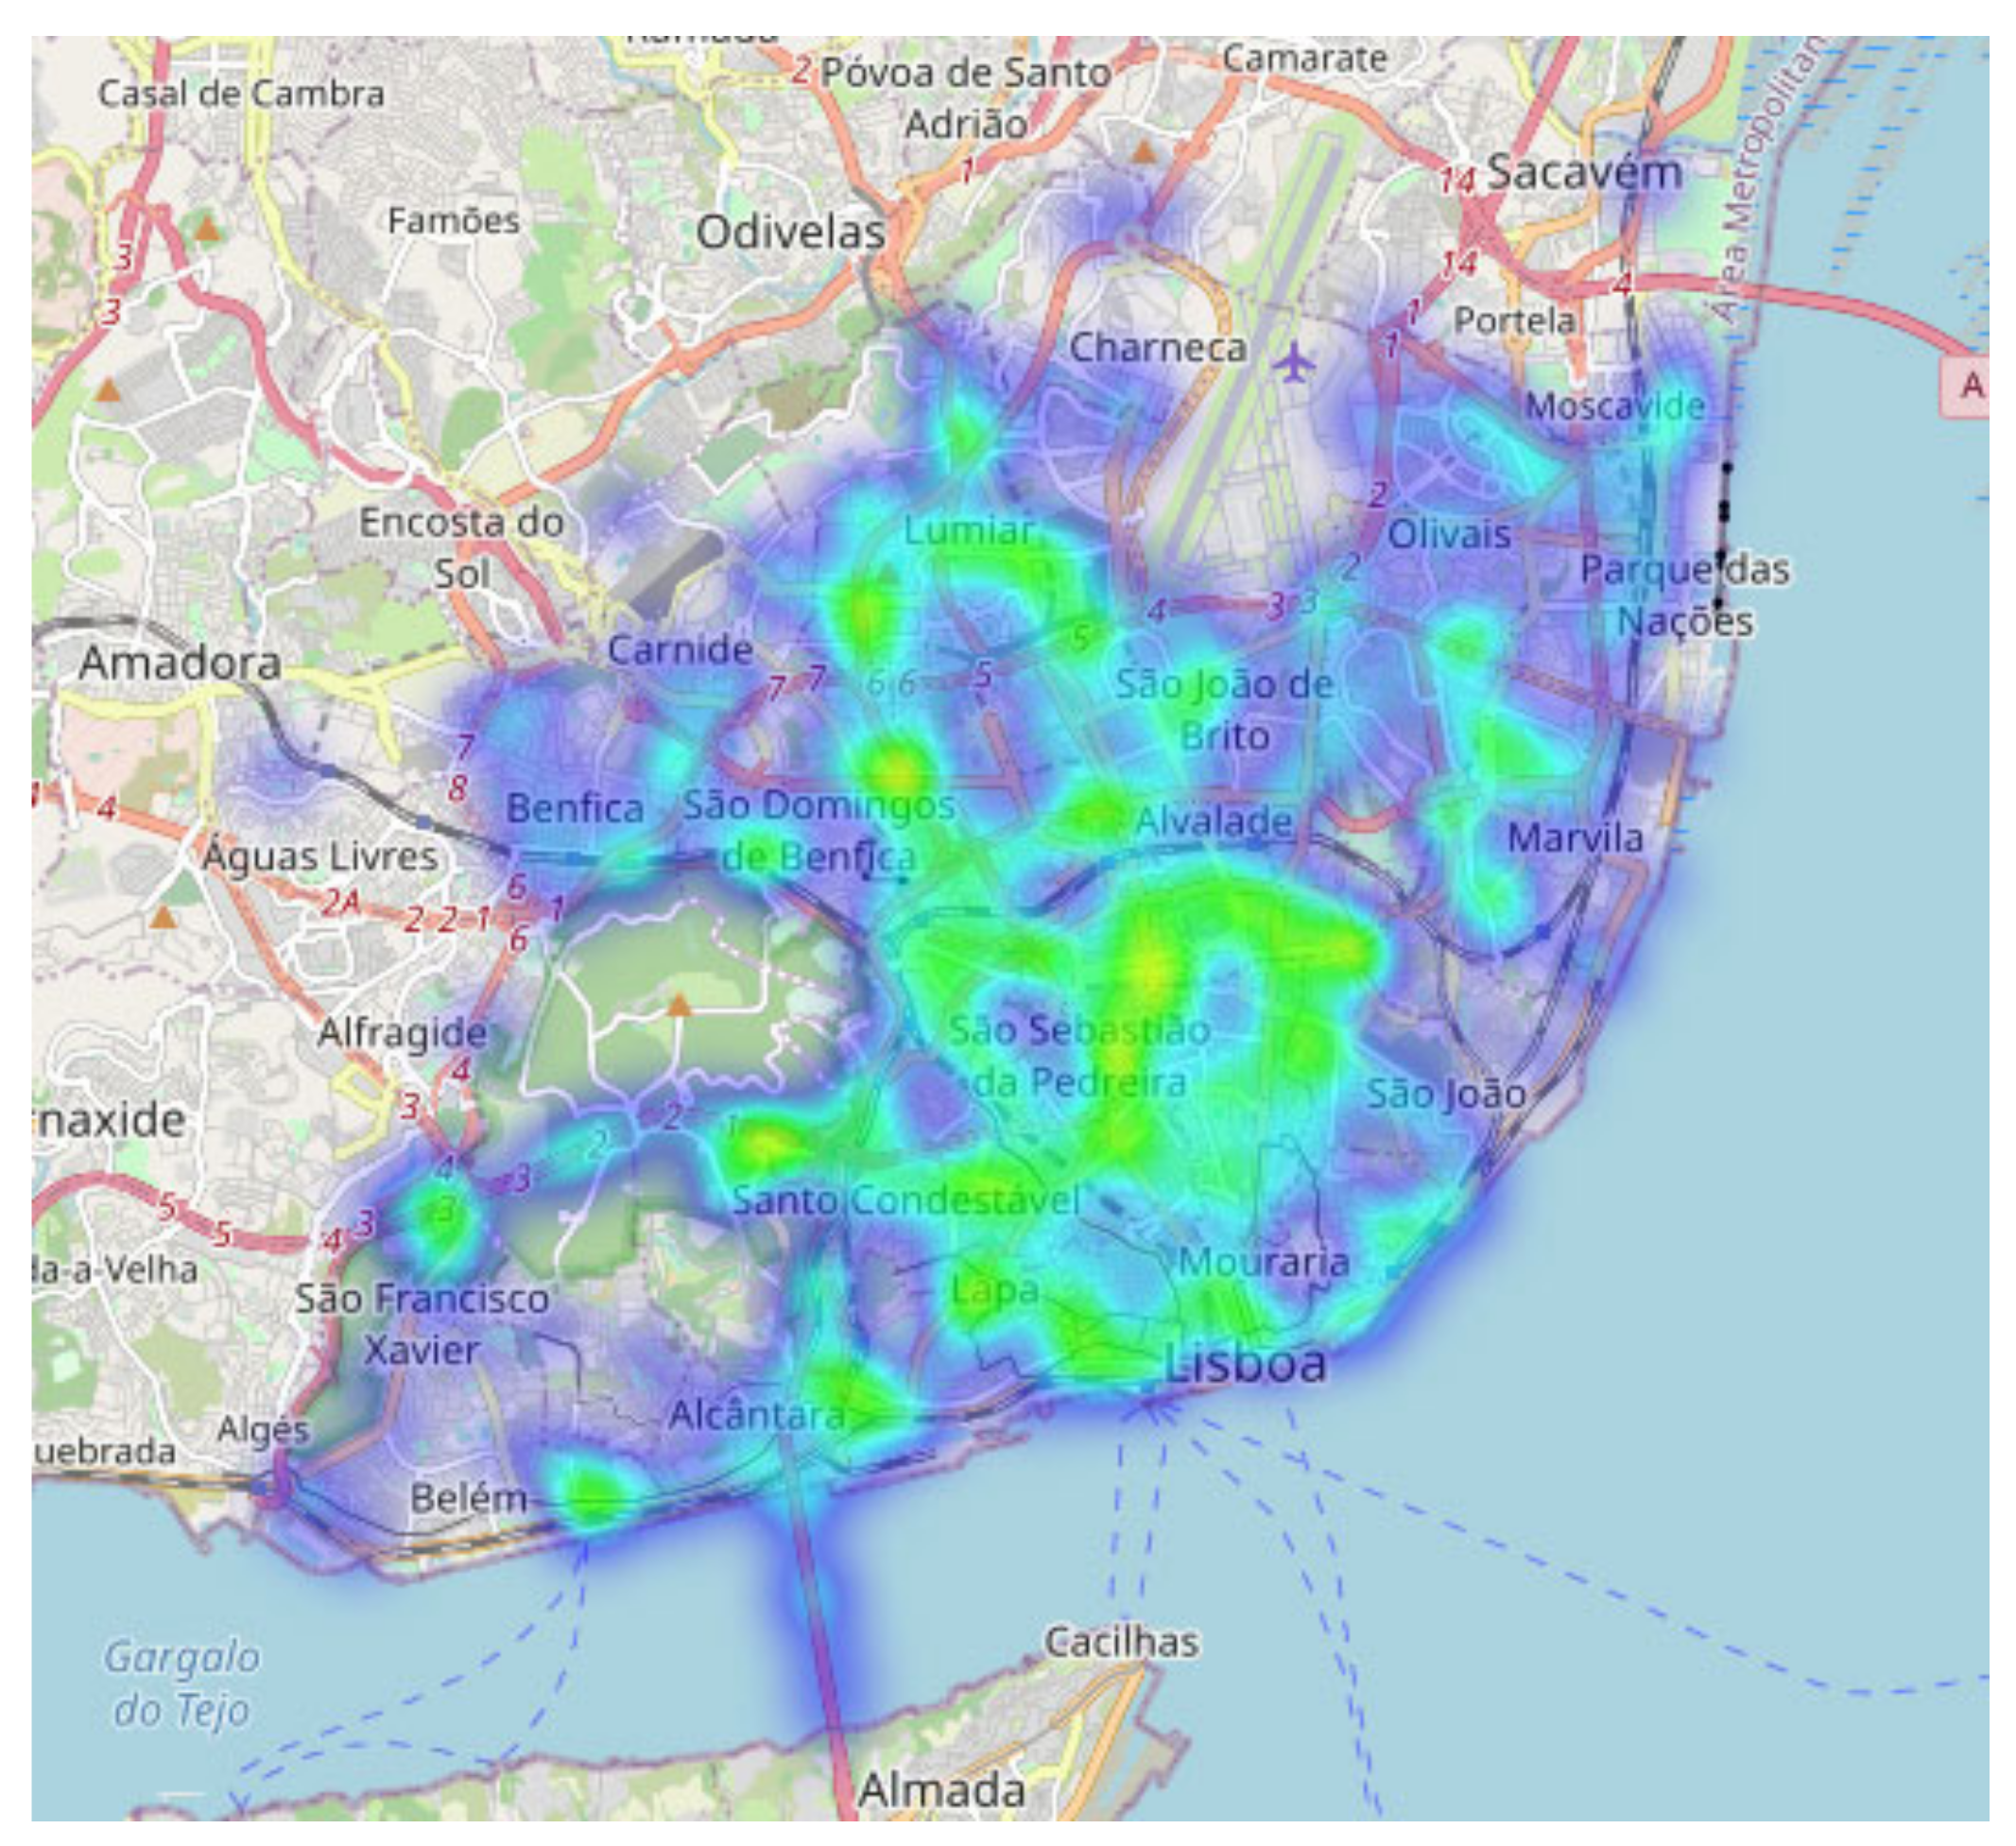
It is clear that runovers and collisions (
Figure 7 and
Figure 8) occurred more at Avenidas Novas, and misleads (
Figure 9) at São Domingos de Benfica. On the other hand, runovers were more likely to occur in Lisbon’s more touristic areas, and collisions mostly in the Lisbon city center.
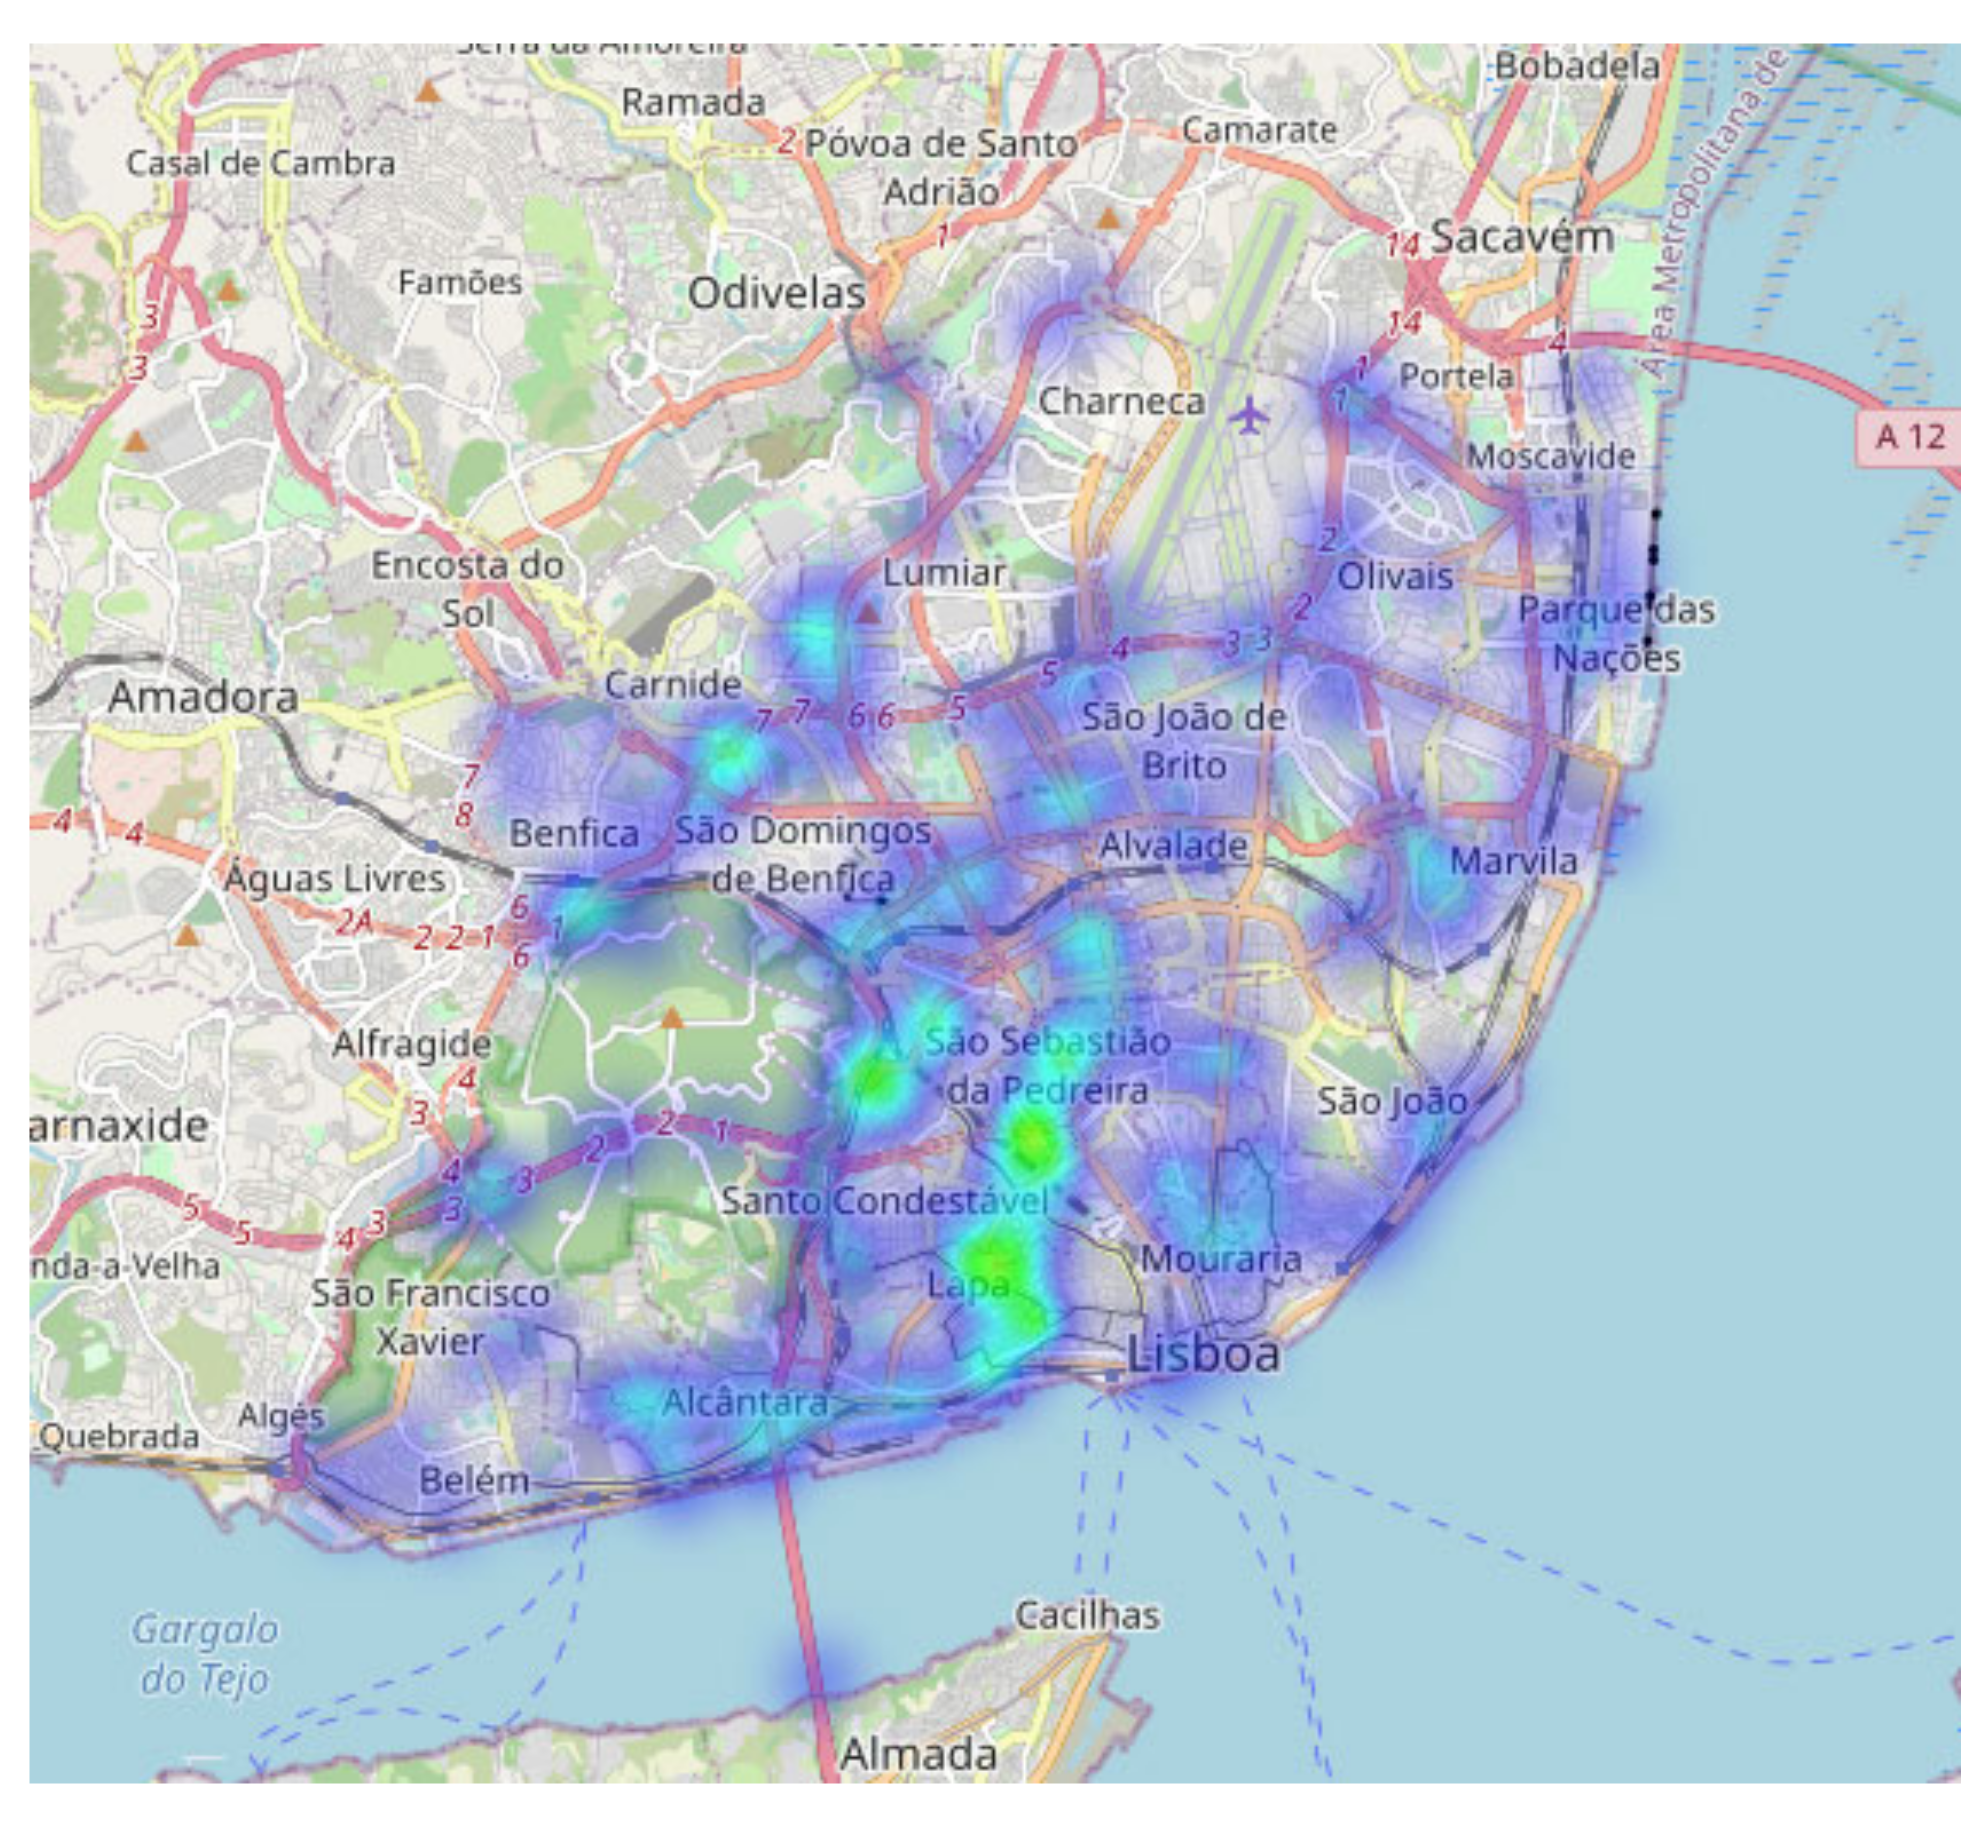
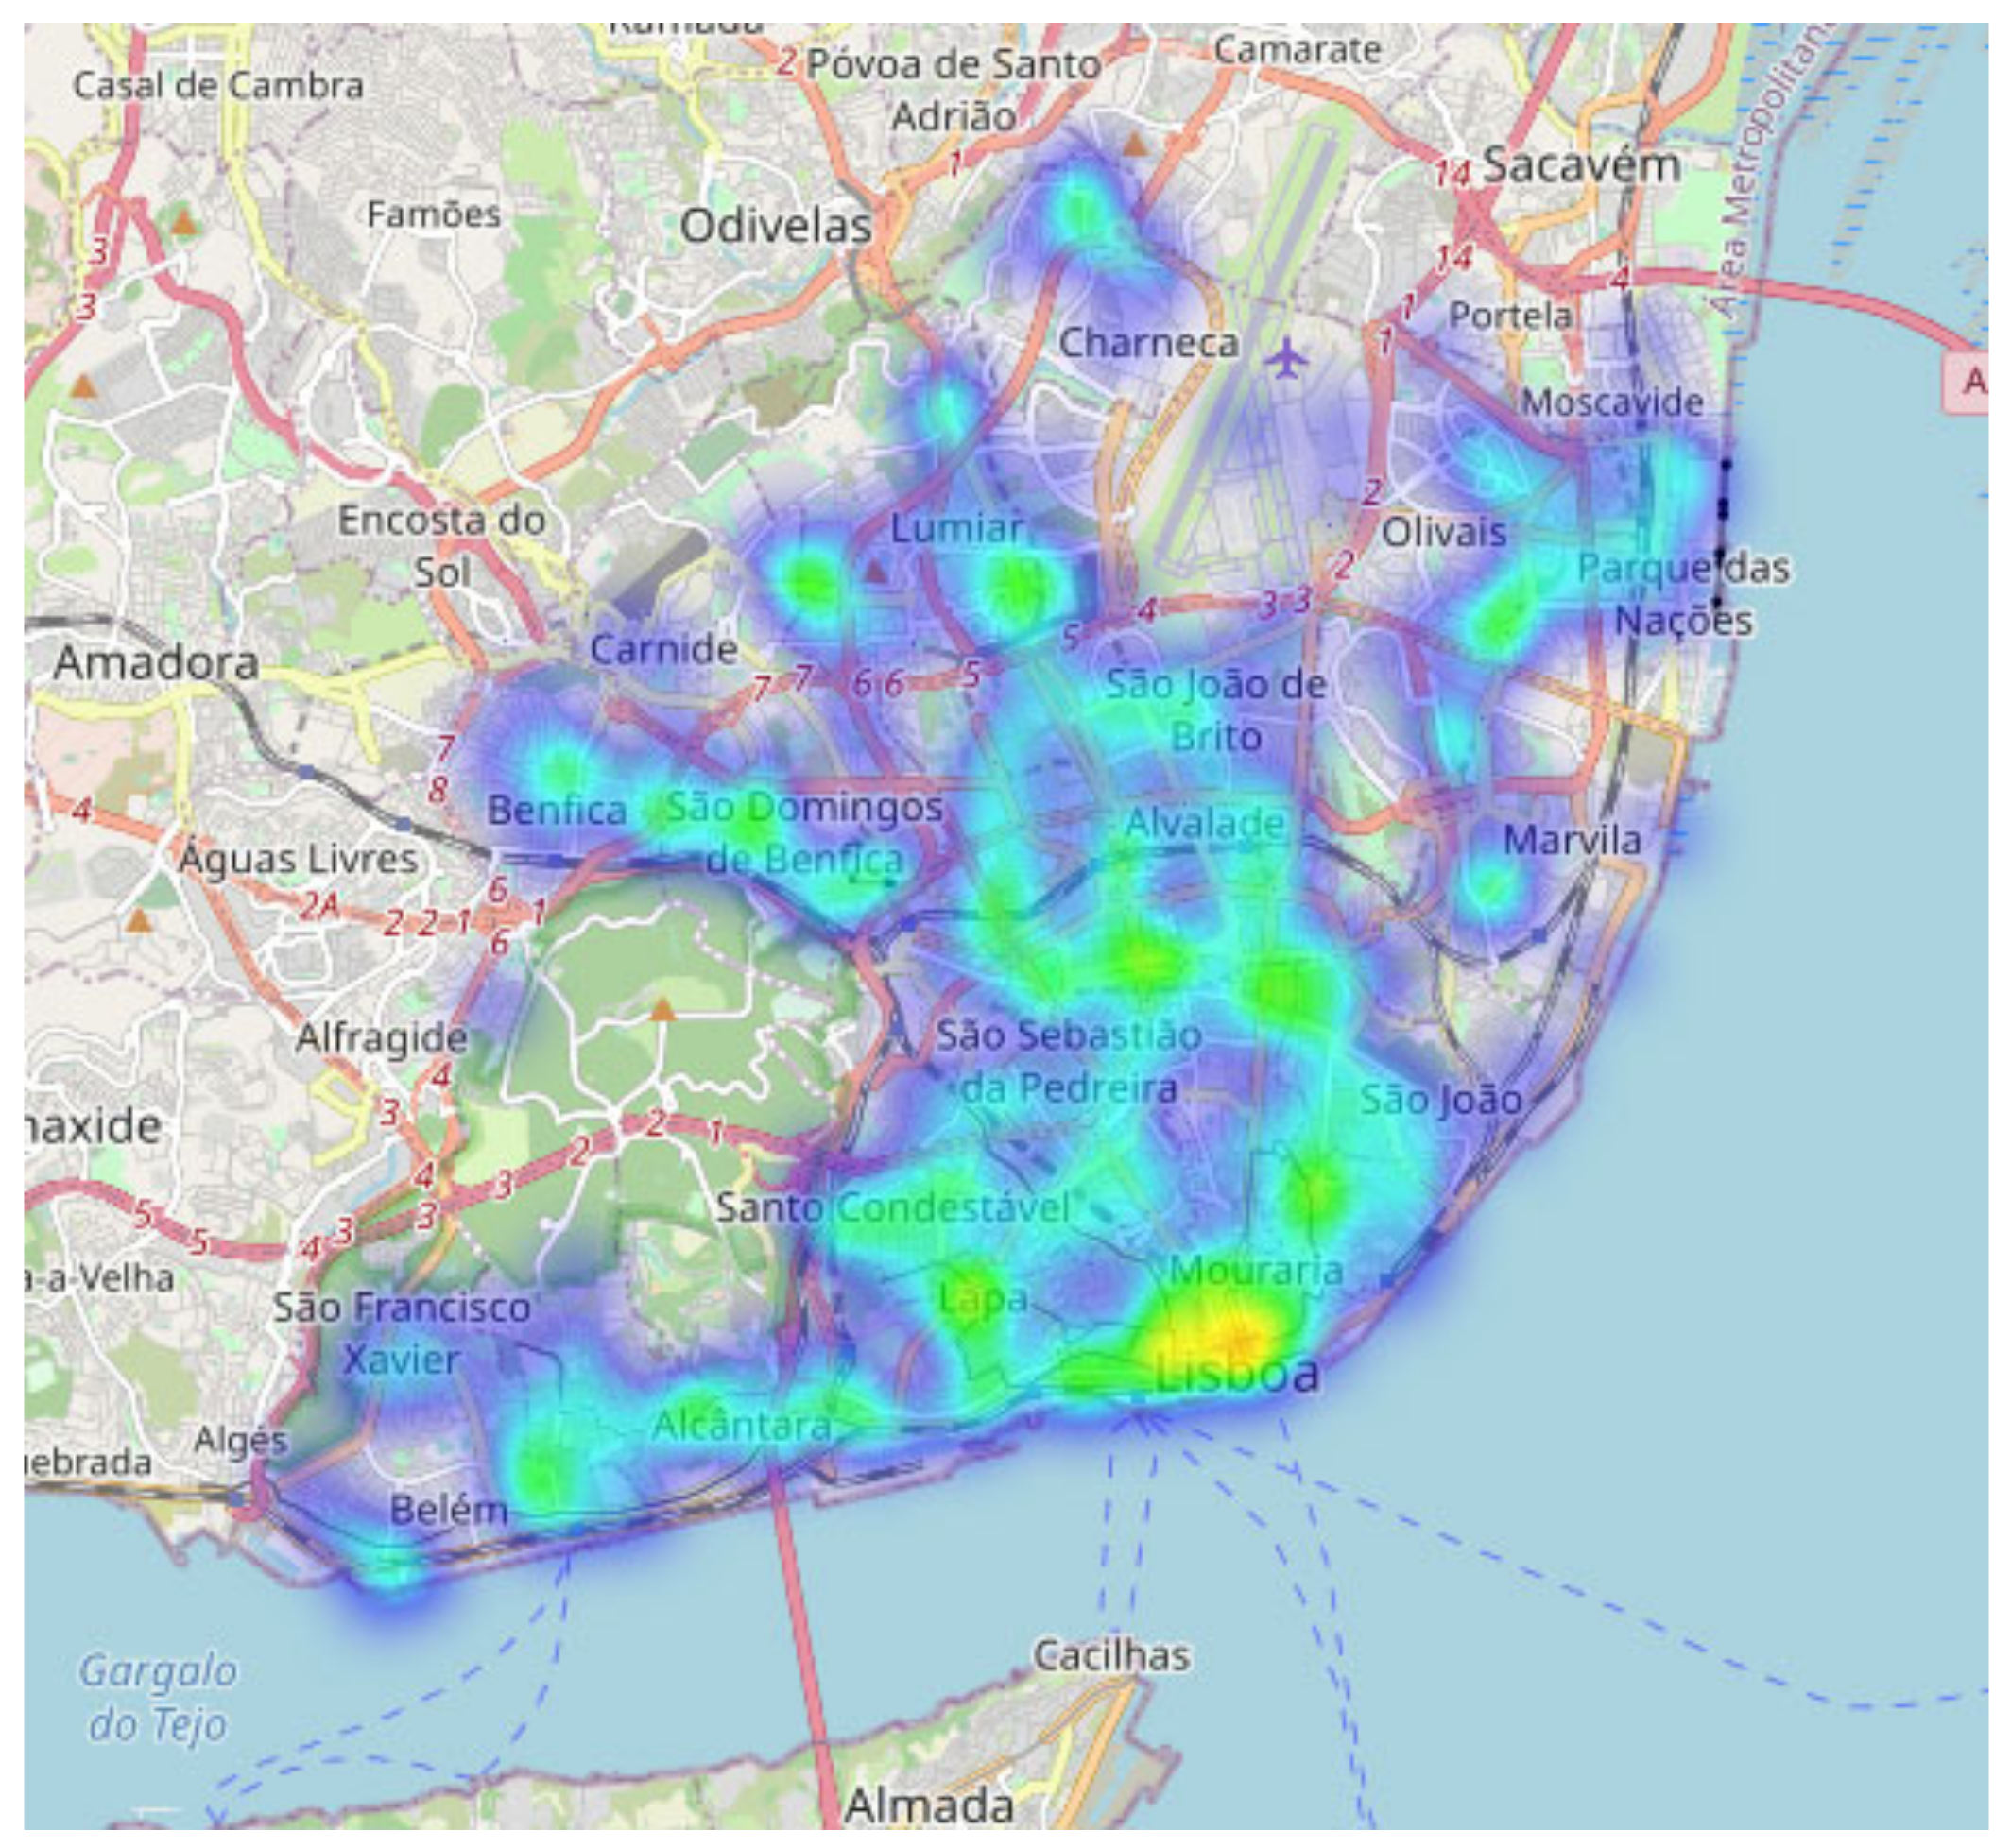
Data visualizations of the incidence of accidents in Lisbon are shown as heatmaps in
Figure 7,
Figure 8 and
Figure 9. Areas represented in orange and yellow were the most active, representing streets where more accidents occurred; green and blue represent areas with lower occurrences of accidents.
Misleads occurred more in São Domingos de Benfica, Benfica, Carnide, and Lumiar (
Figure 7), corresponding to entrances and exits to Lisbon’s outskirts. The central city axis from Campo Grande, Avenida da República, passing by Saldanha, Marquês do Pombal, to Avenida Infante Santo had a strong incidence of mislead occurrences.
Approximately 95% of runovers involved pedestrians in broad daylight, and most happened between 3 p.m. and 6 p.m. on Tuesday and Friday. Runover incidents were scattered throughout the city (
Figure 8). There was a strong incidence in the downtown area, Terreiro do Paço, that could be associated with distracted tourists strolling. Other areas include Parque das Nações, São Domingos de Benfica, and Alcântara, corresponding to entrances to and exits from Lisbon. From Campo Grande to Avenida da República, passing by Saldanha, Marquês do Pombal, Avenida Infante Santo to Avenida 24 de Julho are the streets where most runovers took place. Moreover, the same pattern was also observed in the analysis and visualization of misleads (
Figure 7).
Finally, regarding collisions, 65% of them occurred during daylight, and 21% between 3 p.m. and 6 p.m. on Thursdays and Fridays. Side collisions with another moving vehicle represented 35% of the total, while the more expressed others were rear collision with another moving vehicle, and collision with other situations involved.
Collision occurrence was scattered throughout the city, with focuses in Marvila, Alcântara (entrance and exit to Ponte 25 de Abril) and downtown, Terreiro do Paço, and stronger occurrences in Alvalade, Areeiro, Avenidas Novas, Campo de Ourique, and Estrela boroughs.
Generally speaking, the vehicle analysis showed that 89% of accidents corresponded to a passenger vehicle with a driver 18–29 years of age (28%). In addition, 84% of accidents occurred on a dry and clean road, and 15% on a wet road. It was possible to see that of all the passengers, 64.8% were females, and 33.8% were between 18–29 years of age. Of these, 99% suffered minor injuries and were wearing a seat belt or a helmet.
Pedestrians involved in accidents were mainly females (55.9%), and 94% suffered minor injuries, of which 41% were crossing roads on a signalized zebra crossing. Pedestrians aged 18 to 29 years and 70+ were the main citizens involved.
Moreover, misleads and runovers had a high incidence at the entrances and exits of Lisbon, and along the central axis of the city from Campo Grande to Avenida Infante Santo. However, these were phenomena that occurred all over the city.
4. Discussion
The major finding, addressing our first study on Lisbon traffic patterns in 2019, was that the predominance of traffic occurrences on primary streets represented most of the traffic events in the Lisbon metropolitan area.
Other findings showed that the average driver was likely to spend between 3 to 5 min more on each road—primary street or freeway—when a traffic event occurred. These traffic occurrences tended to peak between 8 a.m. and 9 a.m. and between 5 p.m. and 6 p.m.
When observing the data patterns, it was possible to assess that Lisbon boroughs, at the city limits, had the highest concentration of traffic jams. Most of these boroughs are neighboring municipalities, part of Lisbon’s network of entrances and exits.
According to the data analysis, freeway traffic tended to have a higher length and delay than primary street traffic. However, traffic occurrences on freeways tended to be less severe than on primary streets. However, some freeways had slower and lengthier traffic jams than others, such as IC 17, A5, and Eixo Norte-Sul. The primary streets that stood out with more traffic congestion were R. Direita, R. Alta da Palma Carlos, and Calçada da Ajuda.
Traffic congestion was susceptible to pendular variations in its intensity, with critical peaks at the city’s main entrances, especially during the morning and evening peak hours. However, traffic congestion tended to normalize throughout the evening. Our findings showed that roads were especially prone to long traffic jams when public events occurred. When a traffic event occurred, it was very likely to be of the heavy type.
Road accident patterns in Lisbon strongly correlated with traffic congestion and external factors, but varied according to the type of occurrence. Our findings showed that most accidents occurred in bustling traffic areas, during the daytime (between 3 p.m. and 6 p.m.), corresponding to the afternoon traffic peak when traffic congestion peaked. Friday was the weekday with a higher prevalence of road accidents, mostly when commuters were traveling back home and rushing for weekend leave. Seasonality also influenced road accidents, as most accidents occurred in autumn and spring.
Hence, external factors such as weather, location, luminosity, and time of the day were crucial to understanding Lisbon’s road accident phenomena. Age also influenced accidents. The population between 18 and 29 years old were the most involved in road accidents. Similarities with the literature [
7,
8,
11] were observed, especially regarding our study’s external factors.
Road accidents in Lisbon were scattered in the city by type of occurrence. Misleads and runovers had a higher incidence at Lisbon’s entrances and exits, and along the central axis of the city from Campo Grande to Avenida Infante Santo. These occurrences corresponded to traffic-congestion patterns observed on primary streets and freeways. São Domingos de Benfica, Carnide, Lumiar, and Alcântara were the zones where most misleads and runovers occurred, corresponding to the entrances and exits of freeways—IC 17, A5, and Eixo Norte-Sul—with high congestion levels. Collisions, on the other hand, were a phenomenon that spread all over the city.
Our literature survey [
7,
8,
11] found few articles about data analysis and visualization of traffic congestion and road accidents. We addressed this by developing data analytics and visualization, providing effective communication of research insights and visualization tools to policymakers.
Following insights from previous studies [
14,
15], we developed data analyses and visualizations based on different and combined factors, such as temporal, spatial, spatio-temporal, and multivariable.
Multivariable analysis has shown effectiveness in communicating data insights [
16], providing visualizations of data regarding traffic congestion and road accidents within a time range and city areas, type of vehicle, lighting conditions, weather conditions, month of the year, and day of the week.
The results of our traffic-congestion and road-accident analyses and visualizations showed similar findings to insights found in the literature review, as shown in
Table 15.
According to our literature review (
Table 1), further work is needed to better understand the correlation between traffic congestion and road accidents. Poisson-based nonspatial (such as Poisson–lognormal and Poisson–Gamma) and spatial (Poisson–lognormal with conditional autoregressive priors) models [
18,
19] should be developed further regarding spatial correlation in traffic congestion and road accidents, and should provide a broader and deeper understanding of this phenomenon.
Moreover, in order to provide a data-driven analytics and visualization tool that helps decision-makers (public authorities and stakeholders), which is one of our research goals, we need to develop prediction models. Although we did not address predictive models in our study, we discussed them in the literature review in
Section 2. Andrienko [
22] used a visualization technique developed iteratively with data analysis, model development, and analysis of predictions. Moreover, long short-term memory (LSTM) and recurrent neural networks (RNNs) are the most used traffic prediction models [
23].
Our study’s limitations were related to incomplete data features and a lack of information regarding external factors data—weather, air quality, events, sports, music, and COVID-19. Waze traffic data needs to be understood in the context of Lisbon traffic; in particular, the percentage of the overall Lisbon traffic it represents in reality. Additionally, more data are required; namely, the numbers of cars in the city and cars that commute to the city, car speed, accident occurrences, external factors such as public events—soccer games, music festivals—as well as COVID-19 pandemic data. These additional data sources are needed to provide broader analysis and visualization of traffic and road accident patterns in the city.
5. Conclusions
Lisbon traffic congestion and road accidents are ongoing issues in Lisbon’s urban mobility, carbon-emission reduction, and road safety. In a city where 370,000 vehicles enter every day, adding to the 200,000 vehicles that already circulate in the city, traffic congestion and road accidents are key challenges that need to be tackled to improve citizens’ quality of life.
This study accomplished our research aim and goals in characterizing traffic congestion and road accidents in Lisbon (RQ1), as well as characterizing road accident patterns in Lisbon, and the external factors that contribute the most to this phenomenon (RQ2).
The developed multivariable analyses and visualizations showed congestion and road accident patterns related to their features and external factors. Traffic congestion and road accidents correlated with highway street type, on Friday and during afternoon peak hours. Road accident characterization also featured number of vehicles involved, brightness, and weather; and variables associated with individuals, such as gender, seat belt, and position in the vehicle. This enriched the characterization of Lisbon road accidents and identified the external factors that contributed the most to this phenomenon.
Poisson nonspatial and spatial models [
18,
19] need to be constructed to better understand the correlation between traffic congestion and road accidents; this will be addressed in future work.
Although in our study there was a strong correlation between traffic congestion and road accidents, this relation was not necessarily linear, meaning one can happen without the other occurring, and this needs more to be studied in more detail.
The developed data analytics and visualization tool for traffic congestion and road accidents provides a traffic visualization pipeline to assess traffic data properties based on a multivariable analysis that finds urban mobility patterns.
Traffic congestion and road accident visualization provided knowledge and insights on how citizens move in Lisbon (RQ3), enabling a better understanding of road accident scenarios and related events. It also provided data-driven guidelines and knowledge about traffic congestion and road accidents in Lisbon to the city authorities and policymakers in the framework of a traffic management and visualization tool to help them mitigate such phenomena.
Future work aims to better understand these results’ implications, especially regarding external factors such as weather, air quality, events, crowd flow, and bike data. Studies [
41,
42] of the Lisbon bike-sharing system have shown the influence of external factors, such as weather and bike type, in bike use and ride frequency. Moreover, pedestrian walkability, cycleways, bike stations, and bike accident data are of interest to correlate with this study’s findings and understand the overall Lisbon urban mobility scenario.
To this aim, an integrated urban mobility dashboard with data analysis and visualization can contribute to providing city management authorities and policymakers with an overall picture of the city’s urban mobility, enabling implementation of smart solutions toward a more resilient city.
This urban mobility tool would allow city management authorities and decision-makers to explore and better understand the profile of Lisbon metropolitan area commuters by means of an interactive dashboard depicting georeferenced data with different borough, geographical, demographic, economic, social, planning and environmental information, generating combined visualizations.
Moreover, this analytical and visualization tool would provide a complete monitoring and management resource of the entire urban ecosystem that could be replicated in other cities. It could also be integrated into the Lisbon Intelligent Management Platform—Plataforma de Gestão Inteligente de Lisboa (PGIL) [
43], an existing data platform used by the City Hall, further developing PGIL capacity to process and provide useful information on the operational and strategic management of the city to the various stakeholders.


 ,
, 


