
A Comparative Design of a Campus Microgrid Considering a Multi-Scenario and Multi-Objective Approach

 ,
,  , ,
, ,  , and
, and 
Abstract
1. Introduction and Background
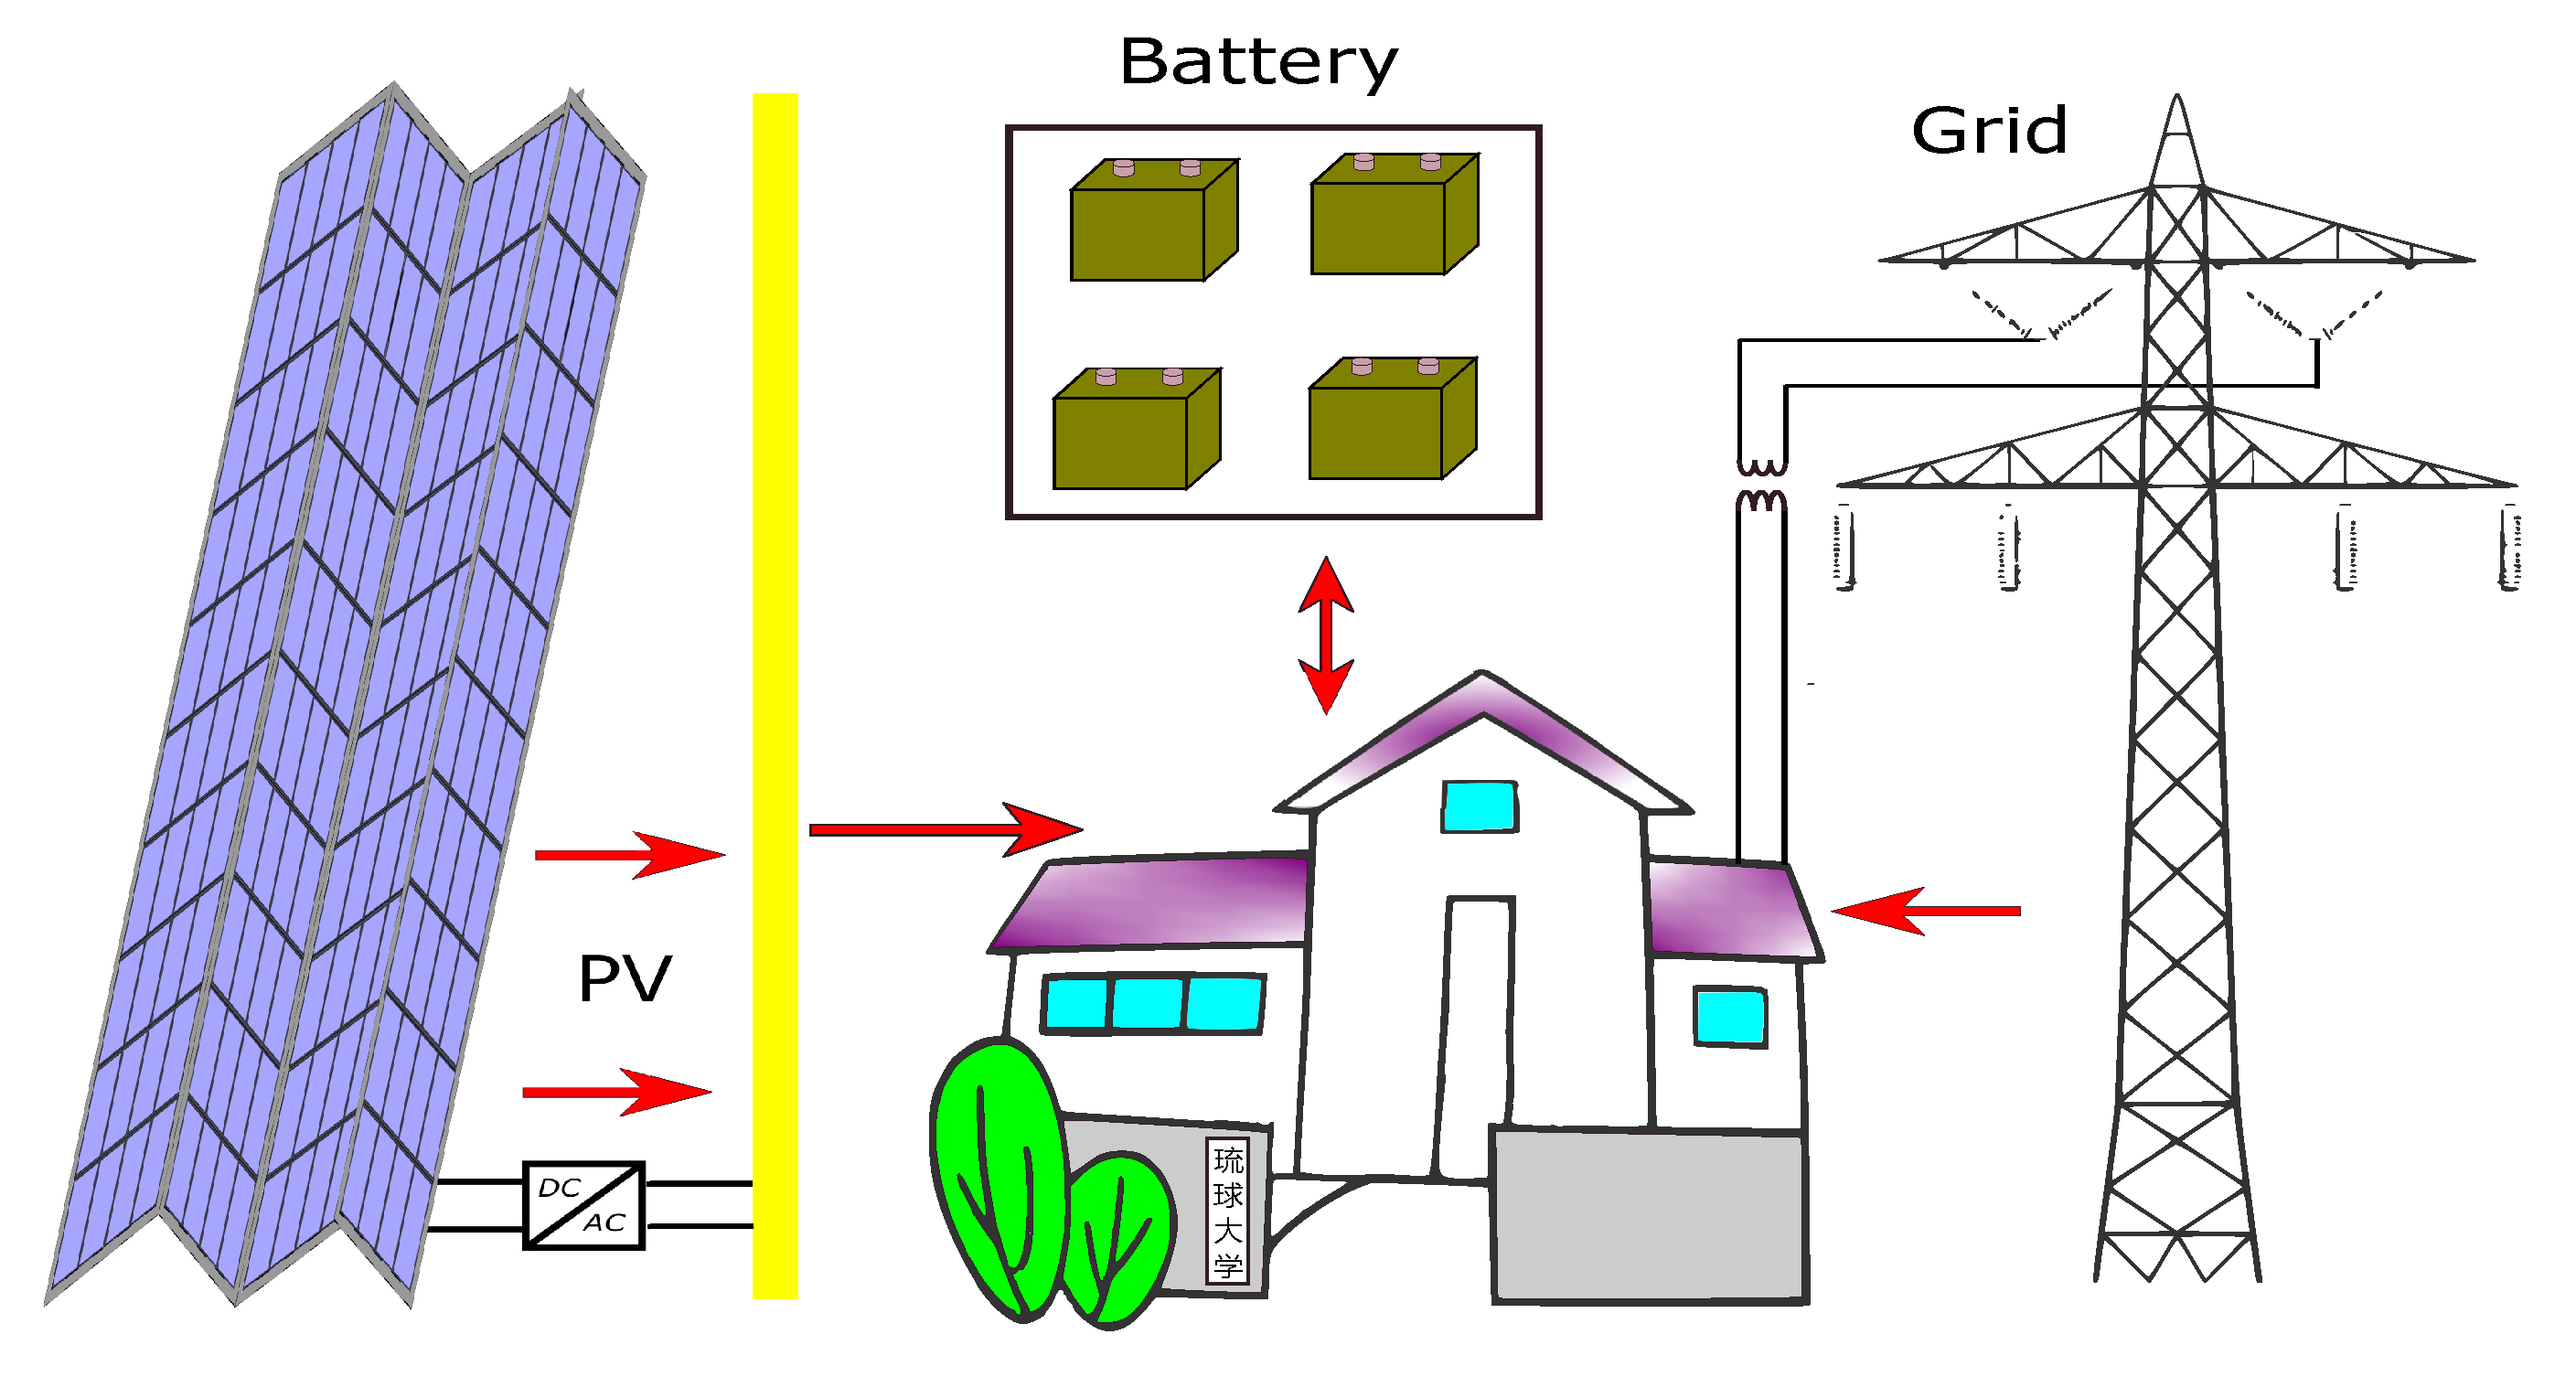
- Based on the actual power load of University of the Ryukyus’s Senbaru Campus and the actual weather data in Okinawa, the optimal configuration of the combination of constant power from the grid, solar power, and storage size was used. According to the basic structure and characteristics of the solar/battery power generation system, we established the photovoltaic power generation and battery storage models to provide a basis for the optimal configuration of system capacity. Moreover, an in-depth analysis of the performance of the solar power generation system and a comprehensive system evaluation were used. The evaluation system included three indicators: loss of power supply probability, waste of energy, and total cost. This can evaluate the performance of the solar hybrid power generation system from various aspects such as system reliability and energy utilization. This article demonstrated a complete design of an optimized microgrid system.
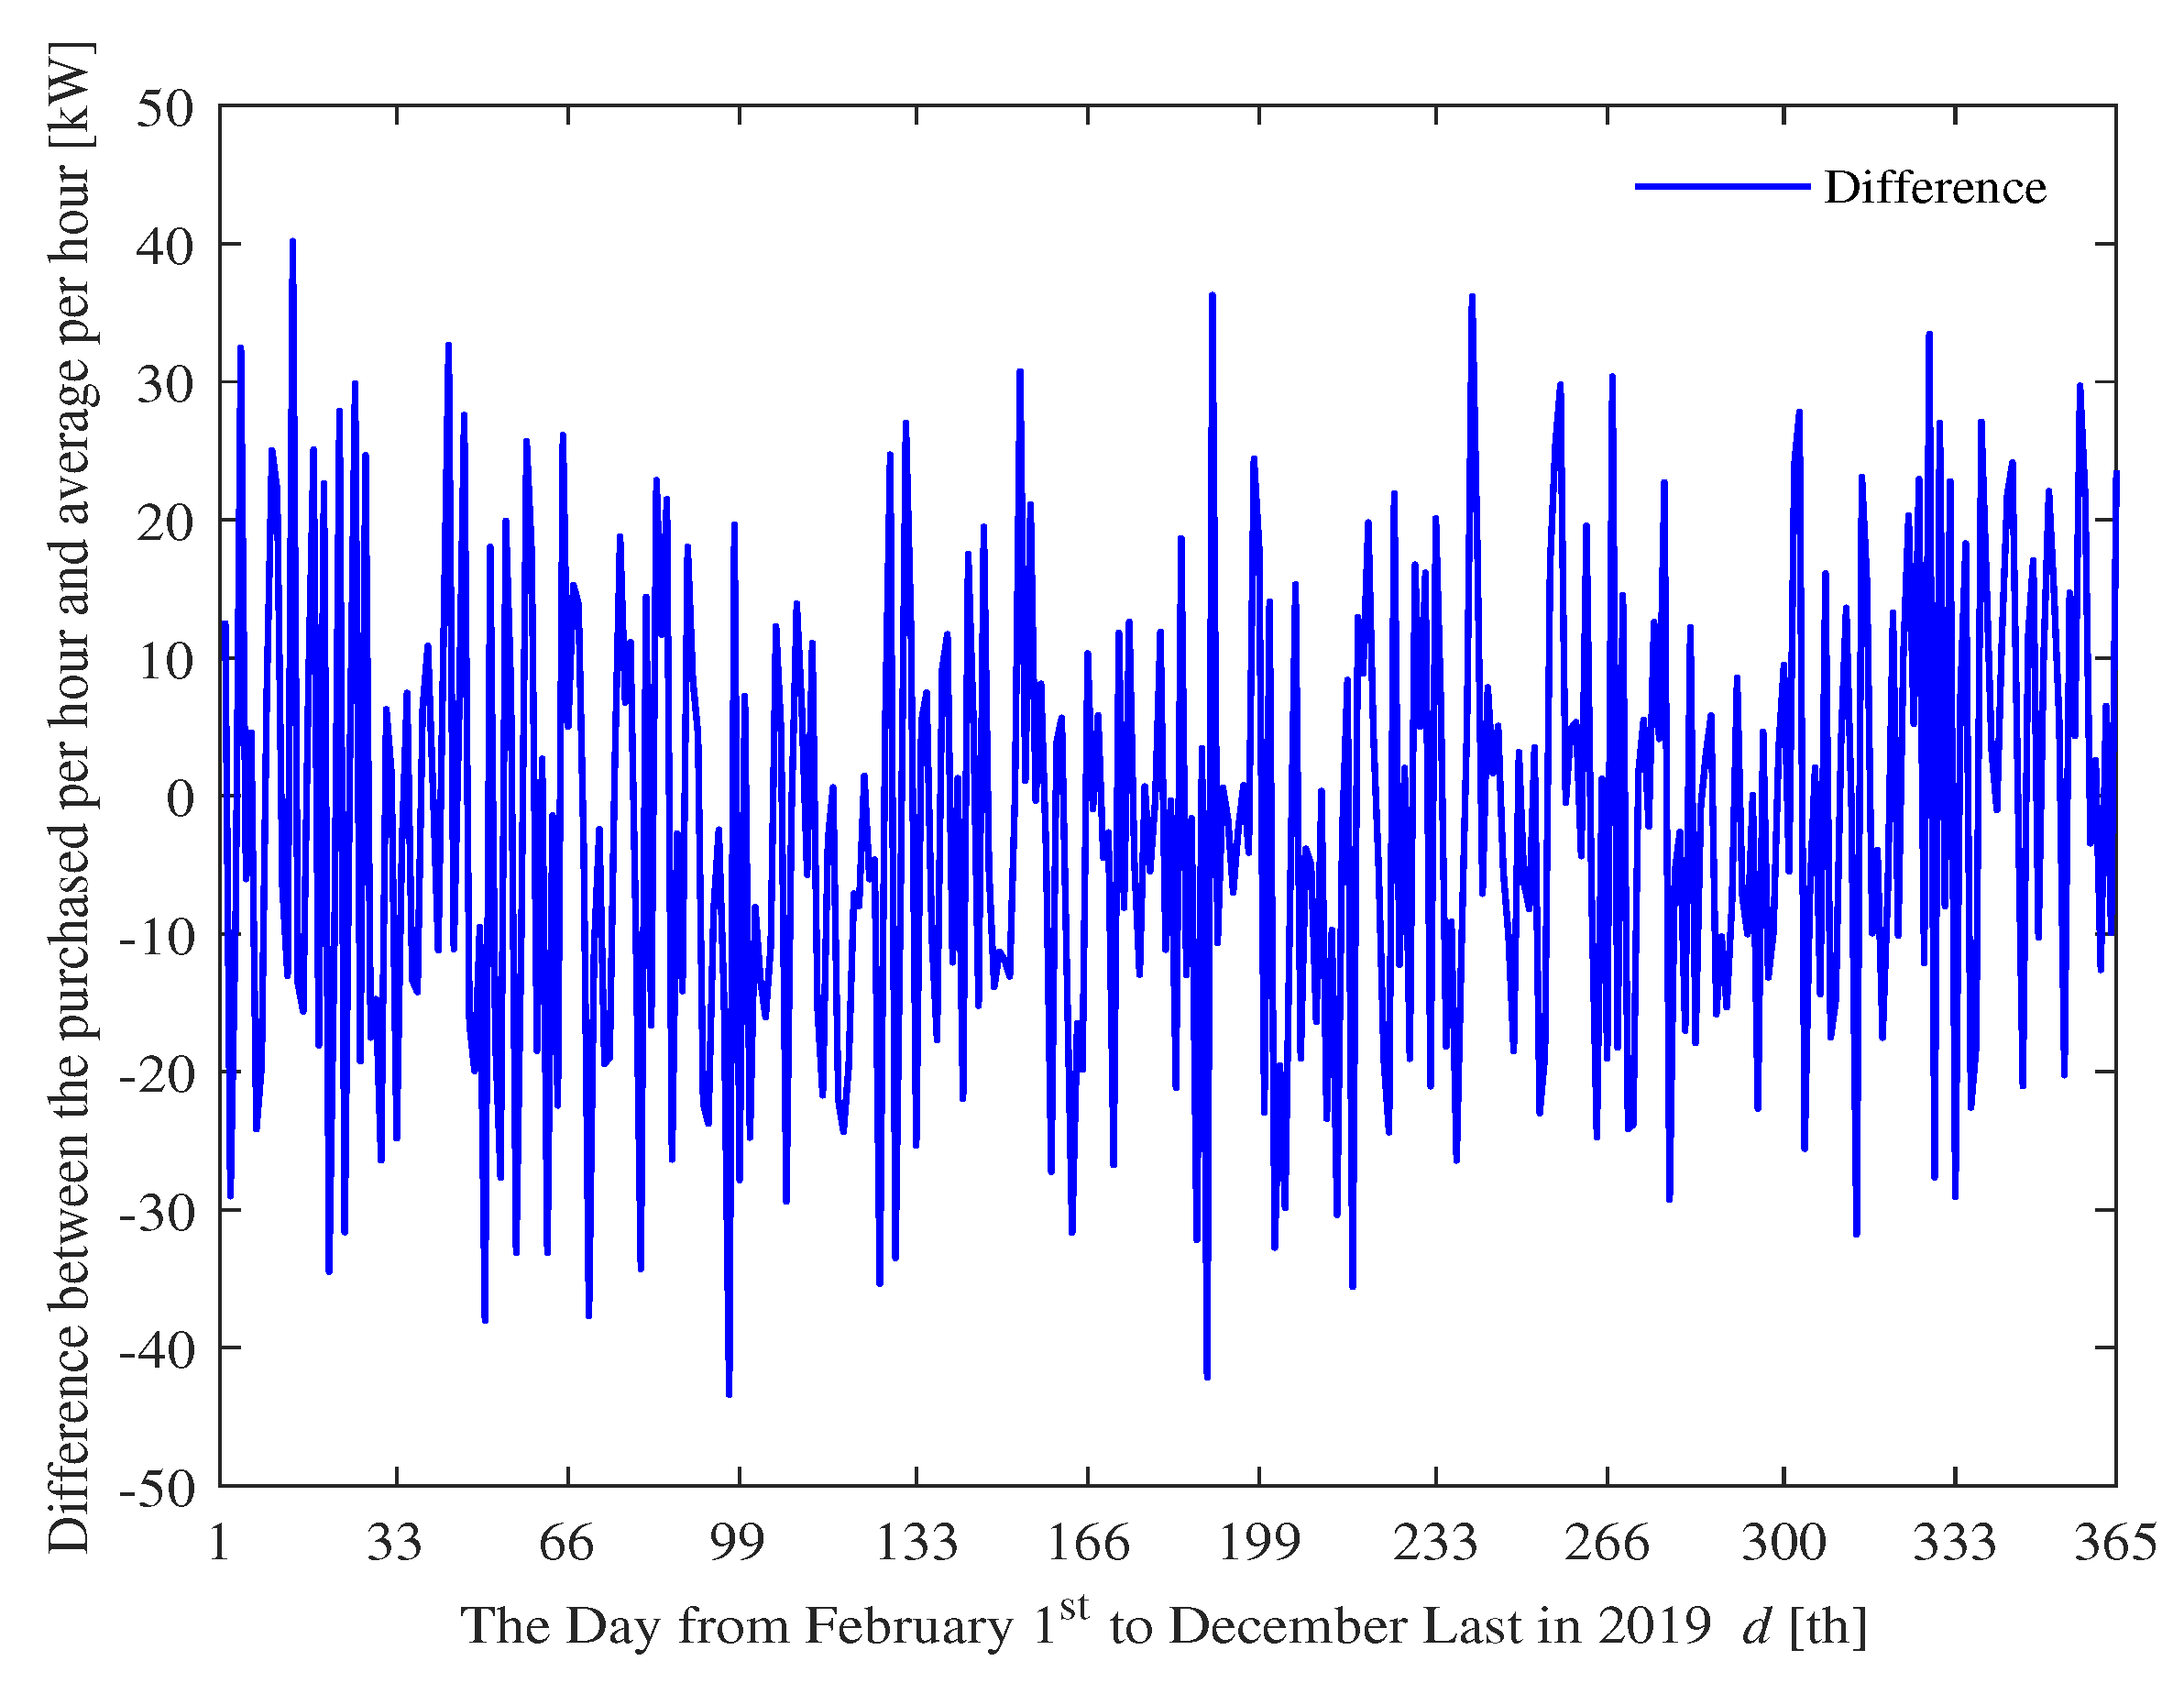
- Using the University campus as an example, the article showed the optimized combination of batteries, PV, and the grid that provided constant power, so that enterprises and institutions can reduce costs while eliminating the problem of peak power consumption. While energy conservation and emission reduction have been advocated, the amount of energy used every year is increasing [19]. When consumer satisfaction remains the primary priority without paying attention to the supply constraints, it is often difficult to reduce energy usage. Therefore, this article started from the user side, first stipulating the required energy considering the actual data and then allocating electricity demand. It avoided the traditional situation where the power supplier follows the consumer. The constant power sales program proposed in this paper provided a theoretical basis and practical reference for the stable operation of the microgrid.
2. System Modeling and Optimization Method
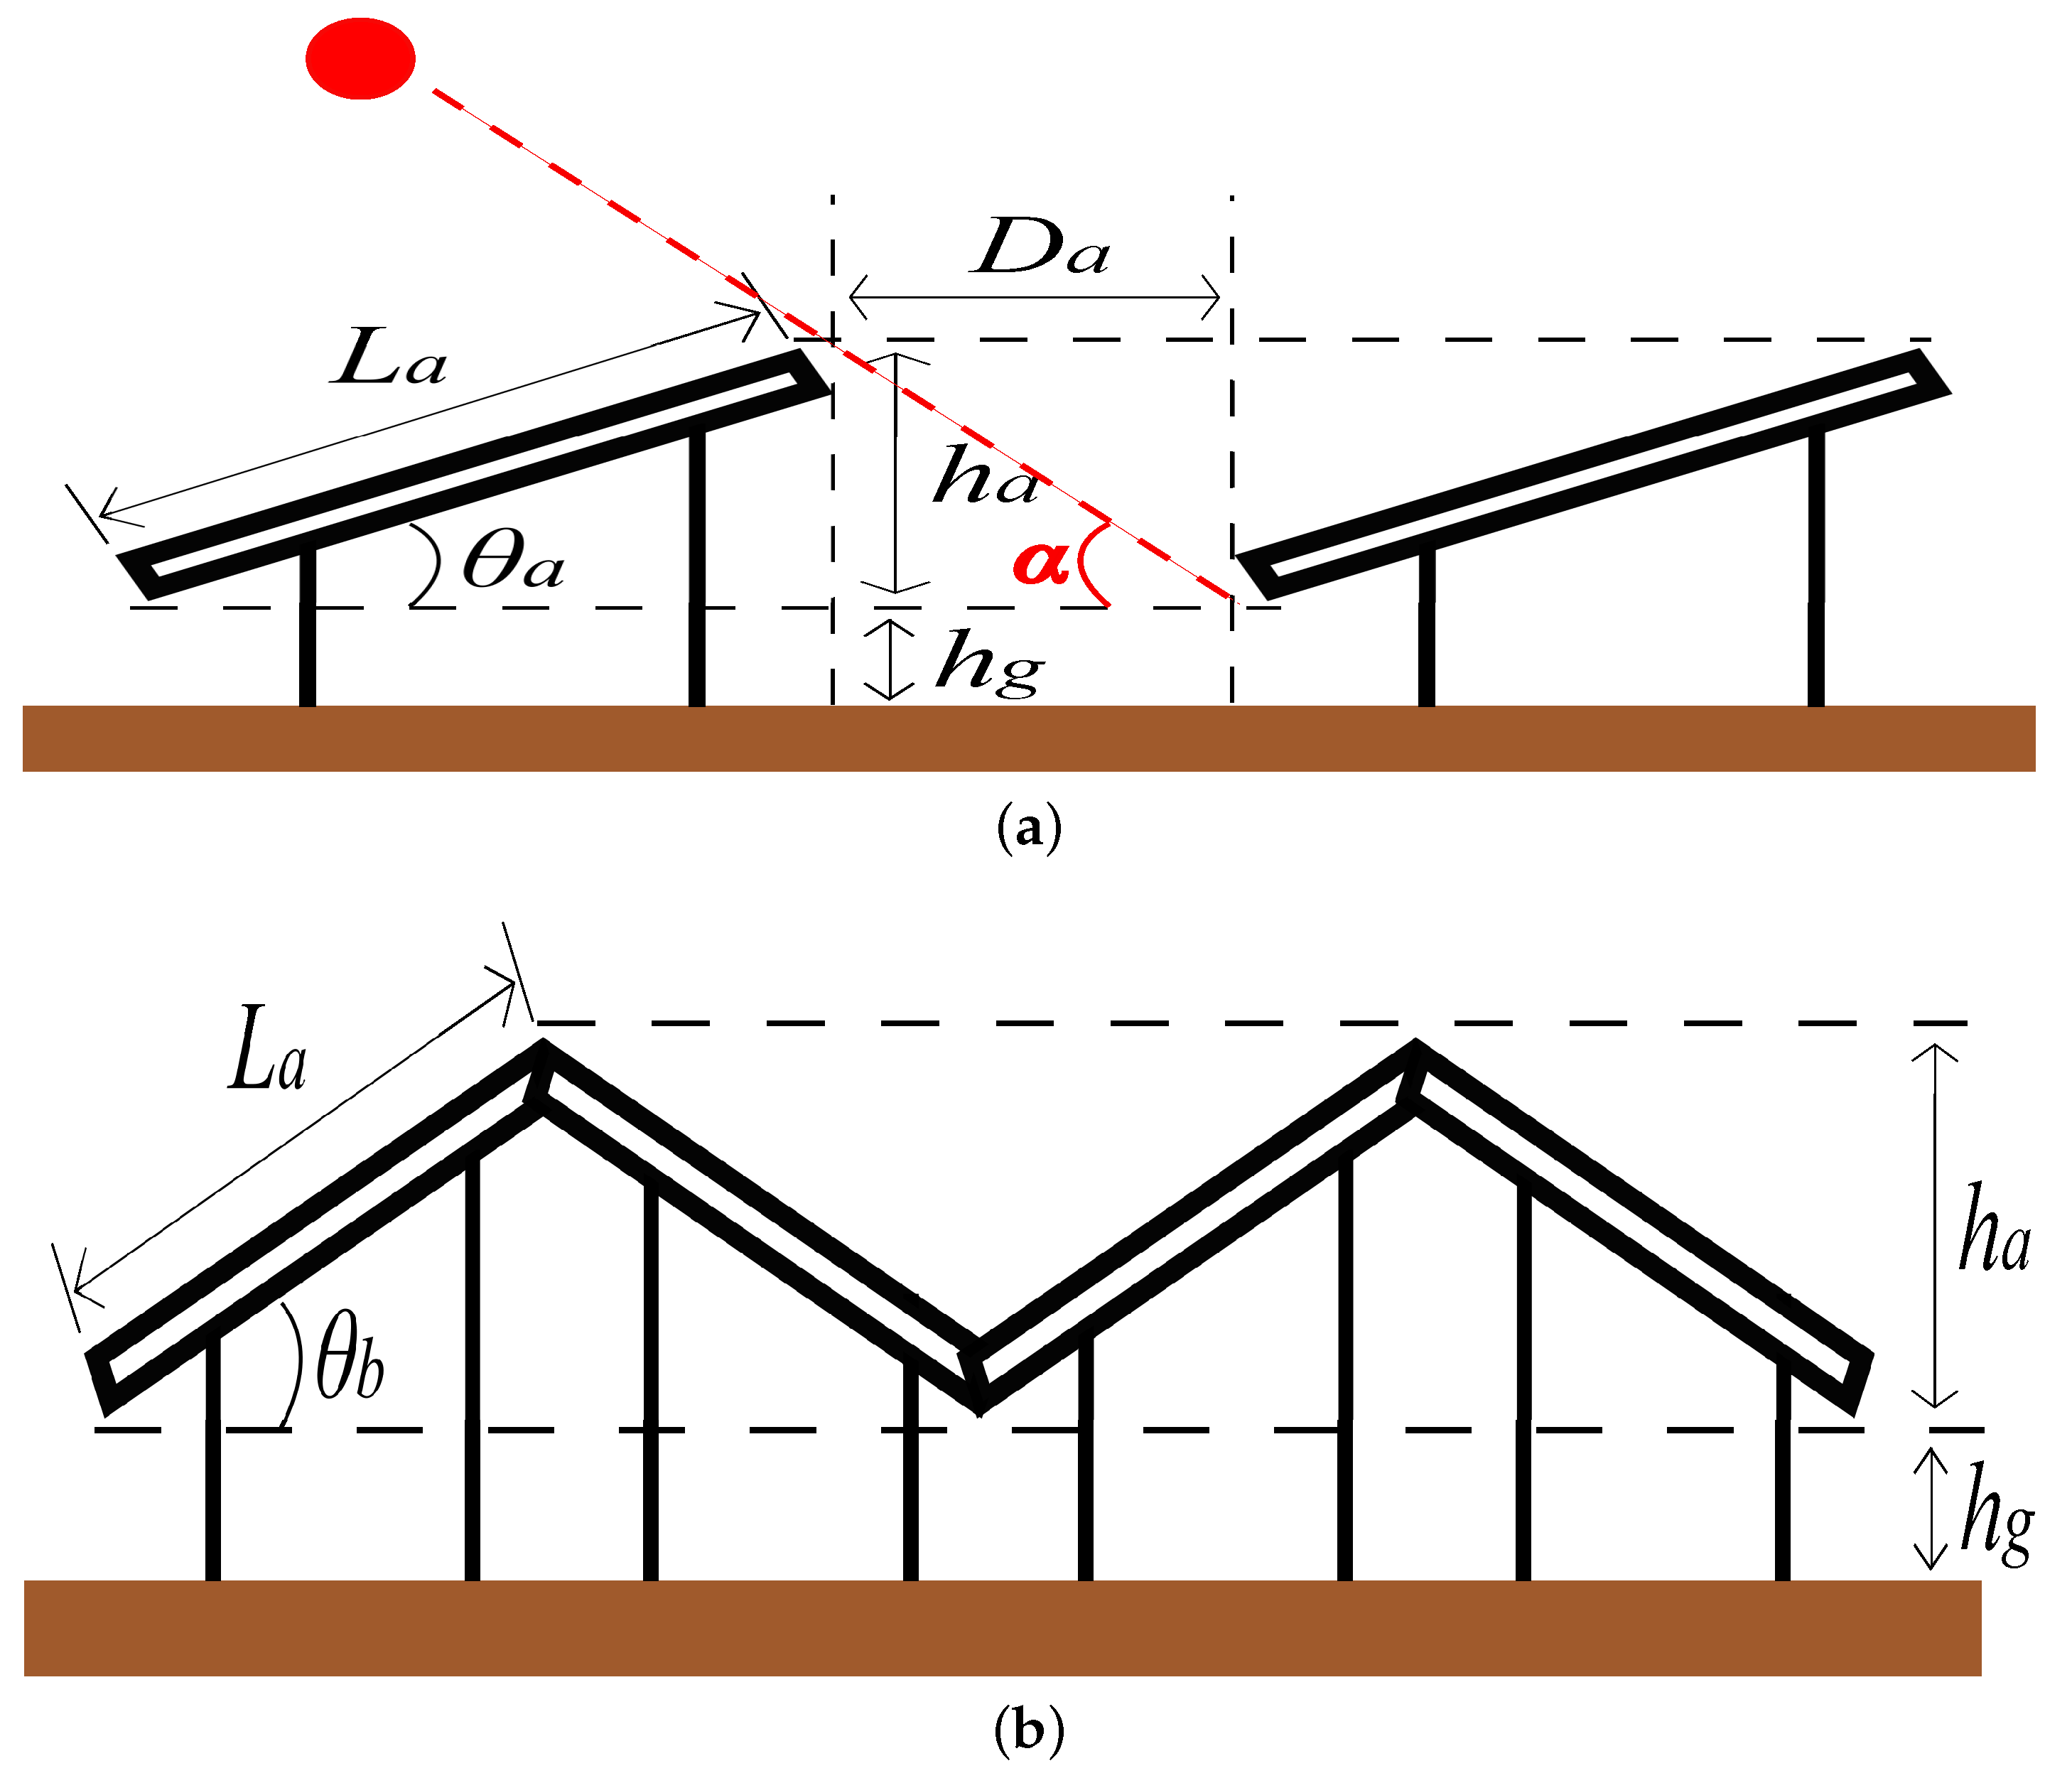
2.1. Photovoltaic Power Generation Model
2.2. Battery Storage Model
2.2.1. Charging
2.2.2. Discharging
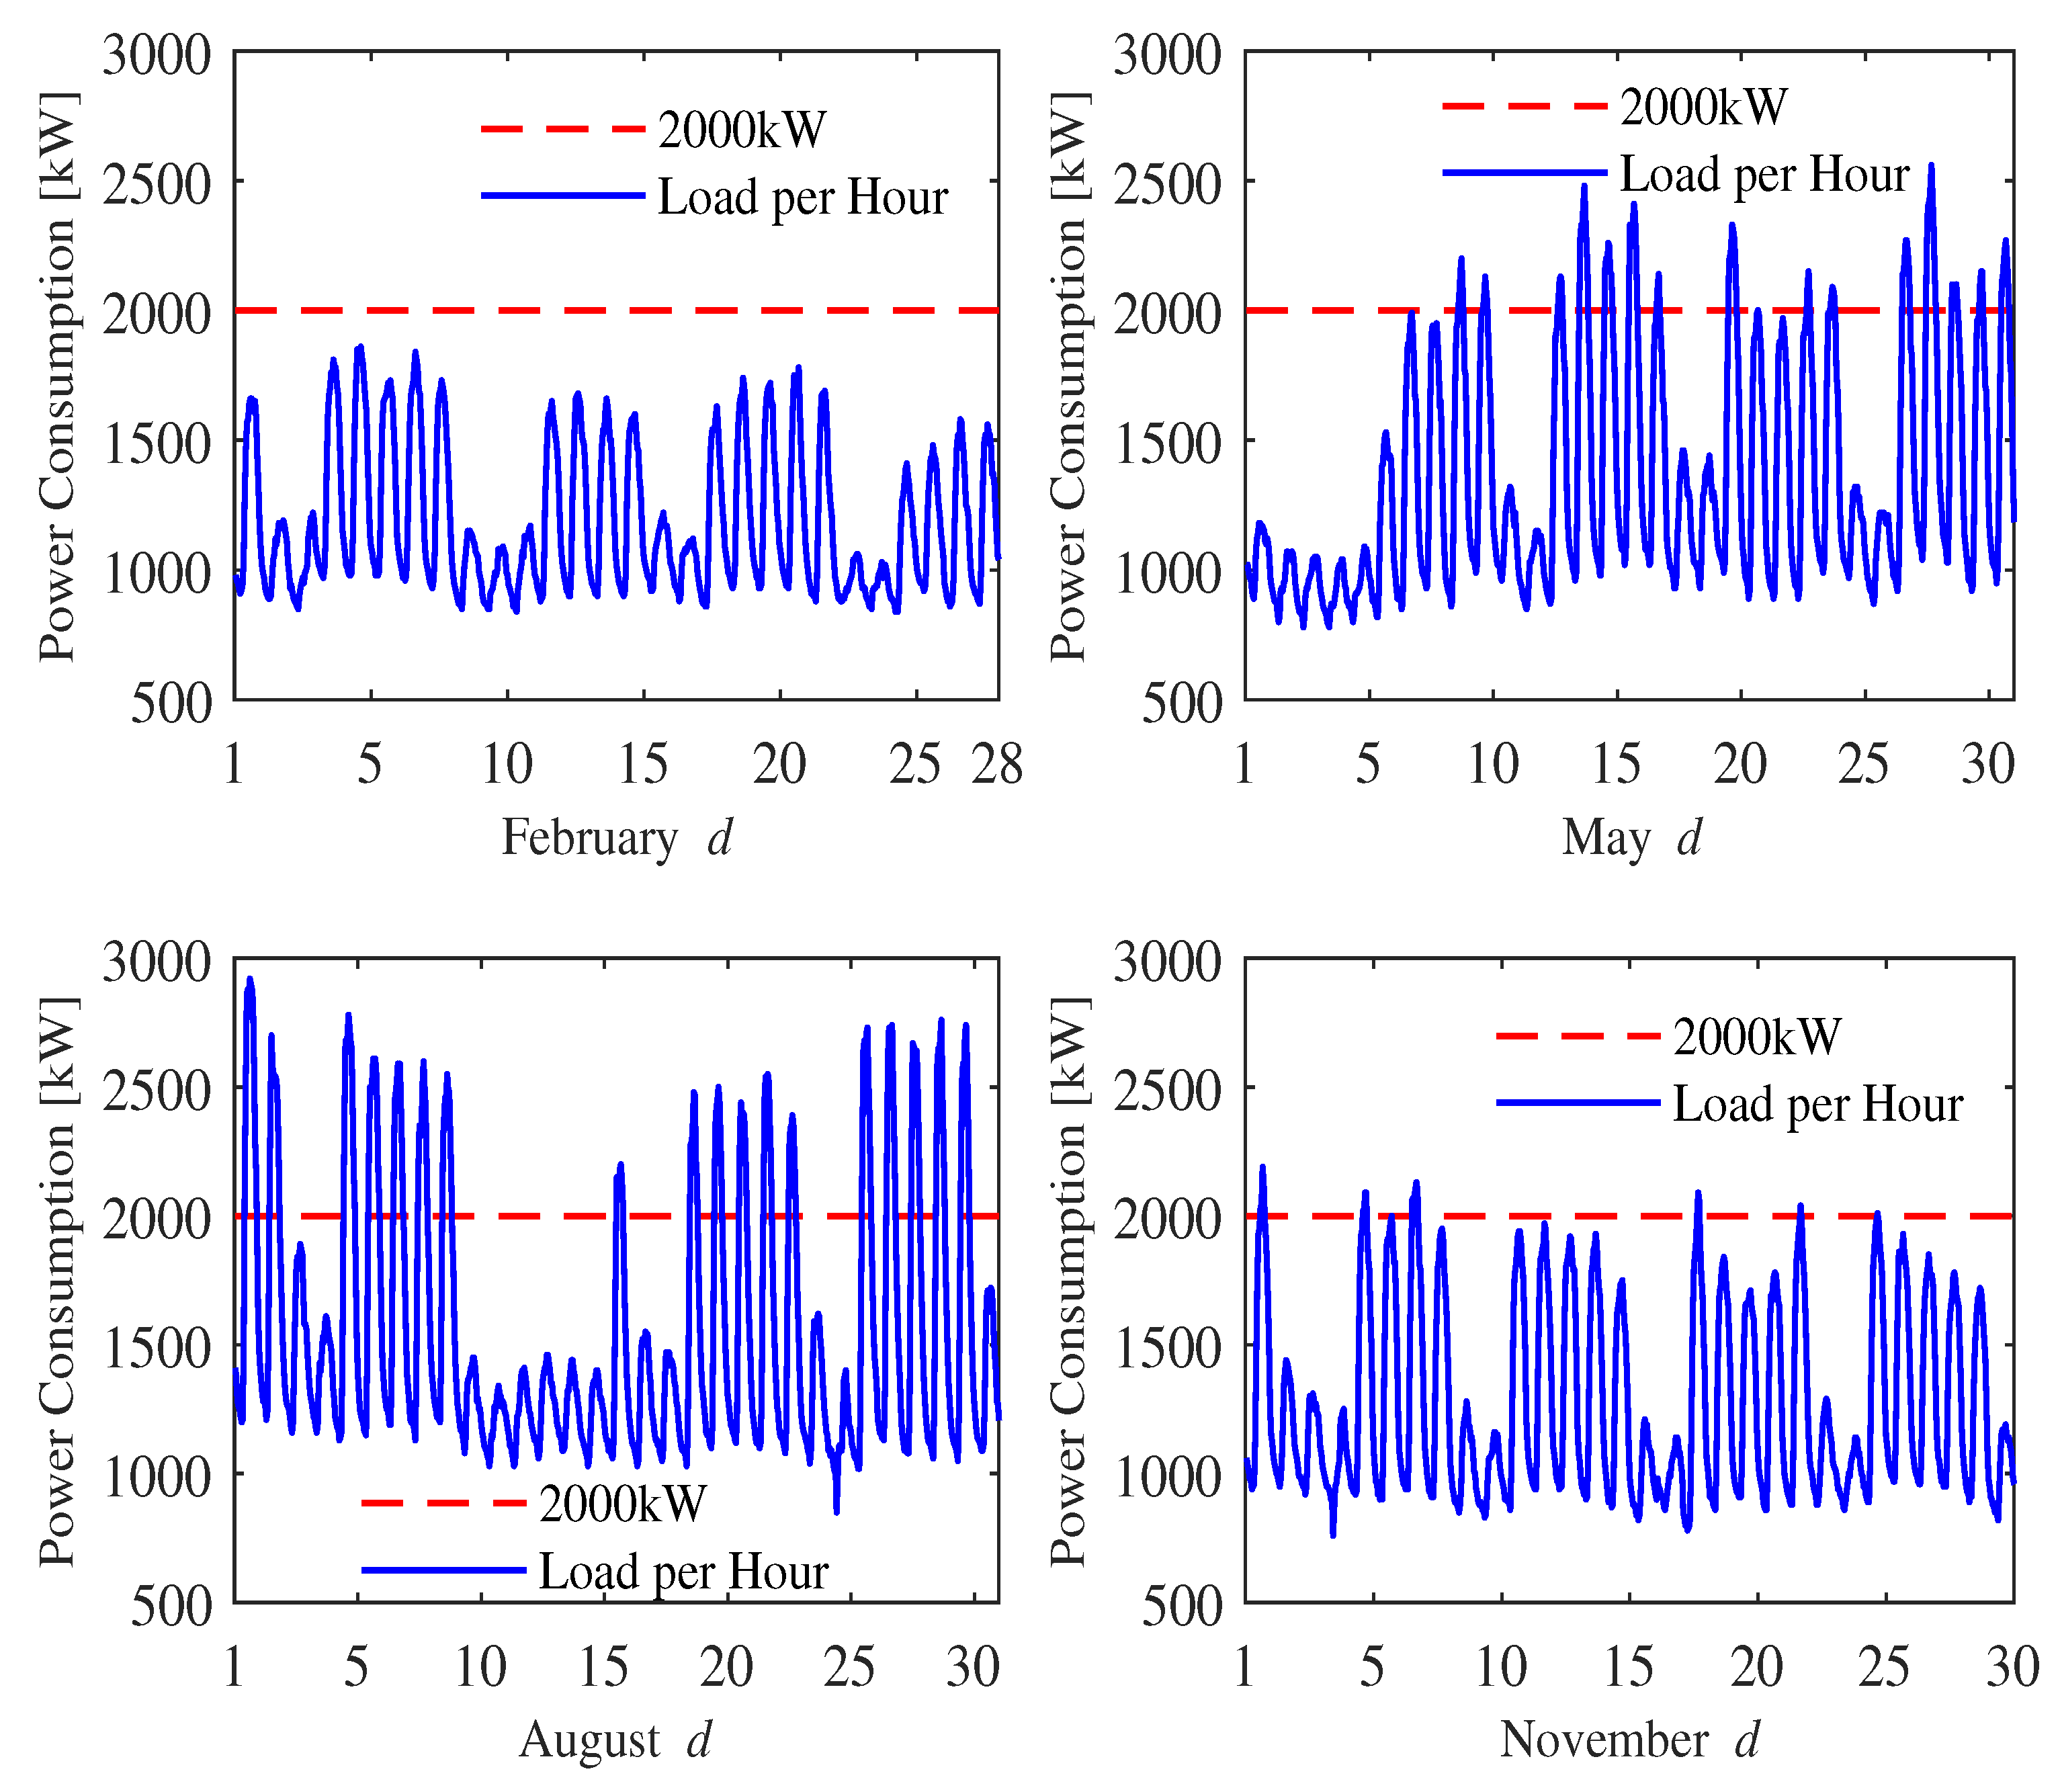
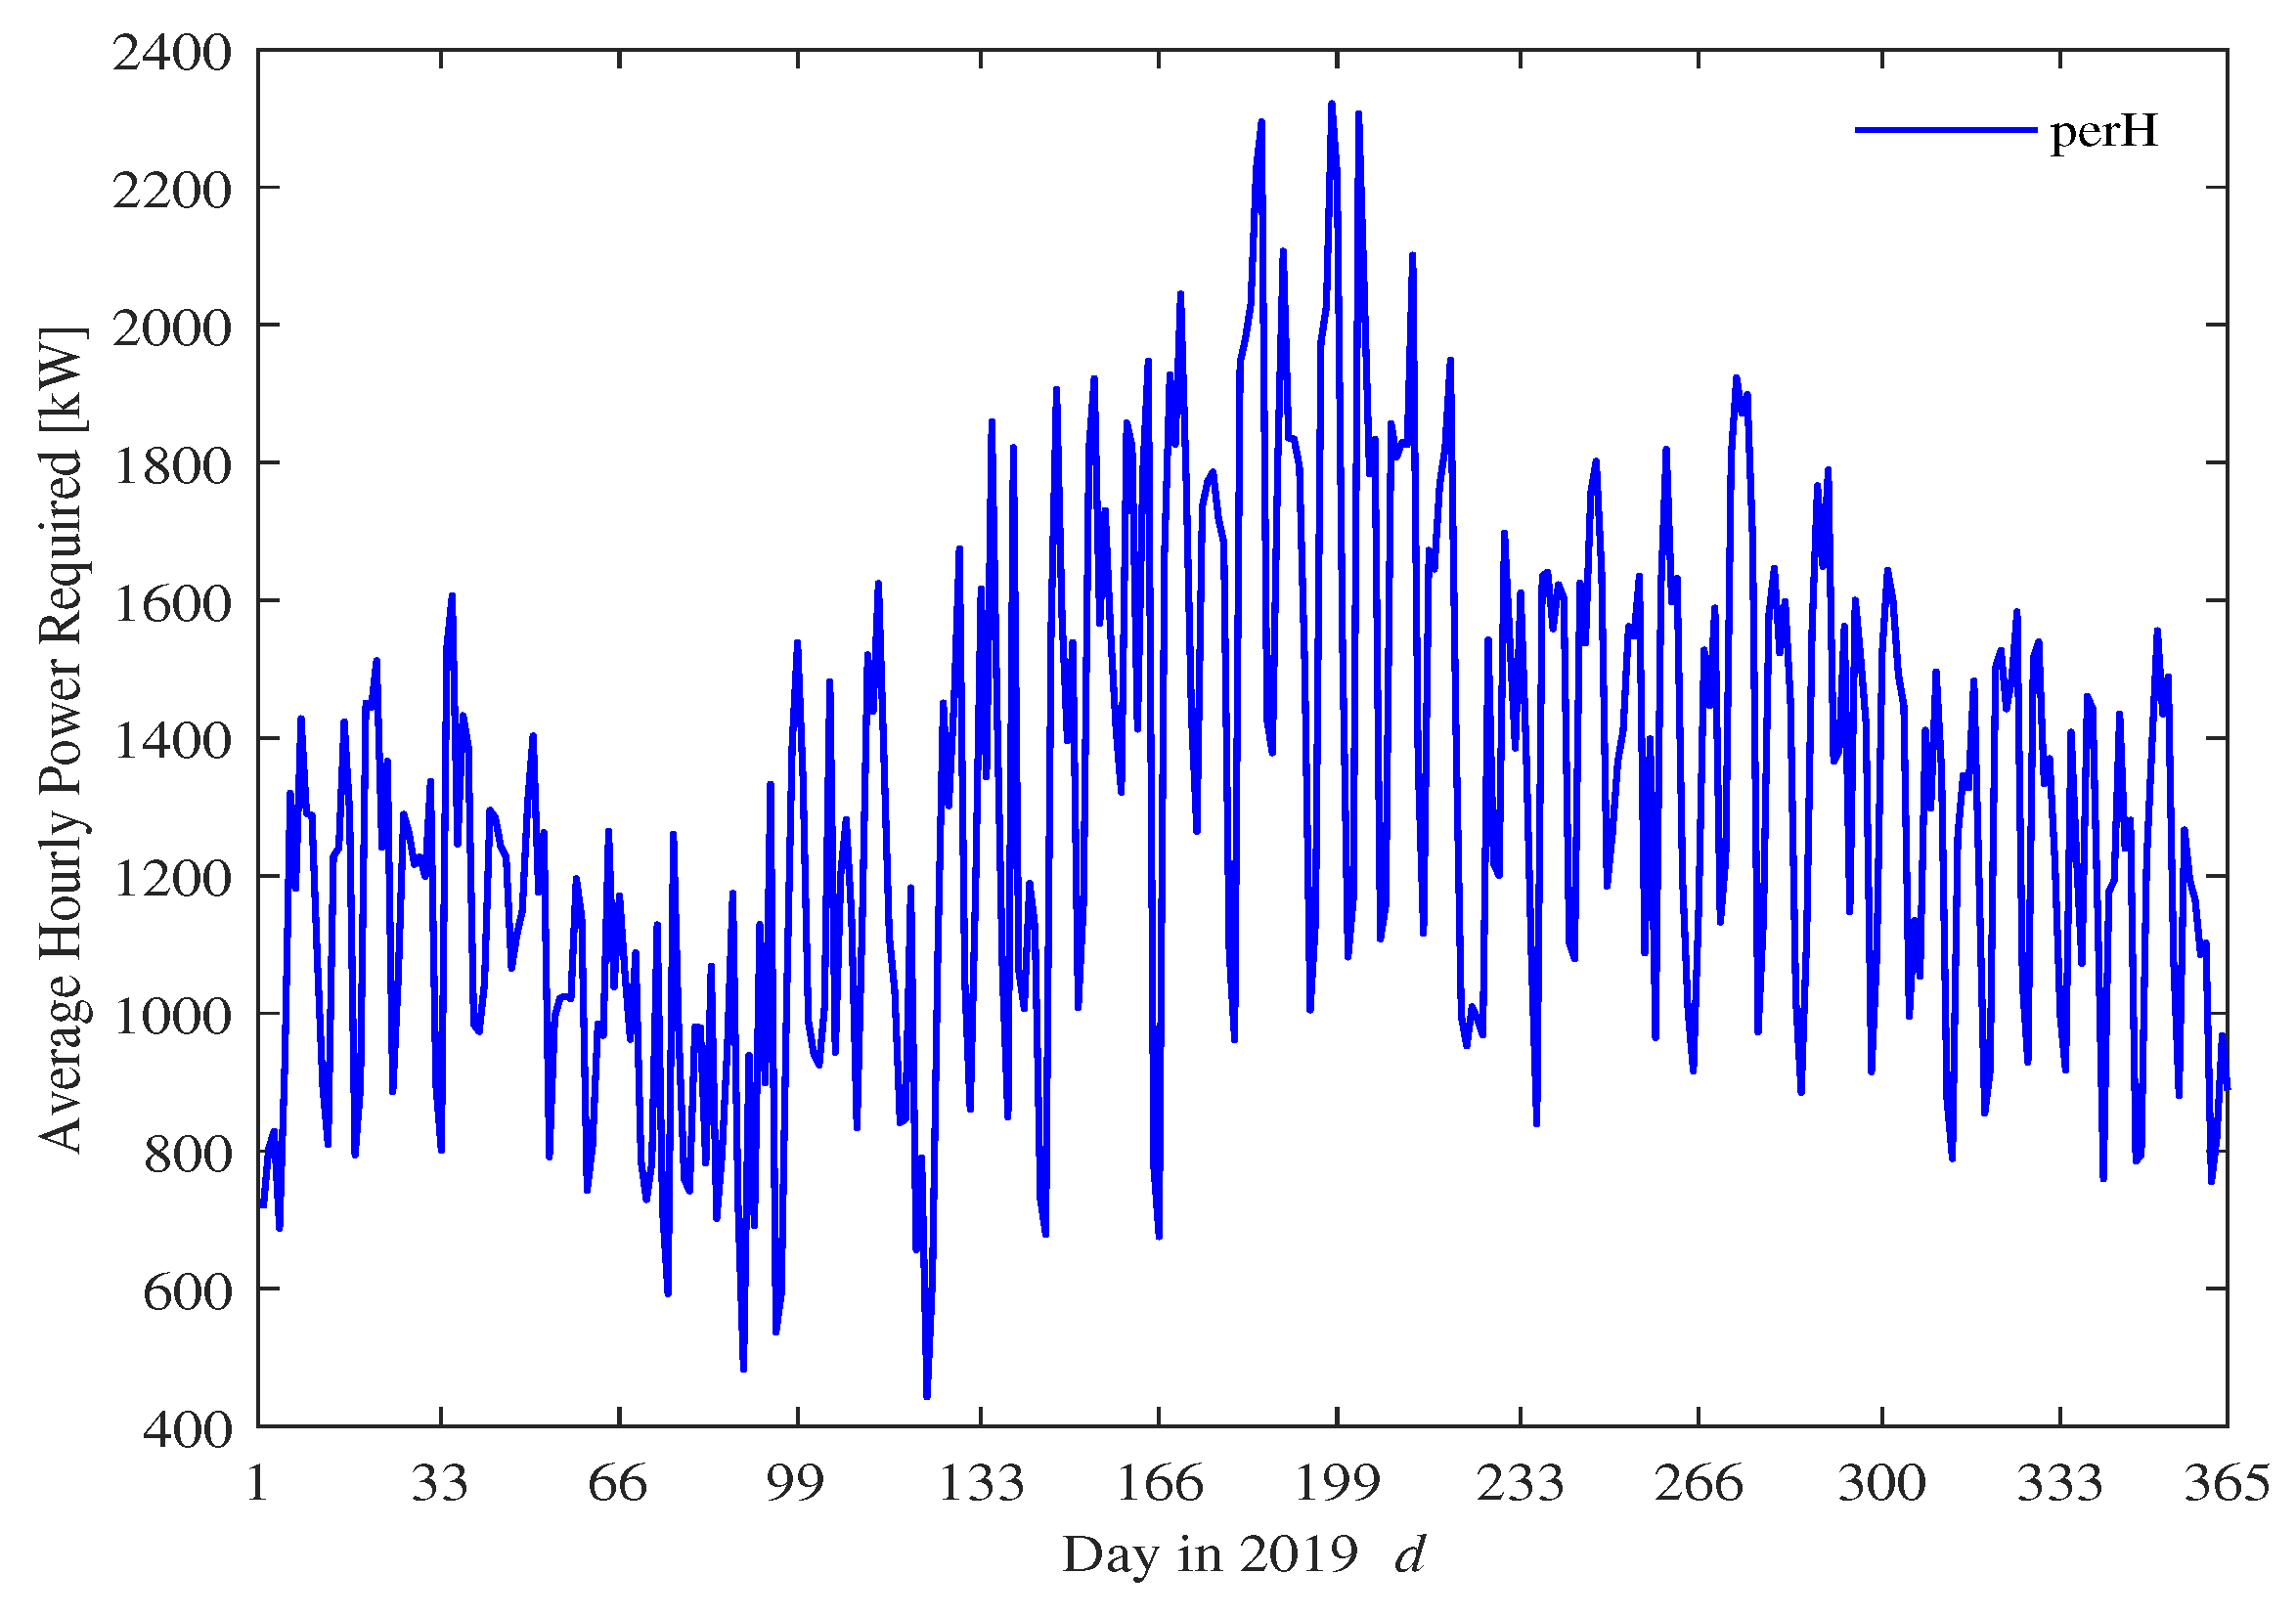
3. Simulation Conditions
3.1. Loss of Power Supply Probability
3.2. Waste of Energy
3.3. Life Cycle Cost
3.4. Optimization Goals and Constraints
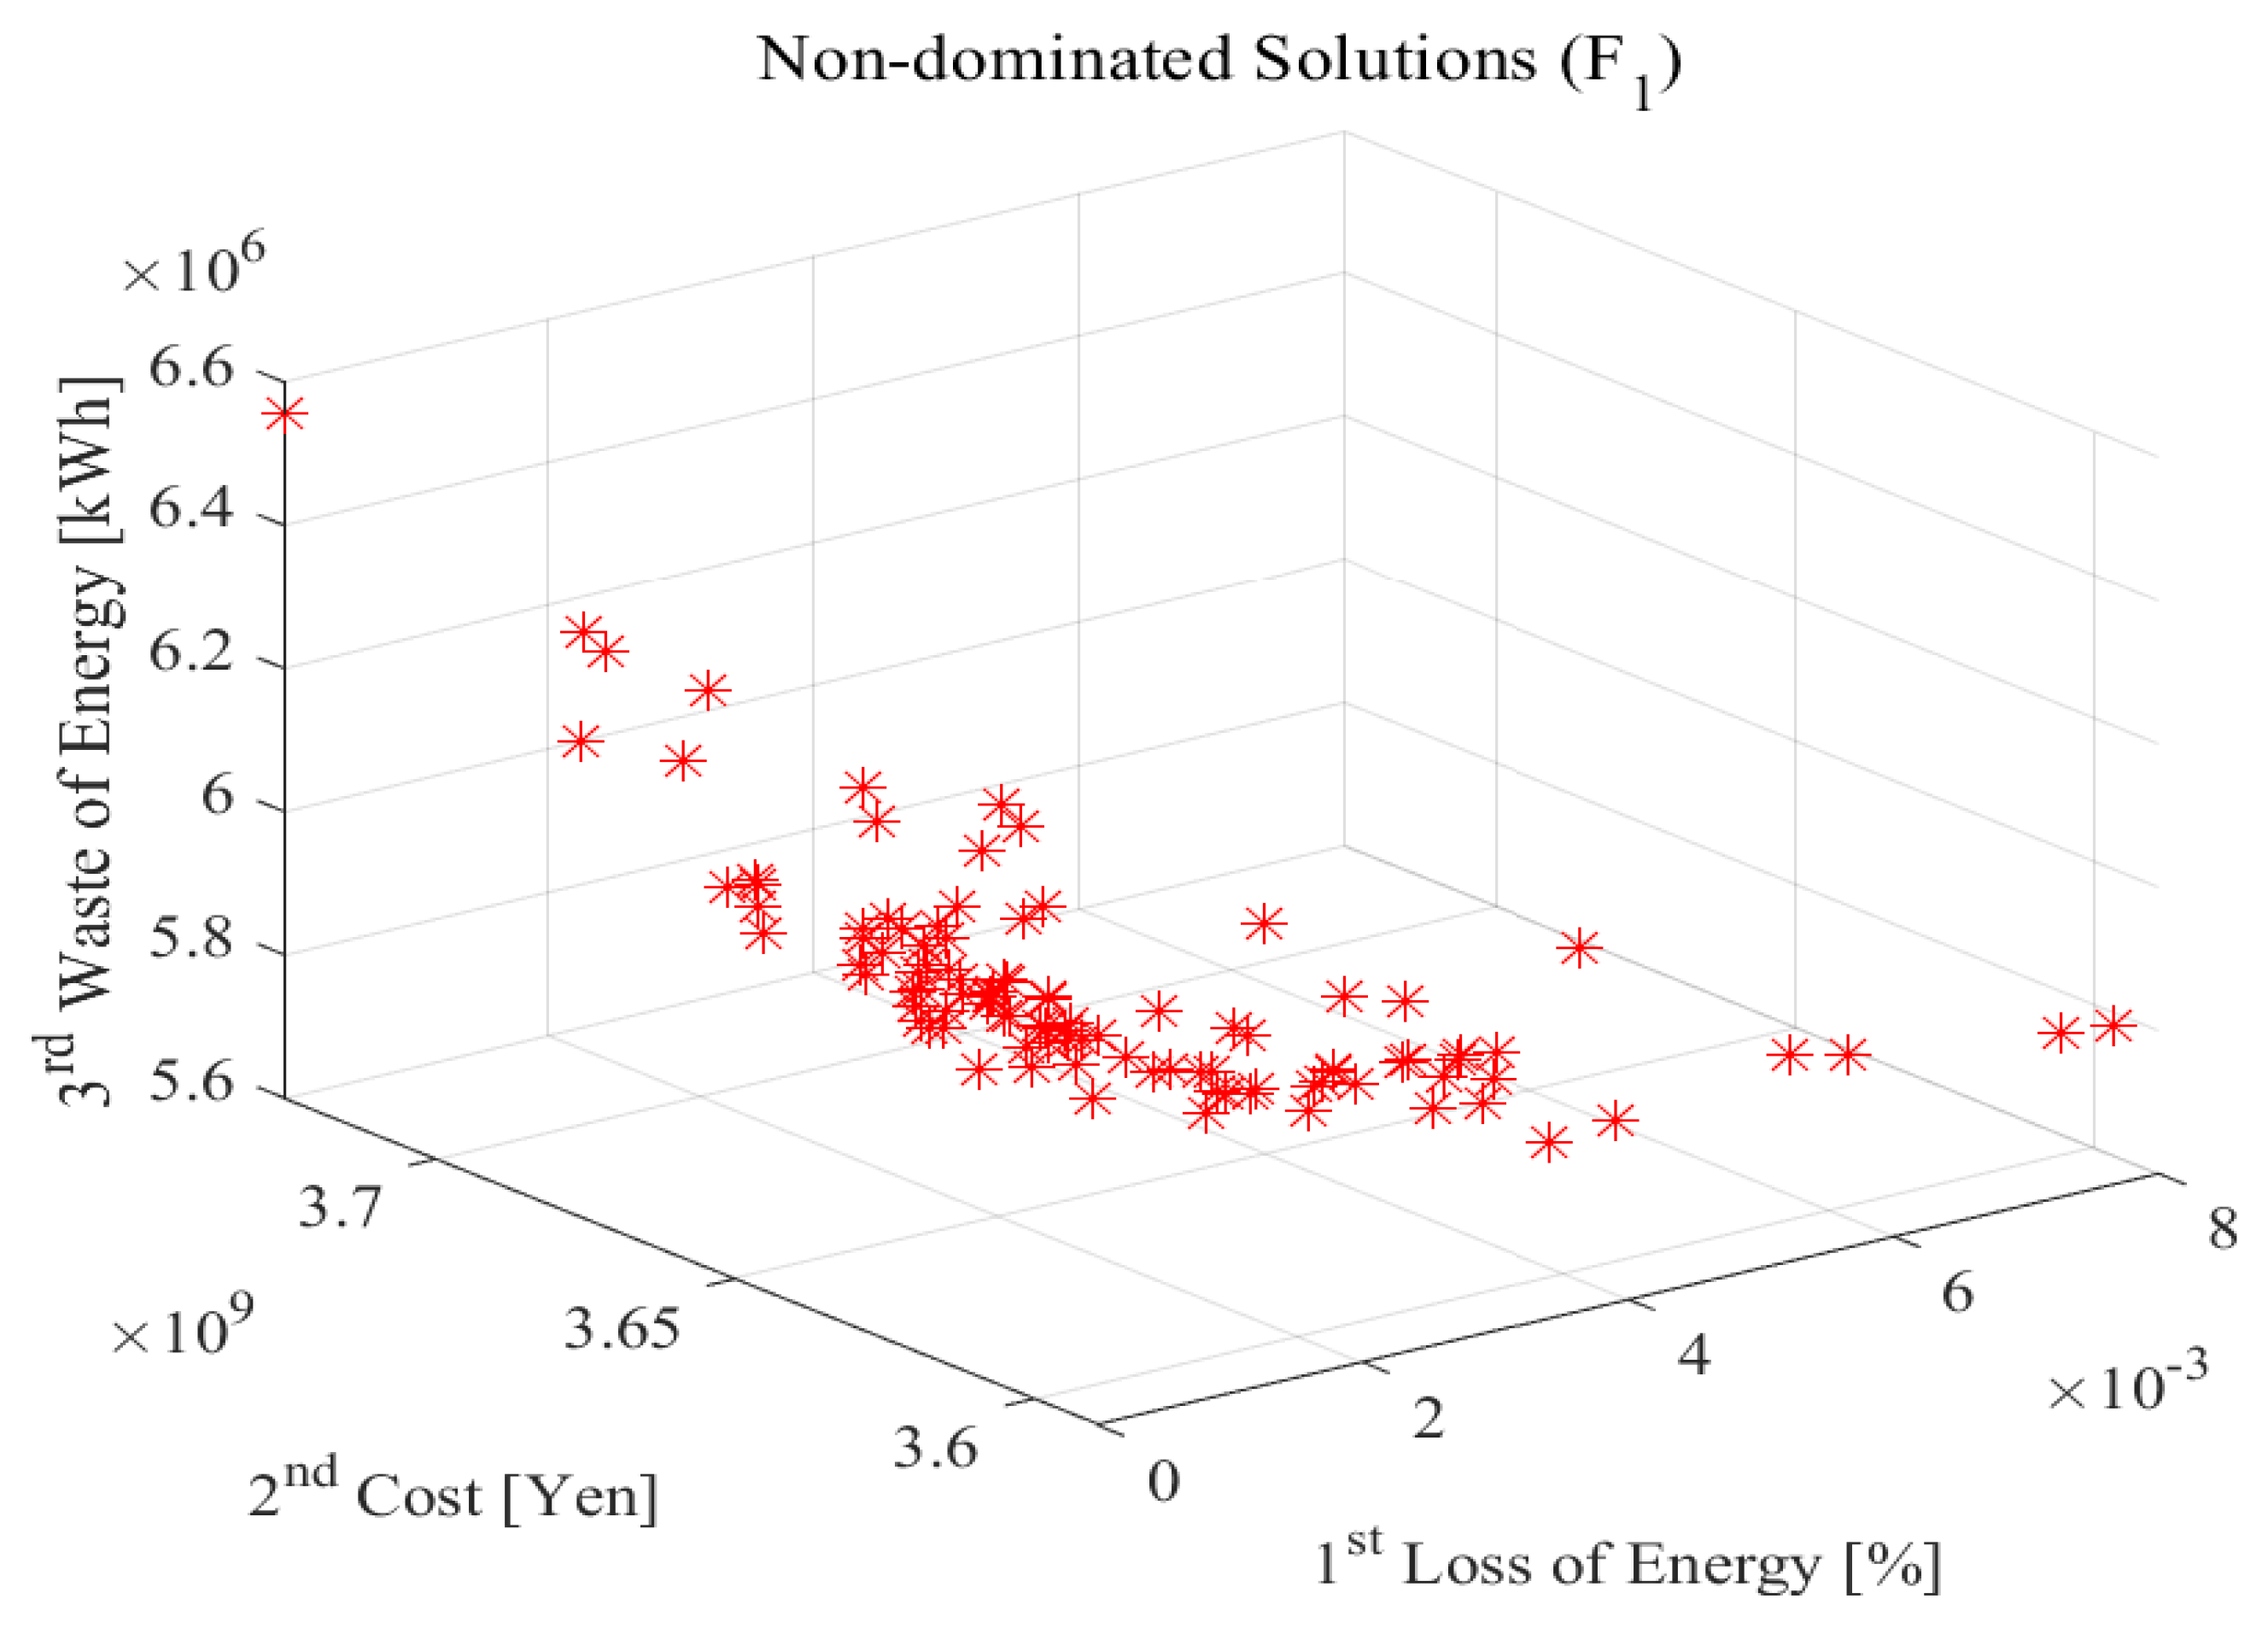
3.4.1. Case 1
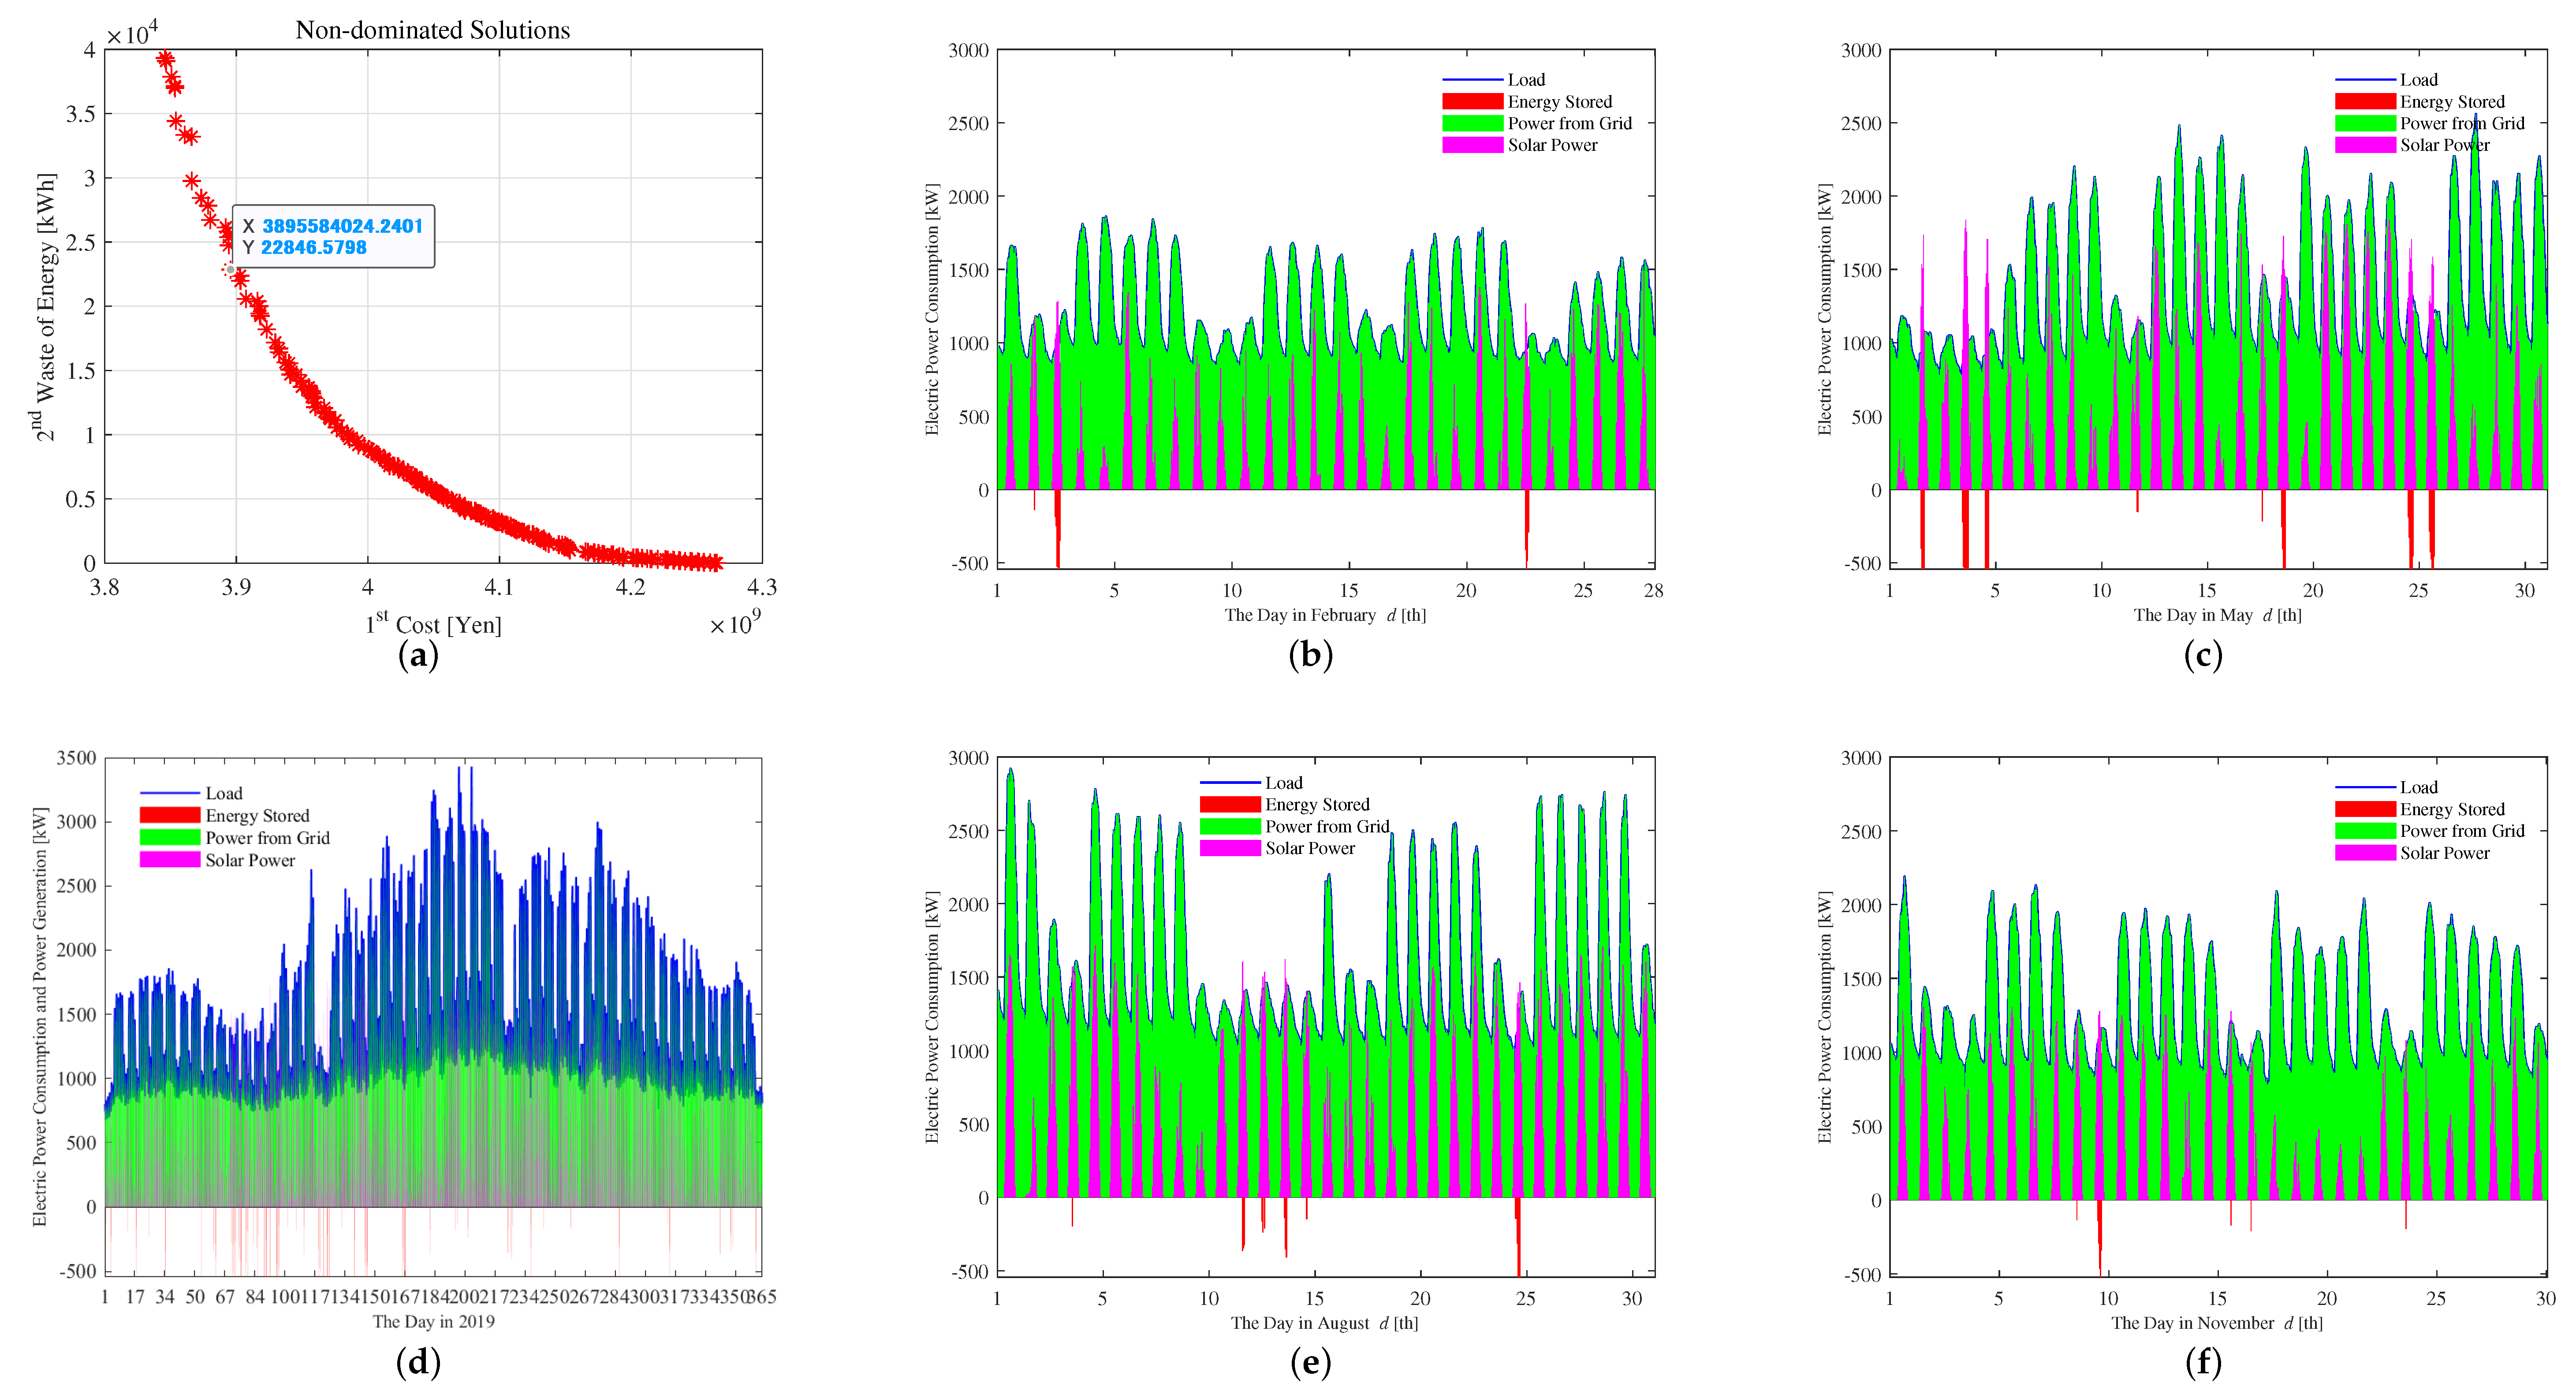
3.4.2. Case 2
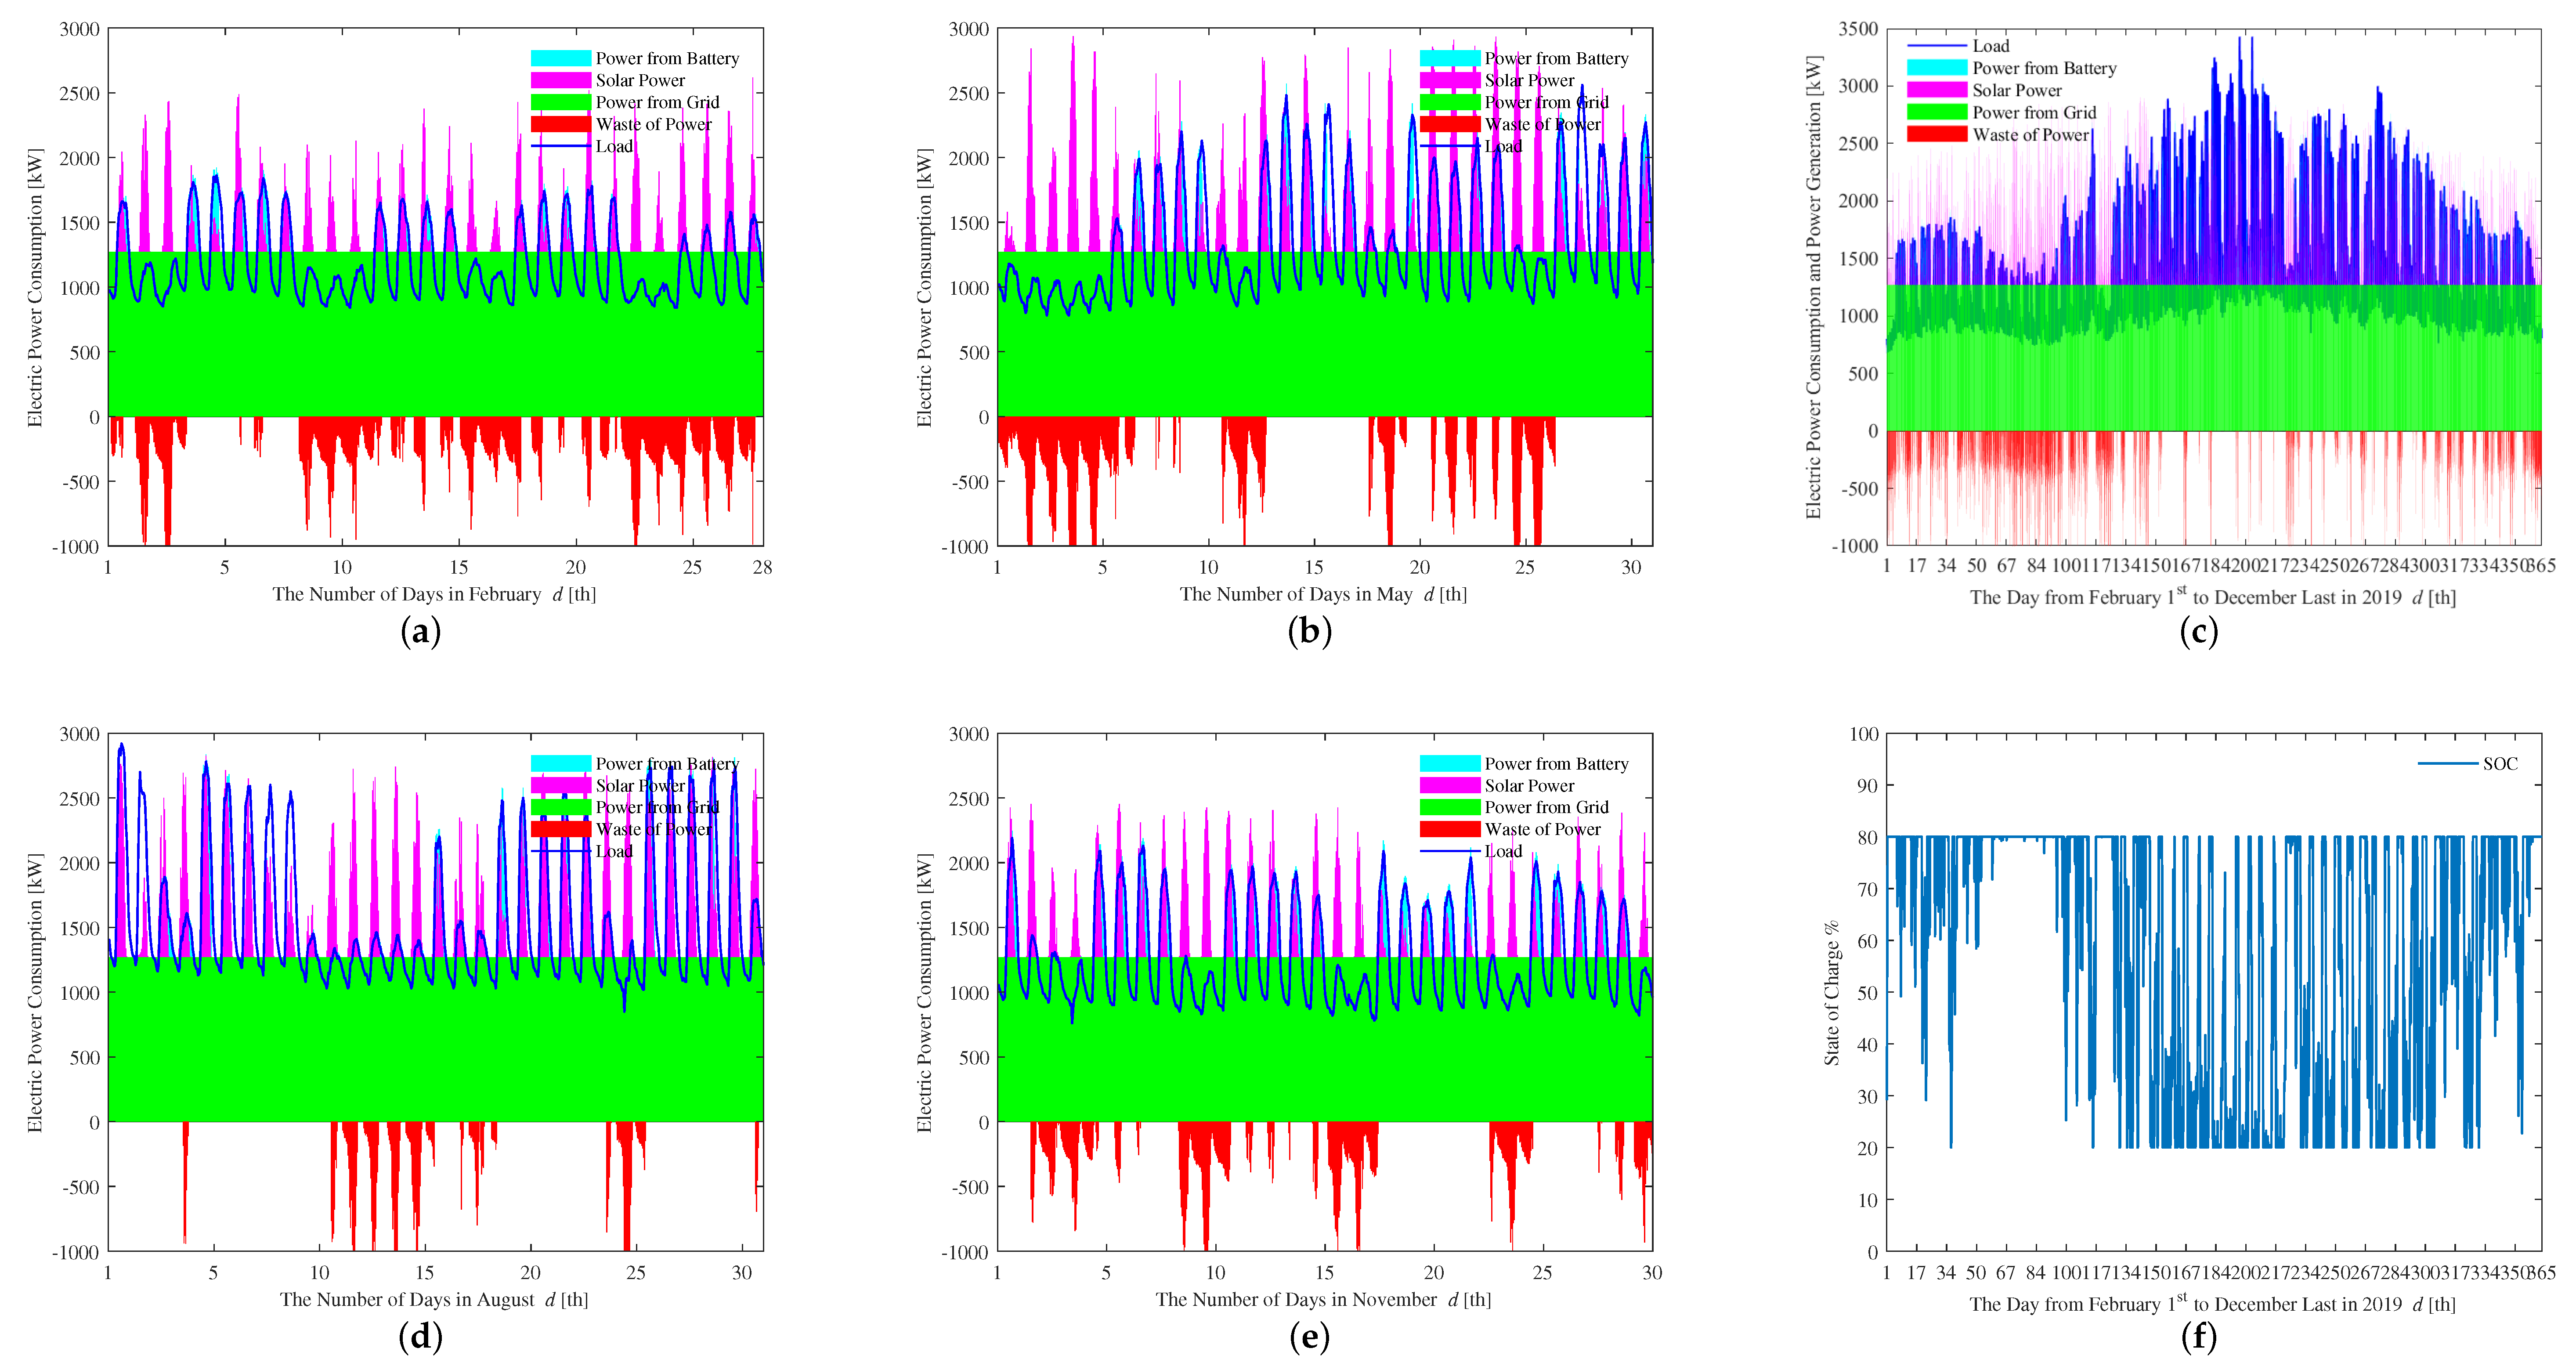
3.4.3. Case 3
4. Simulation Results and Discussion
4.1. Case 1
4.2. Case 2
4.3. Case 3
5. Conclusions
Author Contributions
Funding
Institutional Review Board Statement
Informed Consent Statement
Data Availability Statement
Acknowledgments
Conflicts of Interest
Abbreviations
| PV | Photovoltaic |
| NSGA-II | Non-dominated sorting genetic algorithm II |
| LPSP | Loss of power supply probability |
| LCC | Life cycle cost |
| WE | Waste of energy |
| ESS | Energy storage systems |
| GA | Genetic algorithm |
| HESs | Hybrid energy systems |
| nZEB | Nearly/net-zero energy buildings |
| CSEA | Chaotic self-adaptive evolutionary algorithm |
| WG | Wind turbine |
| BESS | Battery energy storage system |
| FC | Fuel cell |
| MILP | Mixed-integer linear programming |
| SOC | State of charge |
| SDG | Sustainable Development Goals |
| UN | United Nations |
References
- Nehrir, M.H.; Wang, C.; Strunz, K.; Aki, H.; Ramakumar, R.; Bing, J.; Miao, Z.; Salameh, Z. A Review of Hybrid Renewable/Alternative Energy Systems for Electric Power Generation: Configurations, Control, and Applications. IEEE Trans. Sustain. Energy 2011, 2, 392–403. [Google Scholar] [CrossRef]
- Mohandes, B.; Moursi, M.S.E.; Hatziargyriou, N.; Khatib, S.E. A Review of Power System Flexibility with High Penetration of Renewables. IEEE Trans. Power Syst. 2019, 34, 3140–3155. [Google Scholar] [CrossRef]
- Eid, B.M.; Rahim, N.A.; Selvaraj, J.; Khateb, A.H.E. Control Methods and Objectives for Electronically Coupled Distributed Energy Resources in Microgrids: A Review. IEEE Syst. J. 2014, 10, 446–458. [Google Scholar] [CrossRef]
- Hossain, E.; Kabalci, E.; Bayindir, R.; Perez, R. Microgrid testbeds around the world: State of art. Energy Convers. Manag. 2014, 86, 132–153. [Google Scholar] [CrossRef]
- Hosenuzzaman, M.; Rahim, N.; Selvaraj, J.; Hasanuzzaman, M.; Malek, A.A.; Nahar, A. Global prospects, progress, policies, and environmental impact of solar photovoltaic power generation. Renew. Sustain. Energy Rev. 2015, 41, 284–297. [Google Scholar] [CrossRef]
- Masrur, H.; Senjyu, T.; Islam, M.R.; Kouzani, A.Z.; Mahmud, M.A.P. Optimal Operation of Resilient Microgrids During Grid Outages. In Proceedings of the 2020 IEEE International Conference on Applied Superconductivity and Electromagnetic Devices (ASEMD), Tianjin, China, 16–18 October 2020; pp. 1–2. [Google Scholar] [CrossRef]
- Arefin, A.A.; Masrur, H.; Othman, M.L.; Hizam, H.; Abdul Wahab, N.I.; Jalaluddin, N.A.; Islam, S.Z. Power Resilience Enhancement of a PV-Battery-Diesel Microgrid. In Proceedings of the 2020 International Conference on Smart Grids and Energy Systems (SGES), Perth, Australia, 23–26 November 2020; pp. 860–863. [Google Scholar] [CrossRef]
- Barbour, E.; Parra, D.; Awwad, Z.; González, M.C. Community energy storage: A smart choice for the smart grid? Appl. Energy 2018, 212, 489–497. [Google Scholar] [CrossRef]
- Bracco, S.; Brignone, M.; Delfino, F.; Procopio, R. An Energy Management System for the Savona Campus Smart Polygeneration Microgrid. IEEE Syst. J. 2015, 11, 1799–1809. [Google Scholar] [CrossRef]
- Sediqi, M.M.; Furukakoi, M.; Lotfy, M.E.; Yona, A.; Senjyu, T. Optimal economical sizing of grid-connected hybrid renewable energy system. J. Energy Power Eng. 2017, 11, 244–253. [Google Scholar]
- Huang, Z.; Lu, Y.; Wei, M.; Liu, J. Performance analysis of optimal designed hybrid energy systems for grid-connected nearly/net zero energy buildings. Energy 2017, 141, 1795–1809. [Google Scholar] [CrossRef]
- Masrur, H.; Howlader, H.O.R.; Elsayed Lotfy, M.; Khan, K.R.; Guerrero, J.M.; Senjyu, T. Analysis of Techno-Economic-Environmental Suitability of an Isolated Microgrid System Located in a Remote Island of Bangladesh. Sustainability 2020, 12, 2880. [Google Scholar] [CrossRef]
- Konneh, K.V.; Masrur, H.; Othman, M.L.; Wahab, N.I.A.; Hizam, H.; Islam, S.Z.; Crossley, P.; Senjyu, T. Optimal Design and Performance Analysis of a Hybrid Off-Grid Renewable Power System Considering Different Component Scheduling, PV Modules, and Solar Tracking Systems. IEEE Access 2021, 9, 64393–64413. [Google Scholar] [CrossRef]
- Howlader, H.O.R.; Sediqi, M.M.; Ibrahimi, A.M.; Senjyu, T. Optimal thermal unit commitment for solving duck curve problem by introducing CSP, PSH and demand response. IEEE Access 2018, 6, 4834–4844. [Google Scholar] [CrossRef]
- Song, H. Multi-objective optimal sizing of stand-alone hybrid wind/PV system. Diangong Jishu Xuebao (Trans. China Electrotech. Soc.) 2011, 26, 104–111. [Google Scholar]
- Mehrjerdi, H.; Bornapour, M.; Hemmati, R.; Ghiasi, S.M.S. Unified energy management and load control in building equipped with wind-solar-battery incorporating electric and hydrogen vehicles under both connected to the grid and islanding modes. Energy 2019, 168, 919–930. [Google Scholar] [CrossRef]
- Gamil, M.M.; Sugimura, M.; Nakadomari, A.; Senjyu, T.; Howlader, H.O.R.; Takahashi, H.; Hemeida, A.M. Optimal Sizing of a Real Remote Japanese Microgrid with Sea Water Electrolysis Plant Under Time-Based Demand Response Programs. Energies 2020, 13, 3666. [Google Scholar] [CrossRef]
- Susowake, Y.; Masrur, H.; Yabiku, T.; Senjyu, T.; Motin Howlader, A.; Abdel-Akher, M.; M. Hemeida, A. A Multi-Objective Optimization Approach towards a Proposed Smart Apartment with Demand-Response in Japan. Energies 2019, 13, 127. [Google Scholar] [CrossRef]
- CO2 Emissions by Energy Source, World 1990–2018. Available online: https://www.iea.org/data-and-statistics/data-browser/?country=WORLD&fuel=CO2%20emissions&indicator=CO2BySource (accessed on 7 May 2021).
- Huang, Y.; Shigenobu, R.; Yona, A.; Mandal, P.; Yan, Z.; Senjyu, T. M-Shape PV Arrangement for Improving Solar Power Generation Efficiency. Appl. Sci. 2020, 10, 537. [Google Scholar] [CrossRef]
- University of the Ryukyus Data Book. 2019. Available online: https://www.u-ryukyu.ac.jp/wp-content/uploads/2020/01/632c54fb8d40a1dbb7aaefbef5199966.pdf (accessed on 29 July 2020).
- Belfkira, R.; Zhang, L.; Barakat, G. Optimal sizing study of hybrid wind/PV/diesel power generation unit. Sol. Energy 2011, 85, 100–110. [Google Scholar] [CrossRef]
- Yang, X.; Dong, D.; Xiangjun, L.I.; Xue, M.A.; Geng, N.; Jia, X. Active Power Coordinated Control Strategy of Peak Load Shifting for Energy Storage System in Business Park. Power Syst. Technol. 2018, 42, 2551–2561. [Google Scholar]
- Initiatives for SDGs at the University of the Ryukyus. Available online: https://www.u-ryukyu.ac.jp/aboutus/sdgs/ (accessed on 29 July 2020).
- Tahara, H.; Matayoshi, H.; Howlader, H.O.R.; Aditya, S.; Senjyu, T. Smart Apartment with Demand-Response Andfixed Batteries. In Proceedings of the 14th Conference of International Building Performance Simulation Association (BS 2015), Hyderabad, India, 7–9 December 2015; pp. 2587–2592. [Google Scholar]
- A Public Table of Basic Emission Coefficients, Adjusted Emission Coefficients of the Electric Company in Heisei 30. Available online: http://www.env.go.jp/press/107541-print.html (accessed on 10 October 2020).


| Index | Unit Price | Life Span |
|---|---|---|
| PV | 10,000 (JPY/Module) | 20 (Year) |
| Battery | 15,000 (JPY/kWh) | 5 (Year) |
| Case 1 | Battery (kWh) | PV (Module) |
|---|---|---|
| Solution | 68 | 11,736 |
| Case 2 | Battery (kWh) | PV (Module) | Grid (kWh) |
|---|---|---|---|
| Solution | 796 | 10,636 | 1270 |
| Case 3 | Battery (kWh) | PV (Module) | Grid (kWh) |
|---|---|---|---|
| Solution | 591 | 11,320 | X |
| Indicator | Case 1 | Case 2 | Case 3 |
|---|---|---|---|
| / | 0.0472 | 0.0038 | |
Publisher’s Note: MDPI stays neutral with regard to jurisdictional claims in published maps and institutional affiliations. |
© 2021 by the authors. Licensee MDPI, Basel, Switzerland. This article is an open access article distributed under the terms and conditions of the Creative Commons Attribution (CC BY) license (https://creativecommons.org/licenses/by/4.0/).
Share and Cite
Huang, Y.; Masrur, H.; Shigenobu, R.; Hemeida, A.M.; Mikhaylov, A.; Senjyu, T. A Comparative Design of a Campus Microgrid Considering a Multi-Scenario and Multi-Objective Approach. Energies 2021, 14, 2853. https://doi.org/10.3390/en14112853
Huang Y, Masrur H, Shigenobu R, Hemeida AM, Mikhaylov A, Senjyu T. A Comparative Design of a Campus Microgrid Considering a Multi-Scenario and Multi-Objective Approach. Energies. 2021; 14(11):2853. https://doi.org/10.3390/en14112853
Chicago/Turabian StyleHuang, Yongyi, Hasan Masrur, Ryuto Shigenobu, Ashraf Mohamed Hemeida, Alexey Mikhaylov, and Tomonobu Senjyu. 2021. "A Comparative Design of a Campus Microgrid Considering a Multi-Scenario and Multi-Objective Approach" Energies 14, no. 11: 2853. https://doi.org/10.3390/en14112853
APA StyleHuang, Y., Masrur, H., Shigenobu, R., Hemeida, A. M., Mikhaylov, A., & Senjyu, T. (2021). A Comparative Design of a Campus Microgrid Considering a Multi-Scenario and Multi-Objective Approach. Energies, 14(11), 2853. https://doi.org/10.3390/en14112853