
Solar Tracking System with New Hybrid Control in Energy Production Optimization from Photovoltaic Conversion for Polish Climatic Conditions

Abstract
1. Introduction
1.1. Maximum Power Point Tracking Systems
- During the movement of the mounting frame with modules, dust and dirt are removed. This limits losses and provides protection against the “hot spot” effect, which is a result of uncontrolled shading [9]. A fragment of the ”hot spot” area may reach a temperature of over 250 °C, which usually leads to damaging of cells and, in an extreme case, its self-ignition.
- The operation of the dual-axis solar tracker eliminates losses resulting from the nonperpendicular incidence of solar radiation, which are referred to as angular losses.
- The PV systems on rotary mounting frames also have another positive effect as a result of movement relative to the air; this contributes to a reduction in losses that are the consequence of an increase in temperature.
- With regards to the operation of a tracking structure near the maximum power point (MPP), the performance of the inverter coupled with it is increased.
1.2. Solar Radiation Detection Methods
2. Materials and Methods
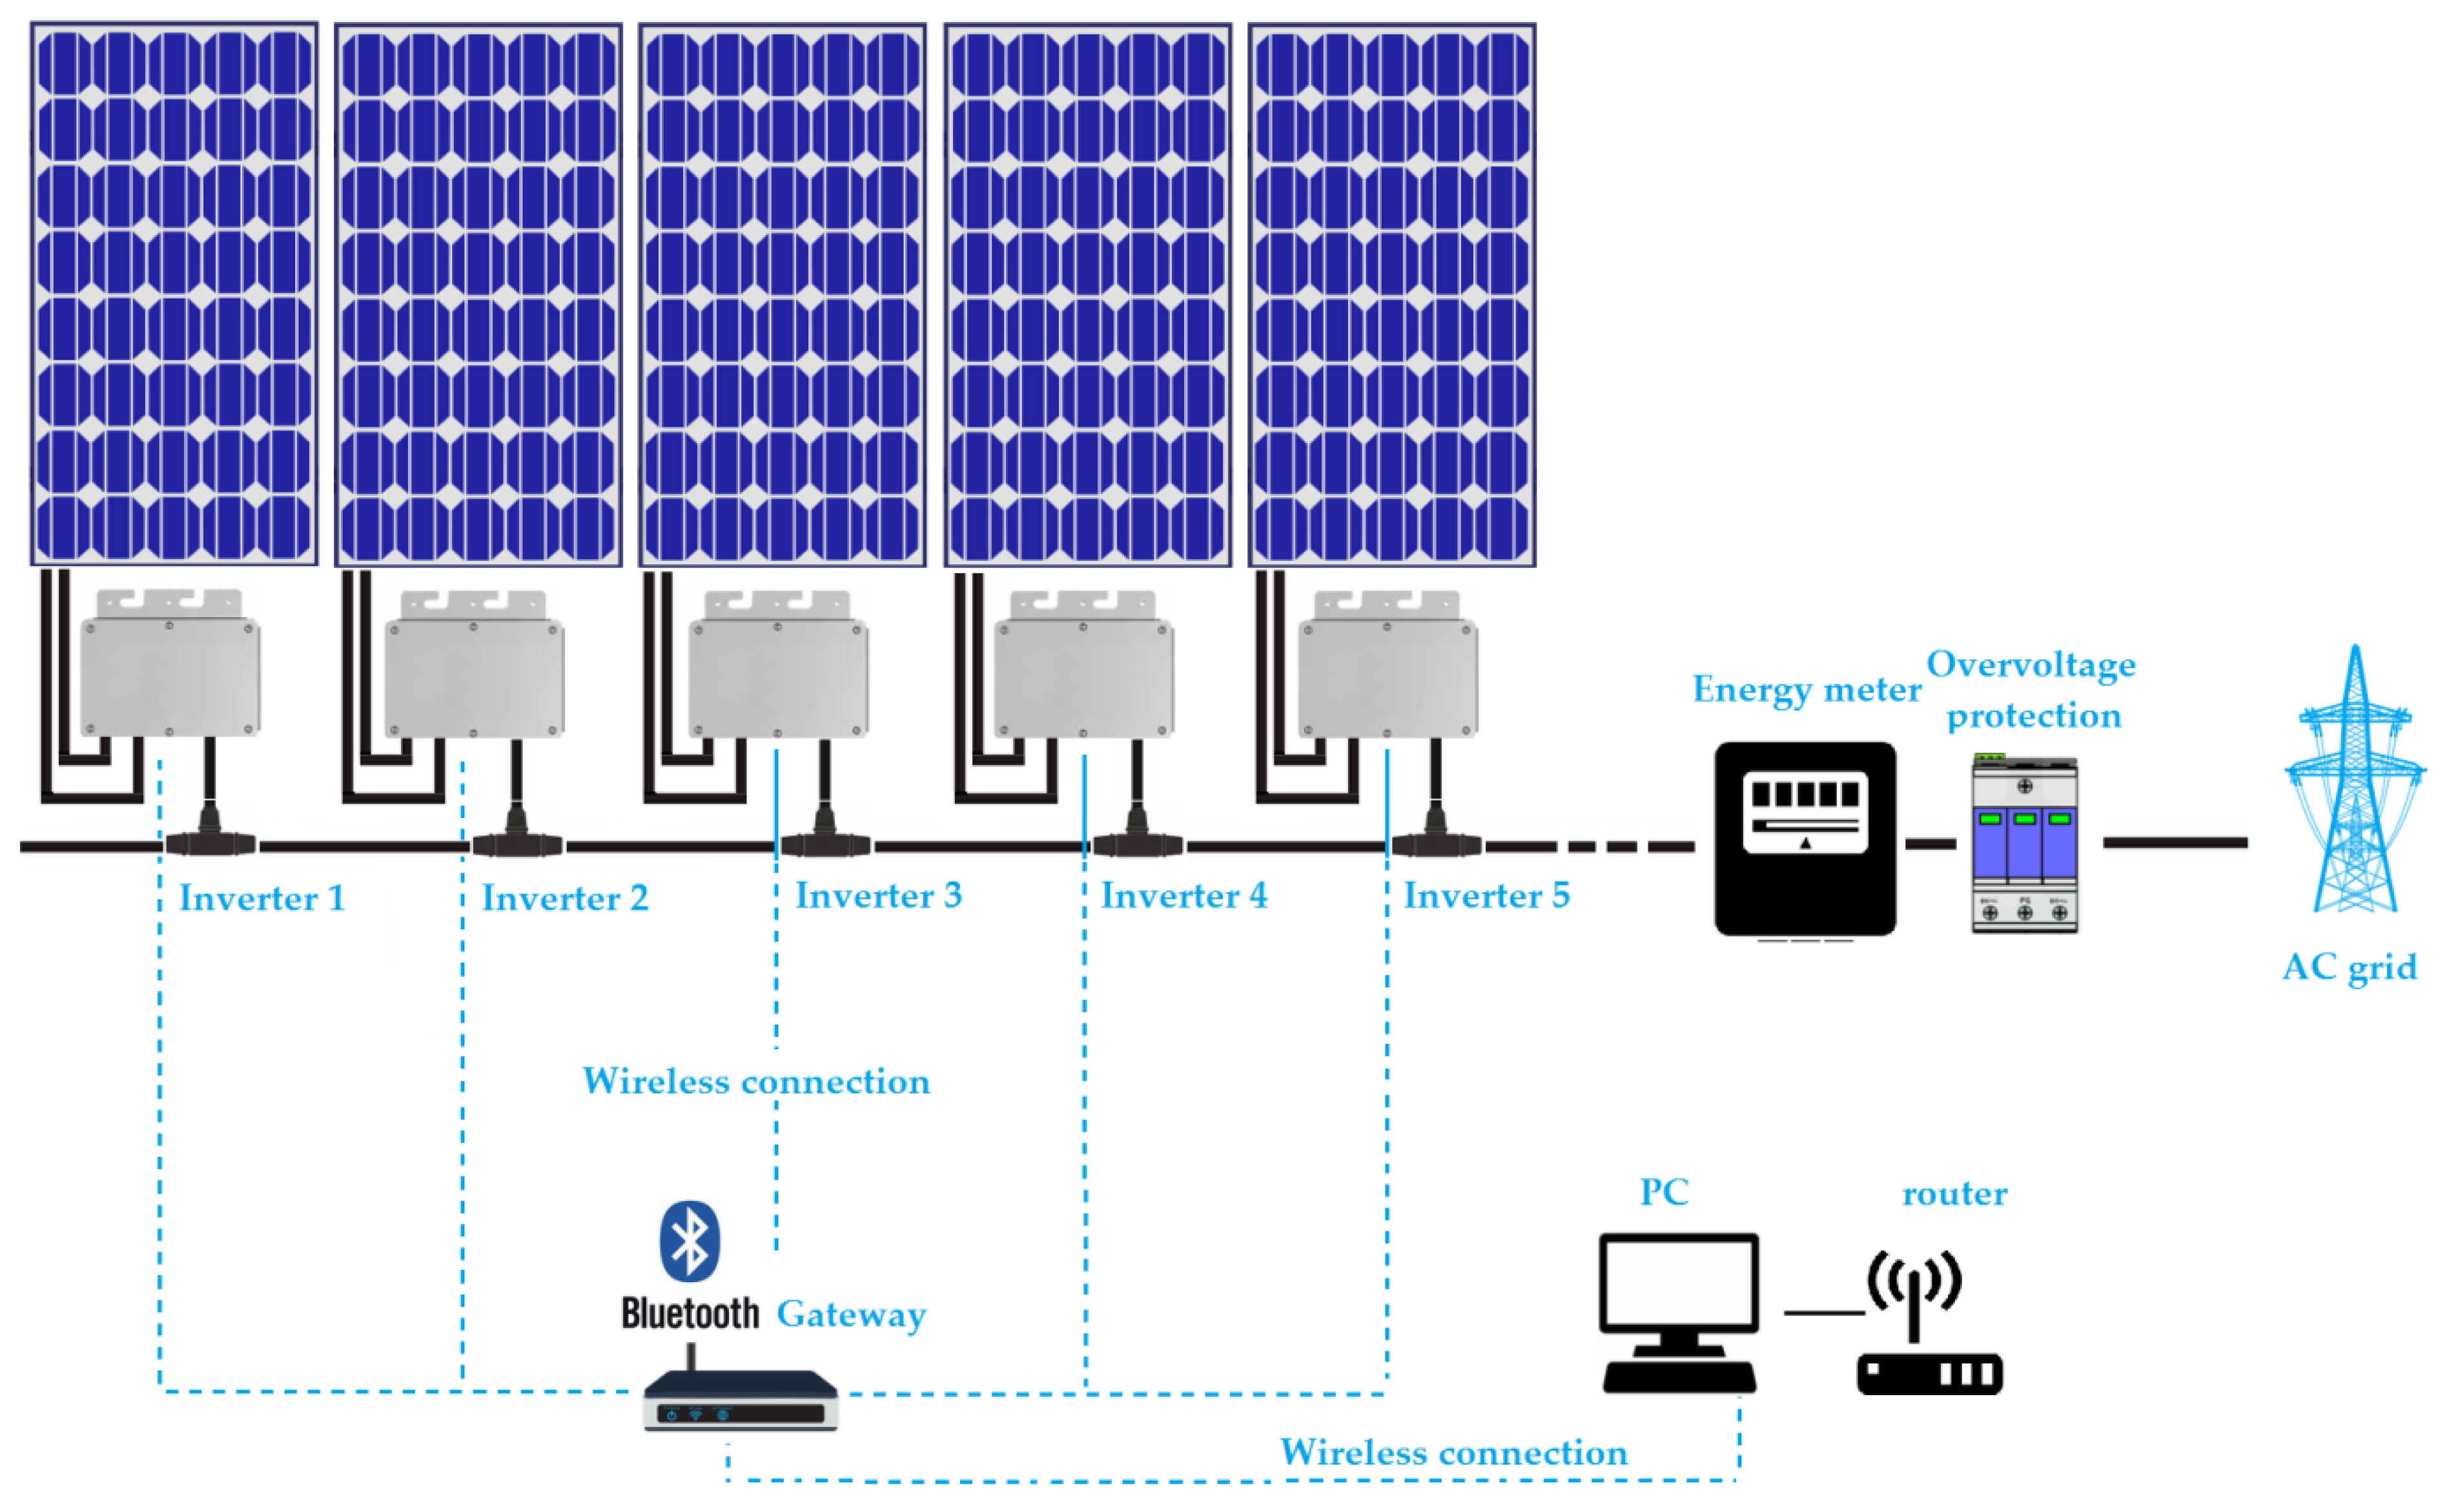
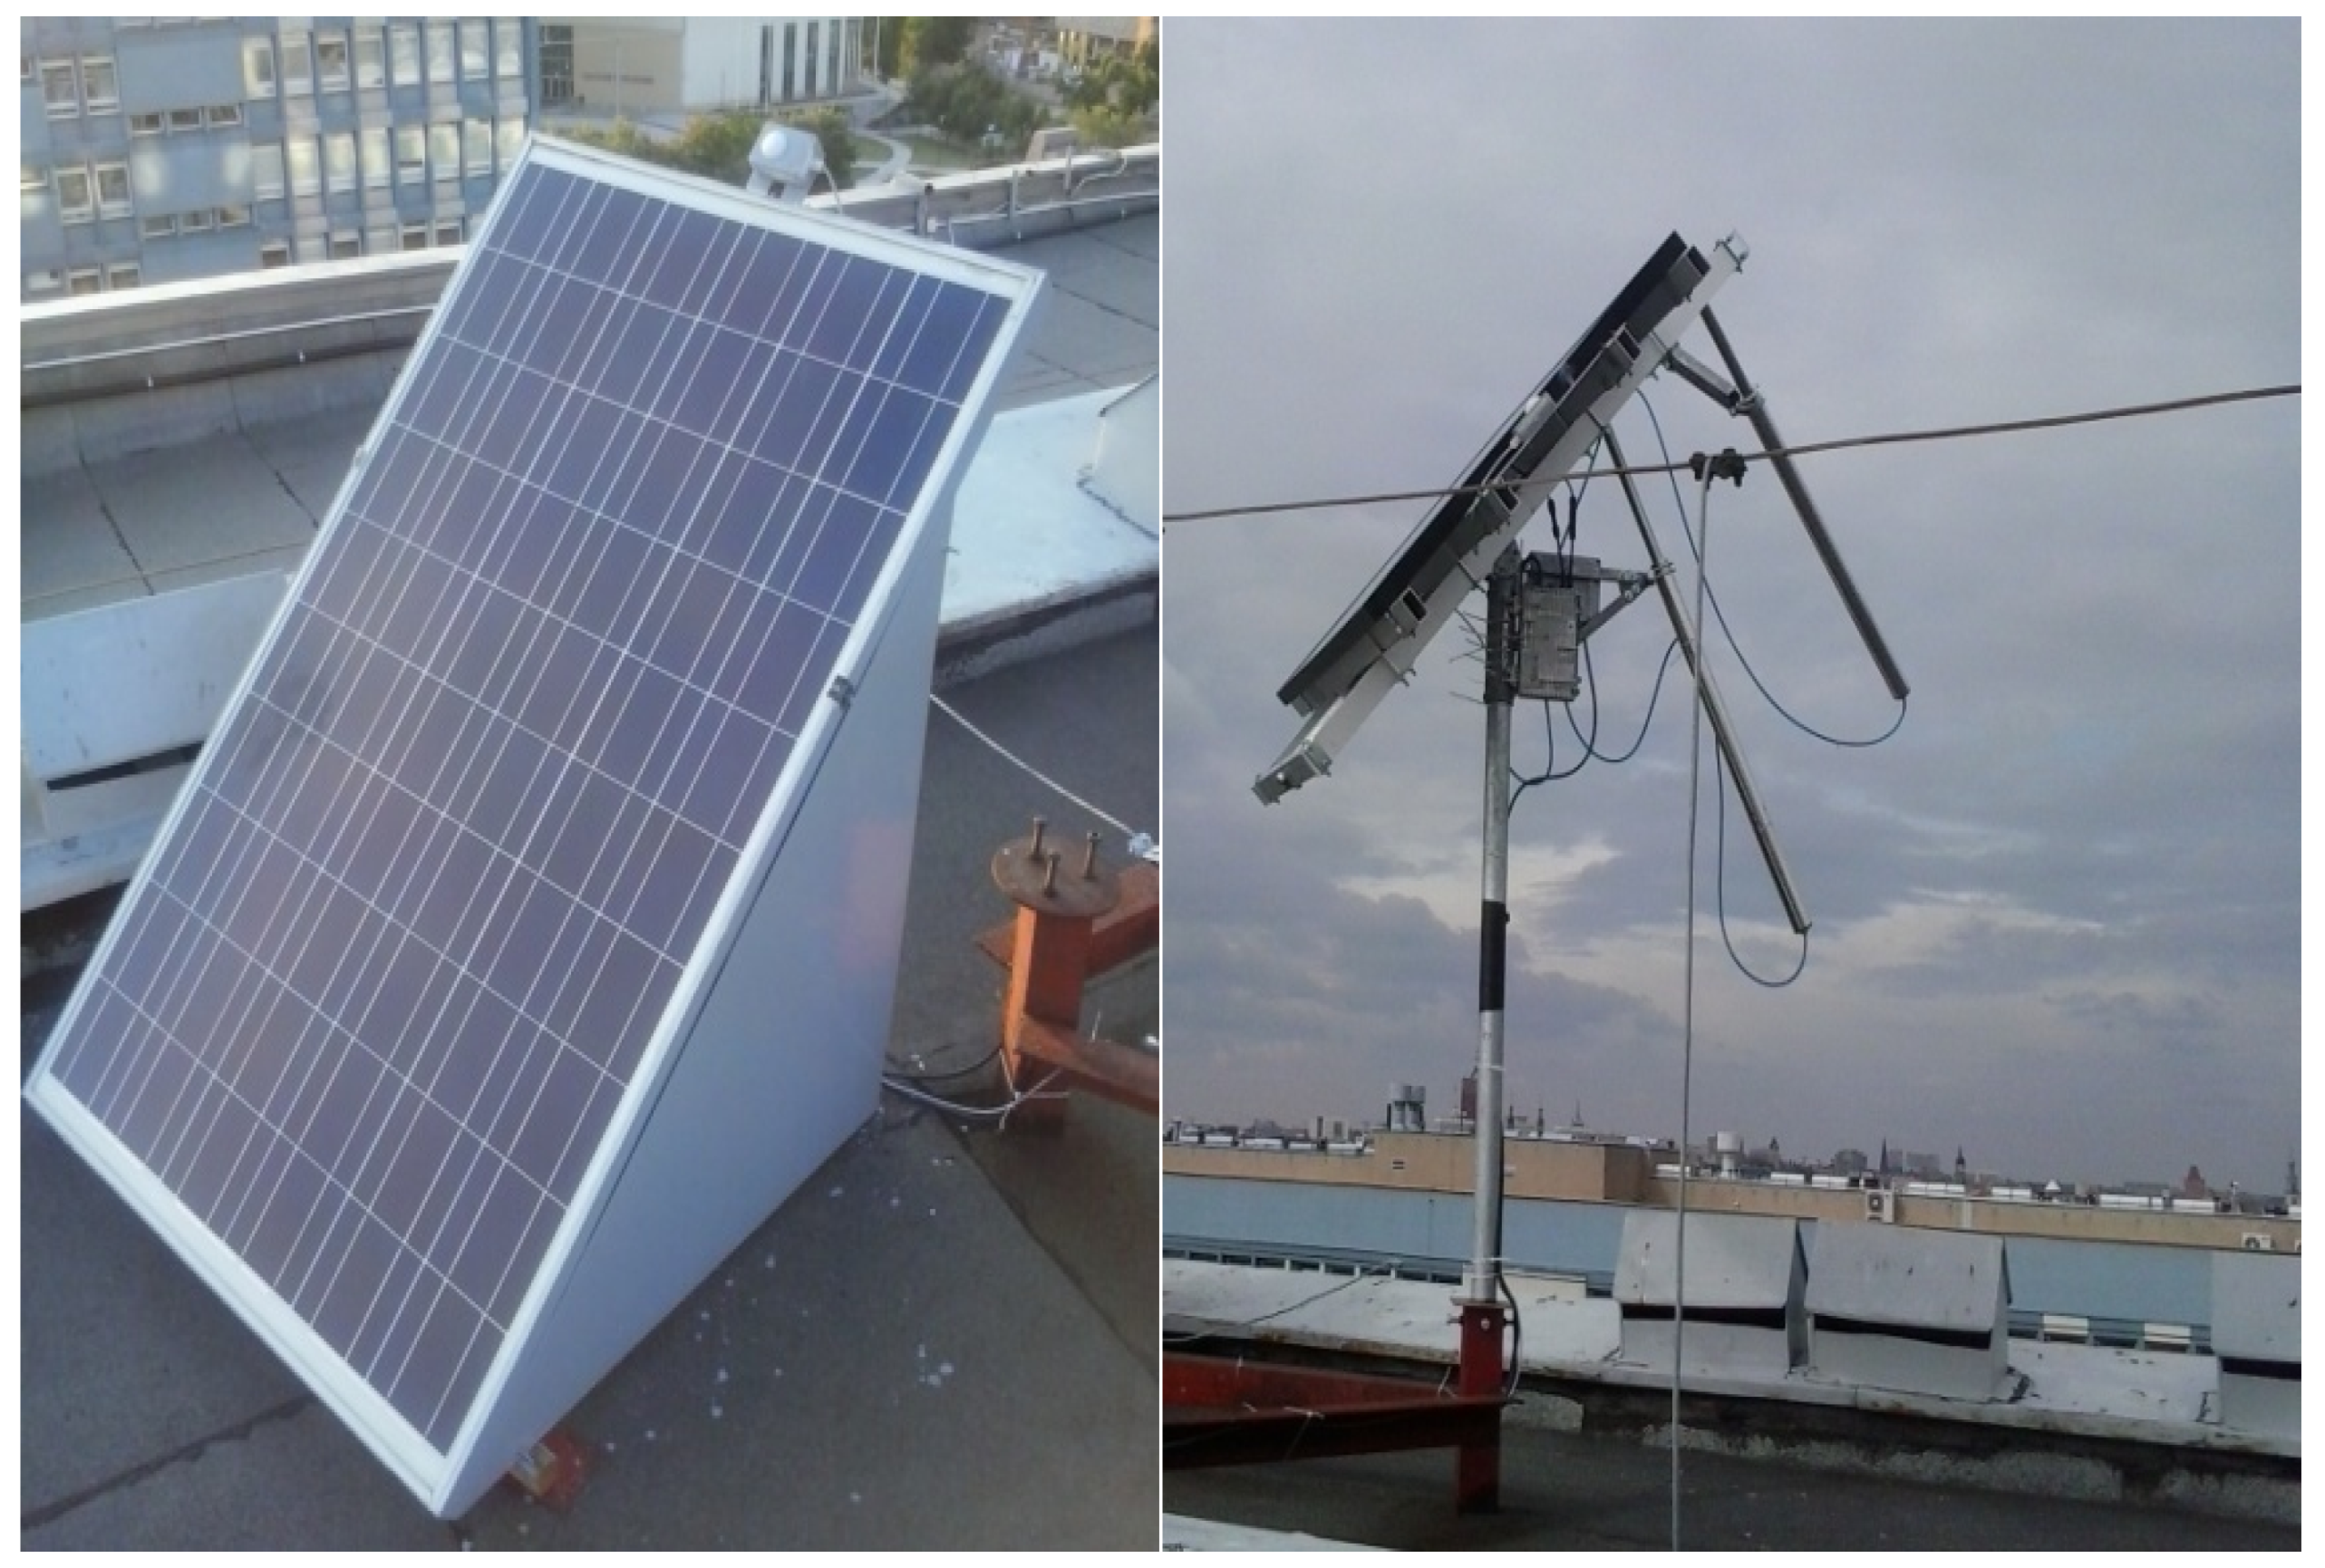
2.1. Fixed Photovoltaic Installation
2.2. Tracking Photovoltaic Installation
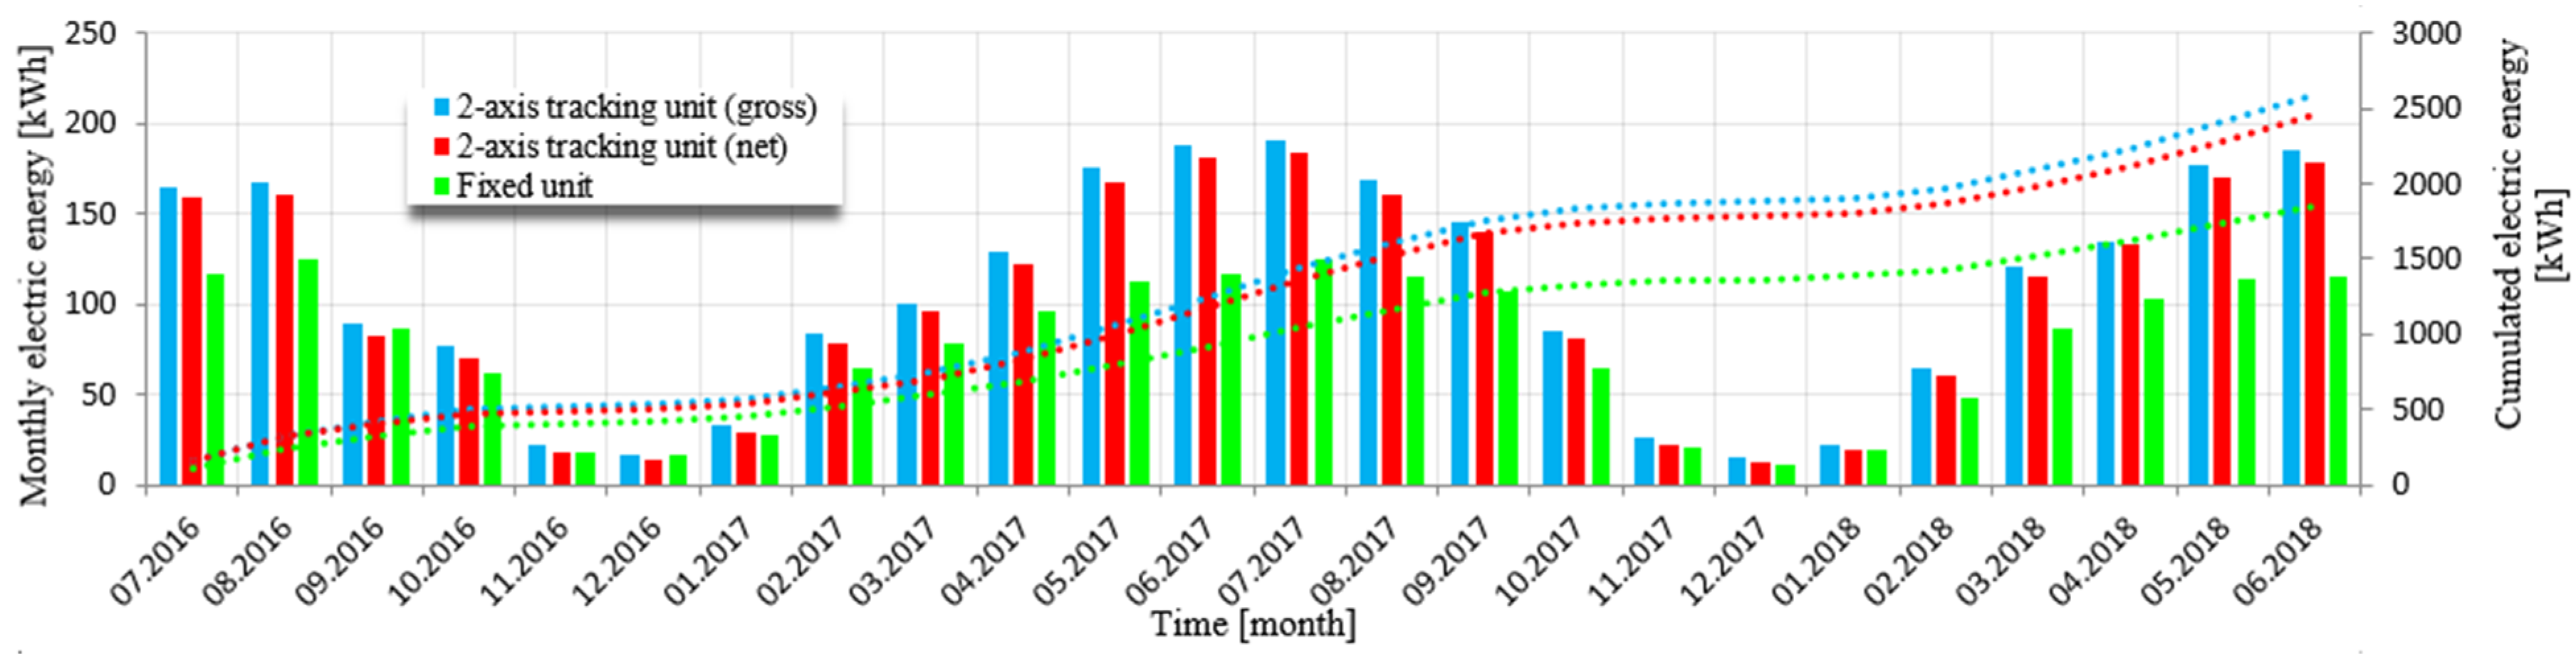
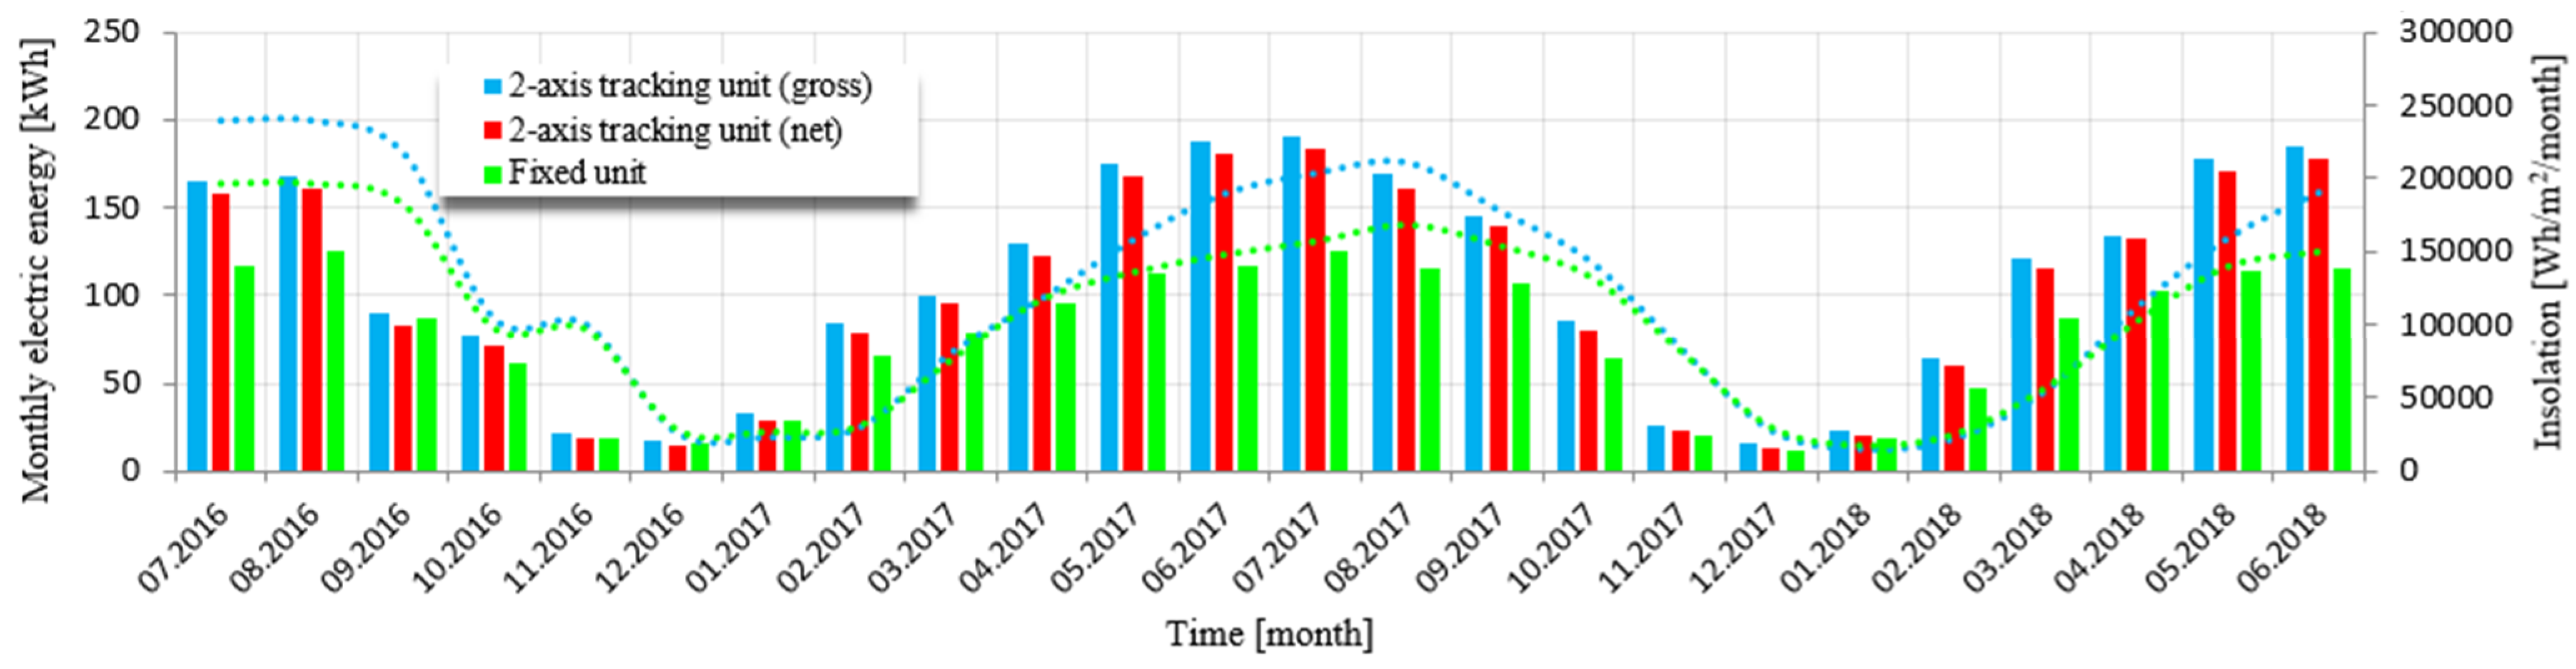
3. Results
4. Discussion and Conclusions
Supplementary Materials
Author Contributions
Funding
Institutional Review Board Statement
Informed Consent Statement
Data Availability Statement
Conflicts of Interest
Nomenclature
| Acronym | Meaning | Units |
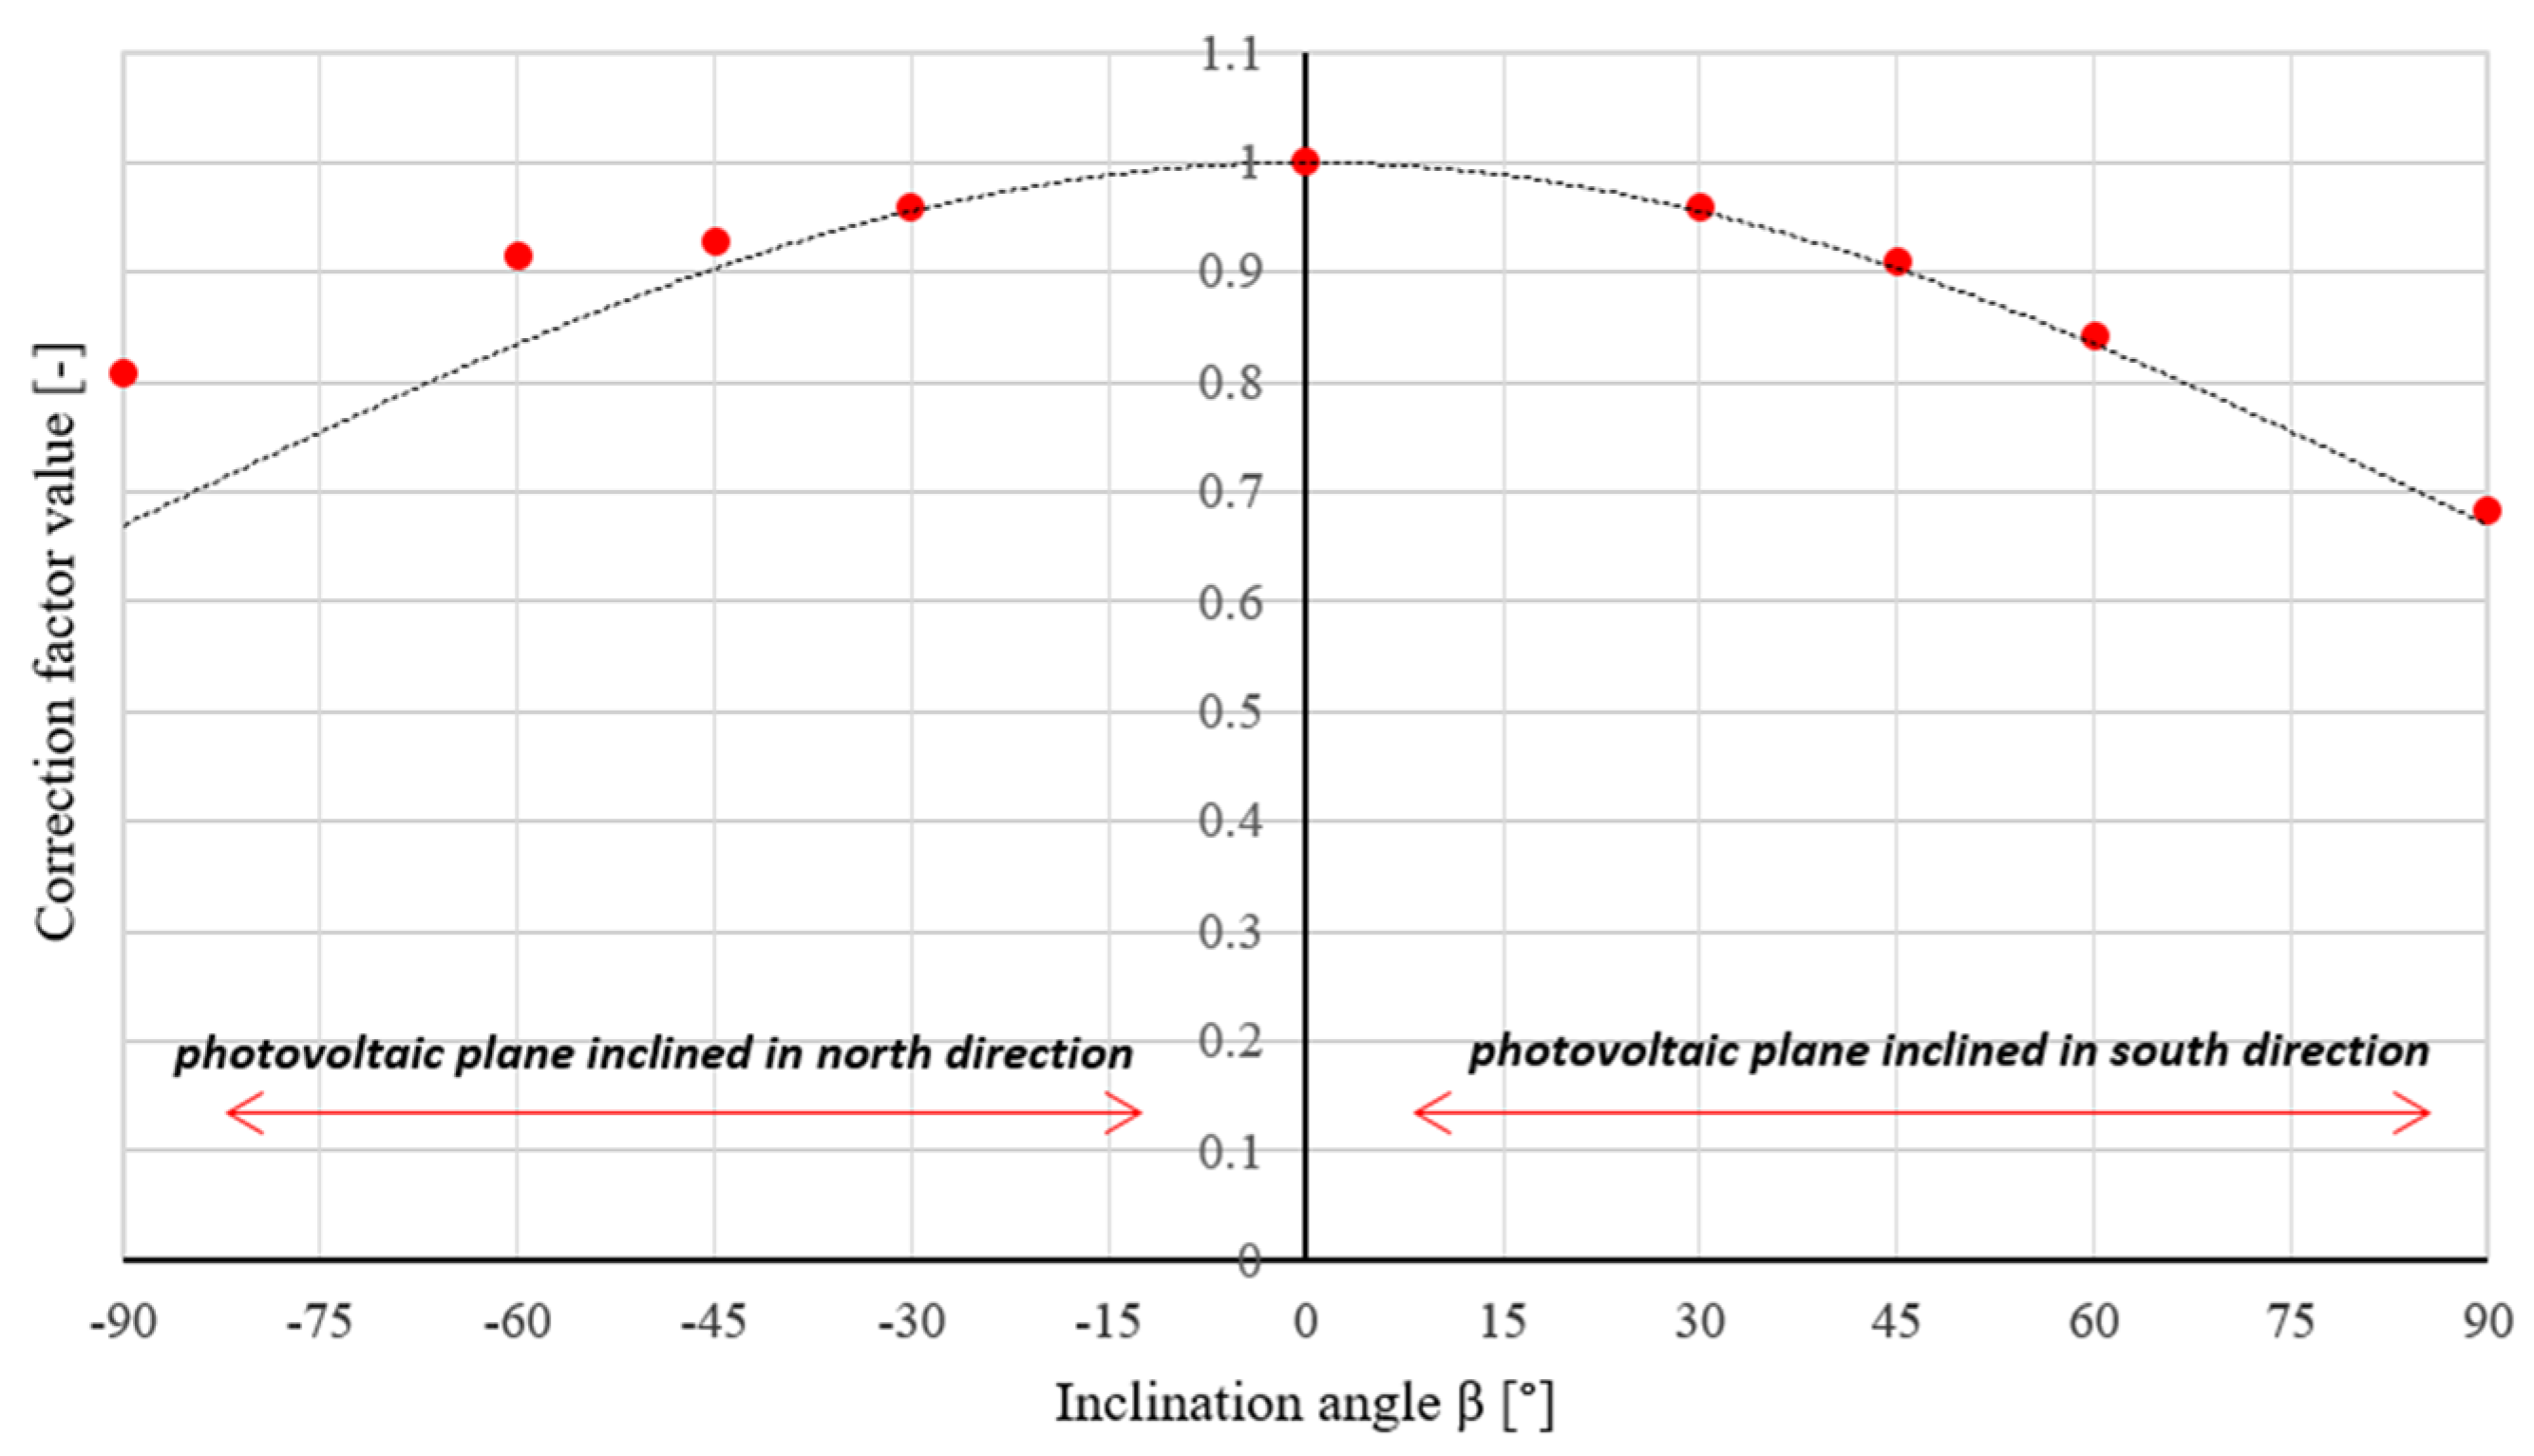
| β | angle of inclination of the photovoltaic module plane to the ground | ° |
| ins_max | the highest annual insolation | Wh·m−2 |
| βopt | optimal inclination angle of the photovoltaic module | ° |
| Gb, Gd | direct and diffuse component of solar radiation for the horizontal plane | W·m−2 |
| Gβ | total solar radiation on the plane inclined at angle β | W·m−2 |
| φ | angle of latitude | ° |
| δ(t) | angle of sun declination | ° |
| ω(t) | hour angle | ° |
| ρo | reflectivity coefficient of the ground | - |
| RMSE | root-mean-square error | - |
| MBE | mean bias error | - |
| Rd | correction factor of the diffuse component of solar radiation | - |
| γ | azimuth angle of the solar receiver | ° |
| p, q | postoptimization adjustment parameters | - |
| M | average measured value of radiation power density on an inclined plane | W·m−2 |
| C | calculated value of radiation power density on an inclined plane | W·m−2 |
| ee_z | cloudiness variable | - |
| ee_dd | length of day | h |
| ee_p | external pressure | Pa |
| ee_tmp | maximum air temperature | °C |
| ee_o | precipitation | mm |
| ee_u | sunshine duration | h |
| ee_w | wind speed | m·s−1 |
| rx,y | Pearson correlation coefficient | - |
| Tamb | recorded ambient temperature | °C |
| Tmodule | temperature of the back side of the photovoltaic module | °C |
| Pmodule | instantaneous electric power | W |
References
- Jastrzębska, G. Ogniwa słoneczne. In Budowa Technologia Zastosowanie; WKiŁ: Warsaw, Poland, 2013. [Google Scholar]
- Hafez, A.; Yousef, A.; Harag, N. Solar tracking systems: Technologies and trackers drive types—A review. Renew. Sustain. Energy Rev. 2018, 91, 754–782. [Google Scholar] [CrossRef]
- Al-Rousan, N.; Isa, N.A.M.; Desa, M.K.M. Advances in solar photovoltaic tracking systems: A review. Renew. Sustain. Energy Rev. 2018, 82, 2548–2569. [Google Scholar] [CrossRef]
- Ramli, M.A.; Twaha, S.; Ishaque, K.; Al-Turki, Y.A. A review on maximum power point tracking for photovoltaic systems with and without shading conditions. Renew. Sustain. Energy Rev. 2017, 67, 144–159. [Google Scholar] [CrossRef]
- Amir, A.; Selvaraj, J.; Rahim, N. Study of the MPP tracking algorithms: Focusing the numerical method techniques. Renew. Sustain. Energy Rev. 2016, 62, 350–371. [Google Scholar] [CrossRef]
- Rimlifegreentech. Available online: www.rimlifegreentech.com (accessed on 10 January 2017).
- Titantracker. Available online: www.titantracker.com (accessed on 19 February 2014).
- Quesada, G.; Guillon, L.; Rousse, D.R.; Mehrtash, M.; Dutil, Y.; Paradis, P.-L. Tracking strategy for photovoltaic solar systems in high latitudes. Energy Convers. Manag. 2015, 103, 147–156. [Google Scholar] [CrossRef]
- Trzmiel, G.; Głuchy, D.; Kurz, D. The impact of shading on the exploitation of photovoltaic installations. Renew. Energy 2020, 153, 480–498. [Google Scholar] [CrossRef]
- Vieira, R.; Guerra, F.; Vale, M.; Araújo, M. Comparative performance analysis between static solar panels and single-axis tracking system on a hot climate region near to the equator. Renew. Sustain. Energy Rev. 2016, 64, 672–681. [Google Scholar] [CrossRef]
- Muhammad, J.Y.; Jimoh, M.T.; Kyari, I.B.; Gele, M.A.; Musa, I. A Review on Solar Tracking System: A Technique of Solar Power Output Enhancement. Eng. Sci. 2019, 4, 1–11. [Google Scholar] [CrossRef]
- Frydrychowicz-Jastrzębska, G.; Bugała, A. Modeling the Distribution of Solar Radiation on a Two-Axis Tracking Plane for Photovoltaic Conversion. Energies 2015, 8, 1025–1041. [Google Scholar] [CrossRef]
- Yousif, H. Comparison study between the performance of tracking and fixed solar photovoltaic systems in Malta. In Proceedings of the PV in Europe from PV Technology to Energy Solutions Conference & Exhibition, ETA-Florence, Rome, Italy, 7–11 October 2002; pp. 1065–1068. [Google Scholar]
- Zsiborács, H.; Baranyai, N.H.; Vincze, A.; Háber, I.; Weihs, P.; Oswald, S.; Gützer, C.; Pintér, G. Changes of Photovoltaic Performance as a Function of Positioning Relative to the Focus Points of a Concentrator PV Module: Case Study. Appl. Sci. 2019, 9, 3392. [Google Scholar] [CrossRef]
- Fathabadi, S. Comparative study between two novel sensorless and sensor based dual-axis solar trackers. Sol. Energy 2016, 138, 67–76. [Google Scholar] [CrossRef]
- Rustu, E.R.; Senturk, A. Performance comparison of a double-axis sun tracking versus fixed PV system. Sol. Energy 2012, 86, 2665–2672. [Google Scholar]
- Nalepa, K.; Neugebauer, M.; Sołowiej, P.; Chmielewski, R. Wykorzystanie mikrokontrolera jednoukładowego do sterowania optymalnym ustawieniem płaszczyzny ogniwa fotowoltaicznego w stosunku do Słońca. Agric. Eng. 2009, 8, 127–132. [Google Scholar]
- Kivrak, S.; Gunduzalp, M.; Dincer, F. Theoretical and experimental performance investigation of a two—Axis solar tracker under the climatic condition of Denizli, Turkey. Prz. Elektrotech. 2012, 2, 332–336. [Google Scholar]
- Serhan, M.; El-Chaar, L. Two axes sun tracking system: Comparison with a fixed system. In Proceedings of the International Conference on Renewable Energies and Power Quality, Granada, Spain, 23–25 March 2010. [Google Scholar]
- Okoye, C.; Abbasoglu, S. Empirical investigation of fixed and dual axis Sun tracking photovoltaic system installations in Turkish Republic of Northern Cyprus. J. Asian Sci. Res. 2013, 3, 440–453. [Google Scholar]
- Safan, Y.M.; Shaaban, S.; Abu El-Sebah, M.I. Performance evaluation of a multi-degree of freedom hybrid controlled dual axis solar tracking system. Sol. Energy 2018, 170, 576–585. [Google Scholar] [CrossRef]
- Chowdhury, M.E.H.; Khandakar, A.; Hossain, B.; Abouhasera, R. A Low-Cost Closed-Loop Solar Tracking System Based on the Sun Position Algorithm. J. Sens. 2019, 2019, 1–11. [Google Scholar] [CrossRef]
- Okoye, C.O.; Bahrami, A.; Atikol, U. Evaluating the solar resource potential on different tracking surfaces in Nigeria. Renew. Sustain. Energy Rev. 2018, 81, 1569–1581. [Google Scholar] [CrossRef]
- El-Sebah, M.I.A. A Novel Simplified intelligent Universal PID Controller. In Proceedings of the Conference on New Paradigms in Electronics & Information Technologies, Alexandria, Egypt, 9–11 October 2011; pp. 1–5. [Google Scholar]
- Zhang, Q.-X.; Yu, H.-Y.; Zhang, Q.-Y.; Zhang, Z.-Y.; Shao, C.-H.; Yang, D. A Solar Automatic Tracking System that Generates Power for Lighting Greenhouses. Energies 2015, 8, 7367–7380. [Google Scholar] [CrossRef]
- Bentaher, H.; Kaich, H.; Ayadi, N.; Ben Hmouda, M.; Maalej, A.; Lemmer, U. A simple tracking system to monitor solar PV panels. Energy Convers. Manag. 2014, 78, 872–875. [Google Scholar] [CrossRef]
- Spencer, D.F. Basic Photovoltaic Principles and Methods; Solar Energy Research Institute: Washington, WA, USA, 1984. [Google Scholar]
- Kais, I. A low cost single—Axis sun tracker system using PIC microcontroller. DJES 2012, 5, 65–78. [Google Scholar]
- Amin, N.; Yung, W.; Sopian, K. Low cost single axis automated sunlight tracker design for higher PV power yield. In Proceedings of the 2007 World Renewable Energy Conference, Taipei, Taiwan, 30 October–1 November 2007; pp. 137–139. [Google Scholar]
- Ponniran, A.; Hashim, A.; Munir, H.A. A design of single axis sun tracking system. In Proceedings of the 2011 5th International Power Engineering and Optimization Conference, Shah Alam, Malaysia, 6–7 June 2011; pp. 107–110. [Google Scholar]
- Fadil, S.; Capar, A.C.; Caglar, K.; Fadıl, S. Two axis solar tracker design and implementation. In Proceedings of the 2013 8th International Conference on Electrical and Electronics Engineering (ELECO), Bursa, Turkey, 28–30 November 2013; pp. 554–557. [Google Scholar]
- Barsoum, N. Fabrication of Dual-Axis Solar Tracking Controller Project. Intell. Control. Autom. 2011, 2, 57–68. [Google Scholar] [CrossRef]
- Ray, S.K.; Bashar, M.A.; Sayed, F.B. Two Ways of Rotating Freedom Solar Tracker by Using ADC of Microcontroller. Glob. J. Res. Eng. 2013, 12. [Google Scholar]
- Mukund, R. Wind and Solar Power Systems: Design, Analysis and Operation; Taylor and Francis: New York, NY, USA, 2006. [Google Scholar]
- Chen, F.; Feng, J. Analogue sun sensor based on the optical nonlinear compensation measuring principle. Meas. Sci. Technol. 2007, 18, 2111–2115. [Google Scholar] [CrossRef]
- Barsoum, N.; Vasant, P. Simplified solar tracking prototype. Glob. J. Technol. Optim. 2010, 1, 38–45. [Google Scholar]
- Lee, C.; Chou, P.; Chiang, C.; Lin, C. Sun tracking systems: A review. Sensors 2009, 9, 3879–3881. [Google Scholar] [CrossRef] [PubMed]
- Berenguel, M.; Rubio, F.; Valverde, A.; Lara, P.; Arahal, M.; Camacho, E.; López, M. An artificial vision-based control system for automatic heliostat positioning offset correction in a central receiver solar power plant. Sol. Energy 2004, 76, 563–575. [Google Scholar] [CrossRef]
- Brisha, A.M. Enhancement of Power Generation for PV Systems Using Dynamic Tracking System. Int. J. Electr. Compon. Energy Convers. 2019, 5, 1–5. [Google Scholar]
- Sumathi, V.; Jayapragash, R.; Bakshi, A.; Akella, P.K. Solar tracking methods to maximize PV system output–A review of the methods adopted in recent decade. Renew. Sustain. Energy Rev. 2017, 74, 130–138. [Google Scholar] [CrossRef]
- Bendib, B.; Belmili, H.; Krim, F. A survey of the most used MPPT methods: Conventional and advanced algorithms applied for photovoltaic systems. Renew. Sustain. Energy Rev. 2015, 45, 637–648. [Google Scholar] [CrossRef]
- Macaulay, J.; Zhou, Z. A Fuzzy Logical-Based Variable Step Size P&O MPPT Algorithm for Photovoltaic System. Energies 2018, 11, 1340. [Google Scholar] [CrossRef]
- Lee, H.-S.; Yun, J.-J. Advanced MPPT Algorithm for Distributed Photovoltaic Systems. Energies 2019, 12, 3576. [Google Scholar] [CrossRef]
- Du, Y.; Yan, K.; Ren, Z.; Xiao, W. Designing Localized MPPT for PV Systems Using Fuzzy-Weighted Extreme Learning Machine. Energies 2018, 11, 2615. [Google Scholar] [CrossRef]
- Enany, M.A.; Farahat, M.A.; Nasr, A. Modeling and evaluation of main maximum power point tracking algorithms for photovoltaics systems. Renew. Sustain. Energy Rev. 2016, 58, 1578–1586. [Google Scholar] [CrossRef]
- Fathabadi, H. Novel high efficient offline sensorless dual-axis solar tracker for using in photovoltaic systems and solar concentrators. Renew. Energy 2016, 95, 485–494. [Google Scholar] [CrossRef]
- Er, Z.; Balcı, E. Dual axis solar angle tracking system without any sensor. J. Energy Syst. 2018, 2, 127–136. [Google Scholar] [CrossRef]
- Ministry of Infrastructure and Development, Climate Database. Available online: http://www.mir.gov.pl (accessed on 2 February 2016).
- PQSTAT. Available online: http://www.pqstat.pl (accessed on 15 February 2015).


| Photovoltaic Module | Value | DC/AC Microinverter | Value | |
|---|---|---|---|---|
| 1 | Maximum power | 200 W | Nominal input power | 240 W |
| 2 | Voltage at power point | 29.64 V | Maximum DC voltage | 44 V |
| 3 | Current at power point | 6.78 A | Minimum DC voltage | 20 V |
| 4 | Open circuit voltage | 35.94 V | Range of MPPT | 23 V…35 V |
| 5 | Short circuit | 7.6 A | Maximum input current | 12 A |
| 6 | Efficiency | 12.61% | Temperature work | −40 °C…85 °C |
| 7 | Power tolerance | +/−3% | Internal protection | IP66 |
| Explanatory Variable | Symbol | Pearson Correlation Coefficient | |
|---|---|---|---|
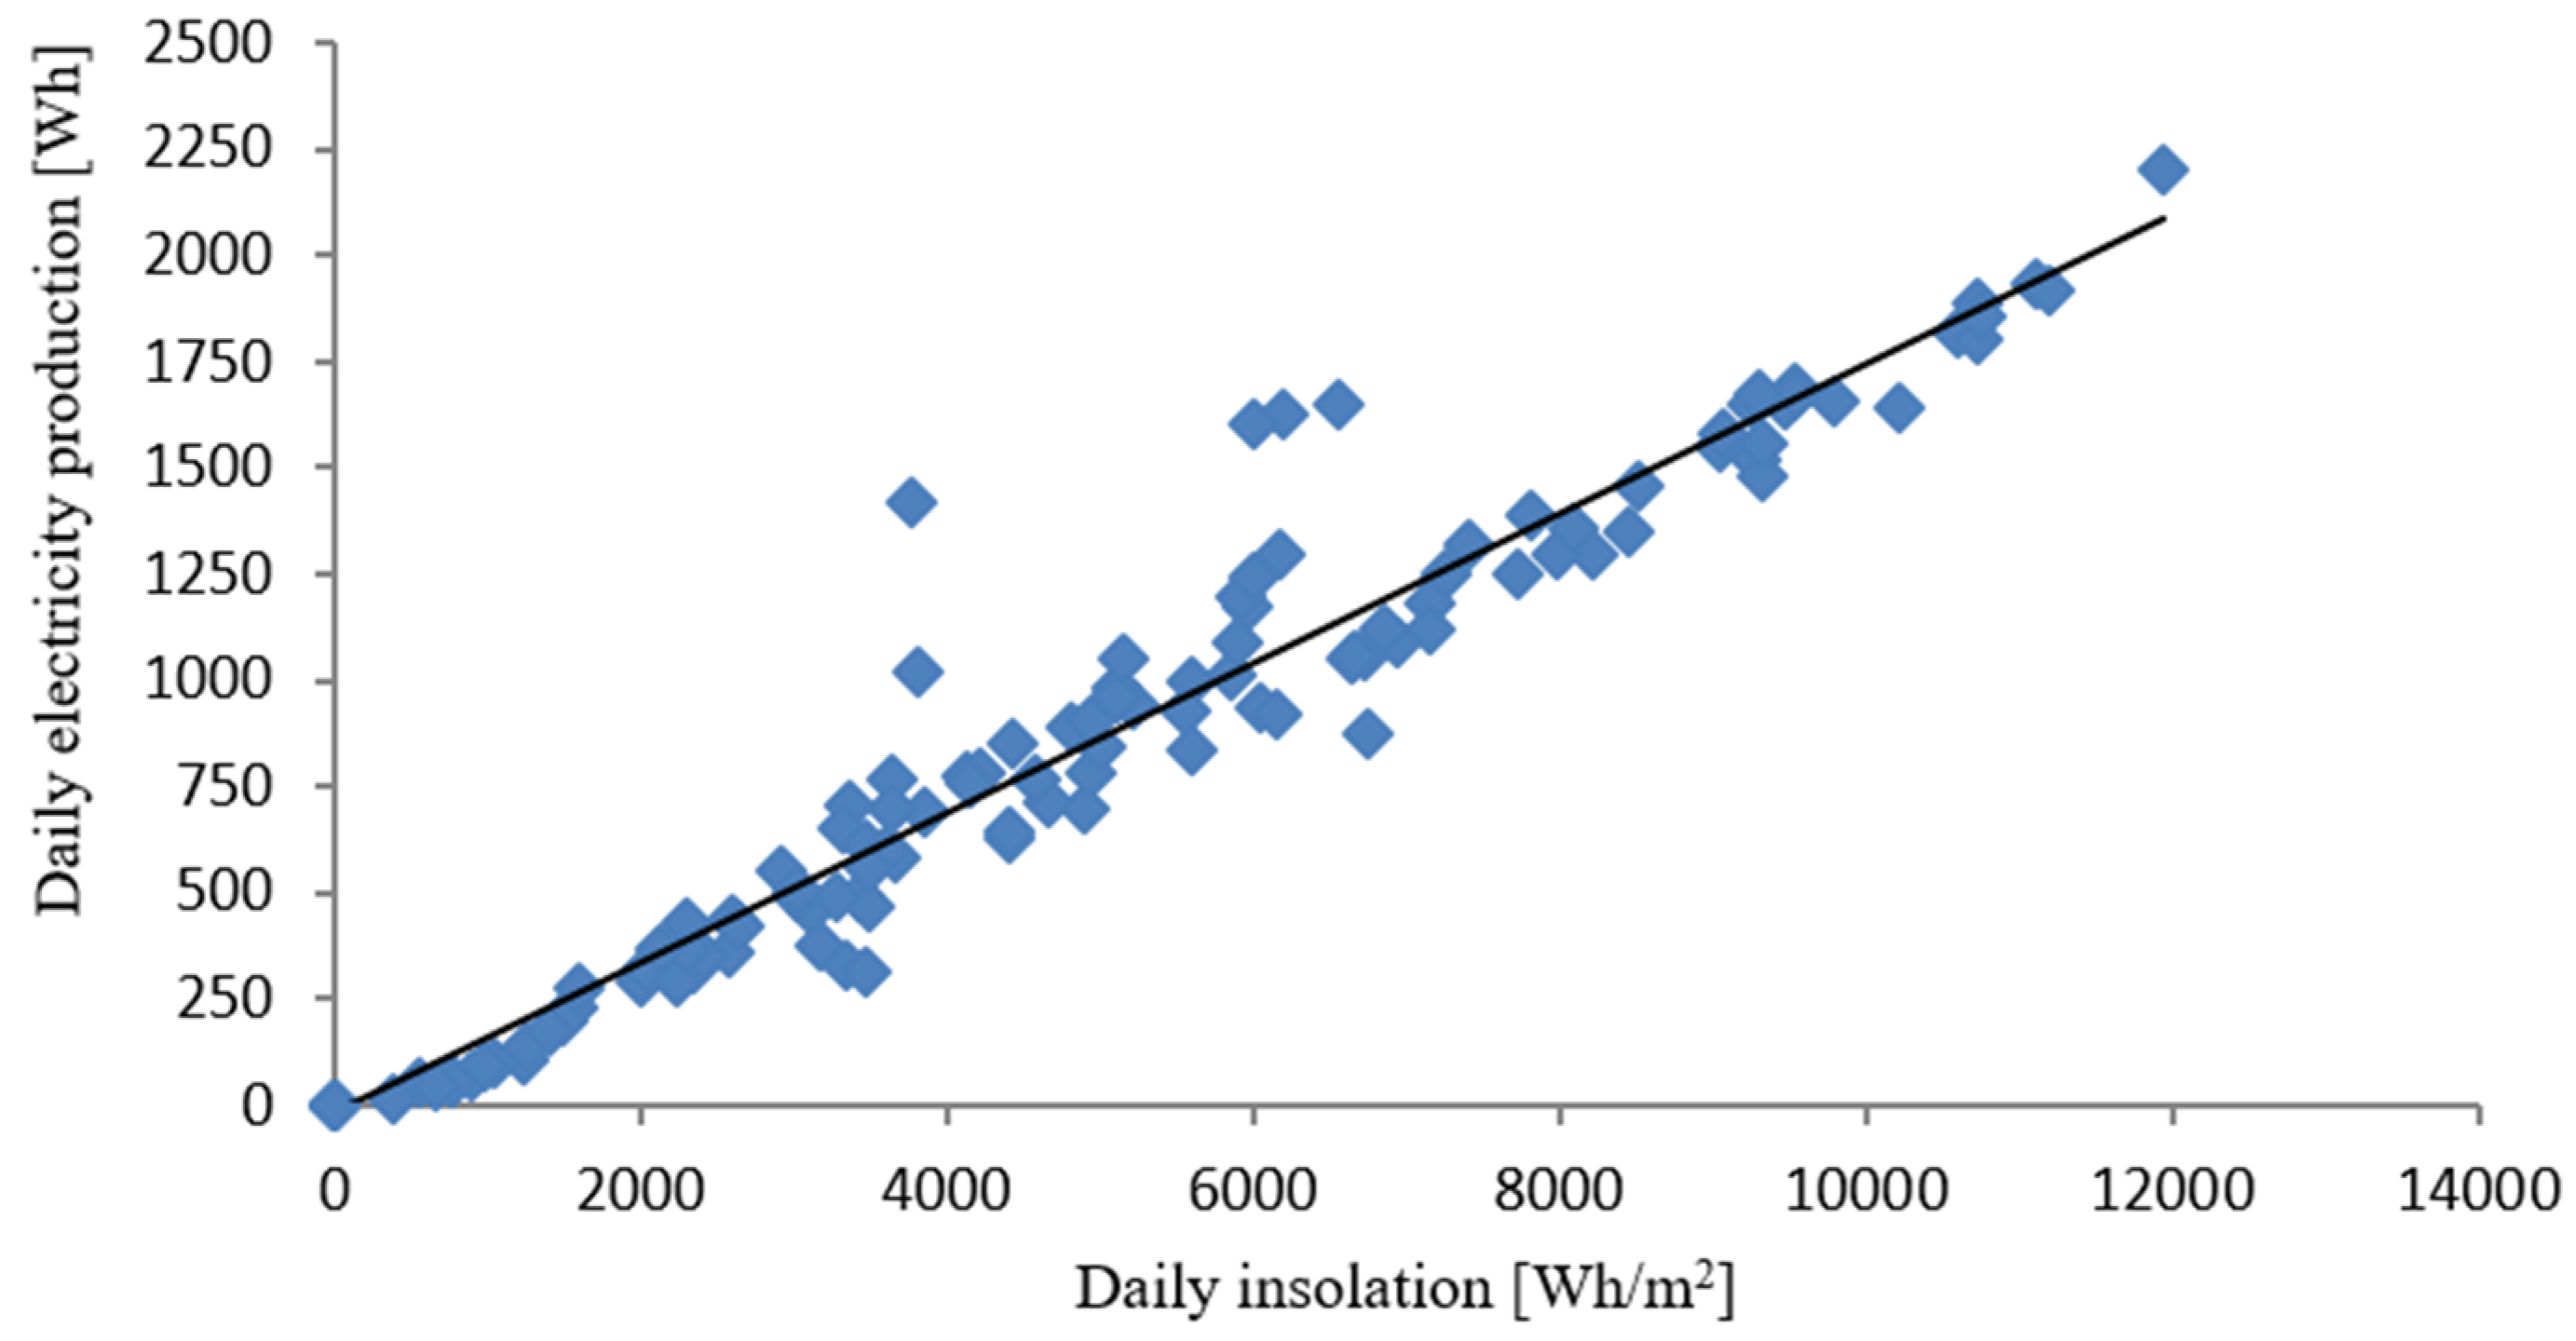
| 1 | Daily insolation | ee_dn | 0.967 |
| 2 | Cloudiness | ee_z | 0.679 |
| 3 | Length of day | ee_dd | 0.202 |
| 4 | Pressure | ee_p | 0.146 |
| 5 | Maximum air temperature | ee_tmp | 0.442 |
| 6 | Precipitation | ee_o | −0.250 |
| 7 | Sunshine duration | ee_u | 0.904 |
| 8 | Wind speed | ee_w | 0.212 |
| Variable | Pearson Correlation Coefficients | |||
|---|---|---|---|---|
| Daily Insolation | Cloudiness | Maximum Air Temperature | Sunshine Duration | |
| daily insolation | 1.000000 | 0.650988 | 0.510682 | 0.924923 |
| cloudiness | 0.650988 | 1.000000 | 0.424817 | 0.652897 |
| maximum air temperature | 0.510682 | 0.424817 | 1.000000 | 0.566304 |
| sunshine duration | 0.924923 | 0.652897 | 0.566304 | 1.000000 |
| E (W/m2) | Tamb (°C) | Tmodule (°C) | Pmodule (W) | Irradiance (W/m2) | Tamb (°C) | Tmodule (°C) | Pmodule (W) | ||
|---|---|---|---|---|---|---|---|---|---|
| 1 | 84.5 | 8.31 | 8.0 | 13.30 | 21 | 442.5 | 7.35 | 34.0 | 86.83 |
| 2 | 109.4 | 10.26 | 11.9 | 17.24 | 22 | 456.3 | 6.05 | 12.7 | 84.21 |
| 3 | 113.1 | 2.52 | 3.8 | 19.35 | 23 | 480.6 | 15.90 | 36.0 | 86.40 |
| 4 | 120.5 | 10.35 | 11.8 | 19.20 | 24 | 481.8 | 13.70 | 40.2 | 95.17 |
| 5 | 154.8 | 21.01 | 34.7 | 25.05 | 25 | 570.5 | 19.15 | 34.8 | 116.32 |
| 6 | 172.1 | 2.06 | 7.4 | 24.59 | 26 | 587.1 | 3.36 | 17.3 | 108.85 |
| 7 | 173.9 | 2.39 | 6.6 | 32.51 | 27 | 594.4 | 27.00 | 46.0 | 99.48 |
| 8 | 195.3 | 7.79 | 9.3 | 42.29 | 28 | 659.9 | 18.77 | 38.3 | 121.89 |
| 9 | 233.7 | 8.47 | 13.5 | 44.41 | 29 | 727.7 | 23.48 | 35.4 | 133.97 |
| 10 | 269.7 | 4.36 | 14.6 | 43.84 | 30 | 774.9 | 25.77 | 36.1 | 125.15 |
| 11 | 281.8 | 18.90 | 39.7 | 54.86 | 31 | 781.5 | 11.06 | 22.7 | 151.83 |
| 12 | 307.8 | 7.85 | 12.0 | 56.18 | 32 | 852.7 | 23.09 | 43.6 | 152.24 |
| 13 | 316.5 | 10.76 | 13.8 | 74.21 | 33 | 889.7 | 6.70 | 20.9 | 164.94 |
| 14 | 346.4 | 25.85 | 38.3 | 61.16 | 34 | 915.5 | 26.77 | 50.9 | 152.69 |
| 15 | 355.8 | 14.68 | 23.2 | 63.64 | 35 | 921.1 | 25.00 | 46.6 | 163.16 |
| 16 | 377.5 | 25.34 | 34.2 | 79.40 | 36 | 958.0 | 11.43 | 29.8 | 182.23 |
| 17 | 378.4 | 25.82 | 36.9 | 64.44 | 37 | 1083.4 | 25.88 | 42.2 | 192.98 |
| 18 | 406.8 | 26.39 | 31.5 | 60.31 | 38 | 1128.0 | 13.65 | 35.2 | 202.02 |
| 19 | 440.2 | 19.81 | 37.9 | 88.01 | 39 | 1129.1 | 28.03 | 44.2 | 203.91 |
| 20 | 440.4 | 7.47 | 18.9 | 91.87 | 40 | 1137.7 | 24.75 | 46.3 | 215.45 |
| Variable | E (W/m2) | Pmodule (W) | Tmodule (°C) |
|---|---|---|---|
| E (W/m2) | 1.000000 | 0.857797 | 0.453646 |
| Pmodule (W) | 0.857797 | 1.000000 | 0.498896 |
| Tmodule (°C) | 0.453646 | 0.498896 | 1.000000 |
| Month of the Year | Tracking System Gross Electricity (kWh) | Tracking System Net Electricity (kWh) | Fixed System (kWh) | Gross Increase in Electricity (%) | Net Increase in Electricity [%] |
|---|---|---|---|---|---|
| 07.2016 | 164.8 | 158.5 | 116.15 | 41.89 | 36.46 |
| 08.2016 | 167.2 | 160.3 | 124.75 | 34.03 | 28.5 |
| 09.2016 | 90 | 83.1 | 87 | 3.45 | 4.7 |
| 10.2016 | 76.8 | 70.9 | 61.4 | 25.08 | 15.5 |
| 11.2016 | 22.3 | 18.4 | 18.85 | 18.30 | 2.4 |
| 12.2016 | 17.5 | 14.6 | 16.45 | 6.38 | 12.7 |
| 01.2017 | 32.8 | 29.1 | 28.4 | 15.49 | 2.5 |
| 02.2017 | 84.4 | 78.4 | 65.15 | 29.55 | 20.3 |
| 03.2017 | 102.3 | 96.1 | 79.1 | 29.33 | 21.5 |
| 04.2017 | 129.2 | 121.8 | 96.1 | 34.39 | 26.7 |
| 05.2017 | 175.25 | 167.8 | 112.1 | 56.33 | 49.7 |
| 06.2017 | 188.45 | 181.1 | 117.35 | 60.59 | 54.3 |
| Annual gain (%) | gross | 35.56 | Net | 27.88 | |
| Month of the Year | Tracking System Gross Electricity (kWh) | Tracking System Net Electricity (kWh) | Fixed System (kWh) | Gross Increase in Electricity (%) | Net Increase in Electricity (%) |
|---|---|---|---|---|---|
| 07.2017 | 190.75 | 183.9 | 124.95 | 52.66 | 47.2 |
| 08.2017 | 168.7 | 161.1 | 114.9 | 46.82 | 40.2 |
| 09.2017 | 145.75 | 139.5 | 107.15 | 36.02 | 30.2 |
| 10.2017 | 85.7 | 80.6 | 64.1 | 33.70 | 25.7 |
| 11.2017 | 26.15 | 22.9 | 20.55 | 27.25 | 11.4 |
| 12.2017 | 15.7 | 12.9 | 12.05 | 30.29 | 7.1 |
| 01.2018 | 23 | 19.9 | 19.05 | 20.73 | 4.5 |
| 02.2018 | 64.7 | 60.1 | 47.75 | 35.50 | 25.9 |
| 03.2018 | 121.45 | 114.7 | 86.65 | 40.16 | 32.4 |
| 04.2018 | 139.25 | 132.6 | 102.9 | 35.33 | 28.9 |
| 05.2018 | 177.6 | 170.2 | 113.4 | 56.61 | 50.1 |
| 06.2018 | 185.25 | 177.9 | 115.6 | 60.25 | 53.9 |
| Annual gain (%) | gross | 44.66 | Net | 37.38 | |
Publisher’s Note: MDPI stays neutral with regard to jurisdictional claims in published maps and institutional affiliations. |
© 2021 by the authors. Licensee MDPI, Basel, Switzerland. This article is an open access article distributed under the terms and conditions of the Creative Commons Attribution (CC BY) license (https://creativecommons.org/licenses/by/4.0/).
Share and Cite
Frydrychowicz-Jastrzębska, G.; Bugała, A. Solar Tracking System with New Hybrid Control in Energy Production Optimization from Photovoltaic Conversion for Polish Climatic Conditions. Energies 2021, 14, 2938. https://doi.org/10.3390/en14102938
Frydrychowicz-Jastrzębska G, Bugała A. Solar Tracking System with New Hybrid Control in Energy Production Optimization from Photovoltaic Conversion for Polish Climatic Conditions. Energies. 2021; 14(10):2938. https://doi.org/10.3390/en14102938
Chicago/Turabian StyleFrydrychowicz-Jastrzębska, Grażyna, and Artur Bugała. 2021. "Solar Tracking System with New Hybrid Control in Energy Production Optimization from Photovoltaic Conversion for Polish Climatic Conditions" Energies 14, no. 10: 2938. https://doi.org/10.3390/en14102938
APA StyleFrydrychowicz-Jastrzębska, G., & Bugała, A. (2021). Solar Tracking System with New Hybrid Control in Energy Production Optimization from Photovoltaic Conversion for Polish Climatic Conditions. Energies, 14(10), 2938. https://doi.org/10.3390/en14102938