Article

Optimal Design on Fossil-to-Renewable Energy Transition of Regional Integrated Energy Systems under CO2 Emission Abatement Control: A Case Study in Dalian, China

1
Key Laboratory of Ocean Energy Utilization and Energy Conservation of Ministry of Education, Dalian University of Technology, Dalian 116024, China
2
School of Economics and Management, China University of Geosciences, Wuhan 430074, China
*
Author to whom correspondence should be addressed.
Energies 2021, 14(10), 2879; https://doi.org/10.3390/en14102879
Submission received: 14 April 2021 / Revised: 3 May 2021 / Accepted: 7 May 2021 / Published: 17 May 2021
(This article belongs to the Special Issue Energy Policy for a Sustainable Economic Growth)

Abstract

:
Optimal design of regional integrated energy systems (RIES) offers great potential for better managing energy sources, lower costs and reducing environmental impact. To capture the transition process from fossil fuel to renewable energy, a flexible RIES, including the traditional energy system (TES) based on the coal and biomass based distributed energy system (BDES), was designed to meet a regional multiple energy demand. In this paper, we analyze multiple scenarios based on a new rural community in Dalian (China) to capture the relationship among the energy supply cost, increased share of biomass, system configuration transformation, and renewable subsidy according to regional CO2 emission abatement control targets. A mixed integer linear programming (MILP) model was developed to find the optimal solutions. The results indicated that a 40.58% increase in the share of biomass in the RIES was the most cost-effective way as compared to the separate TES and BDES. Based on the RIES with minimal cost, by setting a CO2 emission reduction control within 40%, the RIES could ensure a competitive total annual cost as compared to the TES. In addition, when the reduction control exceeds 40%, a subsidy of 53.83 to 261.26 RMB/t of biomass would be needed to cover the extra cost to further increase the share of biomass resource and decrease the CO2 emission.

1. Introduction

The increasing greenhouse gas emissions and declining fossil fuel reserves have highlighted the need for a sustainable energy transition. Currently, a majority of the global final energy consumption is still provided by carbon-intensive fossil fuels [1], while less than 20% is provided by renewable energy sources [2]. Compared with fossil-fired TESs, uncompetitive cost and insufficient policy support hinder the increasingly uptake of most of renewable energy technologies, especially in the heating and cooling sector [3,4]. Therefore, the transition from fossil fuels to renewable energy is not a one-step process. Both optimal integration of various energy resources and technologies and effective renewable policies are conductive to reduce the investment of renewable energy and achieve low carbon development.
The current studies on renewable energy transition are mainly focused on national or regional level energy planning and low-carbon policy making [5,6,7,8]. This transition planning is usually lacking in feasibility and enforceability when applied to specific areas. In addition, renewable energy transition triggering huge investment and a pathway with lower costs has not been solved in the current studies [9]. Energy resources replacement, energy system transition, transition cost and energy demand need to be considered when formulating a specific energy transition plan. To facilitate renewable energy transition and reduce investment cost, the regional integrated energy system (RIES) was proposed to dispatch various energy sources, integrates various energy systems, and couples different energy terminals on the demand side [10,11,12]. The current studies on RIES design are mainly focused on the integration of multiple renewable energy and technologies. For example, Barun et al. [13] conducted techno-economic and environmental assessment of a hybrid solar, wind, biogas with vanadium redox flow battery-based system in a remote Island in Bangladesh. A life cycle assessment methodology was proposed by Salim and Reddy [14] to assess the environmental externalities of an integrated energy system including solar PV systems, a CHP (Combined heat and power) plant and centrifugal chillers in a large university campus in Arizona, United States. A sequential LP algorithm was proposed and developed by Vaccari et al. [15] for economic optimization of hybrid renewable energy systems combining photovoltaic arrays, wind turbine, biomass fuel generators, with back-up units.
In terms of fossil-to-renewable energy transition, numerous renewable energy resources and low-carbon technologies could be used to substitute fossil energy. For example, studies on solar energy [16,17], wind energy [18,19], marine energy [20,21], hydropower energy [22,23,24], and biomass energy [25,26,27,28,29]. However, solar and wind energy highly depend on weather conditions, while hydropower and marine energy generate energy with geographical restrictions [30]. Compared with other renewable sources, biomass is a cheap, high stable, and sufficiently available fuel, accounting for 10–14% of global primary energy supply [31], and thus has become an attractive option to substitute fossil fuels. The carbon neutral circular framework showed that utilization of biomass energy as an alternative for traditional fossil fuels results in reducing CO2 emissions [32]. Biomass distributed energy systems (BDESs) are proven to be efficient, highly flexible, and eco-friendly ways to utilize biomass resources, which are recognized to be a beneficial alternative to centralized TESs [33]. BDESs can be used in small (<1 MW), medium (1–10 MW), and large scale (>10 MW) [34,35], but face impediments to large-scale centralized deployment as biomass straw is a dispersed fuel with relatively low energy density and high transportation costs as compared to fossil fuels (e.g., coal, oil and gas) [36,37]. Biomass resources (e.g., straw) can be transformed into multiple forms of high-quality energy like gaseous fuel, electricity, heating, cooling to meet the diverse energy demands of different users by BDESs. In China, the annual output of biomass straw is approximately 800 million tons, accounting for almost 50% of the total biomass resources [38]. However, the utilization ratio of straw is only 30%, and biomass straw after treatment only accounted for 2.6% [39]. Biomass are plentiful in rural areas. In recent years, China’s rapid urbanization and economic growth has led to the construction of rural communities. At present, more than 30% of rural areas have carried out new rural community construction [40], and more are being constructed. Investment in biomass-related technologies has broad market appeal and helps in the utilization of local biomass resources [41].
Although optimal design of BDES can facilitate cost reduction to a certain extent, they are far from enough to achieve a competitive cost as compared to the TESs. The profit-driven energy supply companies are playing a key role in driving renewable technologies deployment, and they will not take the initiative to deploy them. The current TESs will not be completely replaced in the short term due to their higher economic benefits and their ability to provide a stable energy supply. A successful transition from TESs to renewables is a step-by-step progress, and adaptive energy portfolio policies should be formulated to promote sustainable development and mitigate CO2 emission. Command-and-control policies and market-based policies are two common environmental ways to promote renewable capacity expansion and reduce emission reduction [42]. Mandatory emission control policies can ensure that the emissions are within specific limits [43], while market-based policies (e.g., renewable subsidies) can motivate the energy supply companies to innovate [44]. However, policy adoption has different effects on countries with different income levels. The share of renewable energy utilization is relatively high in high income European countries, but dismal in low-and middle-income countries [2,45]. Therefore, by optimizing the design of portfolio environmental policies that consider the current status of energy utilization, available renewable resources, cost competitiveness, and multiple energy demands to adapt to regional economic development level is the key to facilitate the transition to a more sustainable energy system.
Currently, many researchers have conducted tech-economic analysis and optimization of BDESs. However, the BDESs are still in a pilot-scale demonstration as the technologies are still not economically competitive with fossil-fired TESs. Despite the maximum CO2 emission reduction benefits can be achieved, high technology costs remain the biggest obstacle to reach a high level of biomass penetration rate. How to determine the most practical and cost-competitive rote to progress on the fossil-to-biomass energy transition is the focus of this paper. A successful transition from TESs, based on fossil fuels to energy systems based on biomass is a step-by-step process, which requires effective system integration and suitable energy portfolio policies. Based on the studies mentioned above, the current study aimed at designing new RIESs combining TES with BDES, clarifying the suitable CO2 reduction and subsidy policies that utilize fossil fuels and biomass in a flexible and affordable manner before reaching the large-scale commercialization stage.
The main contributions of this paper are:
The TES and BDES were integrated into a RIES to study the energy supply transition process under different levels of CO2 emission abatement control policies.
A reasonable trade-off between costs and the CO2 emission reduction policies of RIESs can be achieved by using mixed integer linear optimization.
A case study in Dalian (China) was conducted to capture the relationship among CO2 emission abatement control, energy supply cost, local fiscal subsidy and the increased share of biomass.
The remainder of this paper is organized as follows: Section 2 introduces the proposed RIES system. Section 3 constructs the mathematical model and its corresponding solution process. The numerical examples and optimization results are discussed in Section 4. Finally, Section 5 concludes the paper and highlights the findings based on the case study.

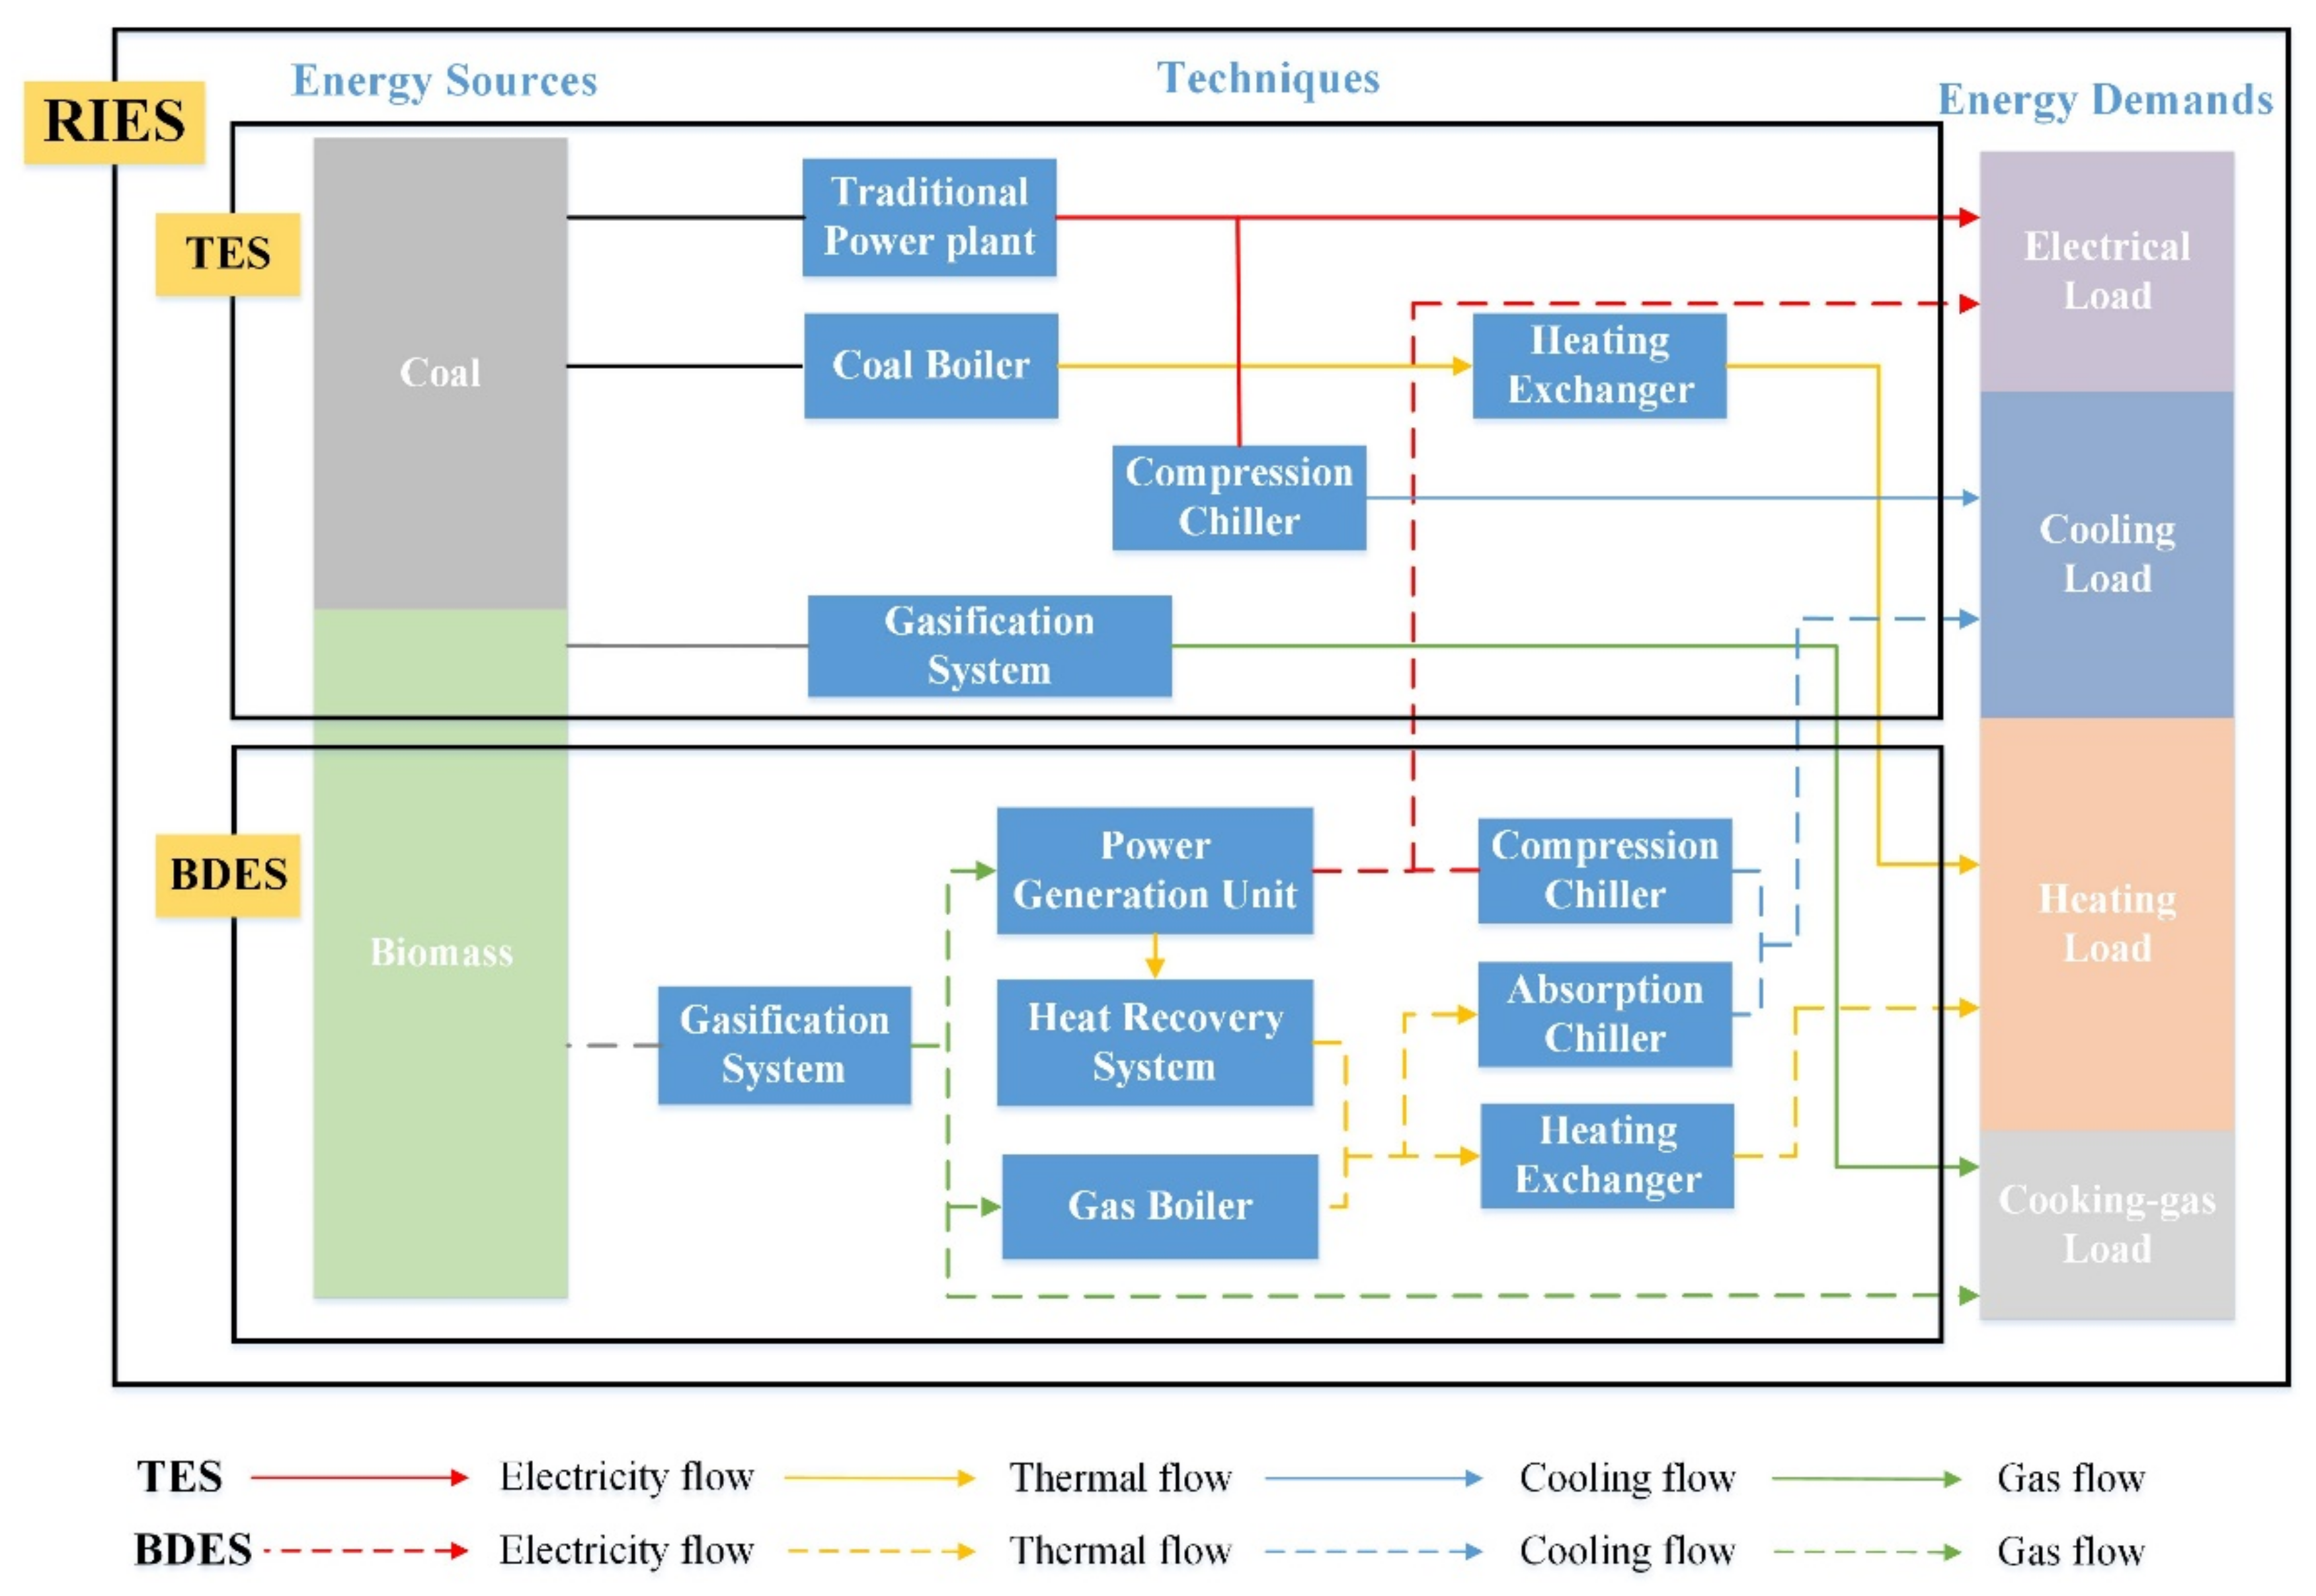
2. System Description

This paper selected a new rural community in Dalian, China as a case study. Energy consumption in Dalian mainly includes coal, natural gas, fuel oil, wind energy, nuclear energy and biomass. The current energy consumption structure is mainly based on coal, while renewable energy only accounts for a small proportion. The study site covers a total area of 29 km2, including 12.56 km2 arable land and 4.51 km2 woodland, and is rich in agricultural biomass resources. The community includes 500 households and a residential population of 1290. The primary energy demands consist of electricity, space heating, space cooling, hot water and cooking gas. Considering the pattern of local resource distribution and energy demand characteristics, a RIES was constructed to meet the selected residential user load, as shown in Figure 1. The RIES consists of two parts: a TES and a BDES. The TES is mainly coal-fired, including public grid, boilers, electricity chillers and heat exchanger. Due to the support of national policies, biomass straw gasification system is also used in the TES to meet the residents’ cooking gas demand [46]. The BDES employs gasification system, internal combustion engines, heating recovery system, gas boilers, absorption chillers and heat exchanger. The public grid and electricity chillers that belong to the traditional part will also be adopted as supplements in the BDES. In TES and BDES, there are overlaps in energy consumption and some devices, which will be discussed in the following scenario analysis.
The separate TES and BDES have different operating strategies from mixed RIES:
In the TES, the devices run independently. The electricity load is supplied by the public grid. The coal-fired boilers and heat exchangers provide the heating load, while the electricity chillers provide the cooling load. The syngas from gasification system is used to cook. The energy consumption is mainly coal, and biomass only accounts for a small part.
In the BDES, the syngas produced by gasification system is supplied to internal combustion engines, gas boilers and cooking gas load. The internal combustion engines provide electricity load, while the public grid is used as a supplement. The waste heat from heating recovery system supply the heating load in priority, and gas boilers will be turned on when the load cannot be met. In addition, the cooling converted by absorption chillers is prioritized for cooling. Electric chillers are used to fill the shortfall. The BDES mainly consumes biomass, and coal is only used as a supplement.
The CIES is the integration of the TES and the BDES. The proportion of installed capacity of TES and BDES, equipment operation strategy and energy consumption composition are obtained through optimization and controlled by emission reduction constraints.

3. Optimization Model

3.1. Objective Function

To consider economic factors in applying RIESs, the minimum total annual cost is used as the optimization objective. The objective function is formulated as follows:
Min   T A C = T C F u e l + T C G r i d + T C E q + T C O & M T C S u b s i d y
where T C F u e l is fuel acquisition cost, T C G r i d is electricity purchase cost from grid, T C E q is equipment investment cost, T C O & M is operation maintenance cost, and T C S u b s i d y is renewable energy subsidy.

3.1.1. Fuel Cost

Coal and biomass straw are used as fuel in the RIESs. Coal used for coal-fired boilers is directly purchased from the local market. The annual coal purchase cost is represented as follows:
T C C o a l = P C o a l × F C o a l
where P C o a l is the unit coal purchase cost, and F C o a l is the annual coal consumption.
The biomass acquisition cost was modelled using supply chain cost of biomass and biogas as in [47]. The biomass acquisition cost is formulated as Equation (3), in which stalk purchase cost, collection cost, transportation cost, pretreatment cost and storage cost are considered.
T C B i o m a s s = T C P u r c h a s e + T C C o l l e c t i o n + T C T r a n s p o r t + T C S t o r a g e + T C P r e t r e a t
T C P u r c h a s e = P B i o m a s s × F B i o m a s s T C C o l l e c t i o n = P C o l l e c t i o n × F B i o m a s s T C T r a n s p o r t = 0 2 π 0 R α r 2 β P T r a n s p o r t d r d θ = 2 3 F B i o m a s s 1.5 × β × P T r a n s p o r t × ( π × α ) 0.5 R = F B i o m a s s π × α α = m M ε × λ m × Y m × G m × μ m T C P r e t r e a t = P P r e t r e a t × F B i o m a s s T C s t o r a g e = P s t o r a g e × F B i o m a s s × Δ t
where T C P u r c h a s e refers to the biomass purchase cost incurred by the production enterprise in acquiring straw from farmers or grass traders, T C C o l l e c t i o n is the biomass collection cost resulting from straw crushing, compressing and packaging process in the collection stage, T C T r a n s p o r t is the straw transportation cost, T C P r e t r e a t and T C s t o r a g e represent the biomass pretreatment cost and storage cost, respectively.

3.1.2. Electricity Purchase Cost

The grid electricity purchase cost is related to local grid electricity tariff and grid electricity consumption, as shown in Equation (11).
T C G r i d = t T G T t × e G r i d , t
where GT is the local grid electricity tariff, and eGrid is the grid electricity consumption.

3.1.3. Equipment Cost

Equipment investment cost consists of two parts, including equipment capital and installation cost, and operation and maintenance cost. The equipment capital and installation cost can be calculated in Equation (12).
T C E q = i I j i J i C R F i × E P i , j i × n i , j i × C a p i , j i
where CRF is the equipment capital recovery factor, EP is the unit capital price, n is the equipment selected number, Cap is the selected capacity, i is the equipment type, and ji is the capacity of the ith equipment.
The capital recovery factor is related to equipment service life and interest rate, which can be calculated as follows:
C R F i = i r × ( 1 + i r ) l i ( 1 + i r ) l i 1
where ir is the interest rate, and l is the equipment lifetime.
The equipment operation and maintenance cost is related to the equipment energy output, which is calculated in Equation (14).
T C O & M = t T i I j i J i V C j × x t , i , j i
where VC is the unit operation and maintenance cost, and x is the equipment energy output.

3.1.4. Renewable Energy Subsidy

In this paper, the amount of biomass straw used is subsidized. When the total annual cost of RIES is lower than of the TES, the subsidy is set to 0. When the cost exceeds TES, a subsidy is set to cover the excess cost.
T C S u b s i d y = P S u b s i d y × F B i o m a s s
where P S u b s i d y is the unit straw consumption subsidy.

3.2. Constraint Function

The constraints include equipment operation constraints, energy balance constraints, local biomass constraints, local CO2 emission reduction constraints.

3.2.1. Equipment Operation Constraints

The equipment to be optimized is selected from the given device sequence. If one type of equipment is selected, the selected number should be larger than or equal to 1 and cannot exceeds the specified maximum value. The number of alternative equipment is restricted as follows [48]:
c i , j i n i , j i c i , j i × N i , j i , max i I , j i J i
where c is a binary variable used to determine whether the equipment is selected, n is the number of the selected equipment, and N is the maximum number of the optional equipment.
To ensure the safe operation of the selected equipment, it is necessary to set the on-off coefficient. Then, the equipment energy output is limited within the upper and lower bounds. The operation constraints are as follows:
d t , i , j i n i , j i   t T , i I , j i J i
j i J i δ i , j i , min × C a p i , j i × c i , j i × d t , i , j i x t , i , j i , k j i J i δ i , j i , m a x × C a p i , j i × c i , j i × d t , i , j i   k K
where d is an integer variable indicating the number of devices in operation, and δ is the on-off coefficient.
The gas yield, LHV and gasification efficiency are mainly considered in the gasification process [49]. The syngas output for gasification system is calculated in Equation (13):
v S y n g a s , G S , j G S , t = f B i o m a s s , G S , j G S , t × η b i o m a s s s y n g a s
The relationship between gas yield and gasification efficiency can be expressed as follows:
η b i o m a s s s y n g a s , j G S = η G S , j G S × L H V B i o m a s s / L H V S y n g a s
The electricity output of ICEs can be calculated based on syngas consumption and electricity efficiency, which is estimated as follows [48]:
x e l e c t r i c i t y , I C E , j I C E , t = x s y n g a s , I C E , j I C E , t × η I C E , j I C E , t
The output energy of heat recovery system can be estimated in Equation (16):
x h e a t i n g , H R S , t = j I C E J I C E x s y n g a s , I C E , j I C E , t × ( 1 η I C E , j I C E , t ) × η H R S
The thermal output of gas boilers can be calculated based on syngas consumption and gas boiler efficiency, which is estimated as follows [50]:
x h e a t i n g , G B , t = j G B J G B x s y n g a s , G B , j G B , t η G B , j G B
Similar to the gas boiler, the thermal output of coal boiler can be calculated in Equation (18):
x h e a t i n g , C B , t = j C B J C B x c o a l , C B , j C B , t η C B , j C B
The relationship between the electricity consumed by the electric chiller and the cooling output is shown in Equation (19) [51]:
x c o o l i n g , E C , t = j E C J E C x e l e c t r i c i t y , E C , j E C , t C O P E C
The cooling output of absorption chiller is calculated in Equation (20):
x c o o l i n g , A C , t = j A C J A C x h e a t i n g , A C , j A C , t C O P A C

3.2.2. Energy Balance Constraints

Local residential energy load mainly consists of electricity, heating, cooling and cooking gas. Electricity load includes lighting and electro-domestic appliances. Heating load includes space heating and domestic hot water. Cooling load refers to space cooling. The regional electricity demand consists of residential electricity load and electricity consumed by electric chillers, which is provided by the internal combustion engines and public grid.
i = I C E j I C E J I C E x e l e c t r i c i t y , i , j i , t + e G r i d , t L o a d e l e c t r i c i t y , t + i = E C j E C J E C x e l e c t r i c i t y , i , j i , t / C O P E C
The regional heating demand is the sum of the residential heating load and the thermal consumption of absorption chillers, which can be satisfied by coal boilers, gas boilers, and heat recovery system.
i C B , H R S , G B j i J i x h e a t i n g , i , j i , t i = A C j A C J A C x c o o l i n g , i , j i , t / C O P A C + i = H E j H E J H E x h e a t i n g , i , j i , t / η H E
i = H E j H E J H E x h e a t i n g , i , j i , t L o a d h e a t i n g , t
The cooling load is met by absorption chillers and electric chillers.
i A C , E C j i J i x c o o l i n g , i , j i , t L o a d c o o l i n g , t
The cooking gas load is met by syngas provided by gasification system.
i = G S j G S J G S x c o o k i n g g a s , i , j i , t L o a d c o o k i n g g a s , t

3.2.3. Local Biomass Constraints

To reduce long distance transportation cost, the biomass consumed cannot exceed the available local biomass resources.
( t T i I C E , G B j i J i x s y n g a s , i , j , t + t T i = G S j G S J G S x c o o k i n g g a s , i , j , t ) × λ 1000 × L H V S y n g a s × η b i o m a s s s y n g a s Q B i o m a s s a v a
where Q B i o m a s s a v a is the available straw resources, which is calculated in Equation (27):
Q B i o m a s s a v a = m ρ m Q B i o m a s s , m t h = m ρ m × A m × α m
where ρ is the straw available factor, A is the local land area, and α is the biomass resource density.

3.2.4. CO2 Emission Reduction Constraints

CO2 emissions caused by fuel and grid electricity consumption are mainly considered in this paper, as shown in Equation (28).
A C E = t e G r i d , t × E F G r i d + F C o a l × E F C o a l + F B i o m a s s × E F B i o m a s s
where EF is the CO2 emission factor.
To achieve an affordable and safe transition from traditional energy supply to the ideal scenario of a fully renewable energy supply, the relationship between CO2 emission reduction and economic cost is studied in different energy systems through establishing CO2 emission constraints and energy supply scenarios. Based on the CO2 emission under the optimal cost, the emission reduction constraints of other energy systems are set as follows:
A C E s A C E b a s e ( 1 R E )
where s is the type of energy system, and RE is CO2 emission reduction rate.

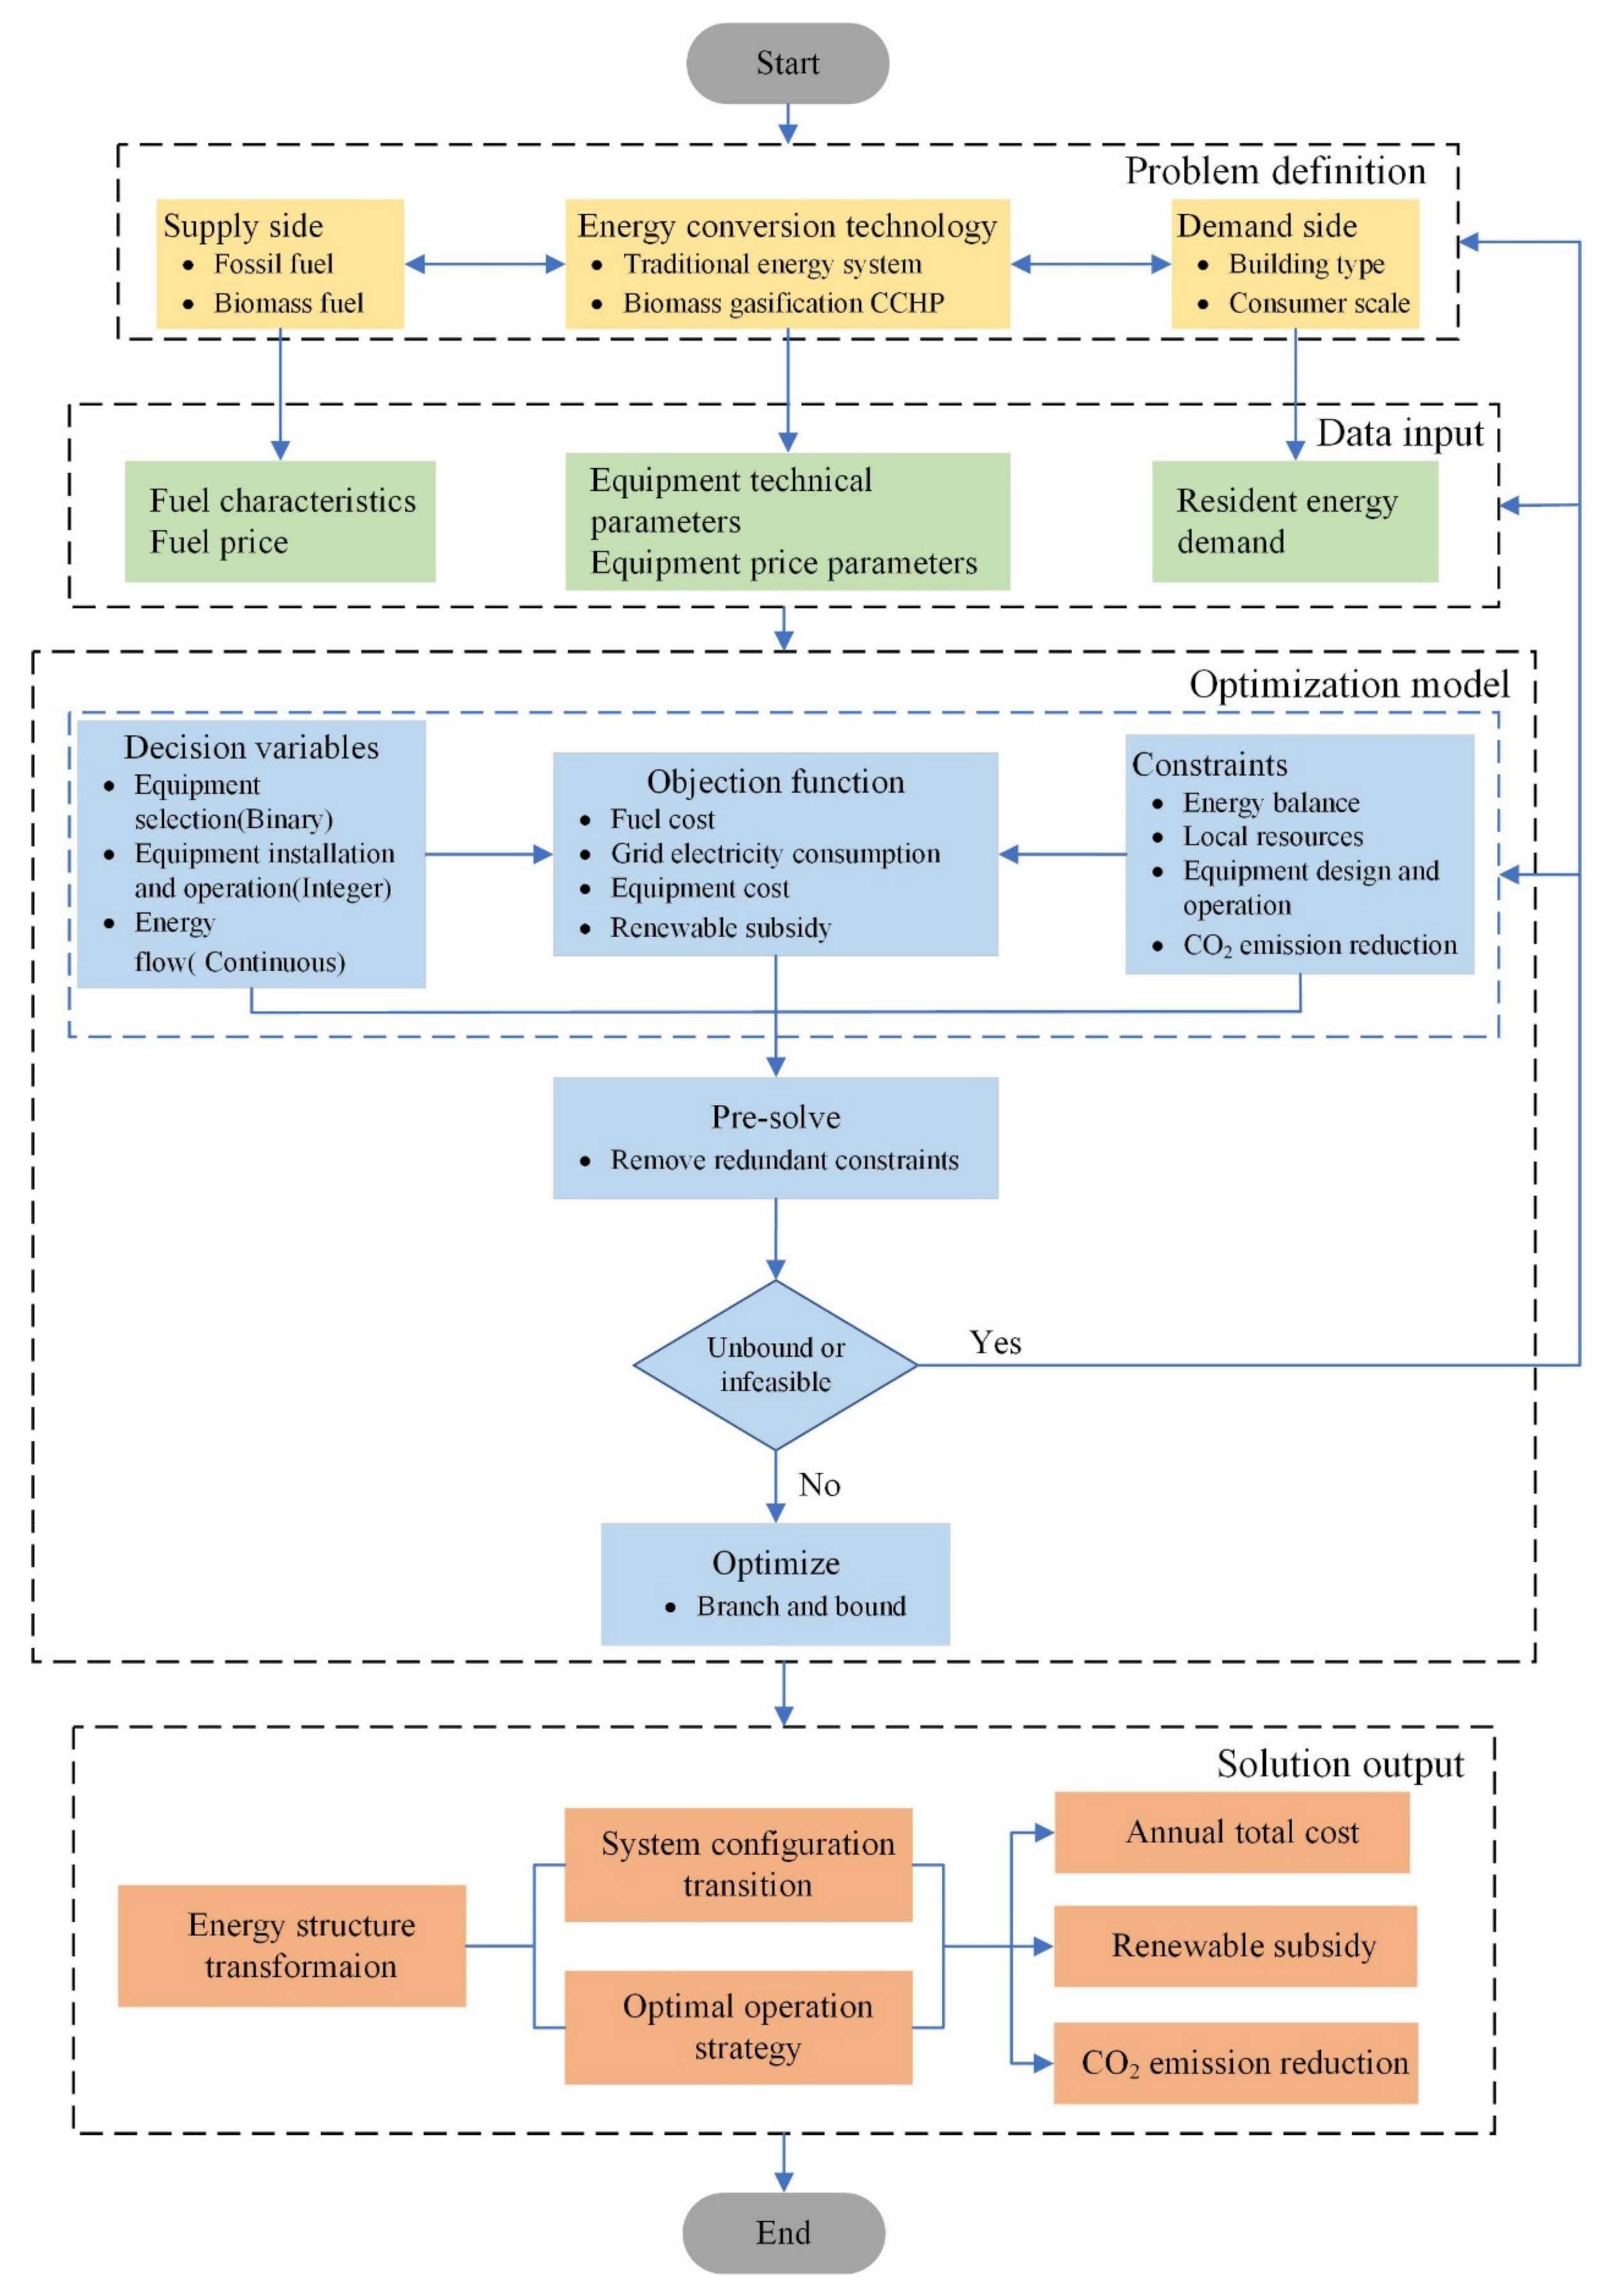
3.3. Optimization Method

The model involves large-scale integer variables, binary variables, and continuous variables, and the objective function and constraints contain nonlinear terms. Therefore, the model belongs to the mixed-integer nonlinear programming (MINLP). According to Jon Lee and Sven Leyffer [52], it is challenging to deal with the MINLP problem with nonconvex equations and discrete variables due to the high computational expense. To resolve complex and large-scale optimization with thousands of variables and constraints, mixed integer linear programming (MILP) is efficient because of the surety of finding a globally optimal solution and effective commercial solvers [53,54]. In this paper, thus, the MINLP is transformed into a MILP by linearizing the nonlinear terms in the objective function and constraints in the model.
In the objective function, the biomass transportation cost is represented via a nonlinear function related to biomass consumption and transportation radius. To reformulate the transportation cost as a linear one, the piece-wise linearization method is used in view of the transportation distance [47]. According to the radius of the resource area, the area is divided into equidistant concentric circles. The biomass resources between the annulus with radii rh−1 and rh can be calculated in Equation (30):
Q B i o m a s s , h = 0 2 π r h 1 r h α × r d r d θ = α × π × ( r h 2 r h 1 2 )
where Qbiomass,h is the available biomass resources in the h annulus, which is used as the h break point. The transportation distance of biomass resources in the annulus is calculated as the outer radius of the annulus rh, multiplied by a tortuosity factor 2 according to Ref. [55]. Then, a piecewise linear function of incremental cost-breaks is obtained. The incremental transportation cost is used for a certain amount of biomass transported. The breakpoints between each linear segment is h. The unit transportation cost between rh−1 and rh is PTransport,h. The piecewise linearization of the biomass transportation cost is formulated as Equation (31) by introducing an auxiliary Special Ordered Sets of type 2 (SOS2) variable wh.
T C T r a n s p o r t = h w h × C P h C P 0 = 0 C P h = C P h 1 + P T r a n s p o r t , h × ( F b i o m a s s , h F b i o m a s s , h 1 ) F b i o m a s s , 0 = 0 F b i o m a s s , h = F b i o m a s s , h 1 + Q b i o m a s s , h h w h = 1 F b i o m a s s = h w h × F b i o m a s s , h
In the constraint function Equation (12), the decision variables c (binary) and d (integer) are multiplied, resulting in the generation of nonlinear constraints. To reformulate Equation (18) as linear one, the continuous variables need to be introduced to replace the nonlinear terms [56]. An equivalent constraint conversion is given as follows:
γ t , i , j i = c i , j i × d t , i , j i γ t , i , j i c i , j i × N i , j i , max d t , i , j i + N i , j i , max × ( c i , j i 1 ) γ t , i , j i d t , i , j i
By using the above linearization method, the MINLP problem can be converted into a MILP one. The MILP is modeled with Python 3.5.2 and solved with Gurobi 7.0.1 solver using branch and bound method [57]. The optimization was carried out on a Windows sever with 128 GB of RAM and 28 Intel Xeon E5-2690v4 processors at 2.2 GHz. Gurobi is a large-scale mathematical programming optimizer, which is capable of solving MILP problems efficiently. Compared with similar optimizers, the speed of solving MILP problems has a great advantage [50].
In the modeling process, the following assumptions are given: All of the equipment in the energy system runs reliably throughout the year without failure, ignoring the time interval during device on-off operation and load adjustment. The optimization procedure of the MILP model is shown in Figure 2.

4. Case Study

In this section, we have considered a new rural community in Dalian as the target CO2 emission area to evaluate technology cost and local fiscal incentives in the coal-to-biomass energy transition process. The case study concerns two kinds of scenarios: (1) basic scenarios, and (2) CO2 emission reduction scenarios. The basic scenarios analyzed the separate TES, BDES, and the RIES without considering CO2 emission reduction control. The transition process from TES to BDES was realized through CO2 emission reduction scenarios.

4.1. Input Data

Model input data mainly included energy supply, conversion, and demand data.

4.1.1. Supply Side Data

Model energy supply data mainly included input energy characteristics, energy prices and local biomass resources. The energy characteristics and energy prices are summarized in Table 1. Input energy sources mainly consist of coal, biomass, and grid electricity. The sample location of Dalian, is in the Bohai Rim region. Accordingly, the regional coal price published by the local trading platform was selected as the local coal price [58,59]. The biomass acquisition price mainly includes biomass purchase price, collection price, transportation price, pretreatment price and storage price, and these were taken from field surveys of the “Dalian Straw Comprehensive Utilization Plan”. The cost of electricity for residents in Dalian corresponded to the annual electricity consumption, and was obtained from the local specific graduated power tariff as published on the website of the Dalian Development and Reform Commission [60].
The scenarios of different energy systems depended on the local biomass resource availability. The amount of local biomass straw resources was obtained from field surveys of the “Dalian Straw Comprehensive Utilization Plan”. According to the survey results, six types of crop straws are found locally: rice stalks, corn stalks, millet stalks, sorghum stalks, legume stalks, and peanut straw. Among these, corn is the main crop, and the crop area accounts for 74.80% of the total cultivated area, followed by legumes, accounting for 13.51%. The straw collection parameters and local biomass resources are shown in Table 2. The total quantity of local biomass resources was estimated at 5273.13 t. Corn stalk accounts for the majority of local straw resources (85.44%).

4.1.2. Energy Conversion Technology Data

Equipment Technical Parameters

The capacity of the alternate energy equipment was obtained from national standards and the equipment manufacturer. The selected equipment life was assumed to be 20 years, according to [50]. The technical parameters considered included equipment efficiency, coefficient of performance and load range; data is summarized in Table 3. The data of the optional gasification system were obtained from the manufacturer [62] and the syngas production capacity ranged from 600 to 5000 Nm3. Due to the low investment costs and wide capacity range (3 kW–100 MW) [35] internal combustion engine was chosen as the power generation unit. According to the electricity load characteristics of the residents, and referring to the nominal equipment capacity provided by the manufacturer [63], small-scale (20 kW–1 MW) and medium-scale (1–10 MW) internal combustion engines were used as candidates. The data on alternative boilers were obtained from national standards on hot water boilers [64], with capacities ranging from 350 to 174,000 kW and the rated effluent pressure ranging from 0.4 to 2.5 MPa. According to equipment data from the manufacturer [65], the double-effect lithium bromide absorption chillers with capacities ranging from 350 to 6980 kW were selected. In addition, the size effect on efficiency of internal combustion engines and boilers was considered according to [50,66,67]. For simplification, the impact of load changes on the efficiency of the equipment was neglected, and the efficiency of equipment was considered to be constant. In order to maintain the operational status of the equipment, the switching coefficient was set according to [51,56,58].

Equipment Cost Parameters

The economic parameters for the equipment in the model mainly considered the equipment installation, operation and maintenance costs. The detailed cost parameters are shown in Table 4.

Technical CO2 Emission Parameters

To measure impact of the energy systems on the local environment, CO2 emissions were calculated. The CO2 emission factors of different technologies are listed in Table 5. During the entire lifecycle, CO2 is absorbed during biomass growth and released during combustion. Thus, the CO2 emission factor of BDESs only takes into account the indirect emissions of fuel consumption during transportation and gasification, as proposed by [46].

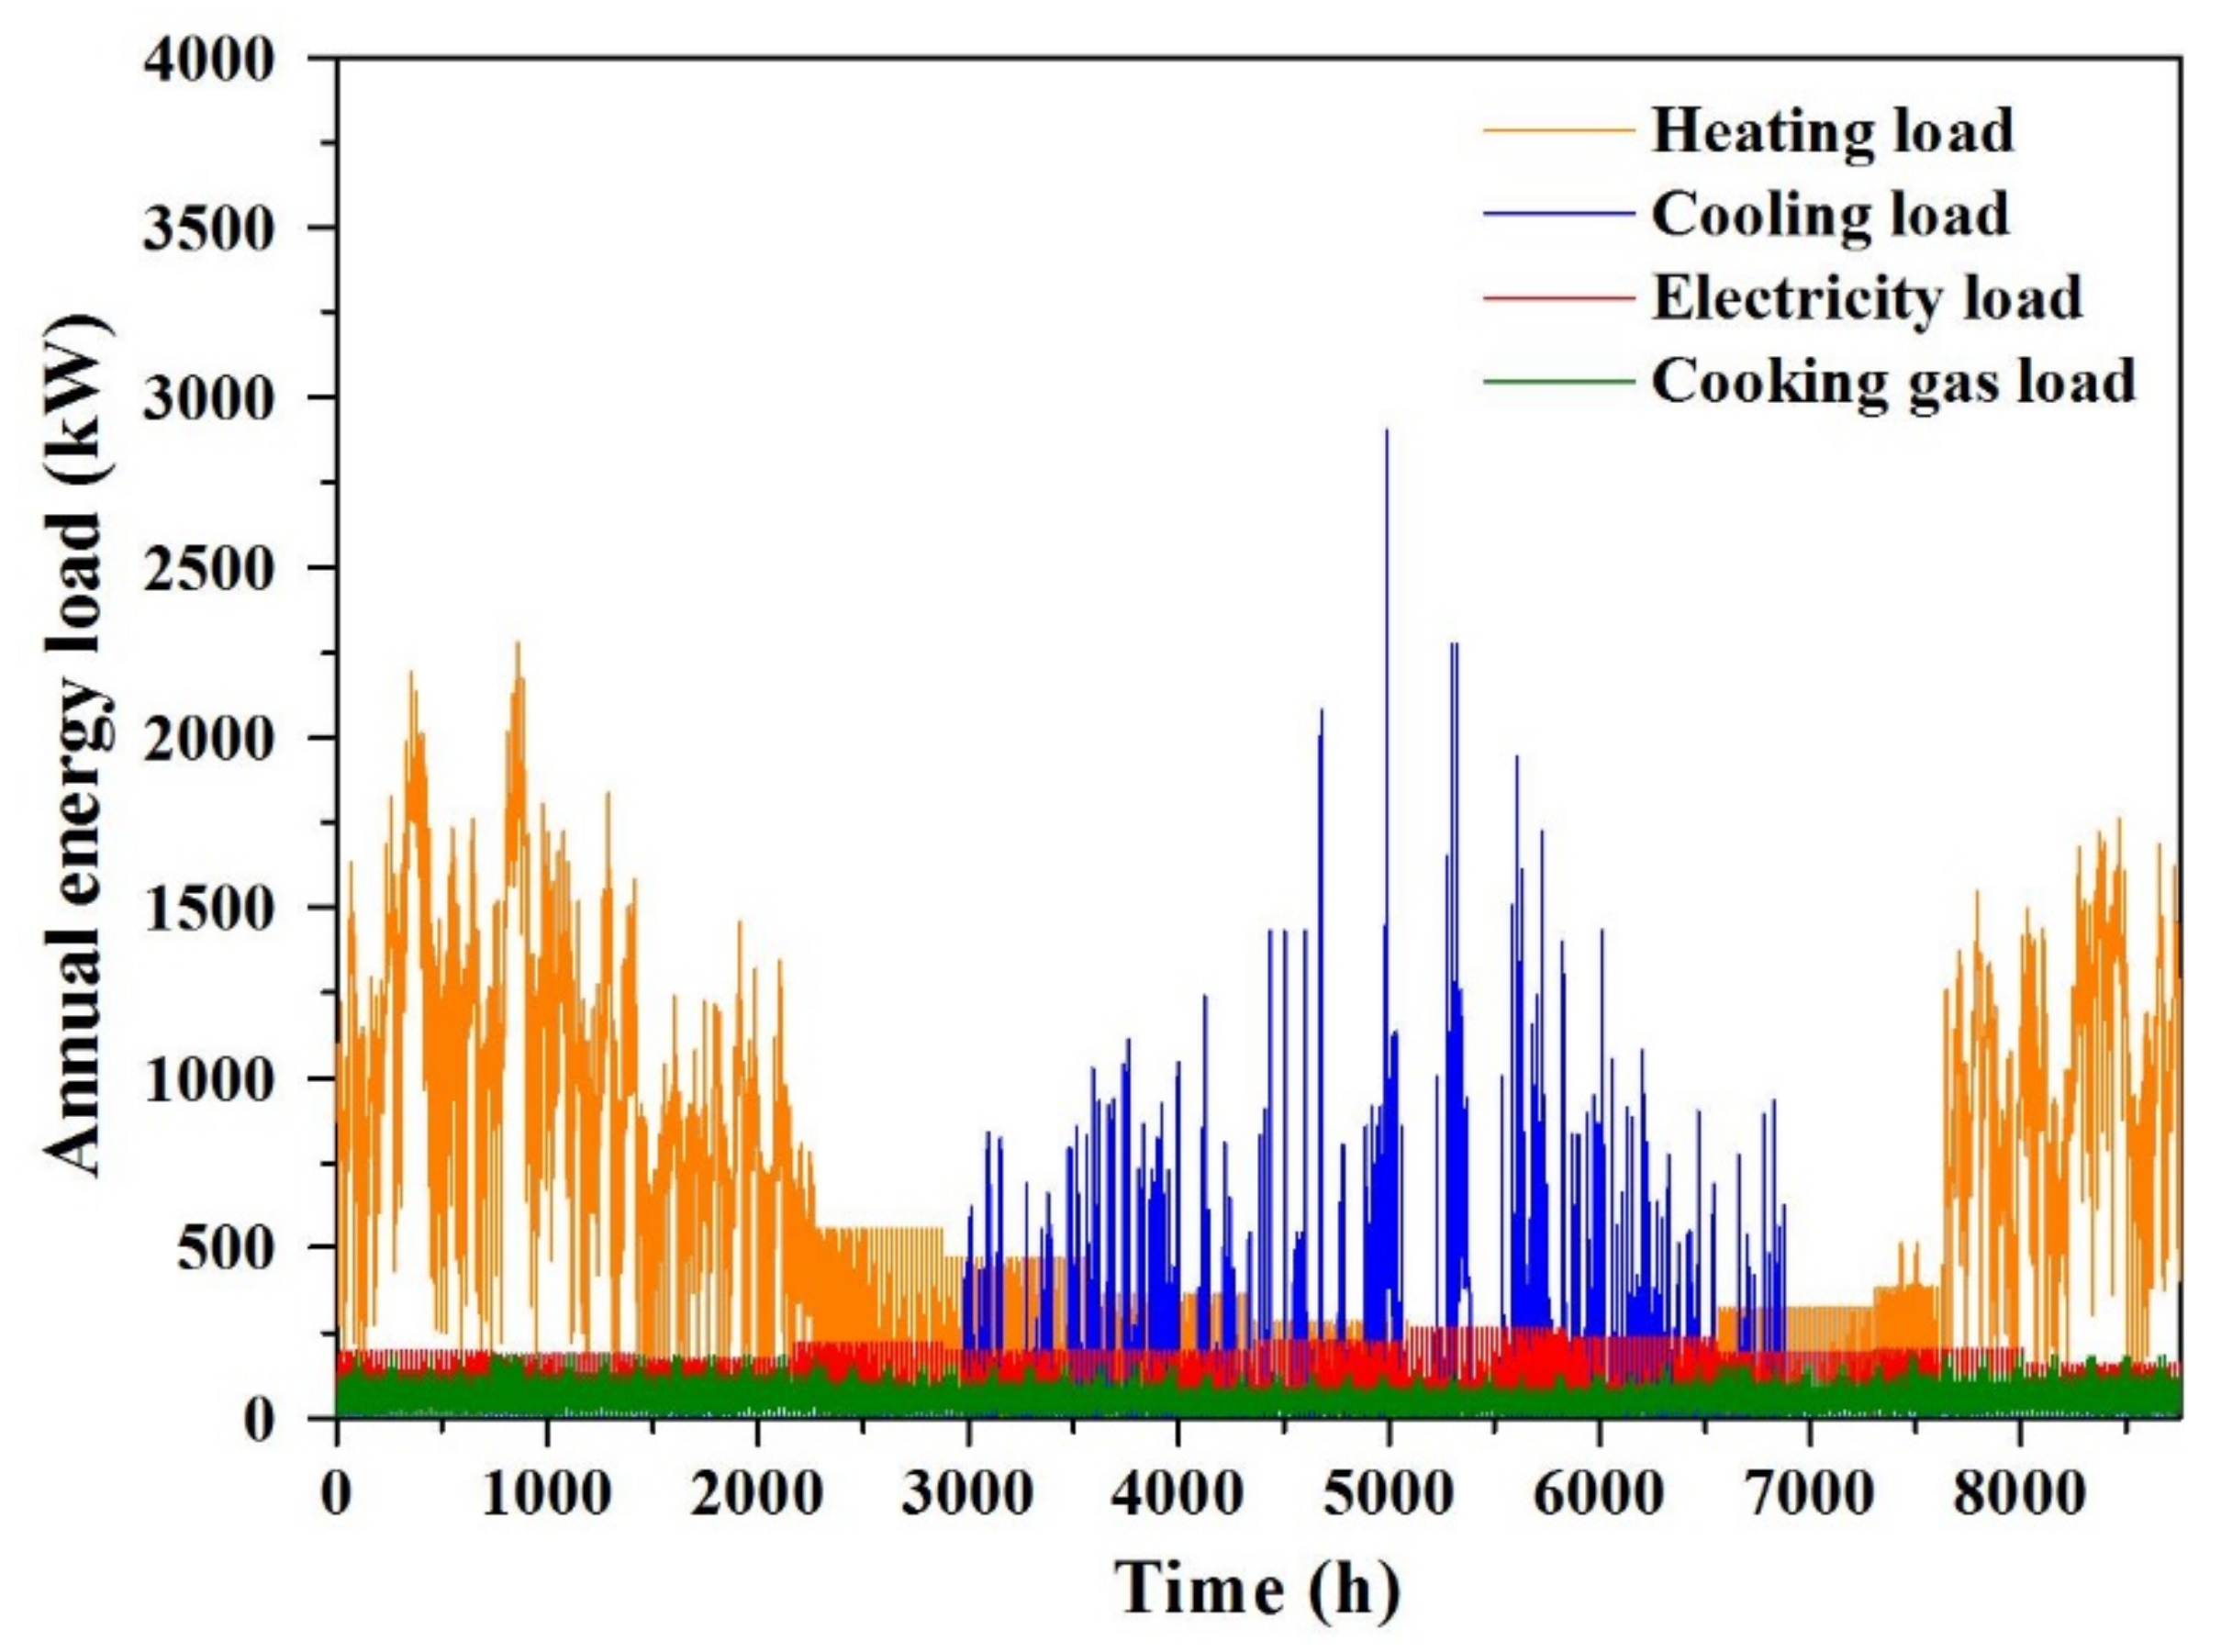
4.1.3. Energy Demand Side Data

The hourly energy load, except for the cooking gas load of residential buildings, was simulated using DEST [73]. Residential buildings were mainly 6-story buildings with an area of 48,246 m2 and a single floor height of 2.9 m. The hourly cooking gas load was calculated according to the cooking gas consumption intensity from “Dalian City Gas Special Plan” and the hourly dynamic consumption factor from the “Code for design of city gas engineering” [74]. The peak heating, cooling, electricity and cooking gas load were 2280, 2905, 264, and 181 kW, respectively. The annual local energy load of 500 households is shown in Figure 3.

4.2. Results and Discussion

4.2.1. Basic Scenario

The share of energy resources and system configuration will affect the economy of regional energy supply system. In this section, we considered three basic scenarios including TES, BDES and RIES to study the minimum total annual cost and make comparison.
TES scenario: energy needs are only provided by TESs;
BDES scenario: energy needs are provided by BDESs;
RIESmin scenario: energy needs are provided by a combination of TES and BDES. The RIESmin scenario represents the RIES with the minimum total annual cost without considering subsidies.

Regional Energy Supply Cost Comparison

The local energy load, technology data and parameters of the energy resources were used as inputs into the MILP model. The total annual cost and cost composition of three basic scenarios are shown in Figure 4. Compared with TES and BDES, the RIESmin achieved the lowest optimization cost by reducing grid electricity purchase and equipment investment costs. Due to the lower equipment installation cost and fuel price, the TES had a lower energy supply cost than that of BDES, but was associated with a poor load regulation ability and environmental pollution. By using BDES, the total annual cost increased by 27% as compared to that of the TES. The high biomass straw acquisition cost and equipment application cost make the BDES less economical and uncompetitive. In contrast, using the RIESmin improved the load regulation ability of the energy supply system, reduced the total installed capacity of the equipment, and achieved superior economic performance.

System Configuration Transformation

The optimal equipment configurations of the TES, BDES, and RIESmin are compared in Table 6, and the selected number and capacity of the specific equipment are noted in parentheses. Among the three energy systems, the TES had the fewest equipment installation types, with only one 600 Nm3 gasification system, one 350 kW coal boiler, three 500 kW coal boilers, and one 1050 kW coal boiler. As compared to the TES, the BDES additionally installed two 1200 Nm3 gasification systems, one 280 kW internal combustion engine with a 413 kW heat recovery system and one 350 kW, one 700 kW and one 1400 kW gas boiler, and one 580 kW, and one 1740 kW absorption chiller to substitute the regional coal-fired boilers, electric chiller, and public grid.
During the optimization of the RIESs, we observed that the optimal cost was achieved by installing one 100 kW internal combustion engine with one 149 kW heat recovery system, one 350 kW gas boiler, two 350 kW absorption chillers and one 1740 kW absorption chiller. Compared with the TES, 500 kW coal boiler, 2806 kW electric chiller and partial grid electricity were replaced. However, as compared with the BDES, the gasification system, internal combustion engine, heat recovery system and gas boiler in the RIESmin had a lower total installed capacity.

Optimal Equipment Operation Strategy

In order to analyze the equipment operation and energy supply, two typical days were selected: a typical winter day and a typical summer day. The energy balance of TES, BDES and RIESmin on typical days are shown in Figure 5. On the typical winter day, the local residential energy needs mainly comprised of electricity, heating and cooking gas. The electricity supply in the TES was supplied by the public grid and in the BDES by an internal combustion engine (see Figure 5a,b). The RIESmin was powered by both the public grid and an internal combustion engine, creating a more flexible and reliable power supply. The internal combustion engine supplied most of the electricity load, and the public grid was used to fill the shortfall as shown in Figure 5c. The BDES had partial power surplus in periods 2–6 and periods 22–24, while the three systems met the electricity balance during other periods. The heating load was relatively high during winter, and the coal boilers operated at a higher load rate to meet the heating load in the TES (see Figure 5d), while in the BDES and RIESmin, coal boilers and the heat recovery system worked together to provide the winter heating load, with the coal boilers providing most of the heating supply, and the shortfall provided by the heat recovery system as shown in Figure 5e,f. In winter, all three energy systems could meet the heating and cooking gas balance without any loss of energy (see Figure 5g–i).
Figure 5j–u show the energy balance for the typical summer day. Summer electricity consumption was taken as the sum of the residents’ electricity load and the compressed chillers’ power consumption. Compared with the BDES and RIESmin, the TES electricity consumption was higher as only the electro-compressed chillers were equipped to provide cooling (see Figure 5j). However, the installed capacity of compressed chillers only accounted for a small proportion of the total capacity of the BDES and RIESmin. Thus, the resulting electricity consumption was significantly lower, as shown in Figure 5k,l. In the RIESmin, the internal combustion engine could not meet the total electricity demand, and the public grid provided the remaining supply. As the summer residential heating load mainly consisted of domestic hot water, the boilers operated in a least number in all three systems. In the TES, due to poor load-regulation of coal-fired boilers, nearly 50% of the heating supply was wasted from period 2 to period 18 (see Figure 5m). In the BDES and RIESmin, in addition to meeting the local heating load, the supplied heating flow was also supplied to the absorption chillers, and thus no thermal energy was wasted. In the BDES, the heat recovery system and gas boilers fulfilled the entire heating demand. The heat recovery system provided the base load and the gas boilers were used during peak load periods (period 20–24) as shown in Figure 5n. In the RIESmin, heating demand was supplied by the coal boilers and the heat recovery system. The heating was supplied by the heat recovery system during most off-peak periods, while the coal boilers operated during the 12th, 14th, 18th, and the peak periods as shown in Figure 5o. Furthermore, cooling was provided only by compressed chiller in TES (see Figure 5p) and by the absorption and compressed chillers in BDES and RIESmin (see Figure 5q,r). The resulting electricity consumption by the compressed chiller was included in the electricity load. Most of the cooling demand was met by the absorption chillers, and the shortfall was provided by the compressed chiller in the BDES and RIESmin.

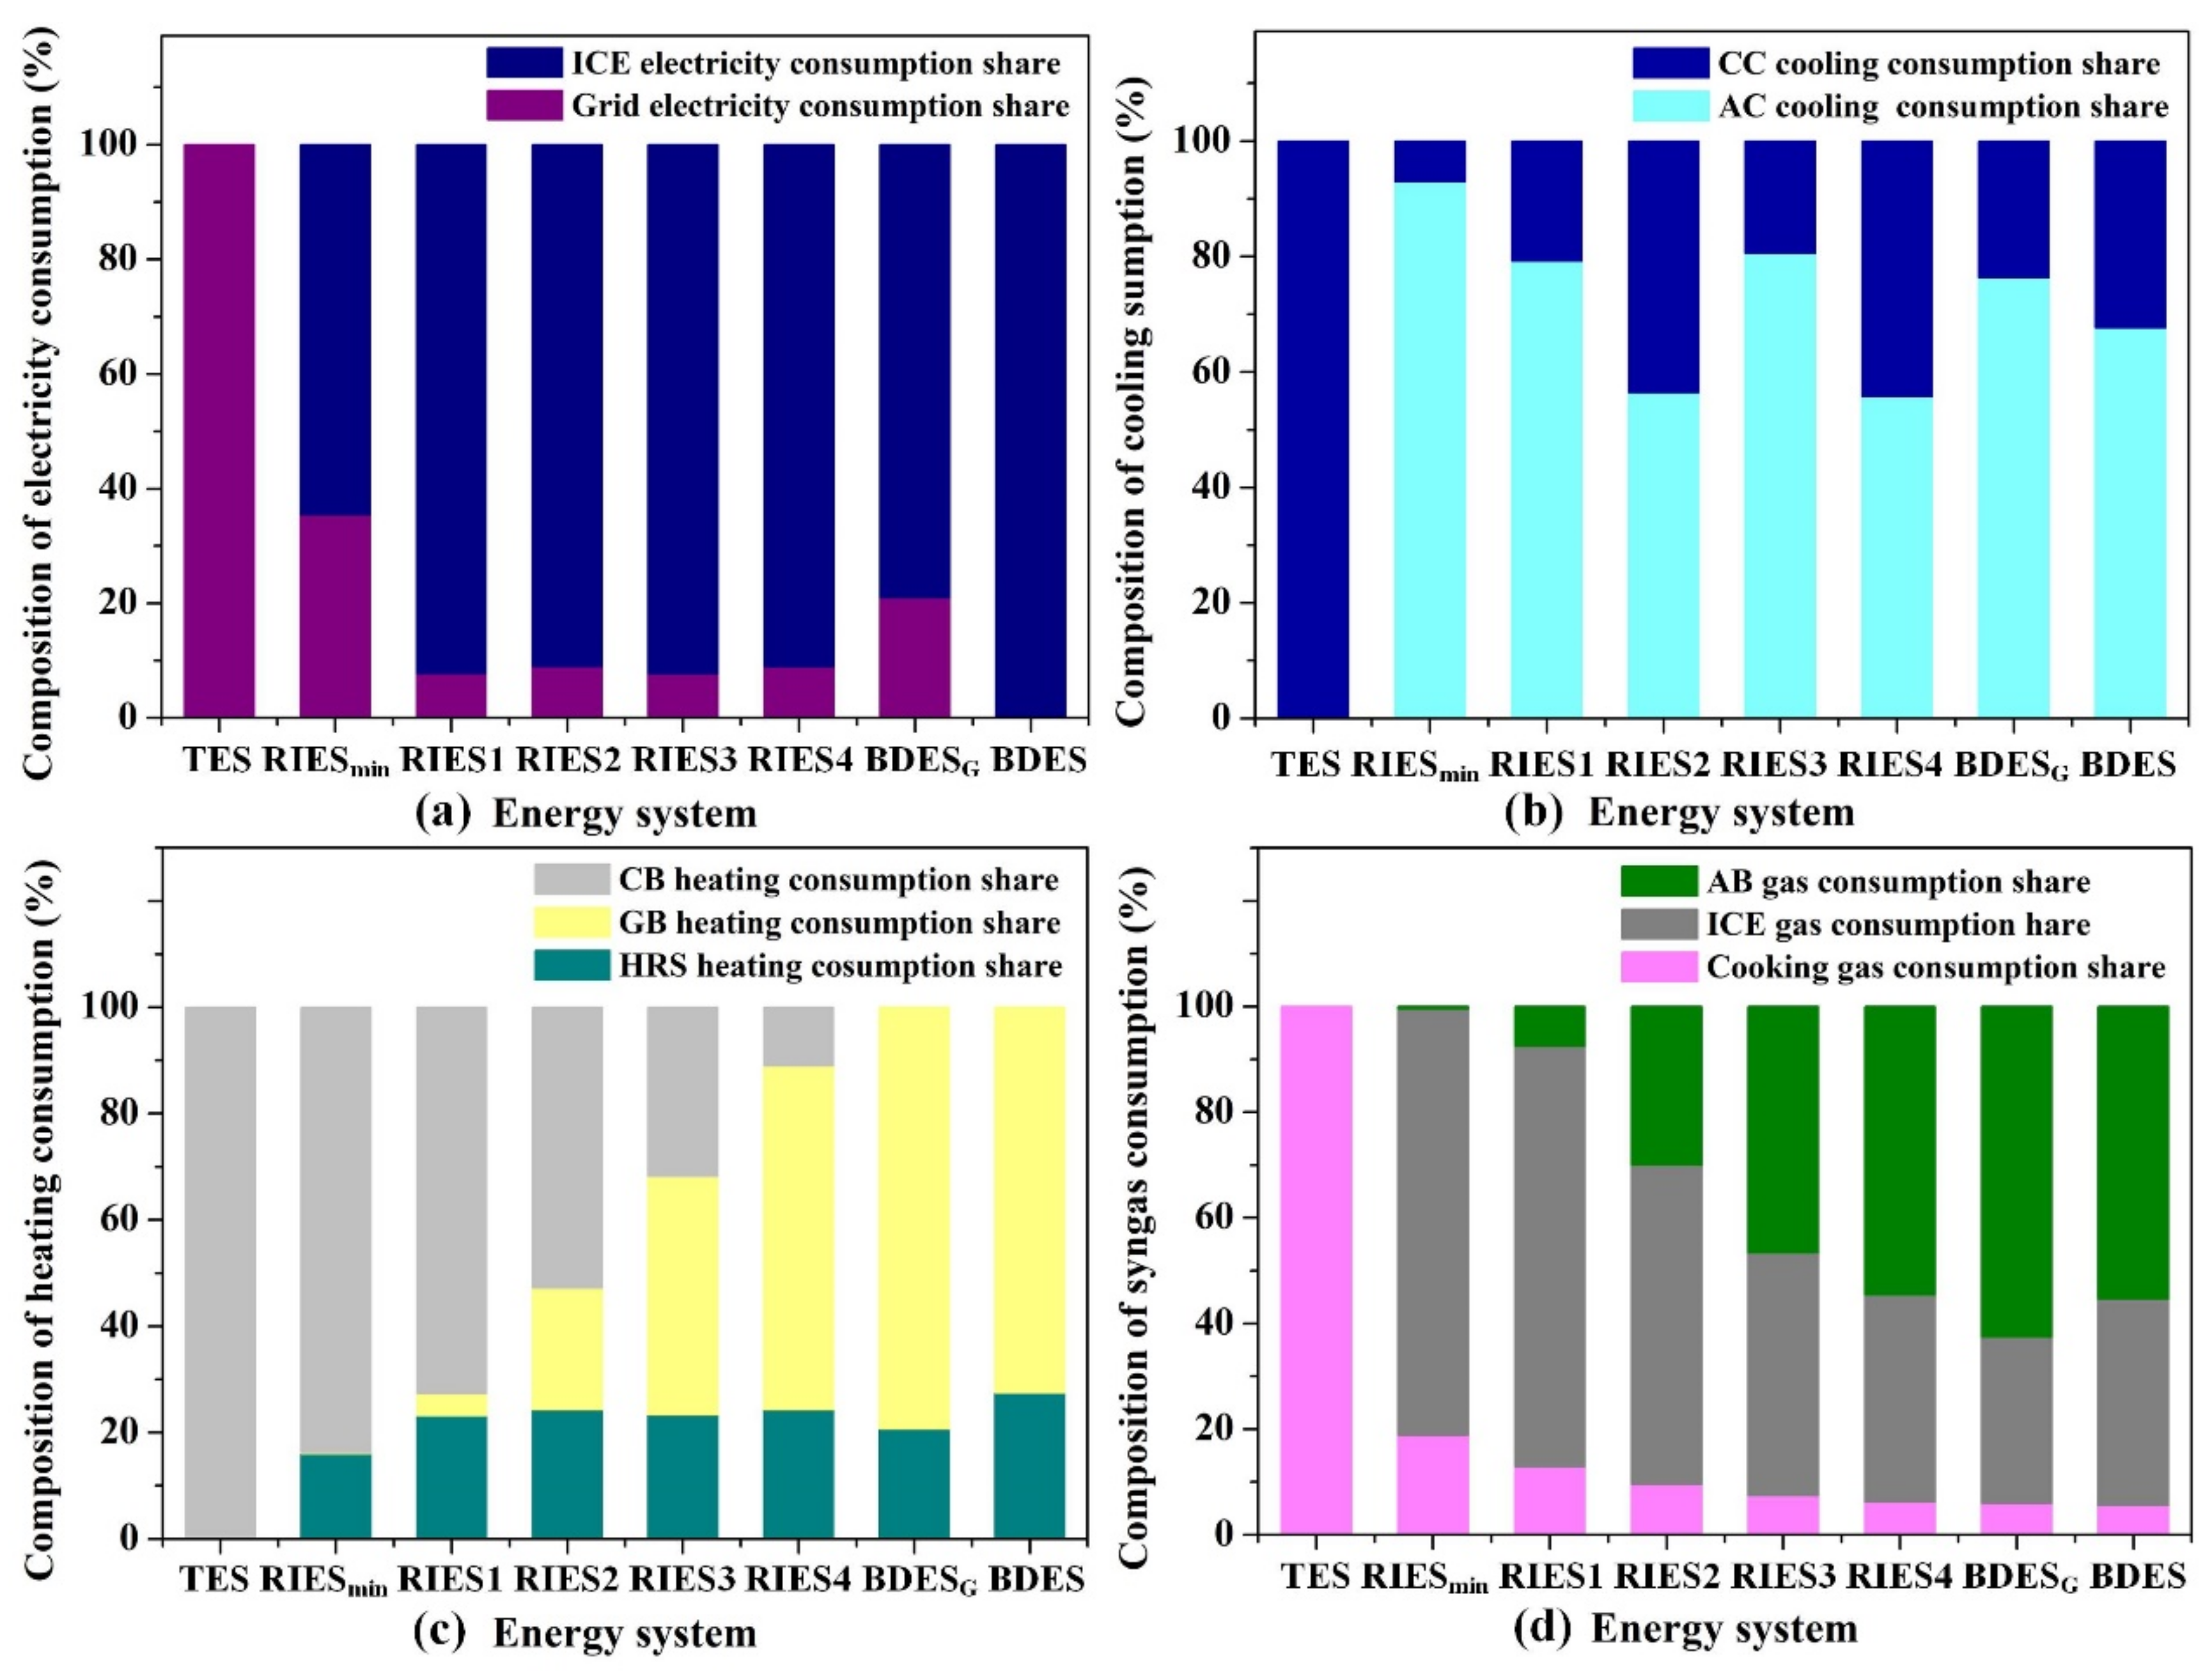
Energy Consumption Structure Adjustment

As the coal consumption brought by grid electricity consumption was not certain, this paper only counted the grid electricity consumption. Then, the energy consumption on the supply side was divided into three parts: grid electricity consumption, thermal coal consumption, and biomass consumption. In order to facilitate comparison, the energy consumption was converted to equivalent standard coal. As is clear from Figure 6, the TES had the least energy consumption due to the use of coal with a higher heating value and fewer energy conversion technologies. The coal consumed by the TES was 1088.95 t, which is equivalent to 777.84 tce accounting for 78.72% of the annual total energy consumption. The share of grid electricity accounted for 12.5%, and biomass accounted for the smallest share, with only 8.79%. Although the BDES can maximize the utilization of local biomass resources, it does not reduce energy consumption. The energy consumption of the BDES was the highest, reaching 1544.05 tce, which was 555.92 tce higher than that of the TES and 414.82 tce higher than that of the RIESmin. In addition, the BDES only used biomass straw as an energy source, which may lead to insufficient energy supply under extreme climatic conditions. However, the adoption of the RIESmin could facilitate the utilization of local biomass resources, as local straw utilization increased by 702.11 t as compared to that under the TES. Simultaneously, the RIESmin reduced grid electricity consumption by 688.73 MWh and decreased coal consumption by 203.94 t as compared to the TES.
According to the energy consumption and the CO2 emission factors, the calculated annual CO2 emissions of TES, BDES and RIESmin are compared in Figure 7. The results show that among the three systems, the CO2 emissions of the TES were the largest, of which 69.45% was from coal, 30.32% was from the grid electricity consumption, and only 0.22% was from biomass consumption. The energy consumption structure, which was dominated by coal consumption and grid power consumption, resulted in higher CO2 emissions. As compared to the TES, the RIESmin reduced CO2 emission by 32.85% by reducing coal and grid electricity consumption. As only biomass was used as an energy source, the BDES reduced CO2 emissions by 96.08% as compared to the TES and by 94.16% as compared to the RIESmin.
Based on the above-mentioned analysis, the RIESmin produced less CO2 at a lower total annual cost than the TES. Although the CO2 reduction rate was not as high as that of the BDES, the total annual cost reduction of the RIESmin was 33.02%, making it easier to be widely applied.

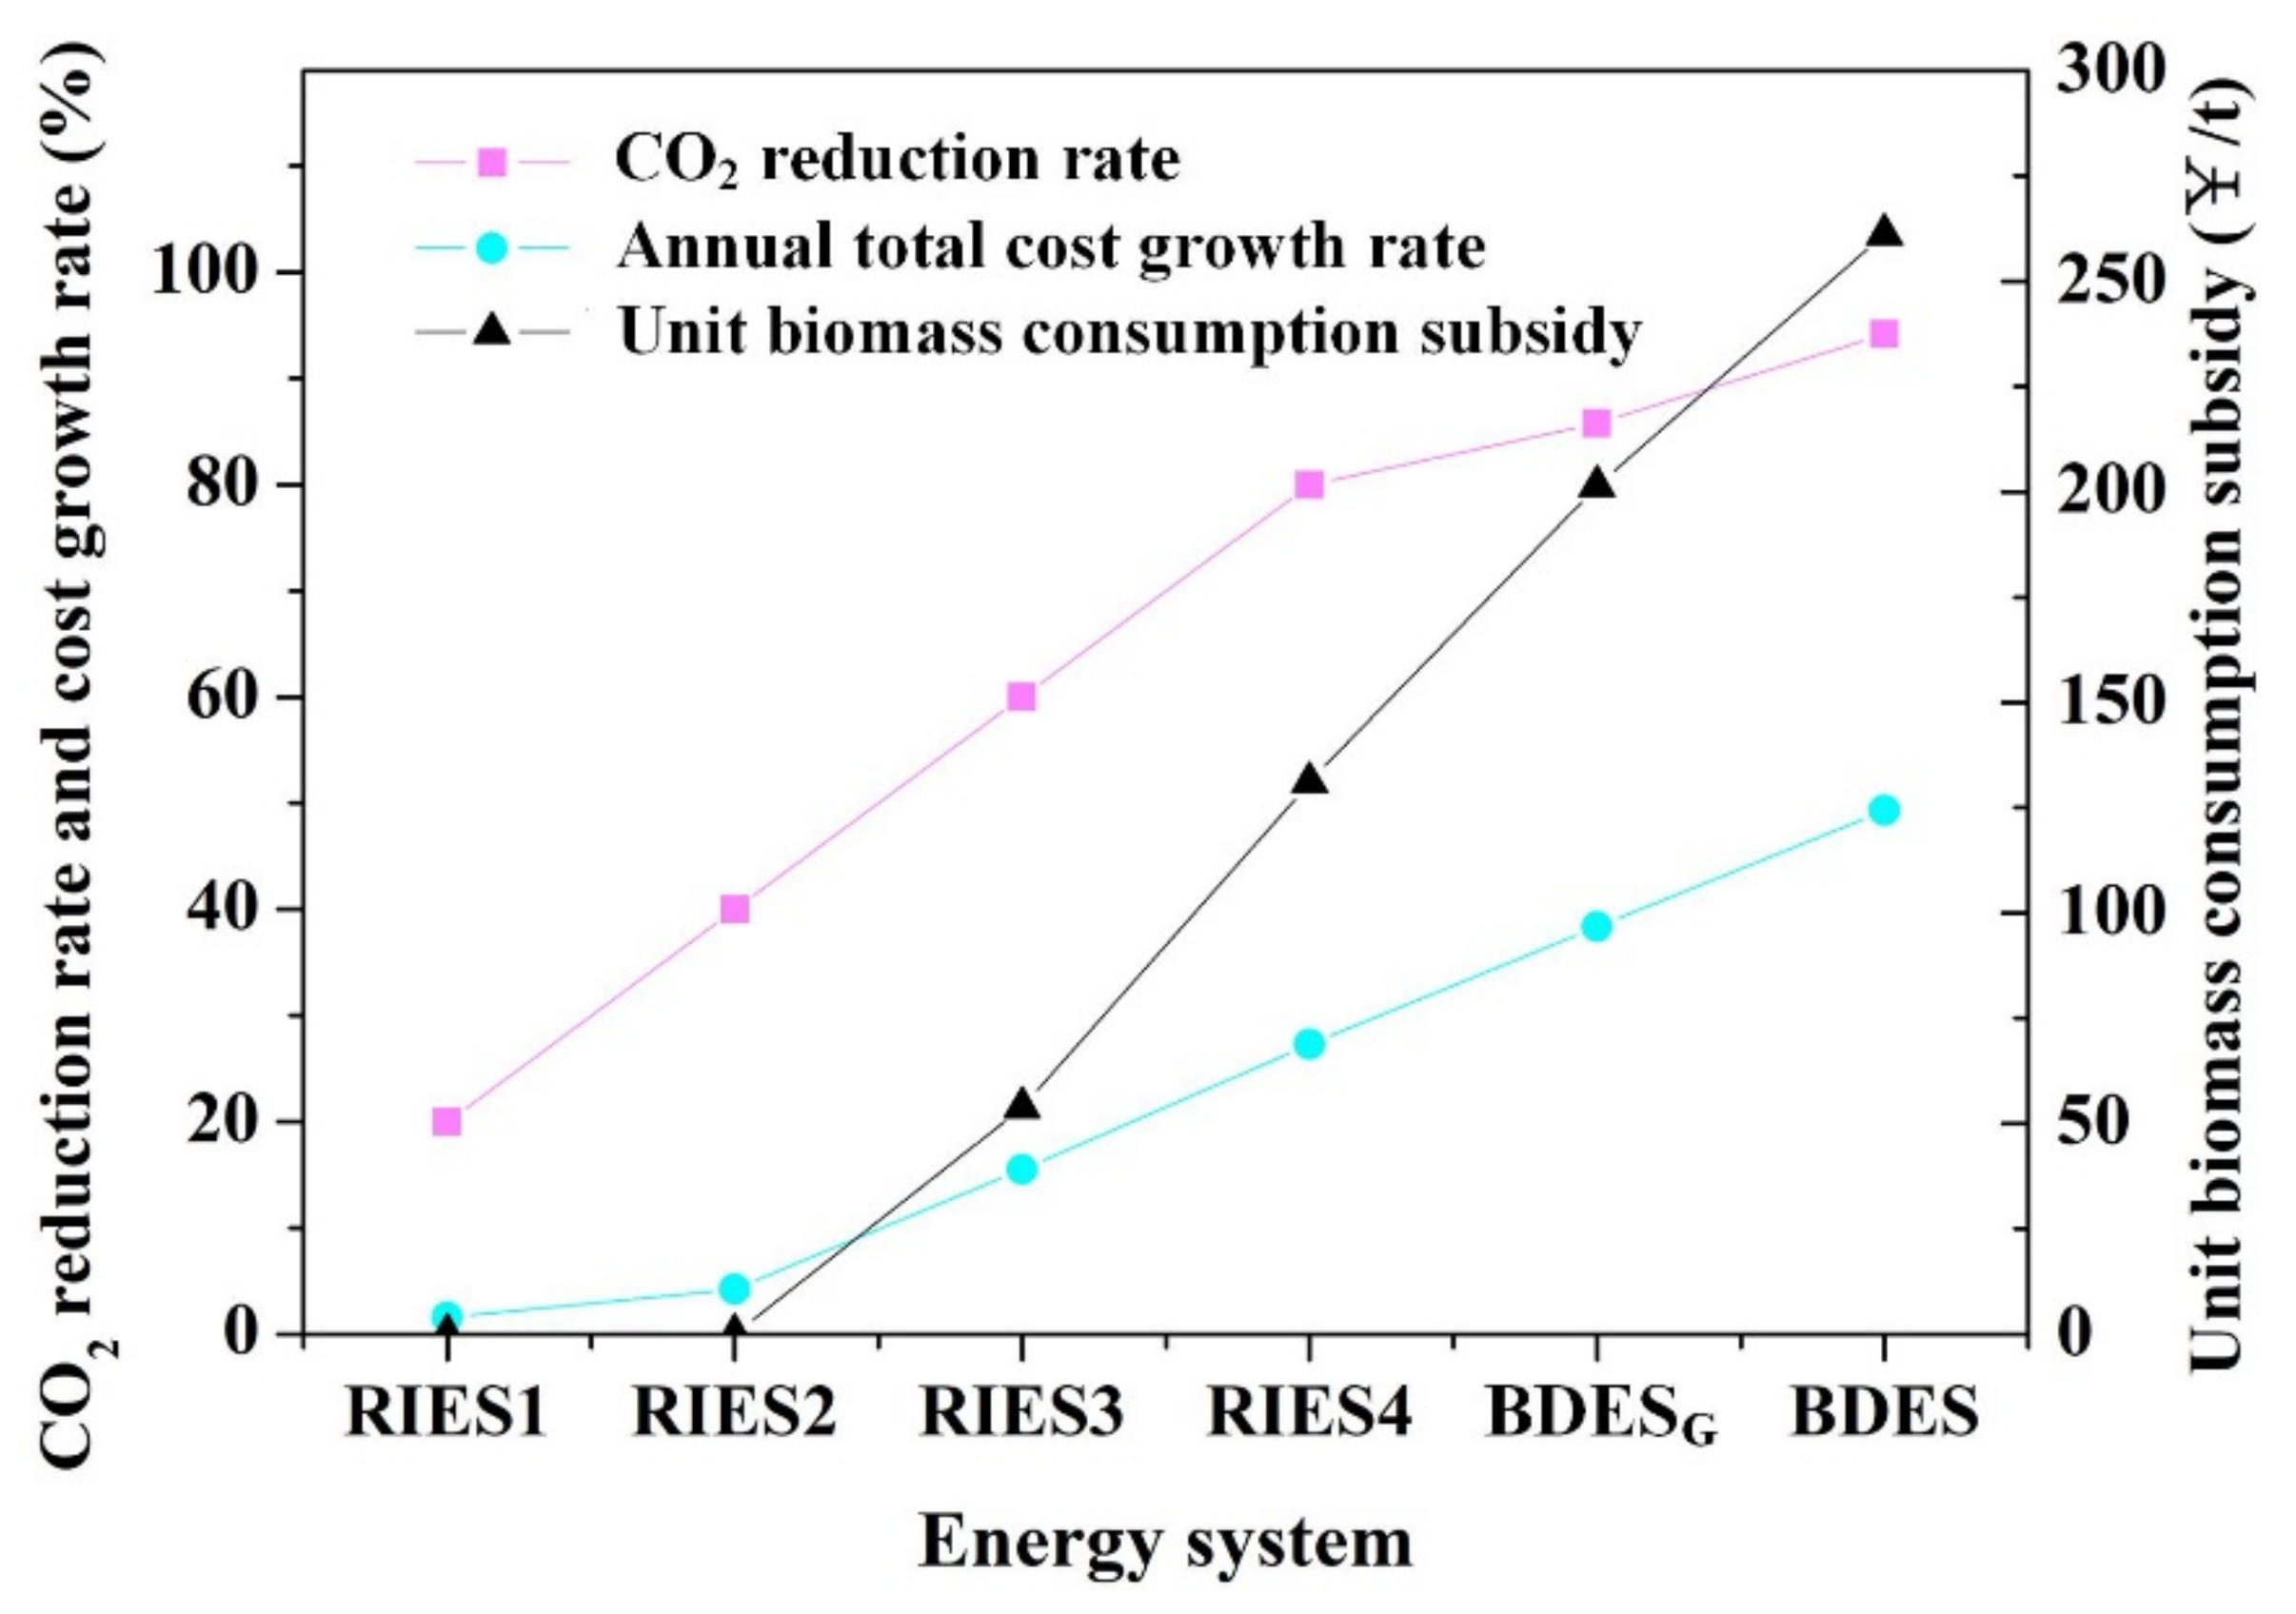
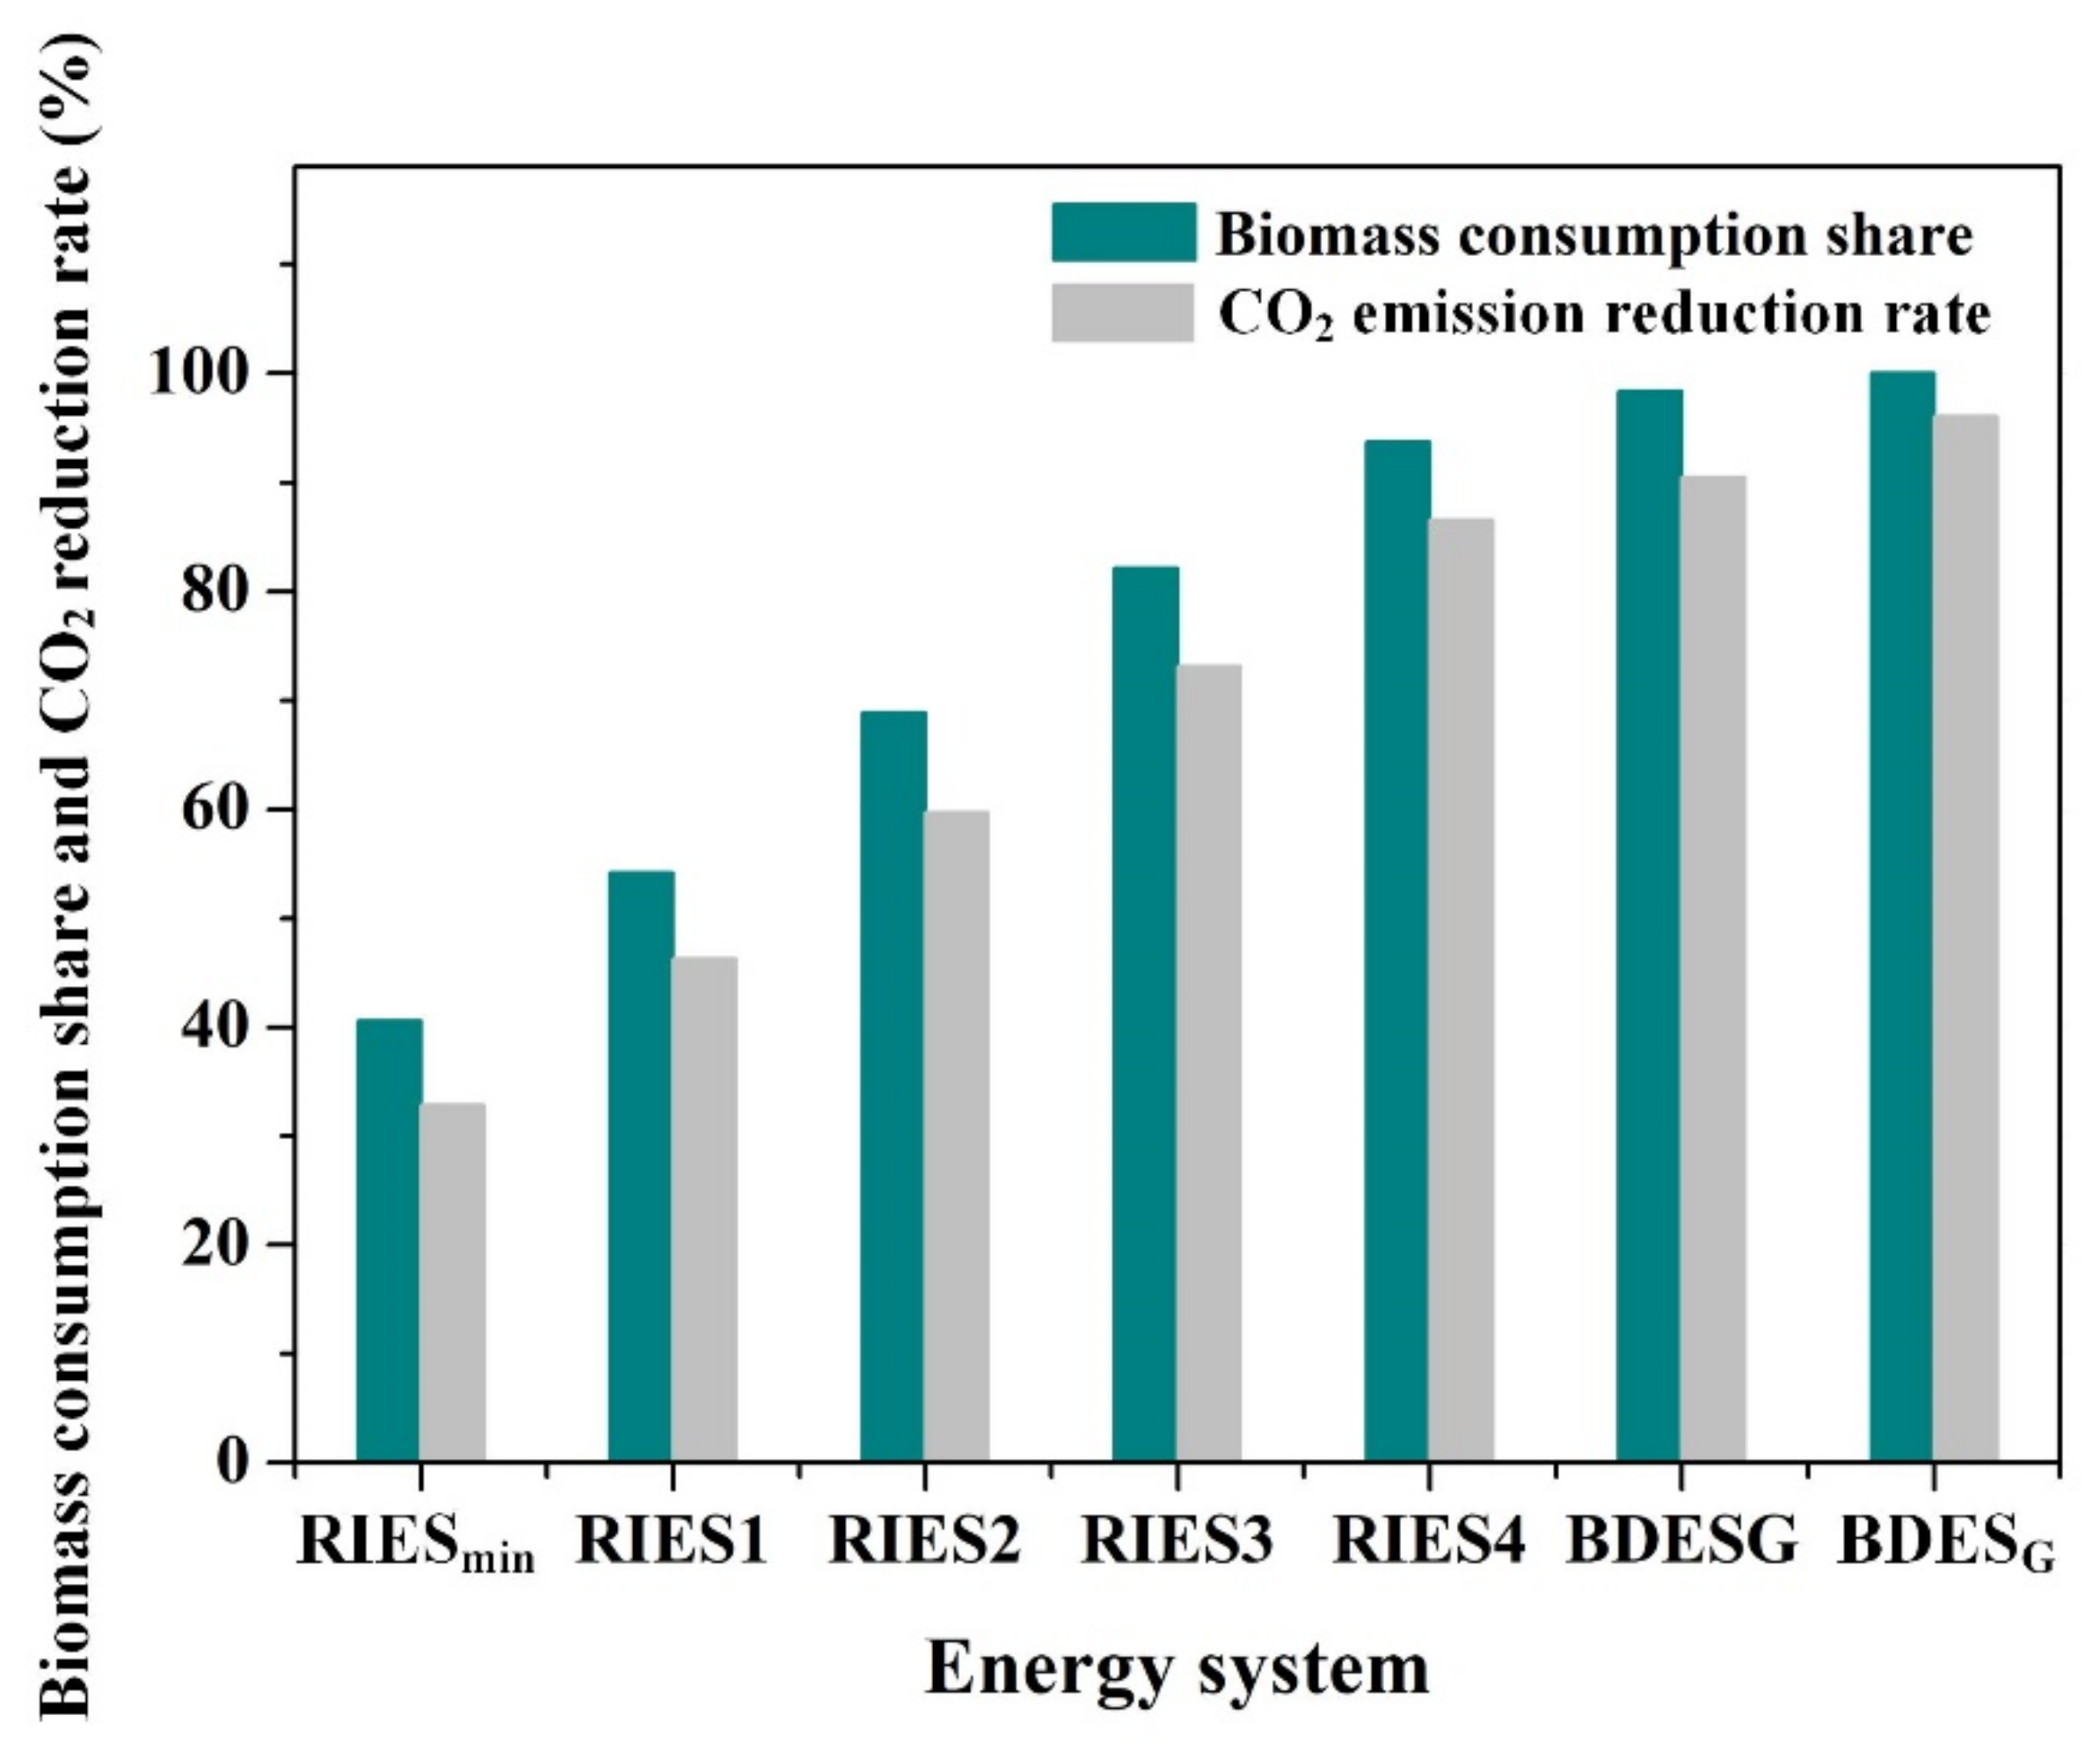
4.2.2. CO2 Emission Reduction Scenario

According to Section 4.2.1, the most cost-saving of these, the RIESmin, can reduce CO2 emissions by 32.85% as compared with the TES. However, if the CO2 emission reduction rate continues to increase, it is necessary to increase the share of biomass and adjust system configuration, which requires a higher investment cost. Mandatory CO2 emission reduction regulations and adaptive subsidy policy are needed to ensure energy structure transformation from coal to straw in the specific area. Thus, in this section, we set up multiple emission reduction scenarios to study the trade-offs between cost-optimal and CO2-optimal solutions. The setting of emission reduction scenario is based on the basic scenarios in Section 4.2.1. First of all, four CO2 emission reduction scenarios based on the RIESmin were prepared, and the annual CO2 emission reduction rate was constrained at 20%, 40%, 60%, and 80%, which were named as RIES1, RIES2, RIES3, and RIES4, respectively. As a supplement, the grid connected BDES scenario (BDESG) without coal boilers was also optimized and analyzed. Additionally, the TES, BDES and RIESmin are added to the above scenarios for comparison. The setting of the above scenarios is the process of realizing a coal-to-straw energy transition in regional wide.
The total annual cost and unit straw consumption subsidy of different scenarios are listed in Table 7. According to the optimization results, in all scenarios, the RIESmin had the minimum total annual cost. In the CO2 emission reduction scenarios (RIES1–4), due to the enhancement of regional CO2 emission reduction regulations, the total annual cost increased as well. Moreover, when the emission reduction rate is controlled within 40%, the total annual cost of RIESs was still cost-effective as compared to the TES. In addition, the total annual cost of the RIESs was comparable to the cost of TES when the emission reduction ratio was between 40% and 60%. However, when the emission reduction ratio was set to 60% or more (scenarios RIES3, RIES4, and BDESs), the total annual cost was higher than that of the TES due to the increased fuel and equipment costs. An incentive of 53.83 to 261.26 RMB/t of straw is needed to subsidize energy enterprises to increase the share of biomass. In the BDESs, the subsidy exceeded 200 RMB/t of straw, which would bring a burden to local finance. The relationship between CO2 reduction rate and cost growth rate are shown in Figure 8. In all of the following systems, the CO2 emission reduction rate obtained was greater than the cost growth rate. However, in the CO2 emission reduction scenarios (RIES1–4), the speed of CO2 reduction rate was rising faster than that of the cost growth rate, while in the BDESs the result was the opposite. Therefore, it can be concluded that the RIESs were cost-benefit approach to mitigate CO2 emissions.
Table 8 shows the changes in system configuration capacity under different scenarios. Emission control policies helps to increase the equipment installed capacity in the BDES. Based on the RIESmin, when the CO2 emission reduction target increased from 20% to 80%, the installed capacity of internal combustion engines, heat recovery system, gas boilers and absorption chillers in the BDES were increased accordingly, while the coal boilers and the electric chiller were gradually replaced. Furthermore, the dependence of local residents on grid electricity was greatly reduced. However, in the four CO2 emission reduction scenarios, there was no evident correlation between the CO2 emission reduction control and the capacity change of the absorption chiller, electric chiller, the grid power transmission. In the RIES1–4, mainly the absorption chillers were operated to supply cooling, while the electric chillers provided the shortfall. In the BDESG scenario, as coal boiler was removed, a larger capacity gasification system and gas boilers were required to meet the heating demand. In addition, grid power and coal boilers were both removed in the BDES scenario, and thus the installed gasification system, internal combustion engine and heat recovery system were the largest.
According to the local residents’ energy needs, the annual energy balance of different scenarios is shown in Figure 9. From the perspective of meeting residents’ electricity load, the main suppliers had changed from public grid to internal combustion engines in the gradually enhanced regional emission reduction control policies. However, in the BDESG, the coal boilers were removed, more grid power was needed to fill the shortfall and further to reduce the annual total cost; thus, the proportion of grid power consumption was increased. Figure 9b,c showed the process of supply structure changes in meeting residents’ cooling and heating load under different scenarios. It was noteworthy that the absorption chillers provided most of the cooling demand in CO2 emission scenarios, but there was no obvious link between the changes in supply proportion and emission reduction. As the cooking gas load was only supplied by gasification system, this paper analyzed the changes of syngas consumption structure from the gasification system (see Figure 9d).
The comparison of energy consumption structure and CO2 emissions under different scenarios are shown in Figure 10. The results show that the RIESs (RIESmin–RIES4) and BDESs (BDESG, BDES) consumed more energy but emitted less CO2 than the TES due to the consumption of more biomass to replace thermal coal and grid power consumption. The share of biomass consumption and CO2 emission reduction ratio with respect to the TES are shown in Figure 11. In the TES scenario, biomass was only used to provide residents with cooking gas. Thus, the share of biomass consumption was the lowest, accounting for only 8.79% of the total energy consumption. Based on the TES scenario, if the regional emission control regulations were implemented, the increased share of biomass consumption should be higher than the emission reduction control ratio by 3%~10%. In the RIESs, the trend of increased share of biomass consumption was consistent with the CO2 emission reduction ratio. In the RIESmin scenario, the share of biomass consumption was 40.58%, and the CO2 emission reduction ratio was 32.85%. In RIES4 scenario, share of biomass consumption reached 93.72%, 53.15% higher than that of the RIESmin scenario, and the CO2 emission reduction ratio reached 86.56%, 53.71% higher than the RIESmin scenario. In the BDESG scenario, as the grid electricity was not completely replaced, the share of biomass consumption was 98.39% and the CO2 emission reduction ratio was 90.45%, both slightly less than the BDES scenario. The BDESs achieved the best CO2 emission reduction ratio as coal was completely replaced by biomass.

5. Conclusions

This paper aimed at exploring a cost-effective approach to realize the fossil to renewable transformation of energy consumption structure under CO2 emission reduction policies in a new rural community. A MILP model was developed to solve the economically optimal design of the RIES, the optimal energy structure and renewable energy subsidy to reach the desired emission control target without increasing the cost of energy supply enterprise excessively. In order to analyze the transition process, the TES and BDES were considered as reference system. Then, a range of emission reduction scenarios from TES based on coal to energy systems based on biomass were investigated, based on which we assessed the trend of cost increase, the change of energy consumption structure and equipment installation combination, and the timing and scale of biomass subsidies with the enhancement of CO2 emission reduction targets. A new rural community in Dalian, China was studied as an emission control area, and the following conclusions can be derived from the optimization process.
Combining the economic benefits of TES and the flexibility of BDES, the application of RIESs (RIESmin, RIES1, RIES2) in new rural communities can reduce total annual costs as compared to those of separate TES and BDES.
The RIESmin, which achieved the lowest total annual cost, had a 32.85% of CO2 reduction rate by a 31.79% increase in biomass consumption share as compared to the TES. The most economical installation capacity of the internal combustion engine was up to 100 kW, with a heat recovery system of 149 kW, an absorption chiller of 2440 kW and a gas boiler of 350 kW.
By optimizing the share of energy consumption, design and operation of the RIESs, the CO2 emissions reduction rate obtained was higher than the growth of the paid cost. Using TES as a reference, more than 60% of CO2 emission reduction could be obtained without increasing excessive cost. When the desired target of CO2 emission reduction exceeded 60%, adaptive incentives (53.83–260.26 RMB/tbiomass) would be required to cover the excessive cost and increase the competitiveness of the RIESs.
From the perspective of share of local biomass consumption, the growth rate of biomass consumption share was higher than the set target of the regional CO2 emission reduction rate. Based on the CIESmin, a target of 20% emission reduction rate would lead to a more than 50% increase in the share of local biomass consumption.
According to the current study, the introduction of BDES to the local TES could obtain both cost reduction and CO2 emission reduction to a certain extent. However, to further reduce emission and increase biomass penetration rate, portfolio environmental policies (e.g., CO2 emission control policy, renewable subsidy policy) should be formulated to promote the transition process. Besides, only biomass straw was selected as energy resource, and other biomass resource (e.g., forest biomass, woody waste) were not included in this paper. Future works should focus on expending the study area.

Author Contributions

Conceptualization, X.L. (Xinxin Liu); methodology, X.L. (Xinxin Liu); software, F.L.; formal analysis, X.L. (Xinxin Liu); data curation, N.L.; writing—original draft preparation, X.L. (Xinxin Liu); writing—review and editing, L.L. and X.L. (Xiaoyu Liu); funding acquisition, H.M. and L.L.; All authors have read and agreed to the published version of the manuscript.

Funding

This research was funded by National Natural Science Foundation of China, grant number 51976020 and 71904179.

Institutional Review Board Statement

Not applicable.

Acknowledgments

The authors gratefully acknowledge the financial support from the National Natural Science Foundation of China (51976020) and the National Natural Science Foundation of China (71904179).

Conflicts of Interest

The authors declare no conflict of interest.

References

  1. Mandal, S.; Das, B.K.; Hoque, N. Optimum sizing of a stand-alone hybrid energy system for rural electrification in Bangladesh. J. Clean. Prod. 2018, 200, 12–27. [Google Scholar] [CrossRef]
  2. Adelaja, A.O. Barriers to national renewable energy policy adoption: Insights from a case study of Nigeria. Energy Strategy Rev. 2020, 30, 100519. [Google Scholar] [CrossRef]
  3. Luo, X.; Liu, J.; Liu, Y.; Liu, X. Bi-level optimization of design, operation, and subsidies for standalone solar/diesel multi-generation energy systems. Sustain. Cities Soc. 2019, 48, 101592. [Google Scholar] [CrossRef]
  4. IRN21. Renewables 2019 global status report. In Renewable Energy Policy Network; IRN21: Paris, France, 2019. [Google Scholar]
  5. Robertson Munro, F.; Cairney, P. A systematic review of energy systems: The role of policymaking in sustainable transitions. Renew. Sustain. Energy Rev. 2020, 119, 109598. [Google Scholar] [CrossRef]
  6. Oshiro, K.; Fujimori, S.; Ochi, Y.; Ehara, T. Enabling energy system transition toward decarbonization in Japan through energy service demand reduction. Energy 2021, 227, 120464. [Google Scholar] [CrossRef]
  7. Fragkos, P.; Laura van Soest, H.; Schaeffer, R.; Reedman, L.; Köberle, A.C.; Macaluso, N.; Evangelopoulou, S.; De Vita, A.; Sha, F.; Qimin, C.; et al. Energy system transitions and low-carbon pathways in Australia, Brazil, Canada, China, EU-28, India, Indonesia, Japan, Republic of Korea, Russia and the United States. Energy 2021, 216, 119385. [Google Scholar] [CrossRef]
  8. Xiao, M.; Simon, S.; Pregger, T. Scenario analysis of energy system transition—A case study of two coastal metropolitan regions, eastern China. Energy Strategy Rev. 2019, 26, 100423. [Google Scholar] [CrossRef]
  9. Li, T.; Liu, P.; Li, Z. Quantitative relationship between low-carbon pathways and system transition costs based on a multi-period and multi-regional energy infrastructure planning approach: A case study of China. Renew. Sustain. Energy Rev. 2020, 134, 110159. [Google Scholar] [CrossRef]
  10. Lei, Y.; Hou, K.; Wang, Y.; Jia, H.; Zhang, P.; Mu, Y.; Jin, X.; Sui, B. A new reliability assessment approach for integrated energy systems: Using hierarchical decoupling optimization framework and impact-increment based state enumeration method. Appl. Energy 2018, 210, 1237–1250. [Google Scholar] [CrossRef]
  11. Wang, C.; Lv, C.; Li, P.; Song, G.; Li, S.; Xu, X.; Wu, J. Modeling and optimal operation of community integrated energy systems: A case study from China. Appl. Energy 2018, 230, 1242–1254. [Google Scholar] [CrossRef]
  12. Dong, R.; Yu, Y.; Zhang, Z. Simultaneous optimization of integrated heat, mass and pressure exchange network using exergoeconomic method. Appl. Energy 2014, 136, 1098–1109. [Google Scholar] [CrossRef]
  13. Das, B.K.; Hassan, R.; Tushar, M.S.H.K.; Zaman, F.; Hasan, M.; Das, P. Techno-economic and environmental assessment of a hybrid renewable energy system using multi-objective genetic algorithm: A case study for remote Island in Bangladesh. Energy Convers. Manag. 2021, 230, 113823. [Google Scholar] [CrossRef]
  14. Moslehi, S.; Reddy, T.A. An LCA methodology to assess location-specific environmental externalities of integrated energy systems. Sustain. Cities Soc. 2019, 46, 101425. [Google Scholar] [CrossRef]
  15. Vaccari, M.; Mancuso, G.M.; Riccardi, J.; Cantù, M.; Pannocchia, G. A Sequential Linear Programming algorithm for economic optimization of Hybrid Renewable Energy Systems. J. Process Control 2019, 74, 189–201. [Google Scholar] [CrossRef]
  16. Dixit, S. Solar technologies and their implementations: A review. Mater. Today Proc. 2020, 28, 2137–2148. [Google Scholar] [CrossRef]
  17. Behar, O.; Sbarbaro, D.; Moran, L. Which is the most competitive solar power technology for integration into the existing copper mining plants: Photovoltaic (PV), Concentrating Solar Power (CSP), or hybrid PV-CSP? J. Clean. Prod. 2021, 287, 125455. [Google Scholar] [CrossRef]
  18. Elkinton, M.R.; McGowan, J.G.; Manwell, J.F. Wind power systems for zero net energy housing in the United States. Renew. Energy 2009, 34, 1270–1278. [Google Scholar] [CrossRef]
  19. Manwell, J.F.; McGowan, J.G.; Breger, D. A design and analysis tool for utility scale power systems incorporating large scale wind, solar photovoltaics and energy storage. J. Energy Storage 2018, 19, 103–112. [Google Scholar] [CrossRef]
  20. Zeyringer, M.; Fais, B.; Keppo, I.; Price, J. The potential of marine energy technologies in the UK—Evaluation from a systems perspective. Renew. Energy 2018, 115, 1281–1293. [Google Scholar] [CrossRef]
  21. Soudan, B. Community-scale baseload generation from marine energy. Energy 2019, 189, 116134. [Google Scholar] [CrossRef]
  22. Saber, H.; Mazaheri, H.; Ranjbar, H.; Moeini-Aghtaie, M.; Lehtonen, M. Utilization of in-pipe hydropower renewable energy technology and energy storage systems in mountainous distribution networks. Renew. Energy 2021, 172, 789–801. [Google Scholar] [CrossRef]
  23. Creţan, R.; Vesalon, L. The Political Economy of Hydropower in the Communist Space: Iron Gates Revisited. Tijdschr. Econ. Soc. Geogr. 2017, 108, 688–701. [Google Scholar] [CrossRef]
  24. Vãran, C.; Creţan, R. Place and the spatial politics of intergenerational remembrance of the Iron Gates displacements in Romania, 1966–1972. Area 2018, 50, 509–519. [Google Scholar] [CrossRef]
  25. Emenike, O.; Michailos, S.; Finney, K.N.; Hughes, K.J.; Ingham, D.; Pourkashanian, M. Initial techno-economic screening of BECCS technologies in power generation for a range of biomass feedstock. Sustain. Energy Technol. Assess. 2020, 40, 100743. [Google Scholar]
  26. Stolarski, M.J.; Warmiński, K.; Krzyżaniak, M.; Olba–Zięty, E.; Akincza, M. Bioenergy technologies and biomass potential vary in Northern European countries. Renew. Sustain. Energy Rev. 2020, 133, 110238. [Google Scholar] [CrossRef]
  27. Awasthi, M.K.; Sarsaiya, S.; Patel, A.; Juneja, A.; Singh, R.P.; Yan, B.; Awasthi, S.K.; Jain, A.; Liu, T.; Duan, Y.; et al. Refining biomass residues for sustainable energy and bio-products: An assessment of technology, its importance, and strategic applications in circular bio-economy. Renew. Sustain. Energy Rev. 2020, 127, 109876. [Google Scholar] [CrossRef]
  28. Shahbaz, M.; Al-Ansari, T.; Aslam, M.; Khan, Z.; Inayat, A.; Athar, M.; Naqvi, S.R.; Ahmed, M.A.; McKay, G. A state of the art review on biomass processing and conversion technologies to produce hydrogen and its recovery via membrane separation. Int. J. Hydrogen Energy 2020, 45, 15166–15195. [Google Scholar] [CrossRef]
  29. Sadi, M.; Chakravarty, K.H.; Behzadi, A.; Arabkoohsar, A. Techno-economic-environmental investigation of various biomass types and innovative biomass-firing technologies for cost-effective cooling in India. Energy 2021, 219, 119561. [Google Scholar] [CrossRef]
  30. Ellabban, O.; Abu-Rub, H.; Blaabjerg, F. Renewable energy resources: Current status, future prospects and their enabling technology. Renew. Sustain. Energy Rev. 2014, 39, 748–764. [Google Scholar] [CrossRef]
  31. Wu, N.; Zhan, X.; Zhu, X.; Zhang, Z.; Lin, J.; Xie, S.; Meng, C.; Cao, L.; Wang, X.; Shah, N.; et al. Analysis of biomass polygeneration integrated energy system based on a mixed-integer nonlinear programming optimization method. J. Clean. Prod. 2020, 271, 122761. [Google Scholar] [CrossRef]
  32. Maneerung, T.; Li, X.; Li, C.; Dai, Y.; Wang, C.-H. Integrated downdraft gasification with power generation system and gasification bottom ash reutilization for clean waste-to-energy and resource recovery system. J. Clean. Prod. 2018, 188, 69–79. [Google Scholar] [CrossRef]
  33. Ahrenfeldt, J.; Thomsen, T.P.; Henriksen, U.; Clausen, L.R. Biomass gasification cogeneration—A review of state of the art technology and near future perspectives. Appl. Therm. Eng. 2013, 50, 1407–1417. [Google Scholar] [CrossRef] [Green Version]
  34. Murugan, S.; Horák, B. Tri and polygeneration systems—A review. Renew. Sustain. Energy Rev. 2016, 60, 1032–1051. [Google Scholar] [CrossRef]
  35. Wegener, M.; Malmquist, A.; Isalgué, A.; Martin, A. Biomass-fired combined cooling, heating and power for small scale applications—A review. Renew. Sustain. Energy Rev. 2018, 96, 392–410. [Google Scholar] [CrossRef] [Green Version]
  36. Ren, H.; Zhou, W.; Nakagami, K.I.; Gao, W. Integrated design and evaluation of biomass energy system taking into consideration demand side characteristics. Energy 2010, 35, 2210–2222. [Google Scholar] [CrossRef]
  37. Bet Sarkis, R.; Zare, V. Proposal and analysis of two novel integrated configurations for hybrid solar-biomass power generation systems: Thermodynamic and economic evaluation. Energy Convers. Manag. 2018, 160, 411–425. [Google Scholar] [CrossRef]
  38. Zhong, L. The Status Quo and Countermeasures of Comprehensive Utilization of Biomass Stalks. China Resour. Compr. Util. 2017, 35, 72–74. (In Chinese) [Google Scholar]
  39. Mu, X.; Yu, S.; Xu, P. Review on utilizing rural biomass as energy. Mod. Chem. Ind. 2018, 38, 9–13,15. (In Chinese) [Google Scholar]
  40. Chen, Y. A Study on the Construction of New Rural Community in Dalian City. Master’s Thesis, Bohai University, Jinzhou, China, 2016. [Google Scholar]
  41. Zhang, W.; Wang, C.; Zhang, L.; Xu, Y.; Cui, Y.; Lu, Z.; Streets, D.G. Evaluation of the performance of distributed and centralized biomass technologies in rural China. Renew. Energy 2018, 125, 445–455. [Google Scholar] [CrossRef]
  42. Molavi, A.; Lim, G.J.; Shi, J. Stimulating sustainable energy at maritime ports by hybrid economic incentives: A bilevel optimization approach. Appl. Energy 2020, 272, 115188. [Google Scholar] [CrossRef]
  43. Tang, M.; Li, X.; Zhang, Y.; Wu, Y.; Wu, B. From command-and-control to market-based environmental policies: Optimal transition timing and China’s heterogeneous environmental effectiveness. Econ. Model. 2020, 90, 1–10. [Google Scholar] [CrossRef]
  44. Shen, N.; Deng, R.; Liao, H.; Shevchuk, O. Mapping renewable energy subsidy policy research published from 1997 to 2018: A scientometric review. Utilities Policy 2020, 64, 101055. [Google Scholar] [CrossRef]
  45. Wang, Q.; Li, S.; Pisarenko, Z. Heterogeneous effects of energy efficiency, oil price, environmental pressure, R&D investment, and policy on renewable energy—Evidence from the G20 countries. Energy 2020, 209, 118322. [Google Scholar]
  46. Wang, J.-J.; Xu, Z.-L.; Jin, H.-G.; Shi, G.-h.; Fu, C.; Yang, K. Design optimization and analysis of a biomass gasification based BCHP system: A case study in Harbin, China. Renew. Energy 2014, 71, 572–583. [Google Scholar] [CrossRef]
  47. Jensen, I.G.; Münster, M.; Pisinger, D. Optimizing the supply chain of biomass and biogas for a single plant considering mass and energy losses. Eur. J. Oper. Res. 2017, 262, 744–758. [Google Scholar] [CrossRef] [Green Version]
  48. Li, L.; Mu, H.; Li, N.; Li, M. Economic and environmental optimization for distributed energy resource systems coupled with district energy networks. Energy 2016, 109, 947–960. [Google Scholar] [CrossRef]
  49. Wang, H.; Yan, J.; Dong, L. Simulation and economic evaluation of biomass gasification with sets for heating, cooling and power production. Renew. Energy 2016, 99, 360–368. [Google Scholar] [CrossRef]
  50. Li, M.; Mu, H.; Li, N.; Ma, B. Optimal design and operation strategy for integrated evaluation of CCHP (combined cooling heating and power) system. Energy 2016, 99, 202–220. [Google Scholar] [CrossRef]
  51. Li, L. Benefits Evaluation of Building-Scale and District-Scale Cooling Heating and Power System. Ph.D. Thesis, Dalian University of Technology, Dalian, China, 2017. [Google Scholar]
  52. Jon Lee, S.L. Mixed Integer Nonlinear Programming; The IMA Volumes in Mathematics and Its Applications; Springer: New York, NY, USA, 2012. [Google Scholar]
  53. Urbanucci, L. Limits and potentials of Mixed Integer Linear Programming methods for optimization of polygeneration energy systems. Energy Procedia 2018, 148, 1199–1205. [Google Scholar] [CrossRef]
  54. Zhang, Z.; Jing, R.; Lin, J.; Wang, X.; van Dam, K.H.; Wang, M.; Meng, C.; Xie, S.; Zhao, Y. Combining agent-based residential demand modeling with design optimization for integrated energy systems planning and operation. Appl. Energy 2020, 263, 114623. [Google Scholar] [CrossRef]
  55. Rentizelas, A.A.; Tatsiopoulos, I.P.; Tolis, A. An optimization model for multi-biomass tri-generation energy supply. Biomass Bioenergy 2009, 33, 223–233. [Google Scholar] [CrossRef] [Green Version]
  56. Yang, Y.; Zhang, S.; Xiao, Y. Optimal design of distributed energy resource systems coupled with energy distribution networks. Energy 2015, 85, 433–448. [Google Scholar] [CrossRef]
  57. Optimization, G. Gurobi Optimizer Reference Manual [EB/OL]. Available online: http://www.gurobi.com (accessed on 7 December 2018).
  58. Xiannan, H.; Gang, L. Research on coal price index—A review. China Price 2018, 12, 73–75. (In Chinese) [Google Scholar]
  59. Tianjin Port Trading Market Network Bohai-Rim Steam-Coal Price Index [EB/OL]. Available online: http://www.exbulk.com/show-89-129028-1.html (accessed on 3 April 2019).
  60. Dalian Development and Reform Commission Residential Electricity Price List [EB/OL]. Available online: http://www.pc.dl.gov.cn/html/Zhu/0e44568928f84eaba2eb3706496900d8.html (accessed on 1 March 2019).
  61. Sun, L.; Zhang, X. Principle and Technology of Biomass Pyrolysis Gasification; Chemical Industry Press: Beijing, China, 2013. (In Chinese) [Google Scholar]
  62. Haiqi New Energy Group Biomass Gasifier [EB/OL]. Available online: http://www.haiqienergy.com/chanpinzhongxin/qihualu-.html (accessed on 12 January 2019).
  63. Shandong Lvhuan Power Equipment Co., Ltd. Biomass Gas Generator Set [EB/OL]. Available online: http://www.lvhuandongli.com/products/lm5/ (accessed on 15 January 2019).
  64. Shanghai Industrial Boiler Research Institute. Parameters for Hot Water Boilers; China National Standardization Administration: Beijing, China, 2004. [Google Scholar]
  65. Shandong Honglai Energy Saving and Environmental Protection Technology Co., Ltd. Hot Water Type Lithium Bromide Absorption Chiller. Available online: http://www.hongyilai.com (accessed on 15 January 2019).
  66. Wensehng, Z.; Shulin, Z.; Jianqiong, M.; Shien, H. The estimate calculation to thermal efficiency of medium and mini-type gas fired boiler. Ind. Boil. 2005, 1, 20–22. (In Chinese) [Google Scholar]
  67. Jin, Z.; Xiafu, L.; Weidi, H.; Liwei, T.; Lan, W. Comparative analysis of comprehensive cost of gas-fired and coal-fired boilers. Shandong Chem. Ind. 2016, 45, 199–200, 202. (In Chinese) [Google Scholar]
  68. Li, L.; Mu, H.; Li, N.; Li, M. Analysis of the integrated performance and redundant energy of CCHP systems under different operation strategies. Energy Build. 2015, 99, 231–242. [Google Scholar] [CrossRef]
  69. Liu, J. Influence of boiler load change on operating efficiency and control. Sci. Technol. Innov. 2008, 32, 34. (In Chinese) [Google Scholar]
  70. Li, L.; Mu, H.; Gao, W.; Li, M. Optimization and analysis of CCHP system based on energy loads coupling of residential and office buildings. Appl. Energy 2014, 136, 206–216. [Google Scholar] [CrossRef]
  71. Tianming, G.; Fengying, Z.; Qiang, Y.; Yan, Z. Comparison of main air pollutant emission in different ways of coal utilization. China Min. Mag. 2017, 26, 74–80, 95. (In Chinese) [Google Scholar]
  72. Xiaoming, M.; Shen, C.; Jiekang, W.; Zhuangzhi, G. Optimal dispatching of microgrid containing battery under time-of-use price mechanism. Power Syst. Technol. 2015, 39, 1192–1197. [Google Scholar]
  73. Xiaoliang, Z.; Ruhong, W.; Da, Y. Residential building environment simulation software DeST-h. In Proceedings of the National HVAC Refrigeration Academic Conference, Lanzhou, China, 11–14 August 2004. [Google Scholar]
  74. Ministry of Housing and Urban-Rural Development of the People’s Republic of China. Code for Design of City Gas Engineering; China Architecture & Building Press: Beijing, China, 2006.
Figure 1. Schematic diagram of the proposed RIES.
Energies 14 02879 g001
Figure 2. The optimization procedure of the MILP model.
Energies 14 02879 g002
Figure 3. Energy load of residential building.
Energies 14 02879 g003
Figure 4. Total annual cost (ATC, thousand RMB) and cost composition of TES, BDES and RIESmin.
Energies 14 02879 g004
Figure 5. Energy balance on typical days: (ai) Energy balance on typical winter day; (ju) Energy balance on typical summer day.
Energies 14 02879 g005
Figure 6. Total energy consumption (TEC, tce) and energy consumption structure of TES, BDES and RIESmin (equivalent value).
Energies 14 02879 g006
Figure 7. Annual CO2 emission (ACE, t) and emission structure of TES, BDES and RIESmin.
Energies 14 02879 g007
Figure 8. CO2 reduction rate, cost growth rate and unit biomass subsidy.
Energies 14 02879 g008
Figure 9. Annual energy balance of different scenarios: (a) Electricity balance; (b) Cooling balance; (c) Heating balance; (d) Syngas balance.
Energies 14 02879 g009
Figure 10. Energy consumption structure and annual CO2 emission of different scenarios.
Energies 14 02879 g010
Figure 11. CO2 emission reduction rate and biomass consumption share of different scenarios.
Energies 14 02879 g011
Table 1. Energy supply side characteristics and price.
ItemComponentSymbolValueSource
1.Fuel characteristics
CoalLow heating valueLHVCoal5000 cal/kg[59]
BiomassLow heating value
(dry and ash-free basis)
LHVBiomass18.4 MJ/kg[61]
High heating value
(dry and ash-free basis)
HHVBiomass19.7 MJ/kg[61]
Moisture content 15~20%[61]
SyngasLow heating value
(Air gasification)
LHVSyngas5 MJ/m3[61]
2.Fuel price
CoalBohai-Rim steam coal pricePCoal560 RMB/t[59]
BiomassPurchase pricePBiomass110 RMB/t/
Collecting pricePCollection24 RMB/t
Transportation pricePTransport2.7 RMB/t·km
Pretreatment pricePPretreat165 RMB/t
Storage pricePStorage0.25 RMB/m3·d
3.Electricity tariffAnnual electricity consumption
per household (0~2640 kWh)
GT0.5 RMB/kWh[60]
Annual electricity consumption
per household (2640~3720 kWh)
0.55 RMB/kWh
Annual electricity consumption
per household (>3720 kWh)
0.8 RMB/kWh
Table 2. Local biomass resources evaluation.
ItemRiceCornMilletSorghumLegumePeanut
Crop planting proportion (%)8.17%74.80%0.68%0.30%13.51%2.52%
Crop acreage (km2)1.039.390.090.041.700.32
Unit area yields (t/km2)527.40353.05184.44653.01176.77213.13
Crop yields (t)541.393316.2415.8124.65299.9967.52
Crop residue and crop yield ratio (%)0.901.431.601.601.600.80
Acquirement coefficient (%)0.830.950.850.900.560.70
Available resources (t) 404.424505.1121.5035.49268.7937.81
Available periodAugust–SeptemberSeptember–OctoberAugust–SeptemberAugust–SeptemberJuly–AugustAugust–September
Table 3. Equipment technical parameters.
ItemAlternative Capacity RangeEfficiency/COPLoad RangeSource
GS600–5000 Nm3/h70%-[62]
ICE50–5030 kW0.0175ln(CapICE) + 0.2150.25–1[46,51,63]
HRS-80.0%-[68]
GB350–174,000 kW0.0125ln(CapGB) + 0.7810.48–1[64,66]
CB350–174,000 kW0.020ln(CapCB) + 0.5960.6–1[64,69]
AC350–6980 kW1.420.05–1.15[50,56,65]
EC-4.73-[50]
HE-80%-[70]
Table 4. Equipment price parameters.
ItemUnit Capital Cost (RMB/kW) Unit O&M Cost (RMB/kWh) Source
GS25000.0322[46]
ICE−500.70ln(CapICE) + 8562.680.0558[50]
HRS 8060.01674[50]
GB6200.01674[50]
CB8680.03013[67]
AC1066.40.0062[50]
EC632.40.0093[50]
HE2000.01674[50]
Table 5. CO2 emission parameters.
Energy SourcesTechniquesCO2 Emission FactorSource
CoalBoiler1878.61 g/kg[71]
Coal dominatedGrid889 g/kWh[72]
BiomassBDES39.6 g/kg[46]
Table 6. Equipment installation comparison of 500 households.
Installation CapacityGSICEHRSGBCBHEACCC
(Nm3)(kW)(kW)(kW)(kW)(kW)(kW)(kW)
TES600///29002281/2906
(1×600) (1×350, 3×500, 1×1050)
BDES30002804132450/22812320238
(1×600, 2×1200)(1×280) (1×350, 1×700, 1×1400) (1×580, 1×1740)
RIESmin600100149350240022812440100
(1×600)(1×100) (1×350)(1×350, 2×500, 1×1050) (2×350, 1×1740)
Table 7. Annual total cost and subsidy of different scenarios.
CaseAnnual Total Cost without SubsidyAnnual Total Cost with SubsidyUnit Straw Consumption Subsidy
(10 Thousand RMB)(10 Thousand RMB)(RMB/t)
TES208.38208.380.00
CIESmin190.65190.650.00
CIES1193.57193.570.00
CIES2198.71198.710.00
CIES3220.18208.3853.83
CIES4242.71208.38131.08
BDESG263.79208.38201.39
BDES284.64208.38261.26
Table 8. Equipment installation capacity comparison of different scenarios.
Installation CapacityGSGridICEHRSGBCBHEACEC
(Nm3)(kW)(kW)(kW)(kW)(kW)(kW)(kW)(kW)
TES600842///29002281/2906
RIESmin600264100149350240022812440100
RIES1600145150223350240022812440143
RIES2600206150223350240022812150433
RIES312001381502231050170022812440112
RIES418001911502231750105022812210364
BDESG24002681502233300/22812380169
BDES3000/2804132450/22812320238
Publisher’s Note: MDPI stays neutral with regard to jurisdictional claims in published maps and institutional affiliations.

