1. Introduction
Recently, the US Department of Energy’s (DOE) National Energy Technology Laboratory (NETL) has focused efforts on understanding the effect of scale in circulating fluidized beds by comparing performance between two risers. The pilot scale circulating fluidized bed has a riser diameter of 0.3048 m and a height of 15.3 m, while the smaller 1/3rd scale unit has a riser diameter of 0.1 m and a height of 4.88 m. This led to the discovery that significantly different solids profiles existed within the two different risers, with the smaller riser exhibiting much more dilute conditions when operated under similar environments. Unfortunately, this dilute flow is inconsistent with the generalized riser regime map, based on riser velocity (
Ug/Utr2) and solids flux (
Gs/Gs*), developed previously [
1]. This suggests that the riser scale, in particular riser diameter, plays a significant role in determining the saturation carrying capacity,
Gs*. Based on a literature review and data mining of over 20 years of operational test data from a cold flow circulating fluidized bed (CFB) unit at NETL, it was quickly identified that both Geldart Group A and Group B powders had different functionalities. The results from the analysis of the Group B powder data sets can be found in Breault et al. [
2] and summarized below. This work focuses on Geldart Group A powders using both literature and NETL experimental data.
As previously noted, Breault et al. [
2] developed a new Geldart Group B powder empirical model for the saturation carrying capacity,
Gs*. The correlation is
where
Dr is the riser diameter in m,
Ar is the Archimedes number, and
dp is the particle size in µm. The empirical model was demonstrated to accurately represent a wide range of experimental data, with a 0.95 correlation coefficient, including riser diameters ranging from 0.06 to 0.3 m, particle sizes ranging from 160 µm to 890 µm, and Archimedes numbers ranging from 297 to 20,370.
A discussion of existing saturation carrying capacity literature [
2,
3,
4,
5,
6,
7,
8,
9,
10,
11,
12,
13,
14,
15] is provided below and summarized in
Table 1.
As noted in Breault et al. [
2], Bai and Kato [
3] were the initial researchers writing the first full-length paper on saturation carrying capacity. They examined the effects of riser radius and gas velocity on the saturation carrying capacity of Geldart Group A powders. They looked at relatively small, from a commercial perspective, riser diameters including 0.066 m, 0.097 m, and 0.15 m. They found no dependence of the saturation carrying capacity on the riser diameter. It was only dependent on the particle properties and gas velocity.
Xu, the most widely published investigator on the topic, published four papers [
4,
5,
6,
7]. In the three publications working with Kato, he used the same facility as Bai and Kato [
3]. Xu et al. [
4], in their first work, conducted tests in risers with diameters of 0.066, 0.097, and 0.15 m, all having a height of 3 m. Xu [
4], unlike Bia and Kato [
3], observed that the saturation carrying capacity was dependent on the riser diameter, increasing with increasing the riser diameter for FCC, a Geldart Group A powder and decreasing with increasing diameter for sand, a Geldart Group B material. This latter find is consistent with the recently published correlation by Breault et al. [
2] discussed above. Further analyzing his data [
4], Xu et al. [
5] concluded that the particle properties (size and density) also affect the saturation carrying capacity in addition to riser diameter. Xu et al. [
6,
7] continued working on saturation carrying capacity, adding more Geldart Group B materials developing the correlations in
Table 1.
Monazam et al. [
8] published results for tests using PVC with a particle density of 1420 kg/m
3 and a particle diameter of 180 µm (Geldart Group B). Those tests were conducted in NETL’s large experimental facility with a riser diameter and height of 0.3048 m and 15 m, respectively. They analyzed the data with a Clapeyron type equation, developing the correlation for the saturation carrying capacity shown in
Table 1.
Bi and Fan, Leung et al., Matsen, Day et al., and Yang [
9,
10,
13,
14,
15] all developed correlations based upon literature data. Bi and Fan [
9] obtained the relationship relating the gas velocity to the solids flow rate. They primarily used Geldart Group A powders and obtained a correlation to be independent of riser diameter for small less than 0.2 m in diameter risers. Their correlation had an R
2 value of 0.9 with respect to the data used. Leung et al. [
10] developed a correlation for the saturation carrying capacity as a function of the choking velocity using the solids flux from accumulative choking literature data. The model had a reported accuracy of ±70% for risers less than 0.045 m and was independent of the riser diameter. Matsen [
13], basing his model on the understanding at the time of his research on the juncture of lean and dense phase equations, developed his correlation without using experimental data, noting that the model is for theoretical analysis, not for quantitative analysis since the model is based upon an incomplete model of the slip velocity-solids fraction functionality. Day et al. [
14] produced his correlation on data from the test in small diameter units ranging from 0.025 to 0.075 m. As expected, given that all the experimental data used to construct the correlation were quite small, no diameter effect was found. Yang [
15] produced a correlation for Geldart Group A powders and found the saturation carrying capacity to be related to only the gas velocity, as shown in
Table 1.
Yousfi and Gau [
11], looking at two different very small diameter risers, 0.038 m and 0.05 m, both with a height of 6 m, examined accumulative choking phenomena with three materials: glass beads, polystyrene, and FCC powders. Their correlation, independent of diameter due to the limited literature range of the data, reportedly fit most of the literature data within ±20%.
Knowlton and Bachovchin [
12] performed experiments in a 15.2 m tall riser with a diameter of 0.076 m at elevated pressures. They investigated two particles, a 363 µm lignite particle with a specific gravity of 1.25 and 57 µm and a siderite particle with a specific gravity of 3.9. They obtained a riser dimensionality in the correlation by nondimensionalizing the particle diameter with the riser diameter. Thus, the correlation is a function of the particle properties, riser diameter, and gas velocity.
2. Experimental Setup
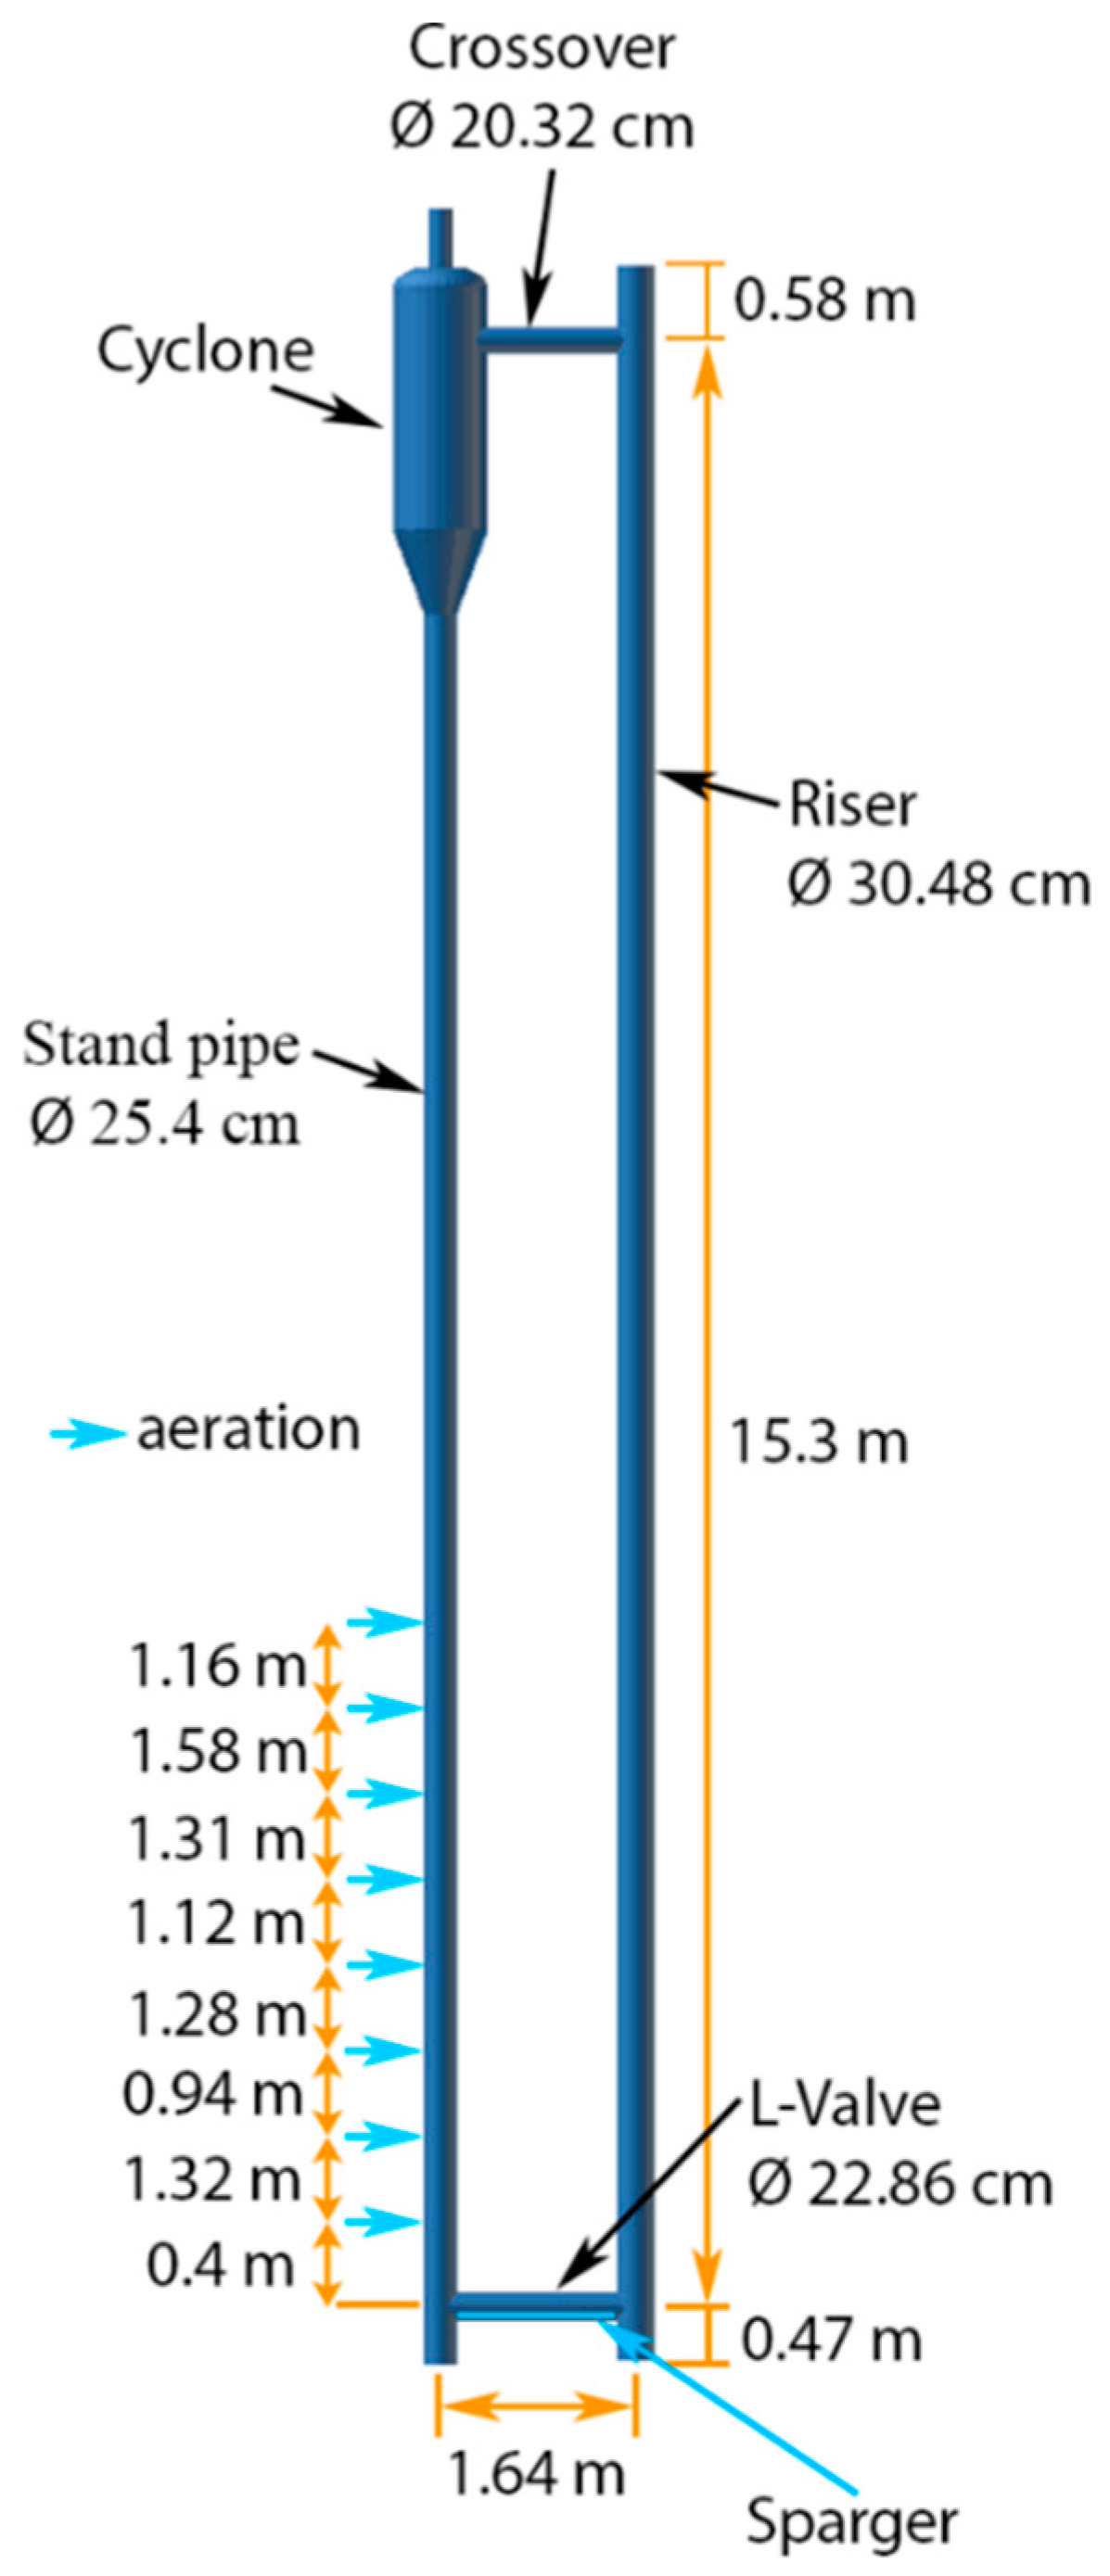
The NETL campus in Morgantown, WV, had a pilot scale CFB riser that was used to measure
Gs* over a range of riser gas velocities (Ug). The cold flow circulating fluidized bed (CFCFB) had a 0.3048 m diameter, 15.3 m tall riser with a blind T exit,
Figure 1. The rest of the loop consisted of 0.2 m diameter cross-over, primary, and secondary cyclones, 0.25 m diameter standpipe, and a 0.23 m diameter L-valve. To control the solids flow rate through the L-valve, the air was injected at 8 locations along the standpipe,
Figure 1. These flows were controlled using mass flow controllers. Additionally, to help move the solids horizontally, a gas sparger was used to aerate the horizontal section of the L-valve. Additional details were provided elsewhere [
16].
By changing the aeration air to the standpipe, the solid circulation rate was controlled. A helical spiral was placed in the standpipe to continuously measure the solid circulation rate. The riser superficial gas velocity, Ug, was calculated by totaling the aeration air moving with the solids down the standpipe with the sparger air and the main riser air. A model of the standpipe was used to estimate the aeration flow split, predicting the amount of air that traveled up through the cyclone and the amount of air that traveled down the standpipe to the riser [
17]. Rosemount differential pressure transmitters were placed around the entire loop to measure incremental differential pressures. The gas flow rates, pressures, and solid circulation rate were recorded at 1 Hz with a data acquisition system. Adhering to the ISO 14001 quality guidelines, all instruments were calibrated on a regular basis.
The saturation carrying capacity was measured using the solids cut-off method [
2]. After reaching a steady-state in the fast fluidization regime, as indicated by the constant circulation rate and riser pressure profile, the aeration to the standpipe was abruptly stopped. This caused the solids in the standpipe to stop flowing into the riser, breaking the loop. Since the solids were no longer entering the riser, the solids mass in the riser decayed as a function of time. This change in mass was measured by the differential pressure transducers along the riser. By taking a time derivative of the change in pressure at the cut-off time, the saturated solids flow rate can be determined. In practice, the change in pressure after the cut-off time was fit with a linear regression. The derivative of the linear regression at the cut-off time was then used.
The glass bead used in these tests had a particle diameter (dp) of 59 µm with a particle density (ρs) of 2795 kg/m3. The gas velocity, (Ug) ranged from 2.1 m/s to 3.7 m/s with the measure saturation carrying capacity ranging from 40.9 to 103.4 kg/m2s.
3. Data Sets and Comparison with Existing Models
A total of 9 data sets were used in the analysis. Eight of these were from the literature and the 9th was from unpublished NETL tests. The particles were identified in the Geldart Plot shown in
Figure 2. Reduced density values (
ρs–
ρf) ranged from 0.9 g/cm
3 to 2.7 g/cm
3 while the particle diameter for the data sets ranged from 51 µm to 70 µm.
The saturation carrying capacity for the experimental test conditions was predicted using each model in
Table 1 and plotted against the experimental values as shown in
Figure 3. The accuracy of the predictions was shown as the Absolute Average Percent Deviation (AAPD) beside each graph in
Figure 3. The AAPD is defined as:
In
Figure 3, the data for each set were identified with a separate symbol, as shown. The figure also shows a truth line indicated where
The Xu et al. [
6] model denoted as Xu 2001 had a 52.9% AAPD with the bulk of the predictions being greater than the experimental values with the significant exception of the Zhang [
18] data. The Xu et al. [
7] model from 2006, denoted as Xu 2006 was much improved over his earlier model, with this one having an AAPD of 33% and fitting the Zhang [
18] data much better except at large values of
Gs*, which were under-predicted as well as the underprediction of the NETL glass bead data. The model by Monazam et al. developed for Geldart Group B PVC particles was off by more than 100%, having an AAPD of 124% significantly overpredicting all the data except the NETL glass bead data and Zhang [
18] data for large values of
Gs*. The Bia and Kato [
3] did well, having an AAPD of 32.5 and only under-predicting the Zhang [
18] data for large values of
Gs*.
The Bi and Fan [
9] correlation underpredicted all the data while having an AAPD of 37.6%. Again, such as the Xu et al. models [
6,
7] and the Bia and Kato [
3], the Bi and Fan [
9] under predicted the Zhang [
18] data, particularly for large values of
Gs*.
The Breault et al. correlation was developed for Geldart Group B materials and was not expected to fit the Geldart Group A data but was added to the comparison for completeness. Except for the NETL glass bead data, it significantly over-predicted all the data sets. For comparison, the AAPD was 403.3%.
The Knowlton and Bachovchin [
12], Yousfi and Gau [
11] and Matsen [
13] models significantly over-predicted all the data sets with the AAPD values being 3794%, 4278%, and 74,031%, respectively. In defense of these researchers, Knowlton and Bachovchin [
12] developed their model using high-pressure small diameter test data, Yousfi and Gau [
11] was for exceedingly small diameter tests, and Matsen [
13] stated that his model was not for absolute predictions but for functionality.
The Day et al. [
14] and the Leung et al. [
10] both overpredicted all the data sets with APD values of 233.4% and 168%, respectively. Leung et al. [
10] did a better job than the Day et al. [
14] model on all the data sets except the NETL glass bead data.
The Yang [
15] correlation was the best of the literature models and the simplest being proportional to the velocity raised to the 2.4938 power. The AAPD for the model was 23.9. However, it underpredicted all the data sets. This result will be discussed in greater detail below.
4. Discussion
As noted above, the Yang [
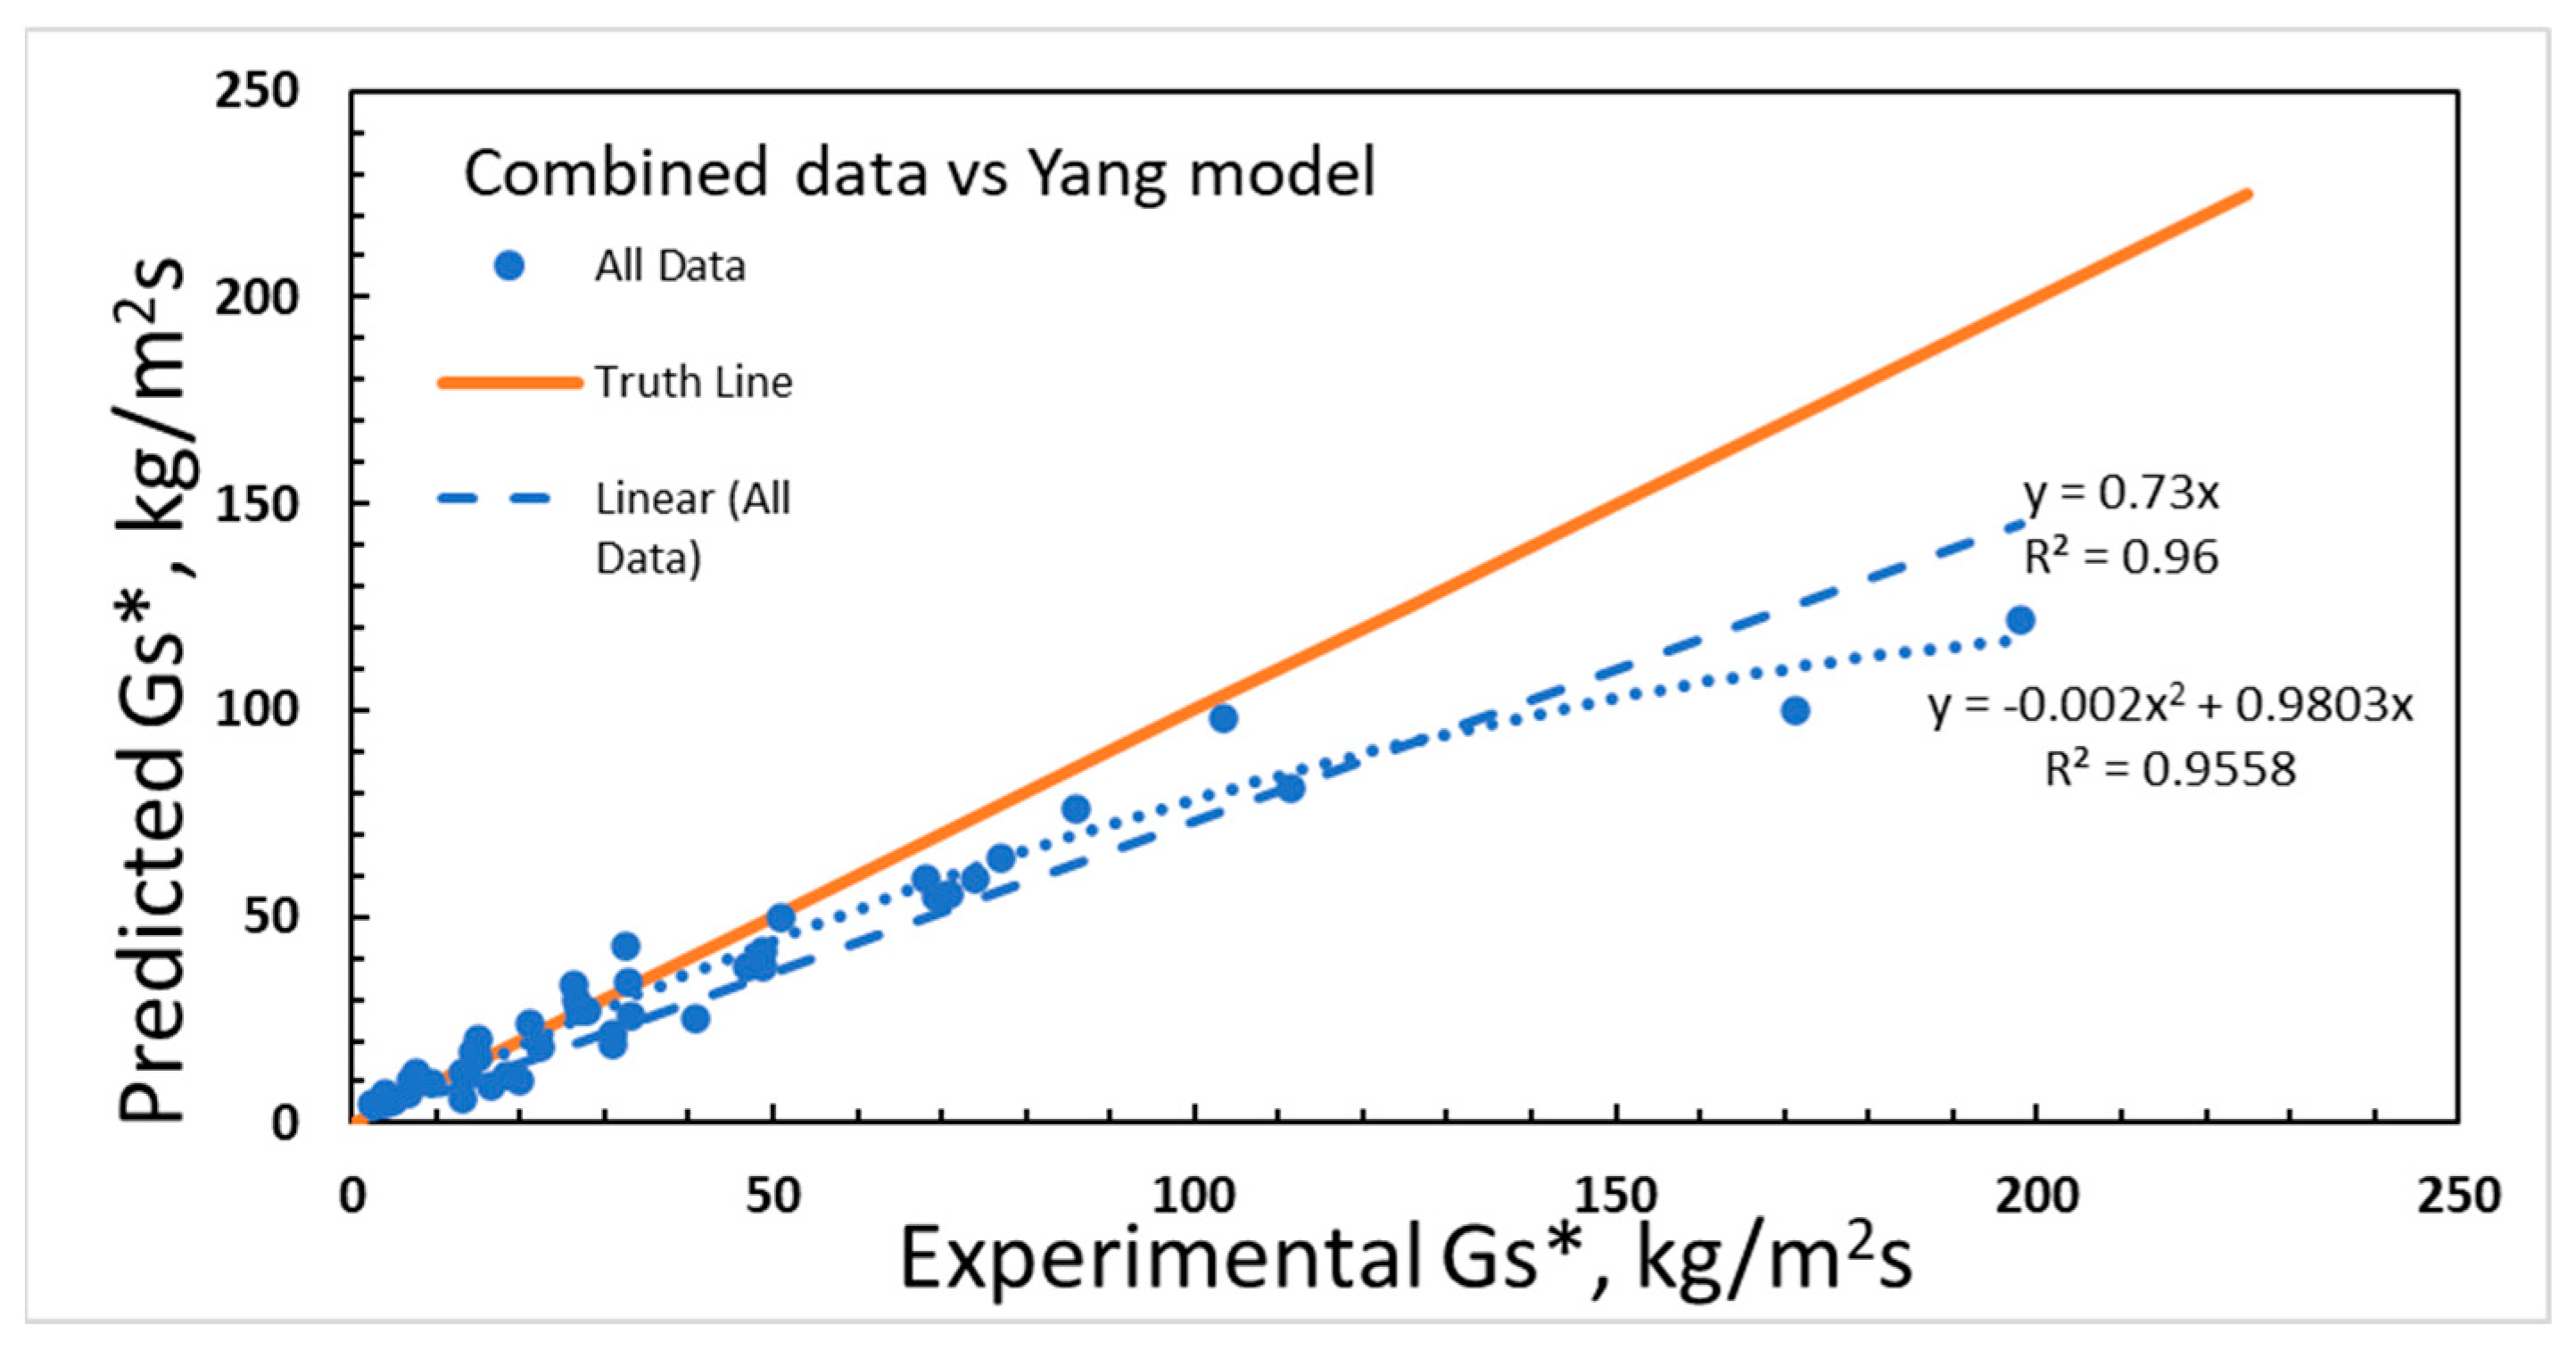
15] model is the best of the literature. However, by examining
Figure 4, it is observed that it systematically underpredicts the experimental data by 27%. This can also be seen in the residual plot shown in
Figure 5. That is
. It is remarkable that the exponent for the velocity (2.4938) is nearly the same as the average for the data sets shown in
Figure 6 (2.5067). Nevertheless, at a high flux of 200 kg/m
2s, the curvature of the data away from the truth line is significant, accounting for 40% of the prediction. This curvature and the underprediction by 27% necessitate the need for an improved correlation.
Based on the functionalities presented in
Table 1 of the gas velocity exponent, it was predicted that a model based on the Xu et al. [
6,
7] correlation would fit the data well. This model form is also a generalization of the Bai and Kato [
3] correlation and of similar form as Breault et al. [
2] proposed for Geldart Group B powders.
Xu et al. [
6,
7] found the correlation to be dominated by the Archimedes number, where as Breault found it to be a function of just the particle size.
As noted,
Figure 6 presents all 9 data sets found in
Table 2 in a plot of the gas velocity versus the saturation carrying capacity. The data spans a velocity range from 1.09 m/s to 4.0 m/s, with the saturation carrying capacity ranging from a low of 2.3 kg/m
2s to a high of 198 kg/m
2s. The plot also shows the corresponding power fit equations through the various data sets. As can be seen, the power ranges from a low of 1.7062 for the NETL glass bead data to a high of 3.3766 for the Xu FCC 097 data set.
As mentioned above, it has been shown in the literature that the gas velocity is a function of the particle properties. Xu et al. [
6,
7] found it to be a function of the Archimedes number, while Breault [
2] found it to be a function of the particle size for Geldart Group B particles. An attempt to use the Archimedes number as Xu et al. [
6,
7] was performed, but there was no significant relationship, thus the particle size was used as Breault [
2] had performed, even though the range was relatively small.
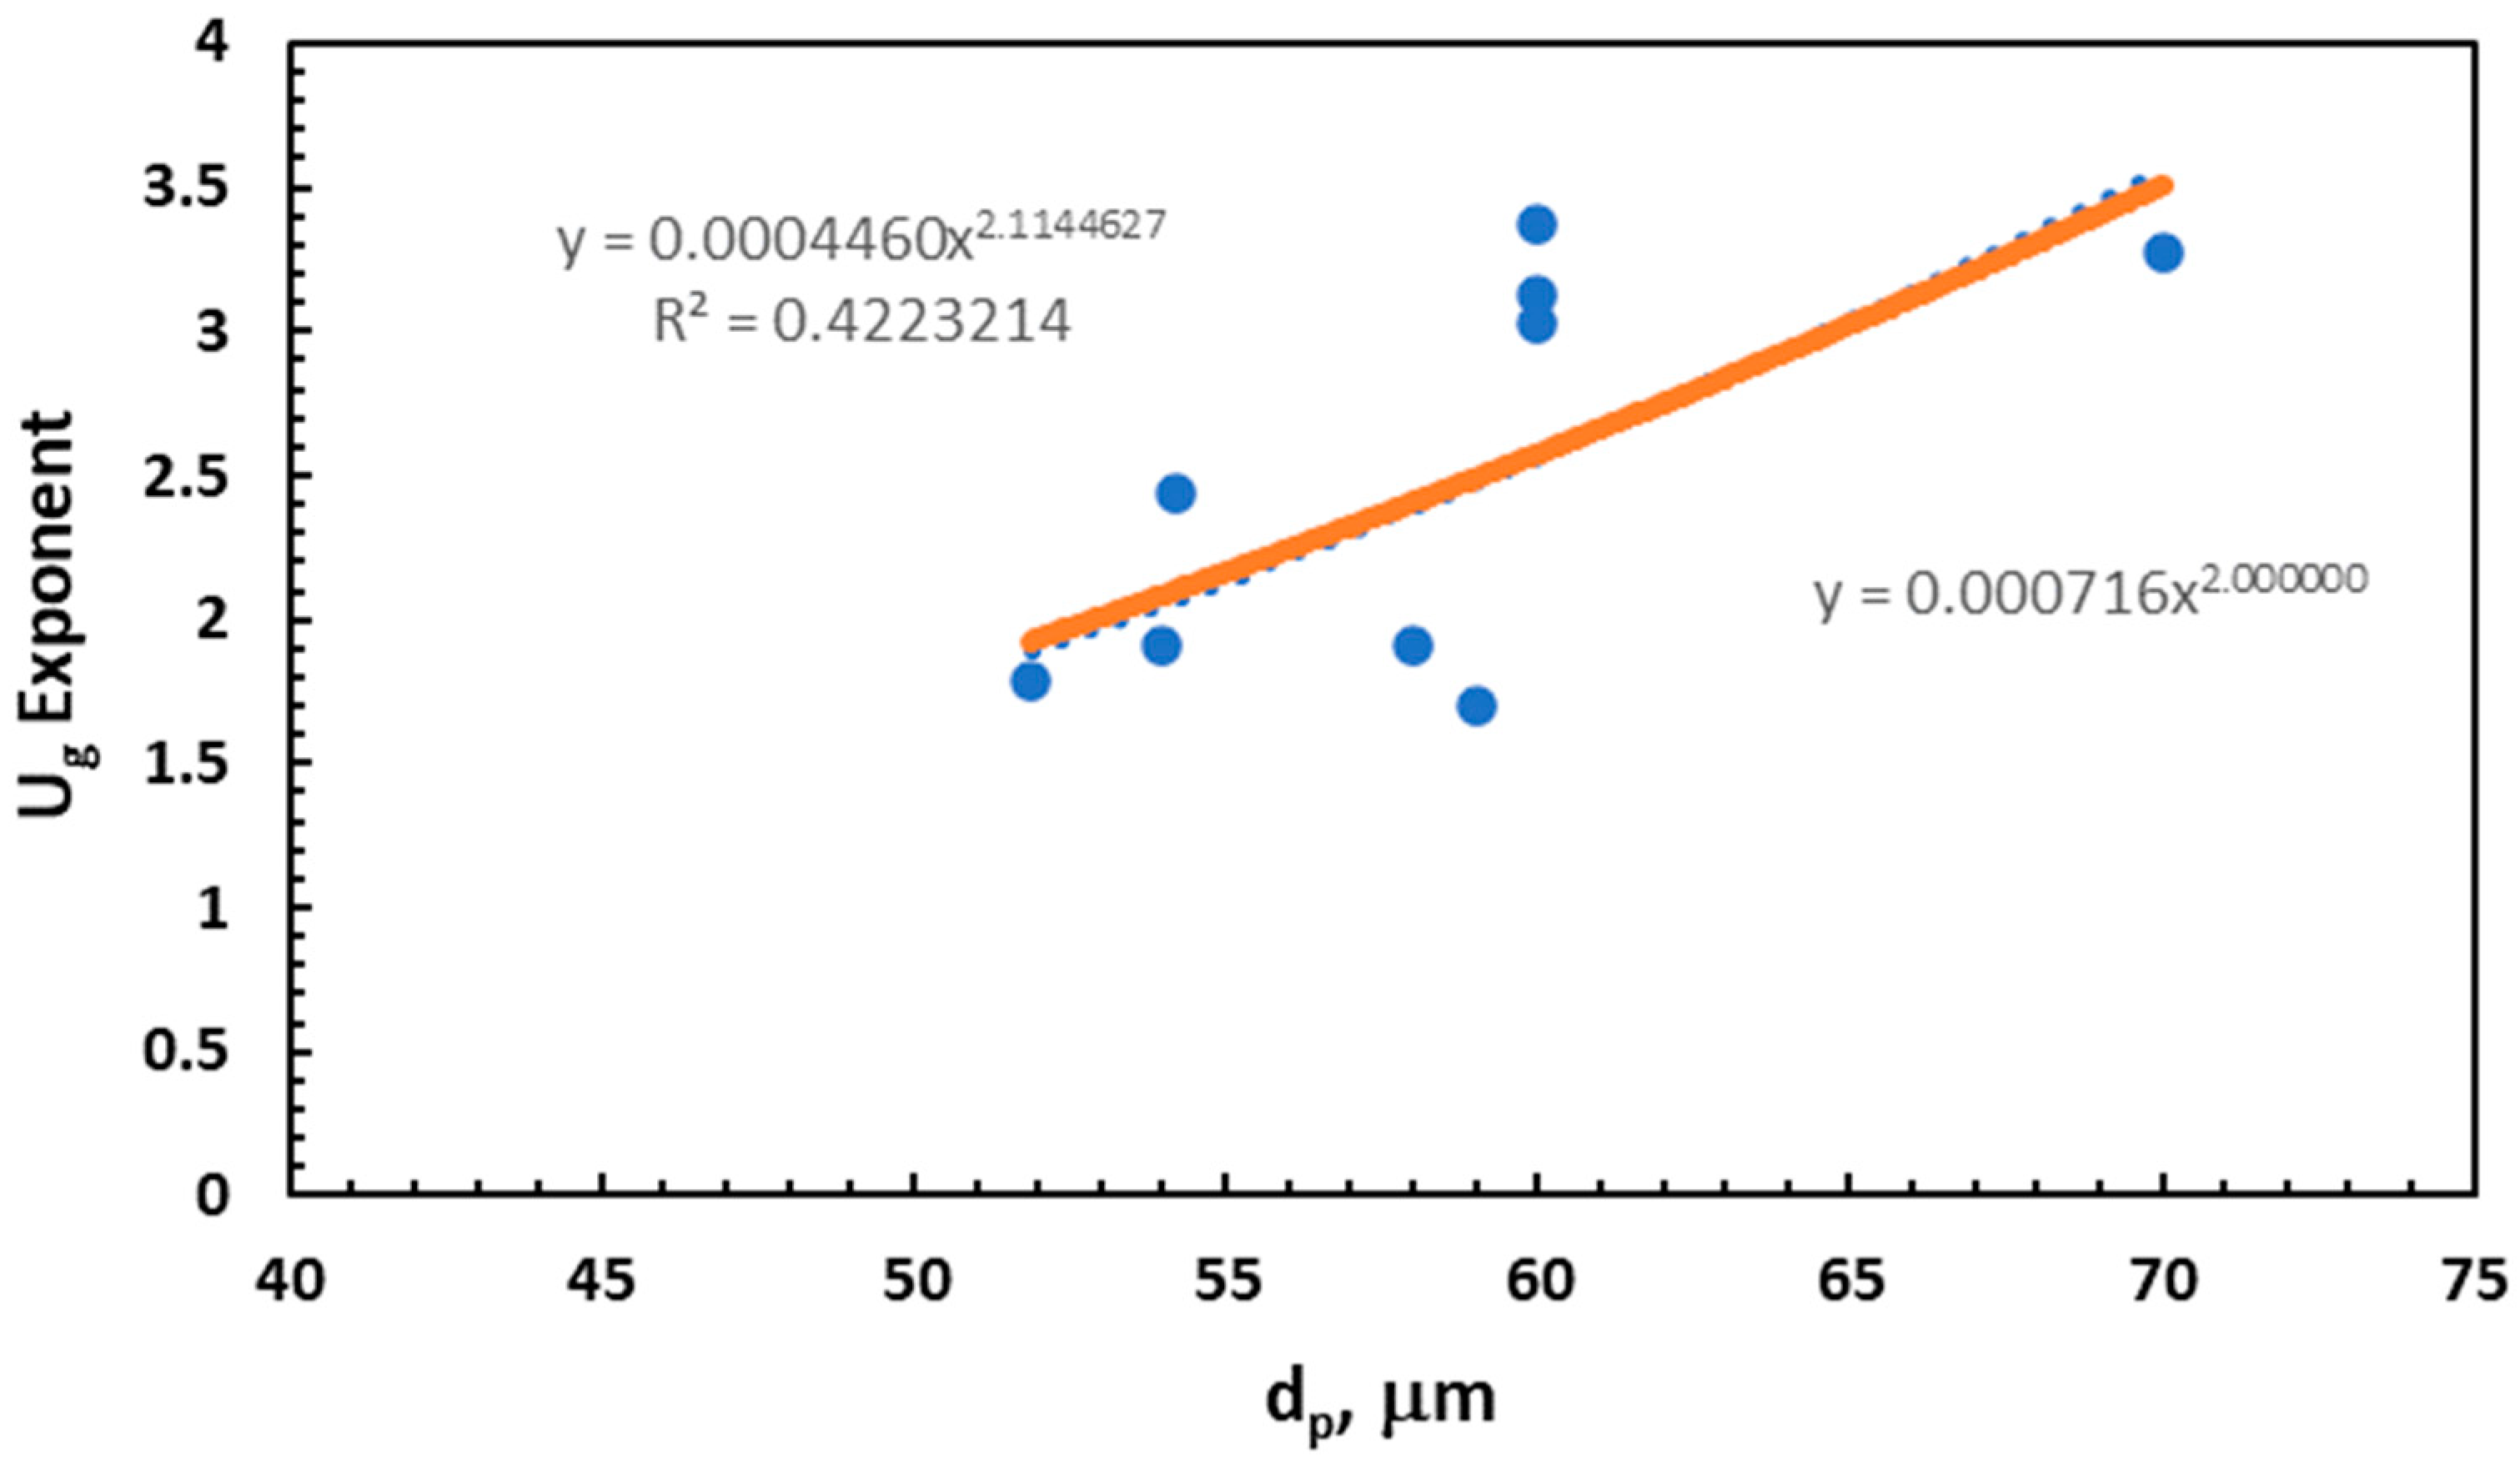
Figure 7 presents this plot of particle size versus gas velocity exponent,
c. The fit is not great with an R
2 value of less than of 50%, but it is believed that the scatter about the curve is related to other parameters that can be incorporated as the full correlation is developed. In addition, shown is the model fit (solid line) and an exponential fit (dotted). It is believed that nature/physics tends toward simple ratios of small whole numbers except for
π and
e. Thus, the velocity functionality is
By normalizing the saturation carrying capacity by the riser gas velocity, the Archimedes number and riser diameter exponents can be assessed as follows,
Figure 8 presents the velocity function reduced saturation carrying capacity with respect to the Archimedes number. The generalized functionality is that the velocity reduced saturation carrying capacity is inversely proportional to the Archimedes number. This is similar to the Archimedes functionality of the Geldart Group B materials, where the saturation carrying capacity is proportional to
Ar-6/5.
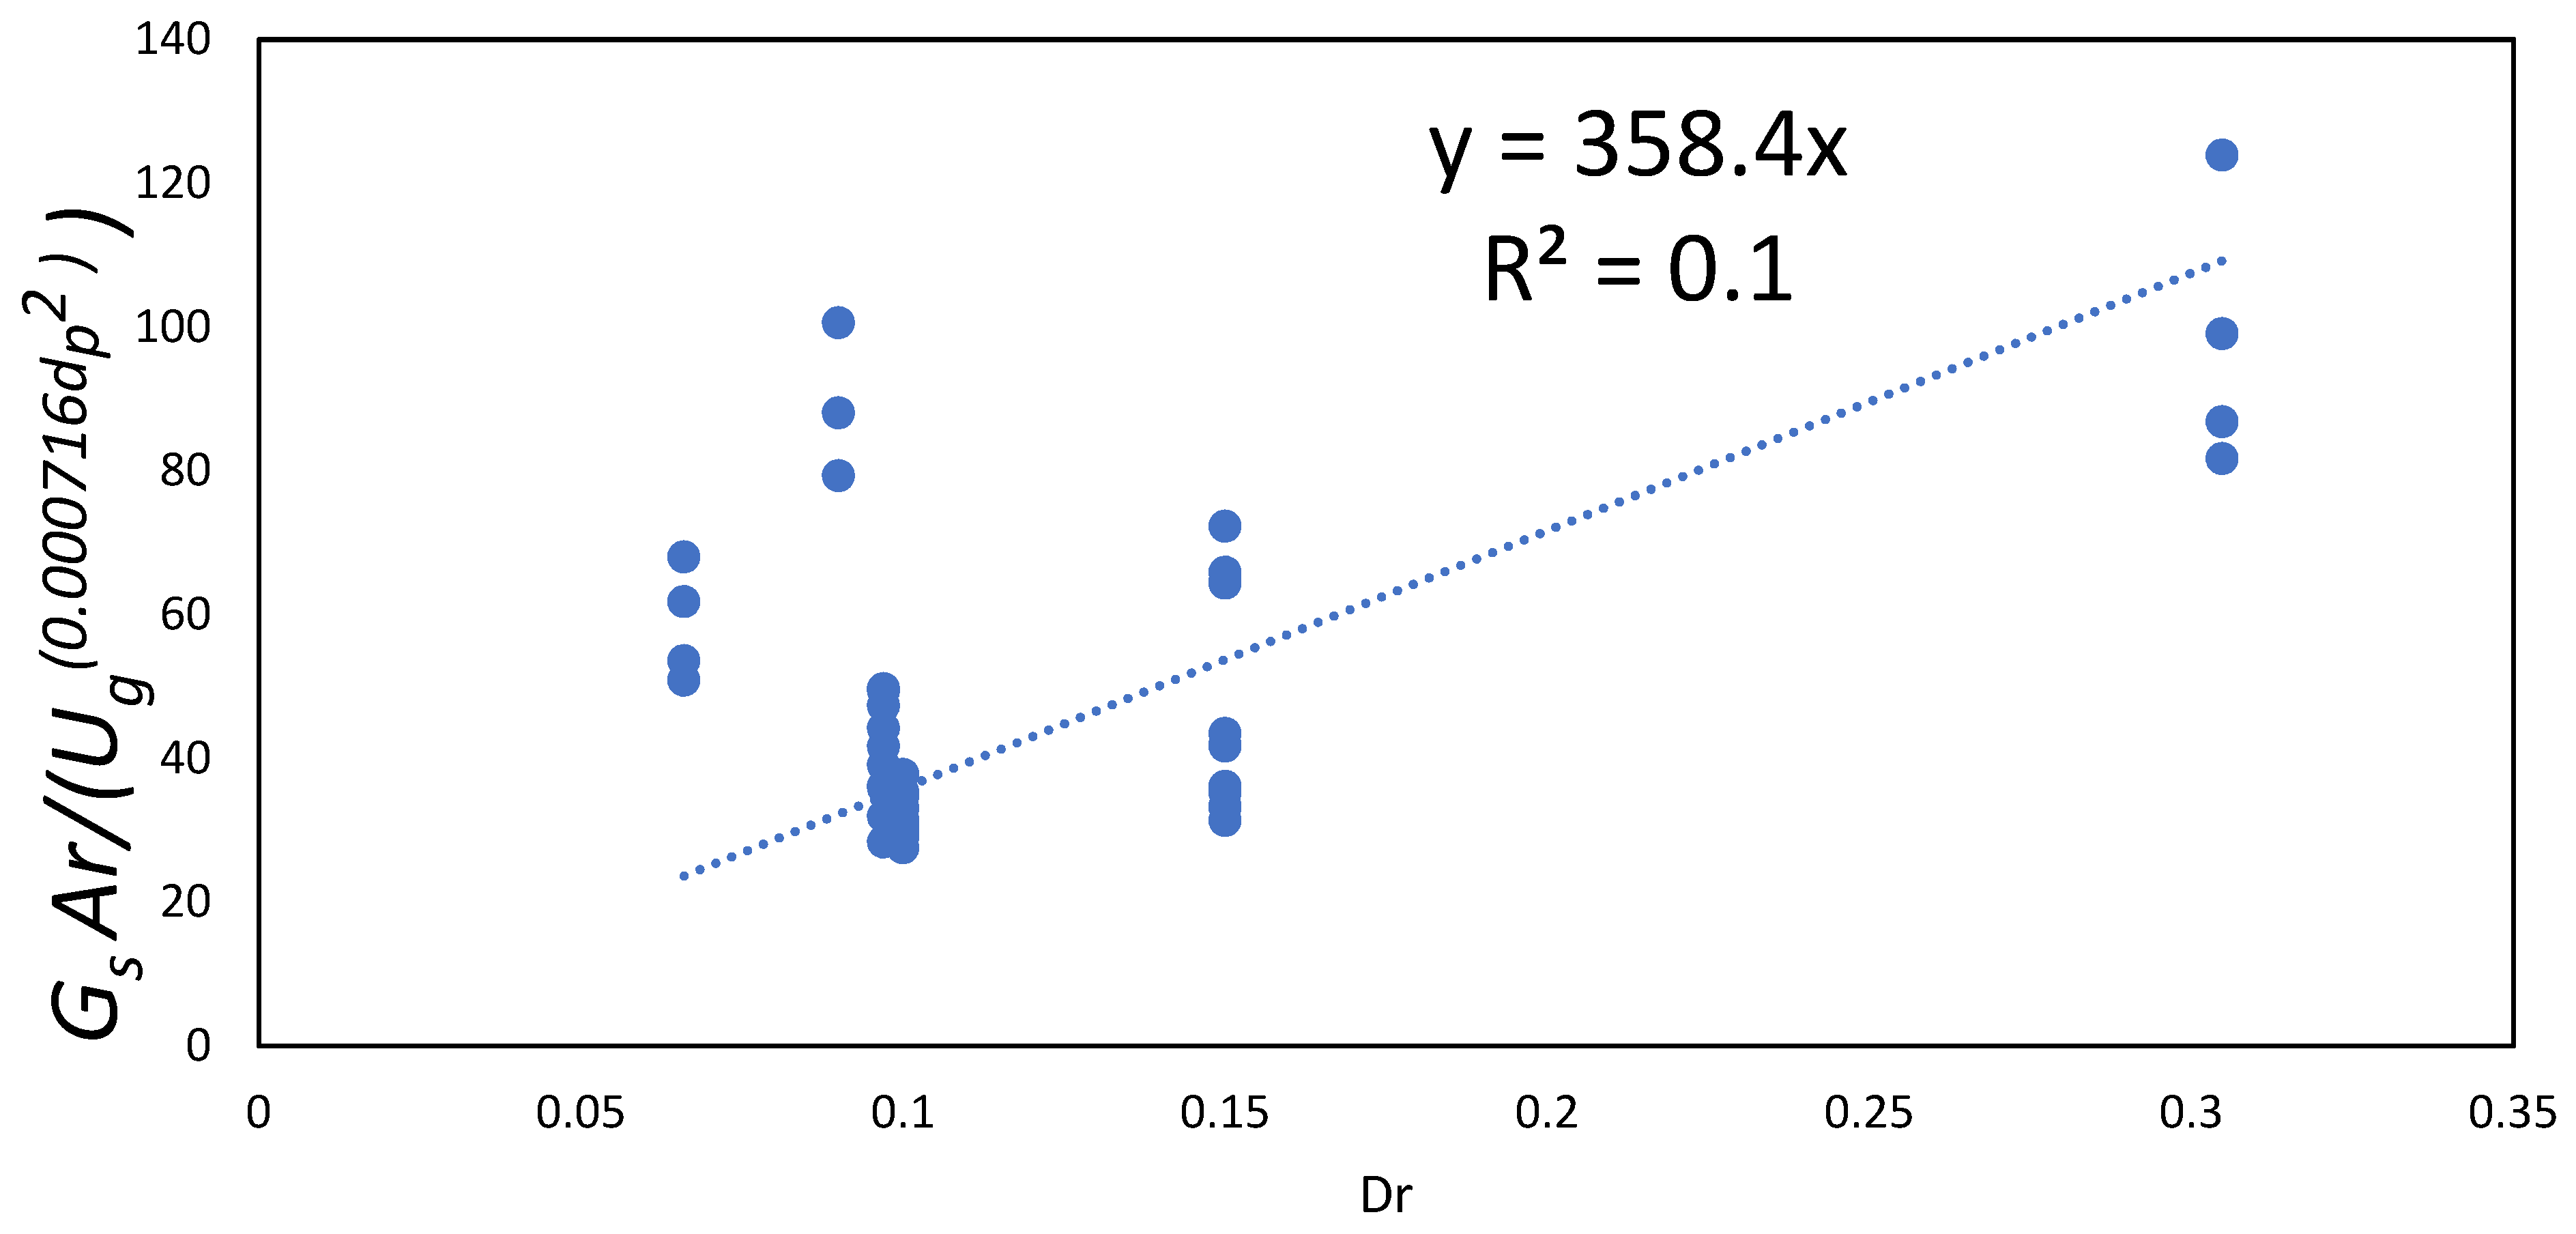
Finally, to understand the functionality of the riser diameter on the saturation carrying capacity, the Archimedes number and velocity reduced saturation carrying capacity is plotted against the riser diameter, as is shown in
Figure 9. This results in a linear dependence of the riser diameter and leaving only “
a” in the correlation to be fit.
To obtain the proportionality coefficient, “
a”, the predicted saturation carrying capacity is plotted against the experimental data. Fitting the expression to the experimental data results in an “
a” equal to 318,
Figure 10. Thus, the correlation is:
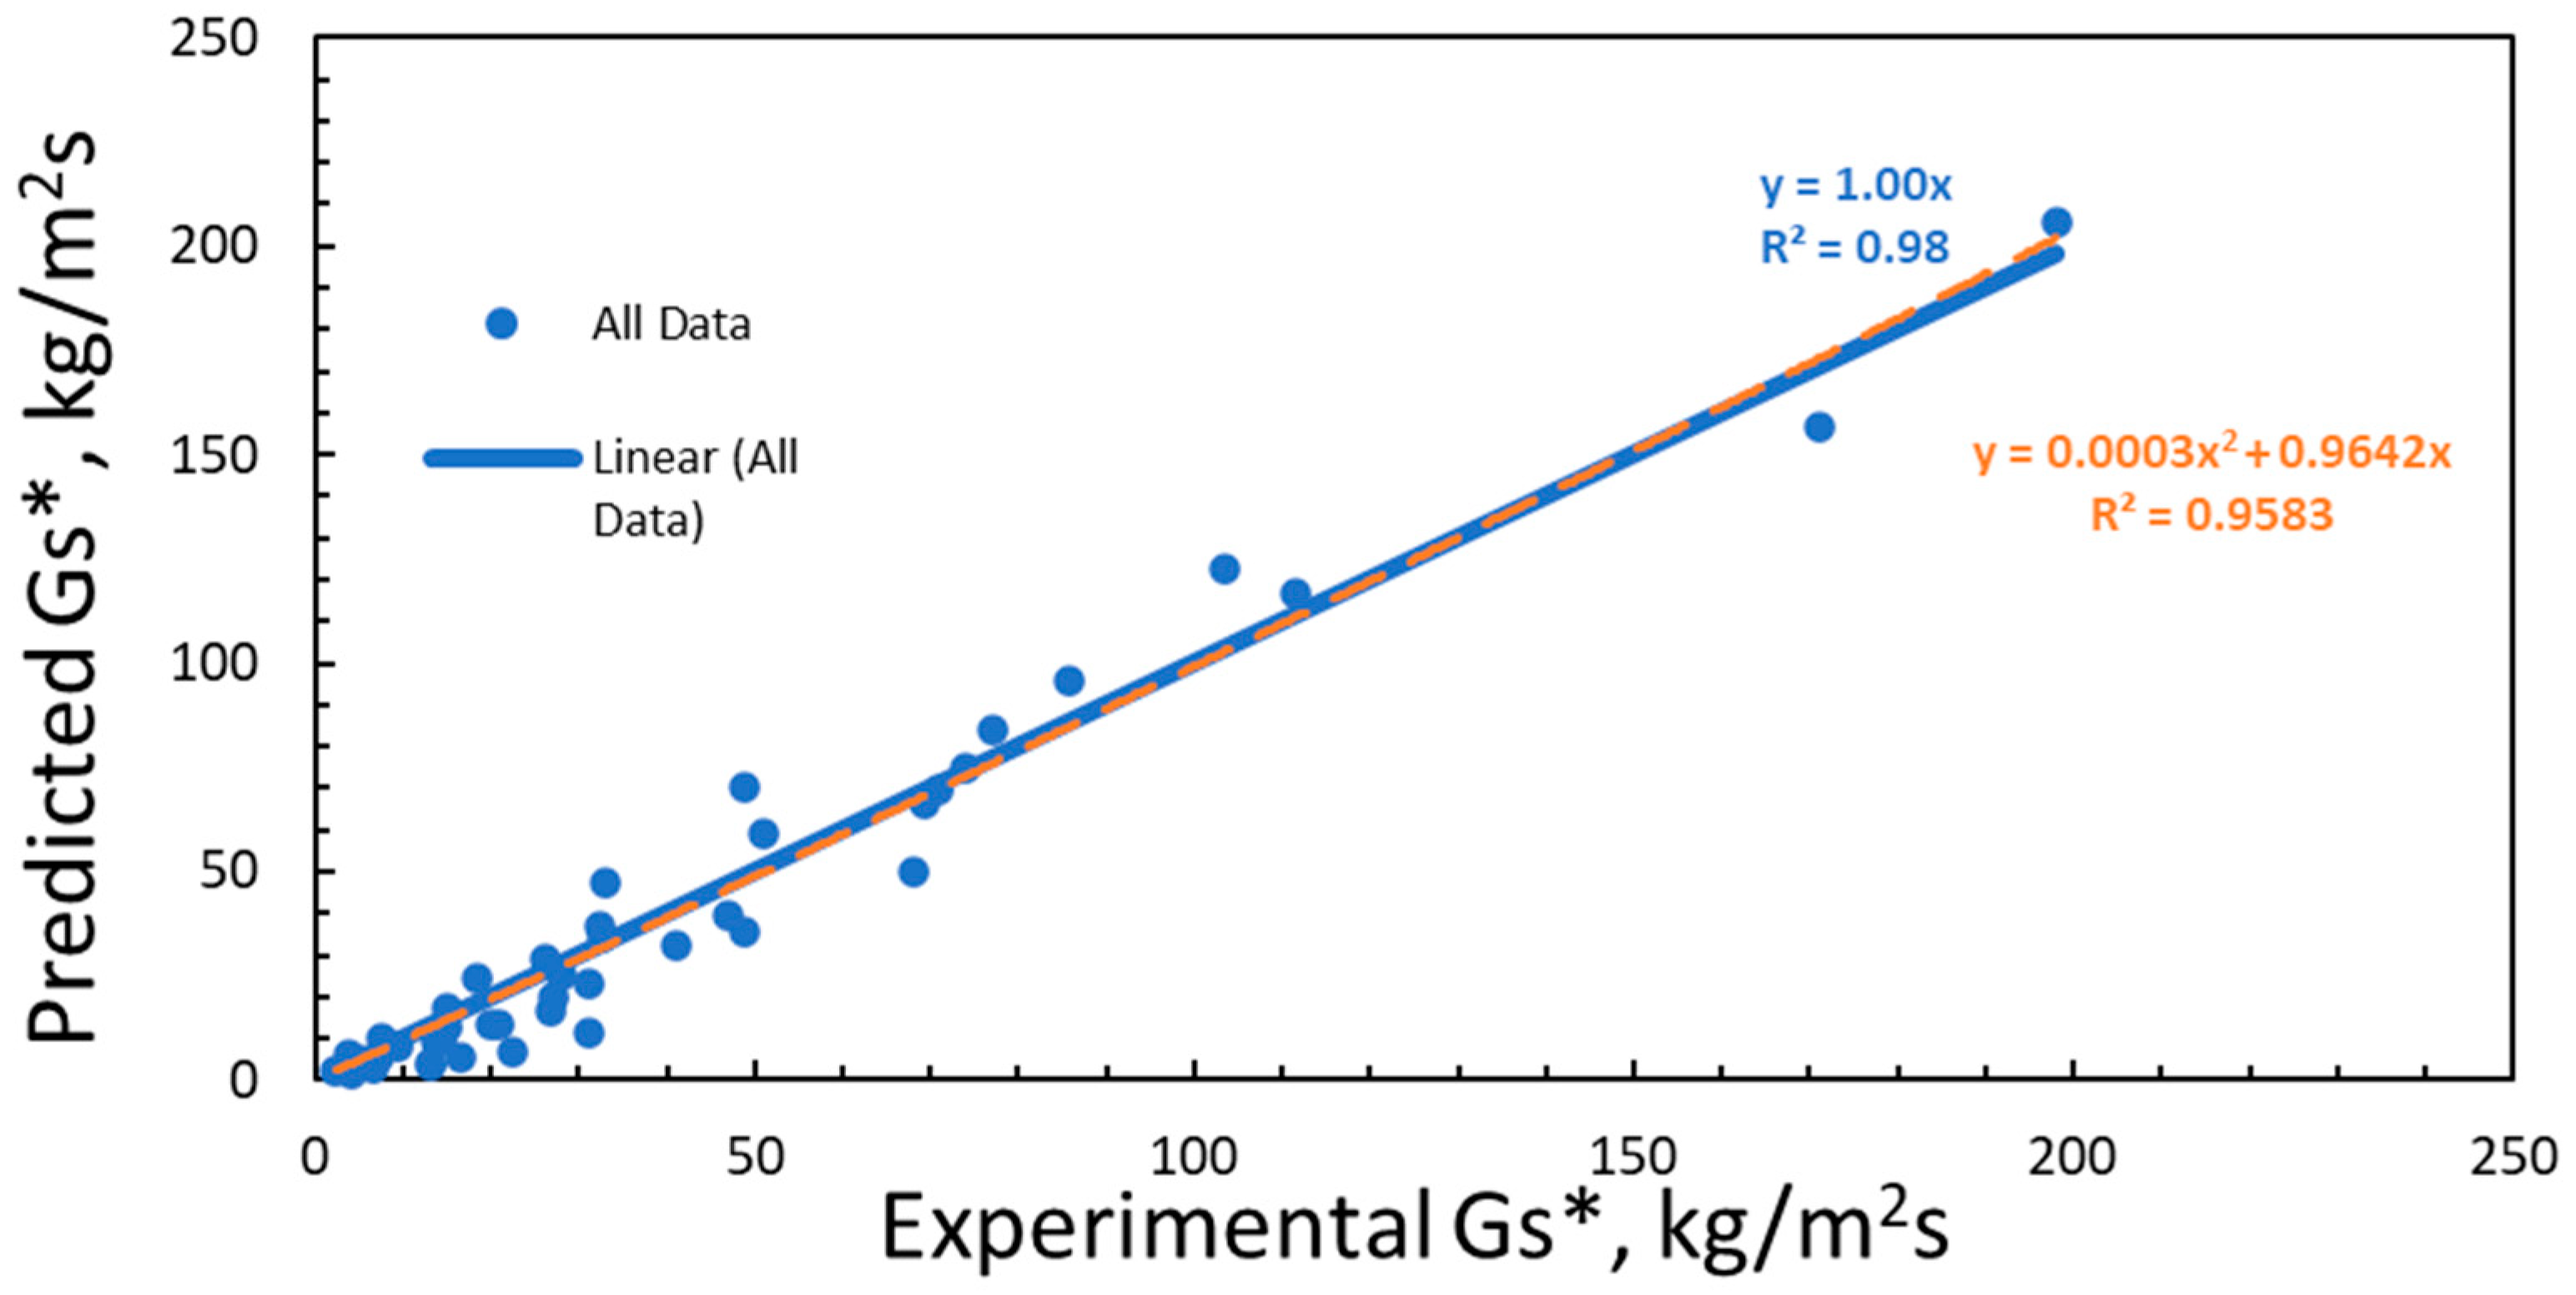
In addition to the good visual fit of the model with the data, two tests are provided to compare the new correlation against the best literature correlation, Yang [
15]. The first is the AAPD. The new correlation developed in this work has an AAPD of 17.6% compared to Yang [
15] of 23.9%. This is a reduction in the error by nearly 25%. Additionally, the curvature in the correlation can be assessed to see if all potential parameters are accounted for in the development. Recall that the Yang [
15] correlation had a 40% contribution to the predicted value due to the curvature and that this predicted value was 27% lower for a saturation carrying capacity of 200 kg/m
2s. This is in stark contrast to the new correlation developed in this work, where the error due to the curvature at 200 kg/m
2s is only 6% of the predicted value. As seen in
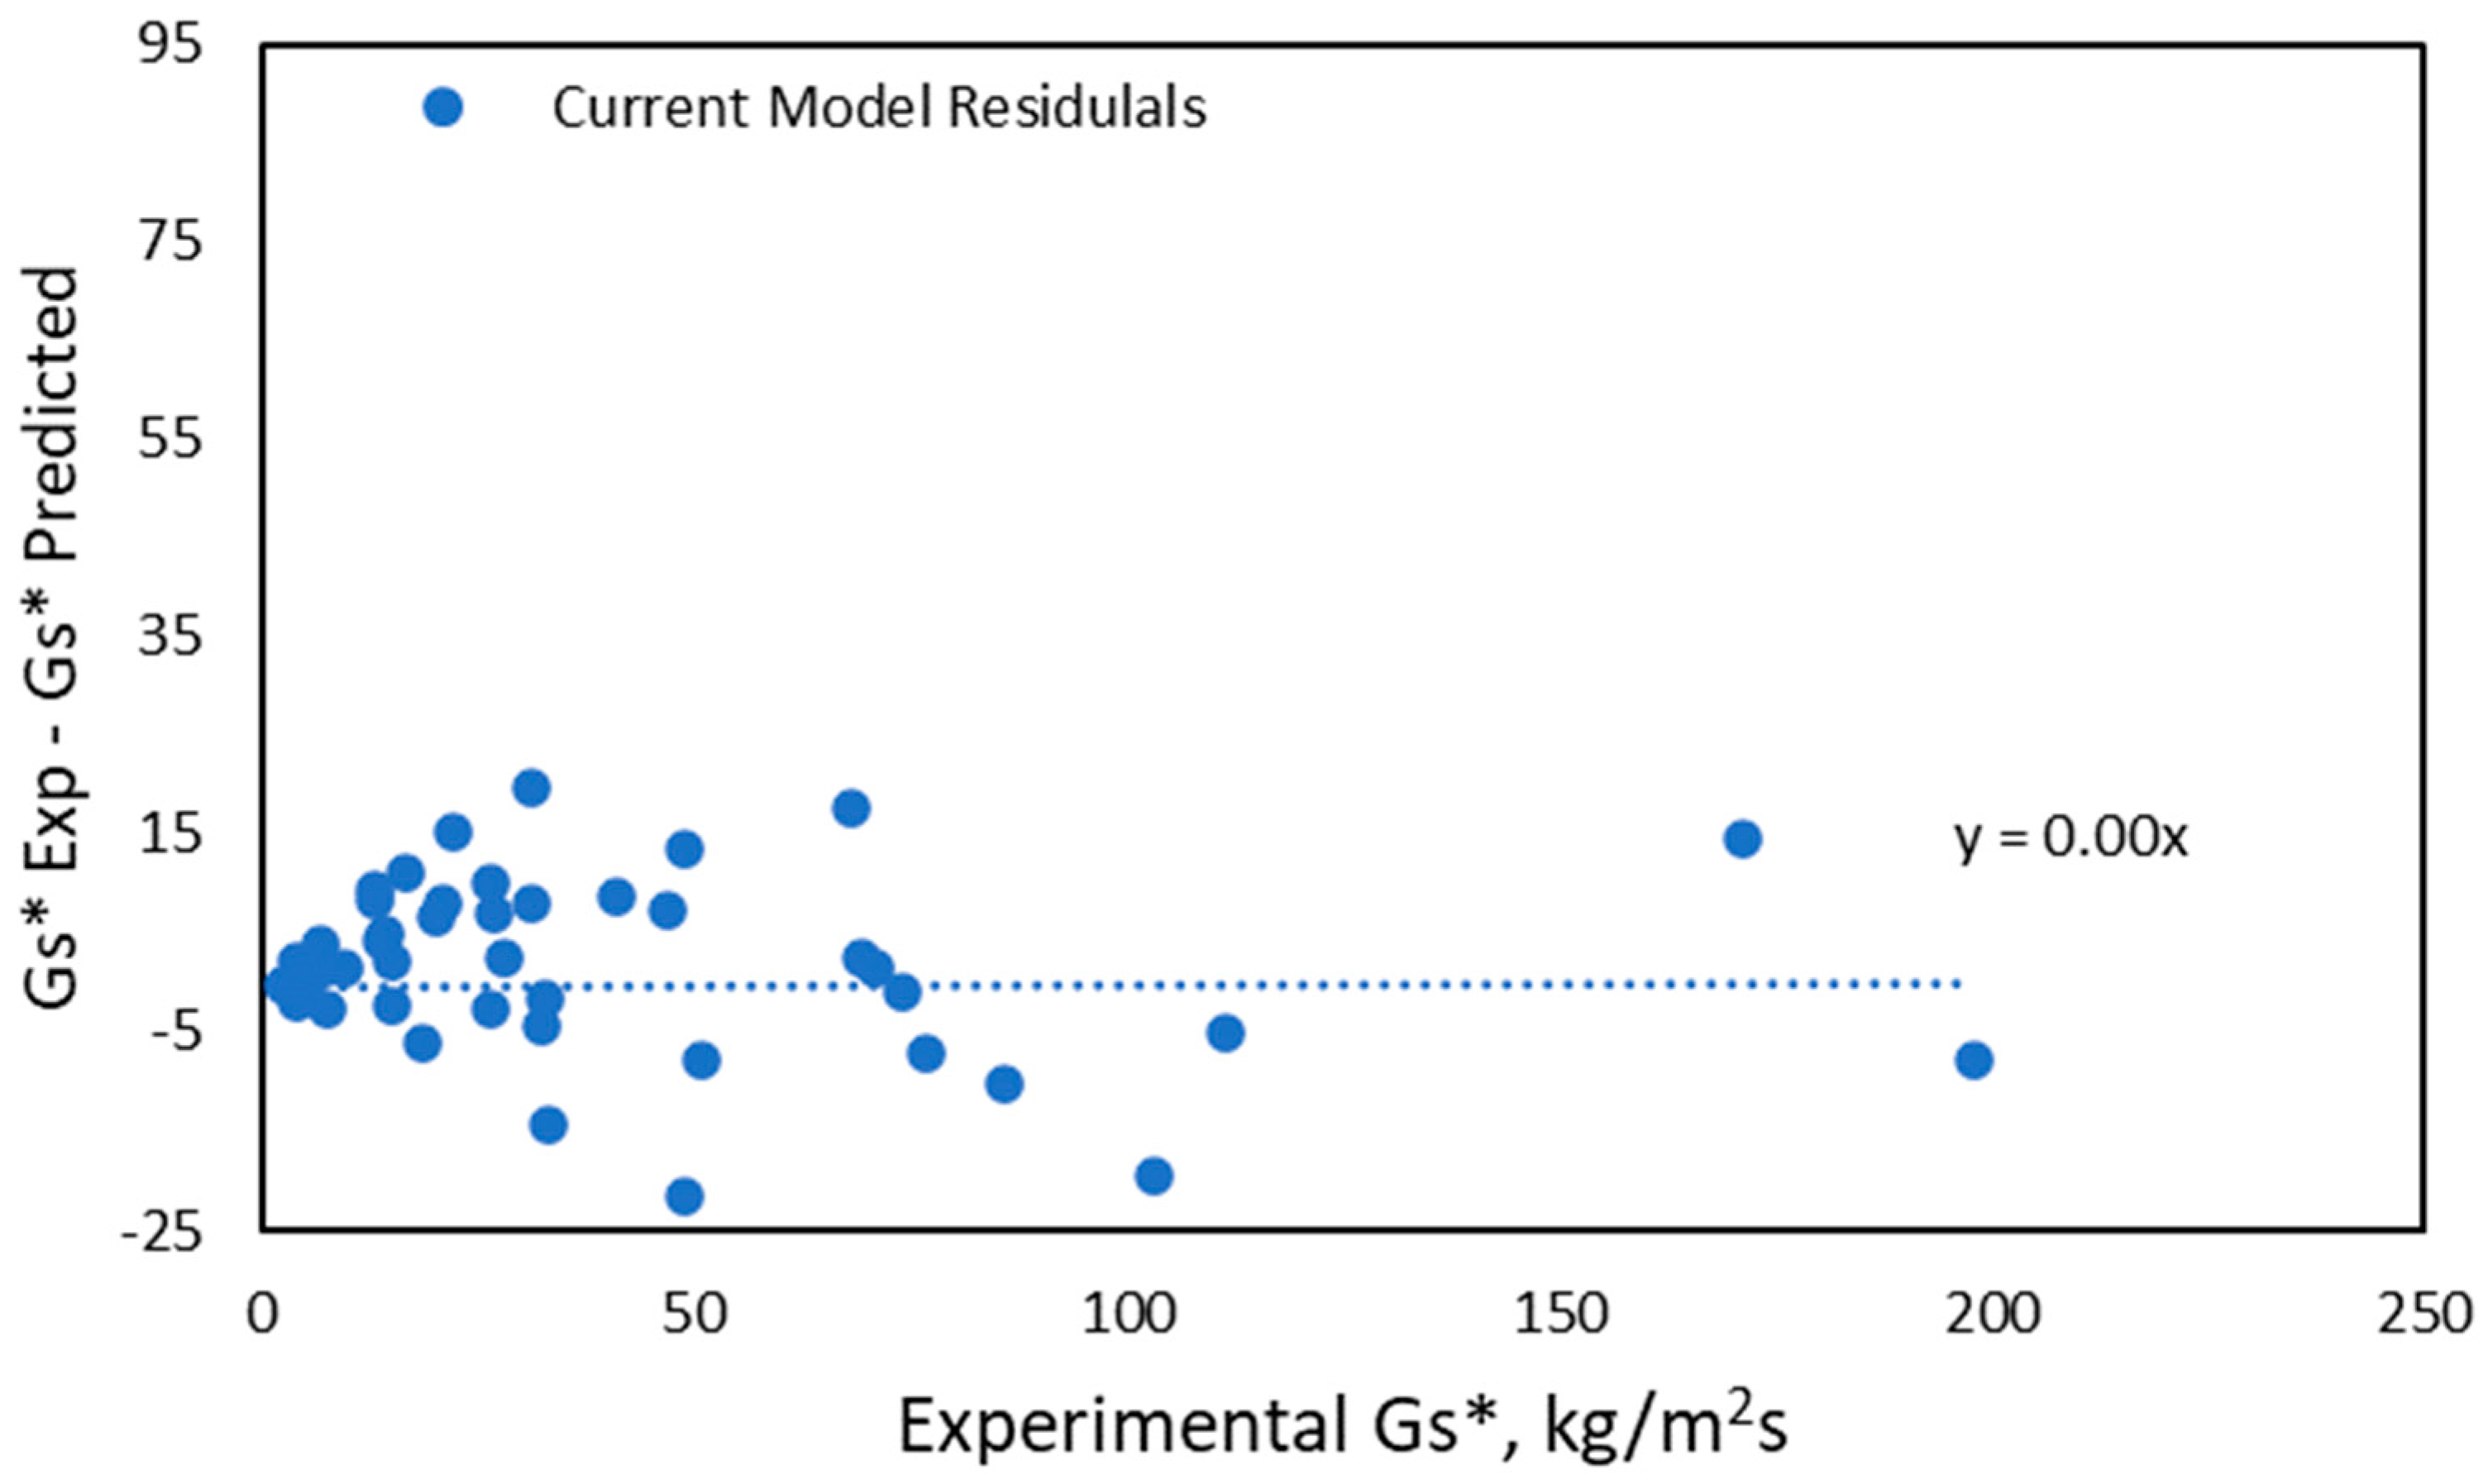
Figure 10, the developed correlation displays a nice even scatter around the unity line, with no underlying observable structure. This can also be seen in the residuals plot,
Figure 11. As a further test of the model, The authors conducted an ANOVA Analysis between the measured values for the saturation carrying capacity and the predicted based on Equation (7) using the hypothesis test that the measured mean value is equal to the predicted mean value.
Table 3 presents the ANOVA test results, and since the F statistic is significantly less than the Critical F statistic, the hypothesis is accepted, and the means (the distributions) are the same. This means the model prediction and the experimental data are the same.
5. Conclusions
Empirical models continue to be the preferred tool to design chemical reactor systems. As such, it is imperative that institutions continue to collect industrial relevant data and develop useful empirical models incorporating all available data. These datasets are also important to validate more complex models such as multiphase computational fluid dynamics.
In this work, the data and correlations available in literature, as well as new unpublished data, have been used to develop a new correlation to predict the saturation carrying capacity, Gs*. This new correlation not only represents the new data presented in this work but also fits the available data in the literature. The new correlation has an Absolute Average Percent Deviation of only 17.6%, the lowest error in the literature. The data used covered a large range of Geldart Group A particles with diameters ranging from 51 to 70 µm diameter and particle densities ranging from 900 to 2700 kg/m3. The experimental data also encompasses several different riser diameters ranging from 0.066 to 0.3048 m and superficial gas velocities ranging from 1 to 4 m/s.
Future work will continue to mine both the literature and the 20 years of experimental data collected at NETL using both an industrial relevant 0.3048 m diameter circulating fluidized bed and a 0.1016 m diameter riser.
