Article

Application of the BORUTA Algorithm to Input Data Selection for a Model Based on Rough Set Theory (RST) to Prediction Energy Consumption for Building Heating

1
Faculty of Production and Power Engineering, University of Agriculture, 30-149 Krakow, Poland
2
Department of Technology and Computer Science, Szymon Szymonowic State School of Higher Education in Zamość, 22-400 Zamość, Poland
*
Author to whom correspondence should be addressed.
Energies 2021, 14(10), 2779; https://doi.org/10.3390/en14102779
Submission received: 6 April 2021 / Revised: 6 May 2021 / Accepted: 7 May 2021 / Published: 12 May 2021
(This article belongs to the Special Issue Management and Technology for Energy Efficiency Development)

Abstract

:
Energy prediction used for building heating has attracted particular attention because it is often required in the development of various strategies to improve the energy efficiency of buildings, especially those undergoing thermal improvements. The complexity, dynamics, uncertainty, and nonlinearity of existing building energy systems create a great need for modeling techniques. One of them is machine learning models, which are based on input data consisting of features that describe the objects under study. The data describing actual buildings used to build the model may be characterized by missing values, duplicate or inconsistent features, noise, and outliers. Therefore, an extremely important aspect of the prediction model development effort is the proper selection of features to simplify the prediction of energy consumption for heating. In this connection, the goal was to evaluate the usefulness of a model describing the final energy demand rate for building heating using groups of features describing actual residential buildings undergoing thermal retrofit. The model was created by combining two algorithms: the BORUTA feature selection algorithm, which prepares conditional variables corresponding to features for a prediction model based on rough set theory (RST). The research was conducted on a group of 109 multi-family buildings from the end of the last century (made in large-panel technology), thermomodernized at the beginning of the 21st century. Evaluation metrics such as MAPE, MBE, CV RMSE, and R2, which are adopted as statistical calibration standards by ASHRAE, were used to assess the quality of the developed prediction model. The analysis of the obtained results indicated that the model based on RST, based on the features selected by the BORUTA algorithm, gives a satisfactory prediction quality with a limited number of input variables, and thus allows to predict energy consumption (after thermal improvement) for this type of buildings with high accuracy.

1. Introduction

Prediction final energy consumption for building heating attracts special attention because it is often required in the development of various strategies for improving building energy efficiency. The complexity, dynamics, uncertainty, and nonlinearity of building energy systems create a great demand for modeling techniques [1]. Existing approaches for modeling building energy systems can be categorized into three basic groups such as [2,3,4,5,6]: physics-based, i.e., engineering models (white-box), data-driven methods, i.e., machine learning (black-box), and mixed models, i.e., hybrid models (gray-box). The inputs used in the predictive modeling techniques typically include building characteristics. The physics-based methods, however, need detailed preparation in building physics, thermodynamics, parameter description, and data concerning their usage. Engineering methods are demanding in terms of the domain knowledge as well as computational resources [1,5]. In contrast to it, the machine-data-driven modeling process allows a more flexible approach to the detail, availability, and accuracy of data describing buildings and their surroundings. Finally, data-driven methods, by creating a direct relationship between design parameters and building energy consumption, help us to alleviate the heavy computational burden as well as engineering efforts required in evaluating the energy performance of various types of facilities. In building energy system modeling, machine learning techniques have been widely applied both in load prediction [7] as well as in control and operation processes [8]. In general, machine learning algorithms used for heat load/heat demand prediction can be classified into the following types [1,2]:
The mentioned types of machine learning models are based on input data consisting of features that describe the objects under study. A feature is the term for variable, parameter, or attribute in the machine learning language. For data-driven models, feature selection strongly affects model performance. Well-designed features increase flexibility and robustness (i.e., even if a simple algorithm is used, prediction results can still be achieved) which allows simplifying the energy assessment of buildings [1]. The data used to create the model may be characterized by missing values, duplicate or inconsistent features, noise, and outliers. Therefore, the science of feature selection, also known as variable selection or attribute selection, is essential for effective feature identification for a building load prediction model. The following feature selection techniques can be distinguished for making heat demand forecasts [1,41]:
  • An embedded method, where feature selection is embedded in machine learning algorithms that include feature selection as an intrinsic module, such as random forest and multivariate adaptive regression with glued functions (MARS) [13,14,41,42,43,44].
  • A filter method, which belongs to statistical methods, assigning a score to each feature, ranks features according to the score, and finally either retains the feature or removes it from the set of candidate features based on ranking [41,45,46,47,48,49].
  • A wrapper method comparing the prediction performance of data-driven models using subsets of candidate features to evaluate the fitness of each subset of candidate features [21,50,51].
  • A hybrid method, which involves using at least two of the above techniques as a combined feature selection method [23,52,53].
Most of the studies focus on the development of machine learning algorithms to achieve the lowest possible prediction error [1,2,18]. Authors presenting prediction results for applied machine learning algorithms often only mention what data they use for modeling, but do not provide more details, such as: data resolution, uncertainty, training/test data partitioning, etc. [1]. It can also be noted that the quality and accuracy of prediction models are mostly tested on theoretical datasets obtained from simulations of different types of buildings [4]. There is a lack of solutions for real buildings characterized by different availability of data describing the objects from thermal and operational point of view [1,4,18,35]. An another extremely important aspect when evaluating energy consumption in real buildings is the fact that many input parameters to the model can be obtained based on engineering calculations (e.g., heat transfer coefficients, thermal bridges, ventilation air flows, building use, and the like), which, in many cases, are based on unreliable and inaccurate data, which significantly affect the accuracy of the building energy assessment [1,4,35]. For real objects, feature selection is an important aspect in building predictive models free from correlated variables, errors, and unwanted noise so feature selection should be done to select the most relevant ones. Therefore, the aim of this paper is to evaluate the usefulness of a model describing the final energy demand rate for heating a building using groups of features describing real residential buildings undergoing thermomodernization. The selection of the listed features was performed using the BORUTA algorithm [54]. Boruta uses the method of selection of all relevant features, where it captures all features that are relevant to the decision variable under certain conditions. The selection results were decided to be used to build a predictive model using rough set theory (RST) [55]. It should be noted that, as shown in the literature review [1], it has not yet been used in the energy assessment of buildings and therefore represents a novelty in this type of research. Given that an important aspect when building a predictive model is to reduce the number of input variables, it was additionally decided to check whether, when building a predictive model, all features indicated by the BORUTA algorithm as relevant should be selected or whether the number of features can be reduced and how such a reduction would affect the accuracy of energy consumption prediction. To assess the quality of the developed prediction model, evaluation metrics such as [56]: MAPE, MBE, CV RMSE and R2, which are accepted as statistical calibration standards by ASHRAE (American Society of Heating, Refrigerating and Air-Conditioning Engineers) [57], were used.

2. Materials and Methods
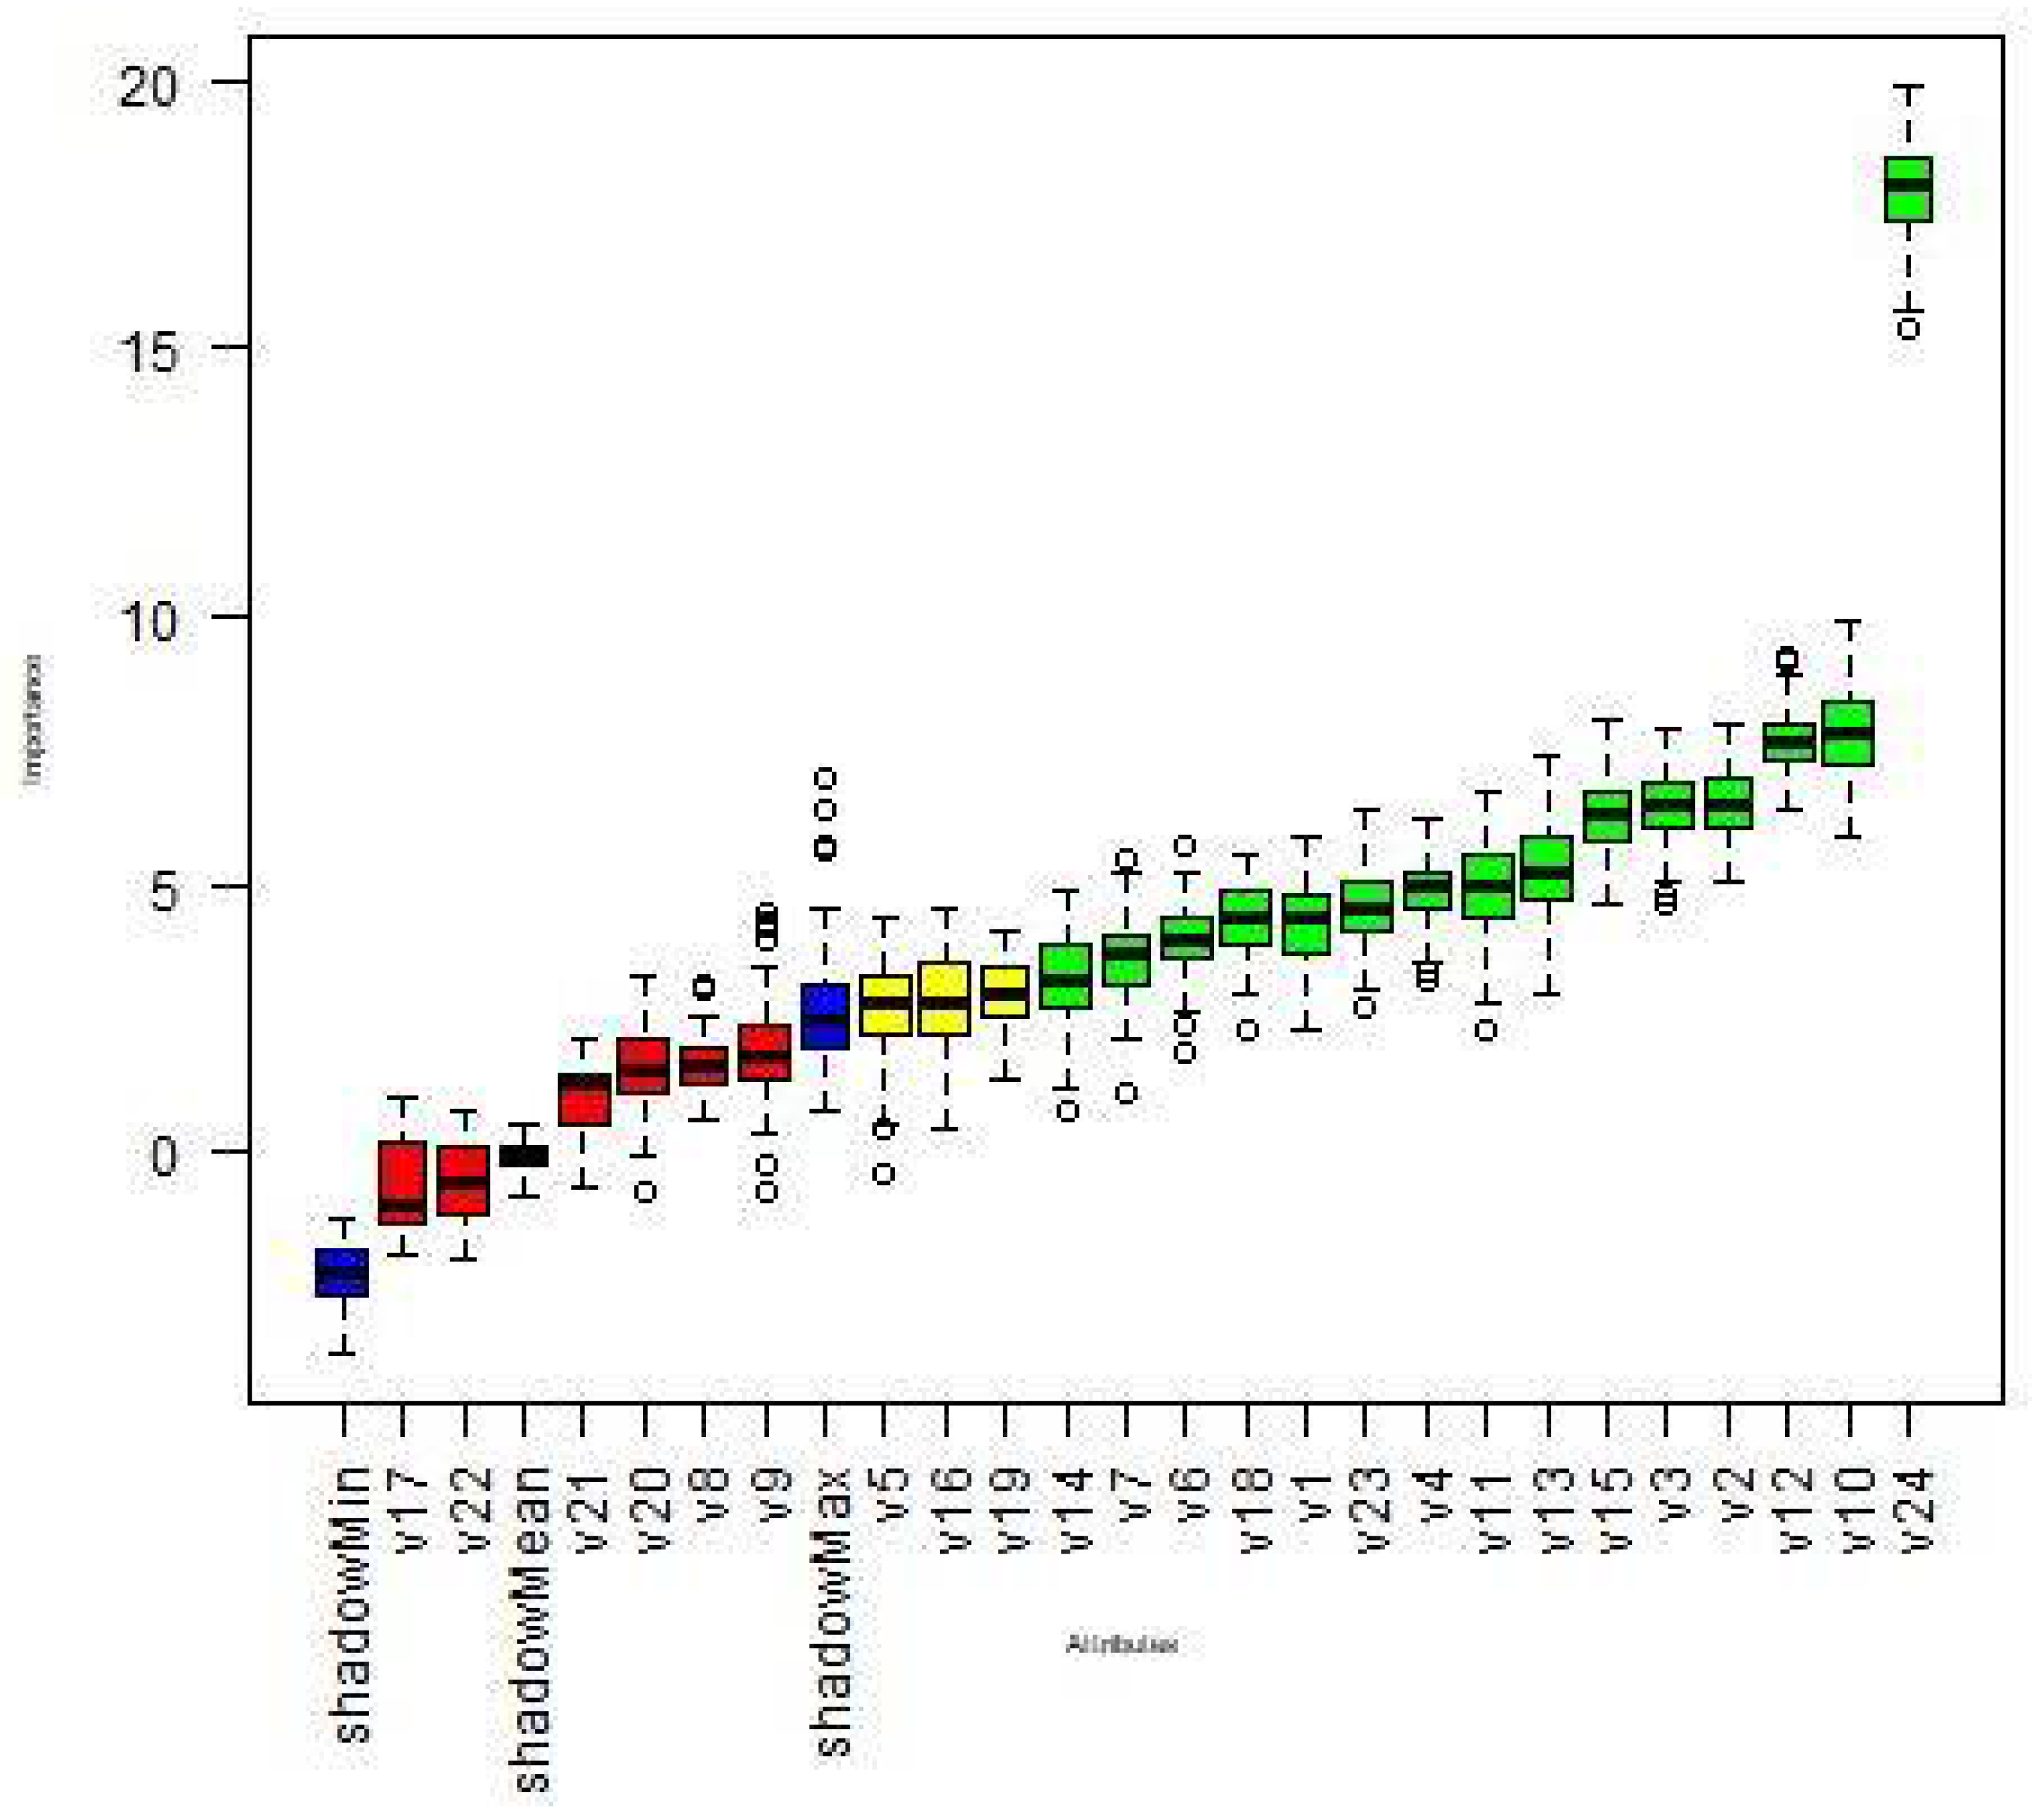
The research was conducted on a sample of one hundred and nine multi-family residential buildings erected in the 1960s and 1970s in prefabricated technology (made of large plates). The buildings underwent thermomodernization in 2010–2015. The considered subjects are heated from the municipal district heating network. Thanks to that, information about actual heat consumption for heating was obtained. For the analyzed group of buildings, energy characteristics were performed in accordance with the methodology for determining the energy performance of the building [58], applicable in Poland, according to the method based on the actual energy consumption for heating. Energy consumption was determined for the state before and after performing thermal improvement, using heat consumption data from three heating seasons. To exclude seasonal variations, the actual energy consumption values were adjusted to standard season conditions. On this basis, indices of final energy demand for heating were determined. Additionally, for buildings, which did not have information regarding the ordered thermal power for heating, calculations of the design heat load for heating before thermomodernization were carried out according to ISO 12,831 [59]. The analyzed buildings were characterized by a set of features. Some of them are measured and others are calculated. These features are of typical energetic character, like, for example, power demand for heating the building or seasonal energy demand for heating, and others describe for example structural parameters like surface areas of partitions through which heat losses occur, heated volume, heat transfer coefficients through partitions. These features describe buildings in the state before thermal improvements were made. Utility parameters are also taken into account, such as, for example, the number of people using the building. The data set includes also qualitative features, such as information, which partition was subjected to thermomodernization. Each of the qualitative features could be in two response options “Yes” or “No”. These words were replaced by digits: “1” and “0”. The value “1” was put when a given event occurred (the partition was thermomodernized). Otherwise, when the event did not occur, the feature took the value “0”. The features characterizing the investigated buildings were marked successively v1, v2, …, v23, v24, and they are conditional variables (corresponding to features) for the rough model. The decision variable (index of final energy demand for heating after modernization) is labeled with d. The features describing the building are characterized by high variability as shown in Table 1, which lists features affecting energy demand for heating.
The set of features describing the energy consumption in the investigated buildings presented in Table 1 is characterized by a large variability. The specificity of the features also indicates a great variety of ways of coding the given features, which occur both in qualitative and quantitative form, some of them are measured and some of them are calculated, so reference point is needed to help distinguishing the really important features from the unimportant ones. To cope with this problem, we used an algorithm that provides criteria for selecting relevant (important) features. To select relevant features, we have applied the BORUTA algorithm [54]. It is worth noting that in addition to selecting relevant features, the algorithm also creates a ranking of their relevance. The BORUTA algorithm applies random forests for feature relevance estimation. The random forest is a very popular learning model for solving a variety of classification and regression problems [60]. The random forest is based on a multitude of decision trees which are independently developed on different sample bags taken from the training set. The algorithm is designed as a wrapper method. The original dataset is extended by adding the so-called shadow features whose values are randomly permuted among the training cases to remove their correlations with a decision variable. The importance estimation of a feature is calculated as the loss of classification accuracy caused by a random permutation of feature values of cases. First, the loss of classification accuracy is computed individually for all decision trees in the forest which make use of a given feature to classify cases and then the average and standard deviation of the loss of classification accuracy are computed. An importance measure is the Z score computed by dividing the average loss by its standard deviation. The importance measure is used to determine the ranking of features. In addition to generation of the feature ranking, the BORUTA algorithm classifies features into three types:
  • Confirmed.
  • Tentative.
  • Rejected.
The Z score is calculated for each feature. Then, the maximum Z score (MZS) among shadow features is identified and a hit is assigned to every feature that is scored better than MZS. The two-sided equality test with MZS is applied. The features which have importance significantly lower than MZS are treated as irrelevant (rejected) ones. The features which have importance significantly higher than MZS are treated as relevant (confirmed) ones. The remaining features are treated as tentative ones.
After establishing the list of “importance” of features, the developed database was subdivided into a training set, to which 80% of the studied buildings were randomly selected, and a test set formed from the remaining objects. A method based on rough set theory (RST) was used to build a model to determine the annual heat demand of residential buildings undergoing thermal upgrading. Approximate sets proposed by Z. Pawlak [56] are a suitable tool for dealing with general (imprecise) and ambiguous data. The rough sets serve as a methodology in the process of discovering knowledge in data-bases. It is a tool used to de-scribe inaccurate, uncertain knowledge; to model decision-making systems; and for ap-proximation reasoning [55].It allows us to bring more flexibility in data mining to rough set theory and to analyze observations expressed in quantitative and qualitative forms. The methodology for building predictive models based on rough set theory is presented in papers [35,61,62,63]. To build the model, the rough set exploration system RSES 2.1 (Department of Logic of the Institute of Mathematics, University of Warsaw, Poland). was used, which is a computer tool that enables the analysis of data in a tabular form, using rough set theory [64].
To evaluate the quality of the developed prediction model, evaluation metrics such as [56] mean bias error (MBE), coefficient of variance root mean square error (CV RMSE) and coefficient of determination (R2), and mean absolute percentage error (MAPE), were used.
M B E = m = 1 n g ( y i y i P ) m = 1 n g y i · 100 %   m = 1 , 2 , 3 , n g
C V   R M S E = m = 1 n g ( y i y i P ) 2 y i 1 n g   m = 1 n g y i · 100 %   m = 1 , 2 , 3 , n g
R 2 = ( n g · m = 1 n g y i · y i P m = 1 n g y i · m = 1 n g y i P ( n g · m = 1 n g y i 2 ( m = 1 n g y i ) 2 ) · ( n g · m = 1 n g y i P   2 ( m = 1 n g y i P ) 2 ) ) 2
M A P E = 1 n g m = 1 n g | y i y i P y i | · 100 %   m = 1 , 2 , 3 , n g
where yi is the actual value (quantity) in the facility i, and ypi is the forecast value (quantity) in the facility i. The difference between yi and ypi is divided by the actual value yi and m is the index of the test object, ng is the number of objects (m = 1,2,3,..,ng).
According to ASHRAE Guideline 14 criteria [56,57], for the model to be considered well calibrated, the value of the evaluation indices should not exceed:
  • MBE index ± 5%,
  • CV RMSE index 15%,
However, the value of the coefficient of determination should be R2 ≥ 0.75.
To see how the choice of features would affect the prediction accuracy of the model, it was decided to create four subsets of input features for comparison, i.e.,
  • SET 1–the subset of features indicated by the algorithm as “confirmed”.
  • SET 2–a subset of the features indicated as “confirmed” by the algorithm, with the top 10 (indicated by the algorithm) features selected for analysis.
  • SET 3–a subset of the features indicated as “confirmed” by the algorithm, with the top 3 (indicated by the algorithm) features selected for analysis.
  • SET 4–the subset of features indicated by the algorithm as “confirmed “+”tentative”.

3. Results and Discussion

In the first part of building the prediction model, the database containing 24 features was subjected to selection to find all of the important features influencing the final energy consumption after thermomodernization. The listed features inform about e.g., power demand, seasonal energy consumption for heating of the building before thermomodernization, area of partitions, through which heat losses occur, heated cubature, heat transfer coefficients, number of occupants as well as which partition was thermomodernized. The selection of the mentioned features was performed in R using the BORUTA package. Boruta uses all relevant features selection method, where it captures all features that are relevant to the decision variable under certain circumstances. This algorithm finds all features that are strongly or weakly significant for the decision variable. The selection results are summarized in Table 2 and illustrated in box plot 2.
In Table 2, the meaning of columns is as follows: Mean Imp–the mean of IMp, Median Imp–the median of IMp, Min Imp–the minimum of IMp, Max Imp–the maximum of IMp, Norm Hits - the number of hits normalized to number of importance source runs, where IMp is the importance measure computed over multiple iterations. As it can be seen in Table 2, BORUTA indicated the answer on the importance of features in the dataset. In this case, out of 24 features, six of them are rejected and 15 are confirmed. Three features are marked as tentative. The tentative features have meanings so close to their best shadow features, the Boruta is unable to make decisions with the desired confidence in the default number of runs of the random forest.
The resulting graph (Figure 1) generated using the BORUTA package in the R environment, after features classification, indicated the importance (axis Y) of the analyzed features (put on axis X) by ranking and color-coding them. From the box-plot, the blue box-plots correspond to the shadow features. We have three blue box-plots for minimum, average, and maximum shadow feature values. The green box-plots correspond to features that were confirmed as valid features, and the red box-plots correspond to features that were confirmed as irrelevant features. The yellow box-plots correspond to features that are uncertain, i.e., the algorithm was not able to come to a conclusion about their importance.
Based on the selection result, it can be concluded that the important features (confirmed), that affect the final energy consumption after thermal upgrading, are: v24–index of final energy demand for heating before modernization (calculated from measurements of actual energy consumption for heating), v10–shape coefficient of buildings (the ratio surface to volume), v12–calculated thermal transmittance of peak walls components, v2–calculated from interior measurements total (net internal area), v3–calculated surface of heated floors from interior measurements, v15–calculated thermal transmittance of floor components on the ground, v13–calculated thermal transmittance of roof projections components, v11–calculated thermal transmittance of walls components, v4–calculated from exterior measurements surface of roof projection area (net), v23–heating consumed power, v18–information whether the peak wall to be thermal improved, v1–calculated from exterior measurements the heated volume of building, v6–calculated surface of floor from interior measurements (floor over basement or floor on the ground), v7–calculated from exterior measurements total windows area, v14–calculated thermal transmittance of floors components (floor over basement).
However, it is uncertain (but cannot be excluded) whether features such as v19, information whether the roof needs to be thermal improved, v16, thermal transmittance of windows, and v5, calculated from exterior measurements total wall surface area, have an impact on energy consumption after thermal upgrading.
After the selection of features, the next step in building the predictive model was to randomly divide the database into a training set and a test set (in an 80/20 ratio). Considering the obtained feature selection results, the input data characterizing the buildings were divided into four sets of features, which differ in the number of features, i.e., set 1, which contained the data indicated by the algorithm as “confirmed”, the top 10 features indicated by the algorithm as “confirmed” for which the Norm Hits index value was greater than 0.9 were selected for set 2. In the third set, we limited ourselves to 3 features for which the Norm Hits value was equal to 1 and set 4, which consists of the features labeled as “confirmed” and “tentative”. Table 3 lists the individual features included in the sets of features, with the feature’s membership in a given set denoted by 1.
The sets of features presented in Table 3 will allow one to see whether in building a predictive model one should select all features identified as “confirmed” by the BORUTA algorithm, or whether one can limit the number of features to the group for which the Norm Hits index value will be greater than 0.9 or equal to 1, and how such a limitation will affect the accuracy of energy consumption prediction. Evaluating the features summarized in Set 4 will further answer the question of how the features marked as tentative will answer affect the prediction accuracy of the model. The features selected by the BORUTA algorithm, describing buildings in the state before thermomodernization, were used to build a model for predicting energy consumption for heating after thermomodernization, which is based on rough set theory (RST). For each group from the training set, reducts and the core of the feature set were determined and used to build the inference model. The reduct in rough set theory is a sufficient set of features that can be used to reason about the value of the decision variable. For a given data set, many reducts can be found. Therefore, the set of features which is common to all reducts can be determined. This set is called the core. The built model was critically analyzed (on the test set) for the accuracy and quality of the built prediction using evaluation metrics such as MAPE, MBE, CV RMSE and R2 [57]. The results of calculating the quality and accuracy of the built models depending on the selected set of features are presented in Table 4.
Analyzing the results presented in Table 4, it can be concluded that the model based on rough set theory (RST), based on the features selected by the BORUTA algorithm, allows to obtain satisfactory prediction quality. However, as it can be seen, dataset 1 (marked as confirmed by the BORUTA algorithm) affects the better fit of the model to the real data-this is confirmed by the values of three evaluation indicators. Limiting the number of features to ten for which Norm Hits > 0.9 (dataset 2) had little effect on changing the magnitude of the evaluation indices (MBE and MAPE error values increased by about 1%, CV RSME error increased by 0.02%, while R2 coefficient of determination decreased by 0.03). Similarly, results were observed when the selection of three features indicated by the algorithm as the best were selected: Norm Hits = 1 (Set 3), MAPE error values increased by about 1%, MBE by 2.3%, CV RSME error increased by 0.4%, while R2 coefficient of determination decreased by 0.04 compared to the first set of features. Thus, the model based on a limited number of features (Set 2 and 3) can be considered suitable for practical application. Set 4, which in the set of features also includes data marked as uncertain by BORUTA, gives worse predictive results (only one MBE index is more favorable than in Set 1). This indicates that the increased number of features negatively affected the predictive quality of the model. The presented prediction results based on features selected by the algorithm give significantly better results compared to the model built based on manual feature selection based on domain knowledge. In papers [35], based on the same set of real objects, a prediction models was built based on 4 sets of features with different amounts of data that were manually selected. In this case, the best result was characterized by error values of for a model based on rough set theory (RST): MAPE 14%, MBE –9.6%, and CV RMSE 18.8%

4. Conclusions and Perspectives

Based on analyses carried out on a group of 109 multi-family residential buildings constructed in large-panel technology, for which energy characteristics were prepared based on the actual energy consumption for heating before and after performing thermal improvement, a group of 24 features was distinguished. These data can be used to build a prediction model of energy consumption for heating after thermal improvement. Since features describing real buildings may be characterized by missing values, duplicate or inconsistent features, noise, and outliers, it was decided to perform a selection of features to choose the most relevant ones. The selection of the mentioned features was performed using the BORUTA algorithm. Boruta uses all significant features selection method, where he captures all features that are significant for the decision variable under certain conditions. It was decided to use the selection results to build a prediction model using rough set theory (RST). Additionally, it was decided to check whether building a prediction model one should select all the features defined by the BORUTA algorithm as “confirmed” or whether one can limit the number of features, and how such a limitation would influence the accuracy of energy consumption prediction. The obtained prediction model quality results were evaluated according to statistical calibration standards that are adopted by ASHRAE. Based on the calculations performed, the following conclusions can be made:
  • Evaluating the usefulness of the different sets of variables according to the indices proposed by ASHARE, it was found that the use of the feature sets indicated by the BORUTA algorithm in the prediction model yielded errors for the test set of: MAPE 9.2–10.7%; MBE 2.4–4.7%; CV RMSE 5.49–5.89%; and R2 0.85–0.81,
  • The data set consisting of 14 descriptive characteristics marked by the BORUTA algorithm as “confirmed” is the best fit of the model to the real data, confirmed by the values of all evaluation indicators,
  • Limiting the number of conditional attributes to 10, had little effect on changing the size of the evaluation indices. Analogous results were obtained when selecting 3 conditional attributes indicated by the algorithm as the best, so the model based on a limited number of input variables can be considered suitable for practical application,
  • The method of data classification indicated in this paper together with the forecasting model will make it possible to quickly determine the energy saving potential of buildings without the need to perform detailed (and thus expensive) engineering calculations. Three data describing the building before thermomodernization can be sufficient to estimate energy consumption (after thermal improvement): index of final energy demand for heating before modernization (calculated from measurements of actual energy consumption for heating), shape coefficient of buildings (the ratio surface to volume) and calculated thermal transmittance of peak walls components,
  • Increasing the number of conditional attributes beyond those indicated as “confirmed” by the BORUTA algorithm yields poorer predictive performance. This indicates that an increased number of attributes negatively affects the predictive quality of the model,
  • In further research, the authors plan to test the usefulness of the presented set of methods for predicting energy consumption in other types of real buildings, such as single-family residential buildings, schools, kindergartens, and others. This will allow a broader assessment of the usefulness of the BORUTA algorithm for input data selection in an energy consumption forecasting model based on rough set theory. It is also planned to compare other methods of classification of input variables based on these objects, i.e., real ones.
  • To be able to compare the quality of the predictions with the results in other works, the authors plan to use publicly available databases such as “ASHRAE - Great Energy Predictor III, the Kaggle competition” [65] to evaluate the performance of the algorithms. This will allow to test and compare the applicability of the presented method on data that are used by other researchers in building prediction models.

Author Contributions

Conceptualization, T.S.; software, K.P. and T.S.; data curation, T.S.; investigation, T.S.; methodology, T.S.; project administration, T.S.; supervision, T.S.; funding, S.T.; writing—original draft, T.S; writing—reviewing and editing T.S. and S.T. All authors have read and agreed to the published version of the manuscript.

Funding

This research was funded by University of Agriculture in Krakow, Poland.

Institutional Review Board Statement

Not applicable.

Informed Consent Statement

Not applicable.

Data Availability Statement

Data is contained within the article: doi:10.3390/en13061309 (accessed on 2 March 2021).

Acknowledgments

We are grateful to Thomas G. Mathia from Laboratoire de Tribologie et Dynamique des Systèmes, École Centrale de Lyon, France for very fruitful scientific discussions.

Conflicts of Interest

The authors declare no conflict of interest.

References

  1. Zhang, L.; Wen, J.; Li, Y.; Chen, J.; Ye, Y.; Fu, Y.; Livingood, W. A review of machine learning in building load prediction. Appl. Energy 2021, 285, 116452. [Google Scholar] [CrossRef]
  2. Li, X.; Wen, J. Review of building energy modeling for control and operation. Renew. Sustain. Energy Rev. 2014, 37, 517–537. [Google Scholar] [CrossRef]
  3. Zhao, H.; Magoulès, F. A review on the prediction of building energy consumption. Renew. Sustain. Energy Rev. 2012, 16, 3586–3592. [Google Scholar] [CrossRef]
  4. Bourdeau, M.; Zhai, X.-Q.; Nefzaoui, E.; Guo, X.; Chatellier, P. Modelling and forecasting building energy consumption: A review of data-driven techniques. Sustain. Sustain. Cities Soc. 2019, 48, 101533. [Google Scholar] [CrossRef]
  5. Fumo, N. A review on the basics of building energy estimation. Renew. Sustain. Energy Rev. 2014, 31, 53–60. [Google Scholar] [CrossRef]
  6. Foucquier, A.; Robert, S.; Suard, F.; Stéphan, L.; Jay, A. State of the art in building modelling and energy performances prediction: A review. Renew. Sustain. Energy Rev. 2013, 23, 272–288. [Google Scholar] [CrossRef] [Green Version]
  7. Fan, C.; Xiao, F.; Zhao, Y. A short-term building cooling load prediction method using deep learning algorithms. Appl. Energy 2017, 195, 222–233. [Google Scholar] [CrossRef]
  8. Peng, Y.; Rysanek, A.; Nagy, Z.; Schlüter, A. Using machine learning techniques for occupancy-prediction-based cooling control in office buildings. Appl. Energy 2018, 211, 1343–1358. [Google Scholar] [CrossRef]
  9. Chou, J.-S.; Bui, D.-K. Modeling heating and cooling loads by artificial intelligence for energy-efficient building design. Energy Build. 2014, 82, 437–446. [Google Scholar] [CrossRef]
  10. Aydinalp-Koksal, M.; Ugursal, V.I. Comparison of neural network, conditional demand analysis, and engineering approaches for modeling end-use energy consumption in the residential sector. Appl. Energy 2008, 85, 271–296. [Google Scholar] [CrossRef]
  11. Hygh, J.S.; DeCarolis, J.F.; Hill, D.B.; Ranjithan, S.R. Multivariate regression as an energy assessment tool in early building design. Build. Environ. 2012, 57, 165–175. [Google Scholar] [CrossRef]
  12. Azadeh, A.; Saberi, M.; Seraj, O. An integrated fuzzy regression algorithm for energy consumption estimation with non-stationary data: A case study of Iran. Energy 2010, 35, 2351–2366. [Google Scholar] [CrossRef]
  13. Ahmad, M.W.; Mourshed, M.; Rezgui, Y. Trees vs. Neurons: Comparison between random forest and ANN for high-resolution prediction of building energy consumption. Energy Build. 2017, 147, 77–89. [Google Scholar] [CrossRef]
  14. Yu, Z.; Haghighat, F.; Fung, B.C.M.; Yoshino, H. A decision tree method for building energy demand modeling. Energy Build. 2010, 42, 1637–1646. [Google Scholar] [CrossRef] [Green Version]
  15. Ahmad, T.; Chen, H. Short and medium-term forecasting of cooling and heating load demand in building environment with data-mining based approaches. Energy Build. 2018, 166, 460–476. [Google Scholar] [CrossRef]
  16. Yun, K.; Luck, R.; Mago, P.J.; Cho, H. Building hourly thermal load prediction using an indexed ARX model. Energy Build. 2012, 54, 225–233. [Google Scholar] [CrossRef]
  17. Yao, Y.; Lian, Z.; Liu, S.; Hou, Z. Hourly cooling load prediction by a combined forecasting model based on Analytic Hierarchy Process. Int. J. Therm. Sci. 2004, 43, 1107–1118. [Google Scholar] [CrossRef]
  18. Szul, T.; Nęcka, K.; Mathia, T.G. Neural Methods Comparison for Prediction of Heating Energy Based on Few Hundreds Enhanced Buildings in Four Season’s Climate. Energies 2020, 13, 5453. [Google Scholar] [CrossRef]
  19. Ekici, B.B.; Aksoy, U.T. Prediction of building energy needs in early stage of design by using ANFIS. Expert Syst. Appl. 2011, 38, 5352–5358. [Google Scholar] [CrossRef]
  20. Sholahudin, S.; Han, H. Simplified dynamic neural network model to predict heating load of a building using Taguchi method. Energy 2016, 115, 1672–1678. [Google Scholar] [CrossRef]
  21. Massana, J.; Pous, C.; Burgas, L.; Melendez, J.; Colomer, J. Short-term load forecasting in a non-residential building contrasting models and attributes. Energy Build. 2015, 92, 322–330. [Google Scholar] [CrossRef] [Green Version]
  22. Li, K.; Su, H. Forecasting building energy consumption with hybrid genetic algorithm-hierarchical adaptive network-based fuzzy inference system. Energy Build. 2010, 42, 2070–2076. [Google Scholar] [CrossRef]
  23. Mohammadi, M.; Talebpour, F.; Safaee, E.; Ghadimi, N.; Abedinia, O. Small-Scale Building Load Forecast based on Hybrid Forecast Engine. Neural Process. Lett. 2018, 48, 329–351. [Google Scholar] [CrossRef]
  24. Li, K.; Su, H.; Chu, J. Forecasting building energy consumption using neural networks and hybrid neuro-fuzzy system: A comparative study. Energy Build. 2011, 43, 2893–2899. [Google Scholar] [CrossRef]
  25. Mocanu, E.; Phuong, H.; Nguyen, P.H.; Gibescu, M.; Klinget, W.L. Deep learning for estimating building energy consumption. Sustain. Energy Grids Netw. 2016, 6, 91–99. [Google Scholar] [CrossRef]
  26. Mocanu, E.; Nguyen, P.H.; Kling, W. L; Gibescu., M. Unsupervised energy prediction in a smart grid context using reinforcement cross-building transfer learning. Energy Build. 2016, 116, 646–655. [Google Scholar] [CrossRef] [Green Version]
  27. Jain, R.K.; Smith, K.M.; Culligan, P.J.; Taylor, J.E. Forecasting energy consumption of multi-family residential buildings using support vector regression: Investigating the impact of temporal and spatial monitoring granularity on performance accuracy. Appl. Energy 2014, 123, 168–178. [Google Scholar] [CrossRef]
  28. Dong, B.; Cao, C.; Lee, S.E. Applying support vector machines to predict building energy consumption in tropical region. Energy Build. 2005, 37, 545–553. [Google Scholar] [CrossRef]
  29. Zhao, H.X.; Magoulès, F. Parallel support vector machines applied to the prediction of multiple buildings energy consumption. J. Algorith. Comput. Technol. 2010, 4, 231–249. [Google Scholar] [CrossRef]
  30. Wang, J.; Li, L.; Niu, D.; Tanaet, Z. An annual load forecasting model based on support vector regression with differential evolution algorithm. Appl. Energy 2012, 94, 65–70. [Google Scholar] [CrossRef]
  31. Xue, J.; Xu, Z.; Watada, J. Building an integrated hybrid model for short-term and mid-term load forecasting with genetic optimization. Int. Innovat. Comput. Inform. Control. 2012, 8, 7381–7391. [Google Scholar]
  32. Nie, H.; Liu, G.; Liu, X.; Wang, Y. Hybrid of ARIMA and SVMs for short-term load forecasting. Energy Procedia 2012, 16, 1455–1460. [Google Scholar] [CrossRef] [Green Version]
  33. Brown, M.; Barrington-Leigh, C.; Brown, Z. Kernel regression for real-time building energy analysis. J. Build. Perform. Simul. 2012, 5, 263–276. [Google Scholar] [CrossRef]
  34. Sudheer, G.; Suseelatha, A. Short term load forecasting using wavelet transform combined with Holt-Winters and weighted nearest neighbor models. Int. J. Electr. Power Energy Syst. 2015, 64, 340–346. [Google Scholar] [CrossRef]
  35. Szul, T.; Kokoszka, S. Application of Rough Set Theory (RST) to Forecast Energy Consumption in Buildings Undergoing Thermal Modernization. Energies 2020, 13, 1309. [Google Scholar] [CrossRef] [Green Version]
  36. Howaniec, H. Zaangażowanie Społeczne Przedsiębiorstw Jako Element Marketingu Wartości/Corporate Social Involvement as an Element of Value-Based Marketing; CeDeWu: Warszawa, Poland, 2019; ISBN 978-83-8102-265-1. Available online: https://cedewu.pl/Zaangazowanie-spoleczne-przedsiebiorstw-jako-element-marketingu-wartosci-p2438?pdf= (accessed on 25 February 2021).
  37. Kumar, S.; Pal, S.K.; Singh, R.P. A novel method based on extreme learning machine to predict heating and cooling load through design and structural attributes. Energy Build. 2018, 176, 275–286. [Google Scholar] [CrossRef]
  38. Monfet, D.; Corsi, M.; Choinière, D.; Arkhipova, E. Development of an energy prediction tool for commercial buildings using case-based reasoning. Energy Build. 2014, 81, 152–160. [Google Scholar] [CrossRef]
  39. Wi, Y.-M.; Joo, S.-K.; Song, K.-B. Holiday load forecasting using fuzzy polynomial regression with weather feature selection and adjustment. IEEE Trans. Power Syst. 2011, 27, 596–603. [Google Scholar] [CrossRef]
  40. Song, K.-B.; Baek, Y.-S.; Hong, D.H.; Jang, G. Short-Term Load Forecasting for the Holidays Using Fuzzy Linear Regression Method. IEEE Trans. Power Syst. 2005, 20, 96–101. [Google Scholar] [CrossRef]
  41. Guyon, I.; Elisseeff, A. An introduction to variable and feature selection. J. Mach. Learn. Res. 2003, 3, 1157–1182. [Google Scholar] [CrossRef] [Green Version]
  42. Kusiak, A.; Li, M.; Zhang, Z. A data-driven approach for steam load prediction in buildings. Appl. Energy 2010, 87, 925–933. [Google Scholar] [CrossRef]
  43. Jurado, S.; Nebot, À.; Mugica, F.; Avellana, N. Hybrid methodologies for electricity load forecasting: Entropy-based feature selection with machine learning and soft computing techniques. Energy 2015, 86, 276–291. [Google Scholar] [CrossRef] [Green Version]
  44. Zhao, H.-X.; Magoulès, F. Feature selection for predicting building energy consumption based on statistical learning method. J. Algorith. Comput. Technol. 2012, 6, 59–77. [Google Scholar] [CrossRef]
  45. Szul, T. Ocena Efektywności Energetycznej Budynków/Energy Efficiency Rating of Buildings; Wydawnictwo Naukowe INTELLECT: Waleńczów, Poland, 2018; ISBN 978-83-950526-3-7. [Google Scholar]
  46. Sala-Cardoso, E.; Delgado-Prieto, M.; Kampouropoulos, K.; Romeral, L. Activity-aware HVAC power demand forecasting. Energy Build. 2018, 170, 15–24. [Google Scholar] [CrossRef]
  47. Ghofrani, M.; Ghayekhloo, M.; Arabali, A. A hybrid short-term load forecasting with a new input selection framework. Energy 2015, 81, 777–786. [Google Scholar] [CrossRef]
  48. Dodier, R.H.; Henze, G.P. Statistical analysis of neural networks as applied to building energy prediction. J. Sol. Energy Eng. 2004, 126, 592–600. [Google Scholar] [CrossRef]
  49. Ceperic, E.; Ceperic, V.; Baric, A. A strategy for short-term load forecasting by support vector regression machines. IEEE Trans. Power Syst. 2013, 28, 4356–4364. [Google Scholar] [CrossRef]
  50. Jovanović, R.Ž.; Sretenović, A.A.; Živković, B.D. Ensemble of various neural networks for prediction of heating energy consumption. Energy Build. 2015, 94, 189–199. [Google Scholar] [CrossRef]
  51. Fan, C.; Xiao, F.; Wang, S. Development of prediction models for next-day building energy consumption and peak power demand using data mining techniques. Appl. Energy 2014, 127, 1–10. [Google Scholar] [CrossRef]
  52. Son, H.; Kim, C. Forecasting short-term electricity demand in residential sector based on support vector regression and fuzzy-rough feature selection with particle swarm optimization. Procedia Eng. 2015, 118, 1162–1168. [Google Scholar] [CrossRef] [Green Version]
  53. Zhang, L.; Wen, J. A systematic feature selection procedure for short-term data driven building energy forecasting model development. Energy Build. 2019, 183, 428–442. [Google Scholar] [CrossRef]
  54. Kursa, M.B.; Rudnicki, W.R. Feature Selection with the Boruta Package. J. Stat. Softw. 2010, 36, 11. [Google Scholar] [CrossRef] [Green Version]
  55. Pawlak, Z. Rough Sets. Theoretical Aspects of Reasoning about Data; Kluwer Academic Press: Dordrecht, The Netherlands, 2012; Available online: http://bcpw.bg.pw.edu.pl/Content/2026/RoughSetsRep29.pdf (accessed on 5 November 2020).
  56. Ruiz, G.R.; Bandera, C.R. Validation of Calibrated Energy Models: Common Errors. Energies 2017, 10, 1587. [Google Scholar] [CrossRef] [Green Version]
  57. ASHRAE. American Society of Heating, Ventilating, and Air Conditioning Engineers (ASHRAE). Guideline 14-2014, Measurement of Energy and Demand Savings; Technical Report; American Society of Heating, Ventilating, and Air Conditioning Engineers: Atlanta, GA, USA, 2014; Available online: https://scholar.google.com/scholar_lookup?title=American+Society+of+Heating,+Ventilating,+and+Air+Conditioning+Engineers+(ASHRAE).+Guideline+14-2014,+Measurement+of+Energy+and+Demand+Savings&author=ASHRAE&publication_year=2014 (accessed on 22 February 2021).
  58. Regulation of the Minister of Infrastructure and Development of 27 February 2015 on the Methodology for Determining the Energy Performance of a Building or Part of a Building and Energy Performance Certificates. Dz.U. 2015 poz. 376. Poland. Available online: http://isap.sejm.gov.pl/isap.nsf/download.xsp/WDU20150000376/O/D20150376.pdf (accessed on 11 February 2021).
  59. CEN. European Standard: Heating Systems in Buildings; ISO 12831-1:2017-08; CEN: Brussels, Belgium, 2017. [Google Scholar]
  60. Breiman, L. Random forests. Mach. Learn. 2001, 45, 5–32. [Google Scholar] [CrossRef] [Green Version]
  61. Nguyen, D.V.; Yamada, K.; Unehara, M. Extended Tolerance Relation to Define a New Rough Set Model in Incomplete Information Systems. AFS 2013, 372091. [Google Scholar] [CrossRef] [Green Version]
  62. Renigier-Biłozor, M. Zastosowanie Teorii Zbiorów Przybli Żonych do Masowej Wyceny Nieruchomości na Małych Rynkach (Application of Rough Set Theory for Mass Valuation of Real Estate in Small Markets). Acta Sci. Pol. Adm. Locorum 2008, 7, 35–51. Available online: http://tnn.org.pl/tnn/publik/19/TNN_Tom_XIX_1.pdf (accessed on 1 March 2021).
  63. Szul, T.; Nęcka, K.; Knaga, J. Application of Rough Set Theory to Establish the Amount of Waste in Households in Rural Areas. Ecol. Chem. Eng. S. 2017, 24, 311–325. [Google Scholar] [CrossRef] [Green Version]
  64. Rough Set Exploration System 2.1. Available online: http://logic.mimuw.edu.pl/∼rses (accessed on 7 January 2021).
  65. Miller, C.; Arjunan, P.; Kathirgamanathan, A.; Fu, C.; Roth, J.; Park, J.Y.; Balbach, C.; Gowri, K.; Nagy, Z.; Fontanini, A.D.; et al. The ASHRAE Great Energy Predictor III competition: Overview and results. Sci. Technol. Built Environ. 2020, 26, 1427–1447. [Google Scholar] [CrossRef]
Figure 1. Feature selection importance graph using the BORUTA algorithm.
Energies 14 02779 g001
Table 1. Characteristics of features affecting the reduction of annual energy demand for heating in multifamily residential buildings.
AttributeUnitMinMaxAverageCoefficient of Variation *
v1–the heated volume of building (EM)m31308.022935.66393.162.9
v2–total (net internal area) (IM)m2384.95077.21764.054.4
v3–surface of heated floors (IM)m2372.74985.01568.553.4
v4–surface of roof projection area (net) (EM)m287.21253.0467.055.5
v5–total walls surface (net) area (EM)m2296.33897.31096.849.7
v6–surface of floor from interior measurements (floor over basement or floor on the ground) (IM)m212.21075.1395.458.8
v7–total windows area (EM)m269.7838.3290.754.1
v8–number of residential flats, premisespc.6.0142.032.462.8
v9–number of living persons per buildingNb.14.0425.073.967.6
v10–shape coefficient of buildings (the ratio surface to volume)m−10.211.920.4643.7
v11–calculated thermal transmittance of walls componentsW∙m−2·K−10.431.891.0931.9
v12–calculated thermal transmittance of peak walls (side, narrower building walls) componentsW∙m−2·K−10.323.091.0147.7
v13–calculated thermal transmittance of roof projections componentsW∙m−2·K−10.183.561.2585.1
v14–calculated thermal transmittance of floors components (floor over basement)W∙m−2·K−10.262.431.1737.8
v15–calculated thermal transmittance of floor components on the groundW∙m−2·K−10.383.511.6151.7
v16–thermal transmittance of windows (commercial data)W∙m−2·K−11.23.51.8830.7
v17–information whether the wall to be thermal improved-010.9813.7
v18–information whether the peak wall (side, narrower building wall) to be thermal improved-010.9328.3
v19–information whether the roof to be thermal improved-010.5296.0
v20–information whether the floor over basement to be thermal improved-010.32146.1
v21–information whether the floor on the ground to be thermal improved-010.06383.5
v22–information whether replacement windows-010.06416.2
v23–heating consumed powerkW36.5413.5129.857.0
v24–index of final energy demand for heating before modernization (calculated from measurements of actual energy consumption for heating)kWh∙m−2·year−183.0566.1253.443.6
d–index of final energy demand for heating after modernizationkWh∙m−2·year−151.2389.2143.646.1
Where: (remark: EM denotes calculation from exterior measurements, IM denotes calculation from interior measurements). * Coefficient of variation–it is defined as the quotient (expressed in %) of the absolute measure of variation (standard deviation) and the average level of the trait value (arithmetic mean).
Table 2. The result of the feature selection process.
No.AttributeMean ImpMedian ImpMin ImpMax ImpNormHitsDecision
1v2417.90618.07715.32619.8811Confirmed
2v107.8547.8165.9159.8871Confirmed
3v127.6727.646.4049.2031Confirmed
4v26.4616.4665.0717.9890.97Confirmed
5v36.4336.4554.6687.9380.97Confirmed
6v156.2786.324.6268.0650.96Confirmed
7v135.265.2252.9537.3720.95Confirmed
8v114.9344.9992.2426.7560.92Confirmed
9v44.8934.9293.236.2240.92Confirmed
10v234.5774.532.7156.3550.91Confirmed
11v184.3594.3732.2785.5490.879Confirmed
12v14.2794.3742.2595.9230.899Confirmed
13v63.9583.9521.885.7360.859Confirmed
14v73.6323.7241.0795.4570.778Confirmed
15v143.2343.2420.8144.8840.687Confirmed
16v192.9622.9511.3324.1220.637Tentative
17v162.8052.8210.4474.5630.607Tentative
18v52.6782.78−0.4134.3760.607Tentative
19v91.8611.805−0.7114.5010.304Rejected
20v81.6581.5950.6093.1570.031Rejected
21v201.6021.555−0.7323.3160.213Rejected
22v210.9391.252−0.6692.1130.021Rejected
23v22−0.48−0.608−1.9640.7770Rejected
24v17−0.684−1.001−1.9261.0020Rejected
Table 3. Sets of features for analyzed predictive models.
No.FeatureSets of Features
Set 1Set 2Set 3Set 4
1v241111
2v101111
3v121111
4v211 1
5v311 1
6 v1511 1
7v1311 1
8v1111 1
9v411 1
10v2311 1
11v181 1
12v11 1
13v61 1
14v71 1
15v141 1
16v19 1
17v16 1
18v5 1
Table 4. Evaluation of the prediction model of heating energy demand ratio based on the tested sets of features emerged by BORUTA algorithm.
Assessment ParametersSets of Features
Set 1Set 2Set 3Set 4
MAPE (%)9.210.710.314.2
MBE (%)2.43.64.70.48
CV RMSE (%)5.495.515.895.92
R2 (-)0.850.820.810.79
Publisher’s Note: MDPI stays neutral with regard to jurisdictional claims in published maps and institutional affiliations.

