1. Introduction
Energy systems, including all energy vectors, such as heating, transportation, and agriculture, are converting to electricity-based energy usage, due to climate change and environmental concerns. The European Commission has the vision of decarbonising the whole energy system by 2050 [
1]. Denmark, in this direction, has the ambition to completely phase-out coal by 2030 [
2]. Renewable based electricity generators, such as hydro, wind, solar photovoltaic (PV), or biomass, are replacing the carbon-based generators. Many of these renewable energy sources are inherently variable in nature, such as wind, solar, or micro-hydro. Consequently, increasing the share of such variable renewable energy (VRE) sources in electricity systems increases the variability and uncertainty in the full energy system.
Maintaining a stable and secure operation in the electricity system with large share of VRE can be very challenging for the power system operators. Major challenges that are involved in operational planning are the estimation of operational reserves [
3], or determining the ramp requirements and flexibility for the generators. This information is then used in order to mitigate the impact of variability in the electric power system.
Operational planning should include the co-optimisation of all the sectors to avoid infeasibilities and sub-optimal solutions. For example, the estimation of reserves from combined heat and power (CHP) units while only performing the optimisation of electrical power systems can create infeasibilities for the units in real-time due to heating constraints and, thereby, challenging the security of the system. Exploiting the synergies of multi-energy analysis can also include, for instance, planning maintenance of the units when considering the needs of the different parts of the energy sector.
The operation of the system generally takes place in real life through different energy markets. Examples of these market for electricity are day-ahead (DA), intra-day, or balancing markets. This paper focuses on simulating the operation of the DA market.
It is generally relevant to consider the unit commitment (UC) problem when simulating the operation of the DA market [
4]. Different UC modelling approaches have been researched for many years [
4,
5,
6]. Mixed integer programming (MIP) is a widely used methodology for UC. However, MIP based methods are computationally expensive. Lagrangian relaxation offers saving in computational time without compromising the accuracy [
7].
The simulation of DA operation of large-scale multi-energy systems when considering UC constraints is computationally challenging. In the literature, either such a problem has been handled for a small system (for example, a six-bus system in [
8]) or a compromise has been made in terms of simulation horizon (24 h in [
9]), technologies involved (such as only for electrical systems), or scenario years analysed. Recently, UC based studies have also been applied for multi-carrier energy systems, but, again, the application has been limited to small test systems [
10]. Performing these operational planning studies for short term can lead to infeasible solutions and it is otherwise sub-optimal for reasons, such as being unable to consider long-term constraints, for example, yearly schedule of hydro reservoirs. The integration of VRE has also been limited in the sense of modelling the details of weather dependencies.
Table 1 shows an analysis of the available literature concerning relevant features for the scope of this paper. It can be observed that there is no available literature that can handle all of the features.
The novelty of this paper involves developing a methodology for integrating all of the features that are mentioned in
Table 1 to simulate the DA market and using the developed methodology to provide analysis and recommendations for future scenarios of very large energy systems. The efficacy of the developed methodology is applied for case studies of large-scale energy systems of North Sea countries for 2020, 2030, and 2050 energy scenarios, including a detailed representation of renewable variations. The computational and practical challenges in modelling and implementation for such a large system are discussed. The computational cost and accuracy of the results for different UC modelling approaches are also compared. Even though the existing literature has deeply investigated the UC problem, introducing such analysis for the context of this study (large scale, different scenario years, multi-energy system) can be relevant in understanding the advantages and disadvantages of the UC approach when simulating the DA market.
The paper is structured, as follows.
Section 2 explains the mathematical model-based methodology that was applied to model the DA market operation. Because the scale of the problem is large in terms of technologies, geography, and time period, special considerations need to be taken in order to reduce computational complexity, as described in
Section 3.
Section 4 presents the case study.
Section 5 shows the results and discusses the limitations of the study, while
Section 6 summarises the conclusions. The symbols used are shown in the nomenclature section at the end of the article.
2. Mathematical Modelling
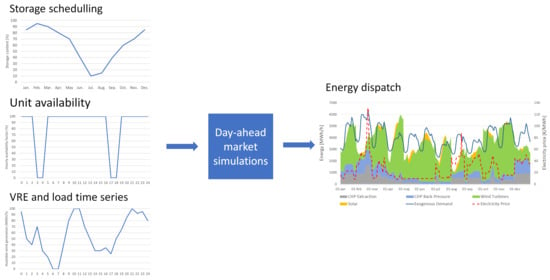
The methodology used in this paper to simulate the DA market can be divided into four stages: DA optimisation (
Section 2.1), VRE simulations (
Section 2.2), storage and planned maintenance optimisation (
Section 2.3), and stochastic outage simulations (
Section 2.4). The stages are linked, as shown in the flow chart of
Figure 1.
Section 2.5 presents the sensitivity cases studied in this paper, which focus on the UC modelling approach.
The optimisations and simulations, except for the VRE simulations, are performed with the energy system model Balmorel [
24], an energy system tool, deterministic, open source [
25], with a bottom-up approach. It has been traditionally used in order to model the electricity and district heating sectors, although it is being developed to increase its capabilities and include more sectors [
26].
The temporal representation used is composed of years y ∈, which are composed of seasons s∈ (in this paper days), which are disaggregated into time steps t∈ (in this paper hours).
The geographical representation used is composed of countries, which are composed of regions r∈, which are composed of areas a∈. The regions in the model represent copperplates for the transmission of electricity. The areas in the model represent copperplates for the transmission of heat.
2.1. Day-Ahead Optimisation
The DA optimisation of the energy markets is performed on a daily basis in order to model the behaviour of the spot market of electricity. This means that consecutive dispatch optimisations of 24 h are performed. The results are linked from day-to-day, meaning that operational decisions made in previous days can have a limiting effect on the operation on the following days, depending on the flexibility of the units g ∈.
The storage content at the beginning of each day for the DA optimisation, as well as the planned maintenance, is fixed from the storage and planned maintenance optimisation. Additionally, the availability of the units within the day is also affected by stochastic outage, which, together with the planned maintenance, determine the final availability of the units to participate in the markets. A detailed mathematical formulation of the problem can be found in Appendix A of [
27]. For the sake of space limitation, only a few equations are shown here.
2.1.1. Objective Function
The objective function includes all the operational costs of the studied system in the studied time steps and during the solving phase the value of the objective function is minimised (Equation (
1)). Furthermore, the time steps considered correspond to one day. In this paper, the costs have been aggregated into variable operational and maintenance costs (
), and emission tax costs (
). The fixed operational and maintenance costs (
), which depend on the installed capacity, are also included in the objective function as a parameter. The disaggregation of these costs can be found in Equations (A2) to (A6) of [
27].
2.1.2. System Constraints
There are two main system constraints that need to be fulfilled in every time step. One of them is the electricity balance in each region. The electricity production (
) of electricity generation units (
) minus the electricity storage loading (
) of storage units (
) and minus the electricity demand resulting from heat production (
) of electricity-to-heat units (
) in all areas that belong to the region (
) must equal the inelastic electricity demand of the region (
) plus the export flows (
) minus import flows (
) with other regions. The transmission losses (
) are allocated to electricity import:
The other system constraint is the heat balance in each area, where the heat production (
) of the units generating heat (
) minus the endogenous loading of heat storage (
) must equal the inelastic heat demand (
):
Ancillary services in the electricity sector were not included to simplify the problem.
2.1.3. Technological Constraints
The generation technologies in the model are split into three categories: dispatchable generation units, pure storage units, and VRE units. Dispatchable technologies include electricity-only, combined heat and power, heat pumps, boilers, geothermal, and hydroelectric power with reservoirs and seasonal inflow. These units are subject to several technical constraints. The operation of these technologies depends on the available units in each time step and the specific technical characteristics of each type. The equations that are relevant for each of these technologies are described from (A29) to (A48) in the report [
27]. The storage units modelled without seasonal inflow that can only modify their storage level based on their active loading and unloading are defined as pure storage units. These technologies are hydro pumping, electric batteries, pit heat storage, or hot water tanks. The relevant equations for these units are Equations (A49) to (A71) in [
27]. The non-dispatchable technologies included are solar heating, solar PV, wind offshore and onshore, and hydro-run-of-river. The equations limiting their production are (A72) and (A73) in [
27]. Furthermore, electricity trade is allowed between regions, which are assumed to be copper plates, and it is limited to the available transmission capacity between the regions in each time step. The relevant equation limiting their operation is (A74) in [
27]. Heat trade between areas is not allowed.
2.2. Modelling of Renewable Generation Including Fluctuations
The CorRES model [
28] is used for the simulation of the VRE generation time series being used as inputs for Balmorel. The CorRES model is based on data from the weather research and forecasting model [
29]. In addition to modelling the spatiotemporal dependencies in solar PV and wind generation, CorRES allows for the modelling of VRE technology development impacts on the VRE time series. For the presented case study, the assumed VRE technology developments towards 2050 are described in [
30]. The resolution of the simulated VRE generation time series is hourly; the data are aggregated to the regions that were used in Balmorel.
2.3. Storage and Planned Maintenance Optimisation
When simulating the DA market, it is important to capture that some of the decisions that market participants take into account future market price expectations, rather than just planning for the next 24 h. The planned maintenance and use of storage are part of these long-term decisions. In this paper, these two decisions are obtained by performing a full year dispatch optimisation. Planned maintenance and storage content at the beginning of each season are saved and forced in the DA optimisation. Planned maintenance is also used in the stochastic outage simulation in order to calculate the available capacity for production that can suffer an unexpected outage.
The formulation is similar to the one shown in
Section 2.1, with a few exceptions. In this optimisation, the time steps considered correspond to one year. All of the equations can be found in [
27]. In this paper, only some equations are shown.
2.3.1. Available Units
The number of available units available for generation (
) is constrained by the total number of units (installed fuel capacity of a unit type (
) divided by the size of each unit type (
)), and the amount of units on planned maintenance (
). The number of units on planned maintenance influence the availability factor of the units when simulating the DA market.
The maximum number of units on maintenance is limited by the total installed number of units:
2.3.2. Yearly Maintenance Requirement
The minimum maintenance time of each technology (
) needs to be respected during the year:
2.3.3. Uninterrupted Maintenance
Units starting up maintenance (
) must be on maintenance during the minimum maintenance time without interruption, i.e., the maintenance must take place in consecutive seasons:
2.3.4. Logical Conditions
The number of units on maintenance depends on the units starting or stopping maintenance (
):
In order to reflect the discrete nature of the generation units that are part of the energy system, the following variables are restricted to be positive integer variables
. However, this constraint is relaxed due to the computational complexity in the optimisation, as mentioned in
Section 3.2.
2.4. Stochastic Outage Simulations
Unexpected operational problems can lead to making units being unavailable until the problem is fixed, which can influence market prices. Hence, it is relevant to capture these occurrences. Using, as input parameters, the size of a single unit, the total capacity of a unit type in each area, the planned maintenance (if previously calculated), and the probability of an unexpected outage, for each time step and unit in the system, Monte carlo simulations are performed in order to simulate these outages. The outcome from these simulations is then fed to the DA optimisation, and the relevant variables fixed. This approach is applied to all units except the VRE ones, since their availability is part of the time series used. The formulation can be found in Equations (A85) and (A86) of [
27].
2.5. Sensitivity Cases: Unit Commitment Modelling Approaches
In order to analyse the importance of the UC modelling approach when modelling the DA market, three different sensitivity cases of UC modelling approaches are studied in the DA optimisations: (1) adding UC constraints with integer commitment variables (UC-MIP), (2) adding UC constraints with relaxed commitment variables (UC-RMIP), and (3) not adding constraints nor corresponding commitment variables (NO-UC).
4. Case Study: The North Sea Offshore Grid
The study case used in this paper corresponds to the offshore grid scenario presented in [
30], developed as part of the project North Sea Offshore Network—Denmark. The scenario focuses on the following countries: Germany, Great Britain, Norway, Denmark, Belgium, and Netherlands. The sectors included are the electricicity and district heating sectors. The study case shows, towards 2050, a high share of VRE, transmission interconnection, and partial electrification of the district heating sector in the countries in focus. The capacity development (
Figure 2) was highly influenced by the assumptions on increasing CO
2 EU ETS price: 6.06, 76.70, and 130.38 €
2012/ton in 2020, 2030, and 2050, respectively. More details about the scenario can be read in [
30,
31,
32].
5. Results and Discussion
First,
Section 5.1 focuses on key results that were obtained from the storage and planned maintenance optimisations.
Section 5.2 presents the results from the Day-Ahead optimisations, focusing on the influence of VRE penetration and the UC modelling approach.
Section 5.3 discusses the limitations of the study. Costs and prices are in €
2012, which is the base year used for economic data in the model.
5.1. Storage and Planned Maintenance Optimisation
5.1.1. Planned Maintenance
Figure 3 shows the share of installed capacity under planned maintenance of district heating units burning waste in Denmark. Units burning waste tend to show high capacity factors and, hence, the scheduling of their maintenance is of relevance. The results show that most of the planned maintenance takes place during summer, which is when the district heat demand is lowest. For CHP units, by 2020, most of the maintenance takes place in July (89%), and towards 2050, a larger share of the maintenance takes place in earlier months. The fact that, in 2050, maintenance in May is 34% of the total could be linked to solar PV generation, since, in Denmark, the production of this technology is the highest in this month, favoring the use of P2H and, hence, leading to less need for CHP units to be operative. For district heating boilers, no significant difference towards 2050 is observed.
5.1.2. Planned Storage Use
The aggregated planned energy content along the year of hydro reservoirs with seasonal inflow, one of the types of storage considered in the model, is shown in
Figure 4 for Norway. The purpose of this figure is to analyse the influence of VRE penetration towards 2050 on the use of this type storage during the year. The minimum value of each profile has been subtracted. The results show that the reservoirs are mainly filled during the summer and discharged during winter. The maximum energy content is higher in 2020 than in 2030 and 2050. This is a result of storing less energy in the reservoir during the year, which is linked to using hydro energy for balancing VRE. Furthermore, the evolution of the content in 2020 is smoother than in 2030 and 2050, which is influenced by the volatility and seasonality of VRE generation. These results strengthen the importance of performing full year optimisations towards 2050.
5.2. Day-Ahead Optimisation
5.2.1. Annual Production
Figure 5 depicts the aggregated generation of electricity and heat per year, scenario, and technology in the countries in focus for different UC approaches. The penetration of VRE in the electricity sector towards 2050 is remarkable, at the expense of decreasing the use of thermal technologies. The results show that the share of CO
2 free generation increases from 64% in 2020 to 91%, which is linked to the assumed VRE penetration. On the heating side, the generation of P2H units increases towards 2050 at the expense of thermal units. Introducing UC constraints slightly increases the aggregated production of thermal power units and reduces VRE generation.
The average capacity factor of thermal power units for electricity with/without heat generation is shown in
Figure 6 for the UC-MIP approach. The difference with NO-UC and UC-RMIP is negligible. The electricity capacity factor is calculated with rated electricity generation capacity, whereas the heat one uses the rated heat generation capacity. The results show that, towards 2050, the average electricity capacity factor decreases for CHP back pressure units, CHP extraction units, and electricity-only units, especially for the last two types. The heat capacity factor also tends to decrease. These results suggest that the massive penetration of VRE might challenge the profitability of thermal units towards 2050.
5.2.2. System Costs
Table 2 shows the disaggregated operational costs development in the countries in focus per UC approach. The total operational costs increase in 2030 with respect to 2020, and then decrease in 2050 when compared to 2030. This development is linked to VRE penetration and CO
2 tax assumptions. By 2030, there is still considerable fossil generation, leading to high CO
2 tax costs. By 2050, even though the CO
2 tax is higher than in 2030, there is much less fossil generation, which, together with further VRE penetration, leads to considerably less variable costs. Using UC-RMIP leads to much closer results to UC-MIP than using NO-UC, although the difference decreases towards 2050, again due to less fossil generation. Not including UC constraints, i.e., using NO-UC, underestimates both variable and CO
2 costs, since it overestimates the flexibility of the units when ignoring relevant costs, such as start-up.
5.2.3. Hourly Electricity Balance
Figure 7 depicts the hourly electricity balance for four representative days for the years 2020, 2030, and 2050, for Great Britain and with the UC-MIP approach. The graph includes aggregated generation and demand per type, as well as electricity prices. The prices are derived from the dual variable of the electricity balance equation (Equation (
2)). The penetration of VRE replaces most thermal generation towards 2050. Such a large penetration of VRE energy highlights the need for proper planning of balancing resources towards 2050, since forecast errors could challenge the correct operation of the system.
5.2.4. Electricity Prices
Figure 8 shows the influence of the UC approach in the cumulative probability curves for the electricity prices in each year, for one of the modelled regions of Denmark, i.e. DK1. The influence of the optimisation approach decreases towards 2050, which is explained with the decrease of thermal power capacity and use towards 2050, since they are the ones that are affected by the different UC approaches. UC-MIP leads to overall higher prices in all price-range due to forcing discrete block sizes to be on/off for thermal units. The number of hours with very low prices (where VRE curtailment sets the price) are higher with UC-RMIP, and especially with UC-MIP. These low prices generally correspond to those hours where it is cheaper (or the only feasible way) in order to increase the use of more expensive generation units, rather than starting/shutting them. In the mid-range prices, the prices for UC-RMIP tend to be the lowest, which can be explained in a similar way to VRE curtailment, but, instead, what it is being “curtailed” is the next available cheaper generator. On the high-range prices, NO-UC underestimates high prices, which can be explained with the non-consideration of restrictive constraints, like minimum-on/off time, minimum production, and ramping. The order of magnitude of the prices is highly influenced by the CO
2 tax assumption development (
Section 4).
5.2.5. Curtailment
The influence of the UC approach on curtailment for different technology types in the countries in focus per year are shown in
Table 3. Not considering UC costs leads to less curtailment. Wind offshore is curtailed more often than onshore due to operation costs assumptions, i.e., variable costs for offshore are more expensive than for onshore. The impact of not considering UC costs on curtailment increases towards 2050, when there is higher VRE penetration.
5.2.6. Average Revenue of Wind and Solar Pv Units
Figure 9 shows the influence of the UC approach on the variability of the average revenue per energy unit sold in each region and year from the operation in the DA market for wind and solar PV units. The results show a decrease in the variability of the average revenue across countries towards 2050, mainly due to grid expansion. This highlights the importance of large-scale energy system analysis. Solar PV’s average revenue is higher in 2020 and 2030 than wind unit’s, but it is slightly smaller in 2050. With a UC-MIP approach, the average revenues are slightly higher for both technologies. The yearly levels of average revenue are directly linked to the DA price development.
5.2.7. Electricity-Only Thermal Plant Operation
Table 4 shows the influence of the UC approach in the utilization factor of electricity-only thermal generation units using natural gas or nuclear fuels. The installed capacity of these units is also shown. The results show a decrease in utilization for all of the considered units towards 2050. Units burning natural gas half their capacity factor with respect to 2020 in 2030 and stay almost constant by 2050. Nuclear power capacity factor also decreases considerably towards 2050. The UC approach impacts the utilization of nuclear power by 2050, overestimating its flexibility when using NO-UC. These results are influenced by the decrease of nuclear power in the system towards 2050, and the increasing penetration of VRE. This result challenges the profitability of these thermal units towards 2050.
The impact of the UC modelling approach on hourly nuclear operation, which is highly affected by UC constraints, is shown in
Figure 10, which shows the hourly operation of nuclear power plants for four consecutive days in Great Britain. The figure depicts that, towards 2050, with higher VRE penetration, unless the UC costs and constraints are considered, nuclear units start up and shut down with high frequency. This operation of nuclear plants might be extremely challenging, and perhaps unrealistic. These results strengthen the importance of multiple scenario year analysis as well as the UC modelling approach used.
5.2.8. Computational Time
Table 5 shows the influence of the UC modelling approach on the computational time of the DA optimisation of each full year. The computational time that is required to solve the UC-MIP case is much higher than the others. The computational time decreases significantly towards 2050, since the number of thermal power plants is considerably reduced in this scenario. Using UC-RMIP leads to closer computational times to NO-UC than to UC-MIP.
5.3. Limitations of the Study
The simplifications undertaken to reduce the complexity of the problem limit the findings of this study.
The flexibility of technologies for which UC constraints were not applied could have been overestimated, especially for hydro power units.
Further work should include adequacy analysis and/or ancillary services requirements in the simulations. Both of these aspects can be highly relevant for the correct operation of the system, especially towards 2050, with more VRE penetration. Furthermore, future research should also include stronger sector coupling, since it can considerably influence the generation of VRE technologies and the need for flexibility ([
23,
26,
33]).
The full-year foresight assumed for the planned maintenance and storage optimisation can be unrealistic, due to the high uncertainty on, e.g., weather. Performing the analysis with several weather years and/or performing stochastic optimisation would help to understand the role of uncertainty in the results. In this paper, for simplification, a unique weather year was used (2012), and stochastic features are mainly modelled through unplanned outages.
6. Conclusions
This paper proposes a mathematical model to simulate Day-ahead markets of large-scale multi-energy systems with a high penetration of renewable energy towards 2050. Furthermore, it analyses the influence of UC modelling on the results. The results highlight the importance of analysing multiple scenario years with long time series, including several sectors, as well as the value of not restricting the analysis to the small scale.
The results for the studied case of the North Sea region show how the penetration of VRE towards 2050 challenges thermal units’ traditional operation in the electricity and district heating sectors towards 2050. Furthermore, the high penetration of wind and solar is likely to challenge the need for balancing in the system and, hence, flexibility will be very important towards 2050.
The influence of the UC approach is found to be dependent on the scenario year. Generally, including UC constraints with integer variables leads to more realistic behaviour of the units, at the cost of considerably increasing the computational time. Relaxing integer variables significantly reduces the computational time, but medium-level prices are underestimated. Not including UC constraints leads to an underestimation of costs, VRE curtailment, VRE’s average revenue per energy unit sold, as well as price volatility. It also overestimates the flexibility of the thermal units. Hence, depending on the purpose of the analysis, it is recommended to think carefully on which UC modelling approach to use and acknowledge the limitations. When the focus is on prices and revenues, using UC constraints with integer variables is preferable; otherwise, relaxing the integer variables is encouraged.
Even though the study case is performed on the North Sea region, the findings of this paper are valid to other regions of the world, where high VRE penetration is expected.
The proposed model, together with the insights that were obtained from the study case, can be specially useful for system operators, who can use this model to perform operational planning studies towards 2050.


