Abstract
This research reviews the impact on emissions from the engine fueled with the fuel containing a large share of bio-components, in particular with 30% n-Butanol. The research was carried out using a diesel engine. It has been shown that it is possible to achieve a double positive ecological effect concerning CO2 emissions. There was a decrease in CO2 emission from the engine with the fuel contained a significant share of bio-carbon. At the same time, NOx and Filter Smoke Number (FSN) emissions have been reduced together (FSN in large percentage). Usually, if NOx emissions are reduced, FSN increases, and vice versa. The paper shows also that the use of n-Butanol (bio, but nonfood) in the future is more effective than larger amounts of higher fatty acids methyl esters, although the full withdrawal of these esters seems unjustified.
1. Introduction
The main need now is to reduce emissions, most particularly from transport, which is one of the main sectors of the economy.
A reduction in transport emissions can be achieved generally either through the redesign of internal combustion engines or a change of fuel type. Redesigning the engines need at least a dozen years of intensive research. The results of this work cannot be implemented retrospectively, which means that, for the several decades needed to achieve progress, emissions from engines of existing vehicles will remain at the same level. Therefore, to reduce emissions, it will be necessary to first change the fuel.
In addition, all available forecasts indicate that vehicles with IC engines will be used until at least 2050.
Currently, the main global emissions problem is CO2 emissions [1]. The main need now is to reduce emissions, most particularly from transport, which is one of the main sectors of the economy. The main transport emissions come from fuel combustion in engines, and all available forecasts indicate, that vehicles with internal combustion engines will be used until at least 2050.
A reduction in transport emissions can be achieved generally either through the redesign of internal combustion engines [2] or a change of fuel type [3]. Redesigning the engines need at least a dozen years of intensive research. The results of this redesign cannot be implemented retrospectively, which means that for the decades to progress, emissions from the engines of existing vehicles will remain at the same level. Therefore, in order to reduce emissions, it will be first necessary to change the energy sources for operating vehicles. Therefore, changing energy sources, by definition, cannot lead to an increase in emissions, especially CO2.
The basis for reducing CO2 emissions from transport is the acquisition of energy for the operation of vehicles from renewable sources. Using such sources for fuels achieving means that the problem of emissions (especially CO2) can be solved immediately. But this view is not common. The opinions [4] that advanced biofuels will not make a sizeable contribution to the energy balance in the near future are not isolated. Such opinions probably result from the belief that progress in transport is possible only with the redesign of engines and the further use of today’s fuels, i.e.,
- the use of alcohols (first of all ethanol) and their mixtures with petrol (up to 10% v/v),
- the use of fatty acids alcohol esters and their mixtures with diesel fuel (up to 10% v/v),
- the use of synthetic hydrocarbons produced from synthesis gas coming from biomass (there are no reports of such a solution being used anywhere on an industrial scale).
However, work on the implementation of new sources of fuel acquisition was not abandoned. Recently (for over 10 years) publications on the use of heavy alcohol, in particular butanol as an additive to fuels, have been published. In the meantime, a lot of work on this topic has been created
In the above-mentioned period, over 110 publications on this subject were published. In this study, 22 of them (mainly items from 2018–2020) are mentioned as those that may be directly related to the discussed topic.
The interest in butanol results not only from its properties [5,6] as a fuel component but also from its sources of origin [7,8,9,10].
The heavy alcohol compositions have of course some properties deviating from the relevant standards [11,12], but it is possible to deal with these problems
The main issues arising from attempts to use, for example, butanol as an additive to a new fuel, are engine efficiency and emissions.
In [13] are tested one cylinder diesel engine to study on the combustion process of diesel (B00). For comparison diesel was mixed with n-butanol (B20) and also diesel with n-butanol and 2-ethylhexyl nitrate (B20+EHN). The main parameter of interesting was the soot emission. Authors conclude that the important factors are period of ignition delay (ID), and combustion temperature in the cylinder. Research on the difference in emissions showed, that ID plays a decisive role, first on all, in the reduction of CO and HC emissions. The authors of [14] conclude, that among the blends with alcohol component, revealed shorter ignition delay (by B20 and BU20 blends was slightly faster burning initiation than by B00). Another conclusion was that, the butanol and ethanol blends can be used without any modifications in the engine.
There are also relatively many publications on the emissions of an engine powered by fuel mixtures with butanol. In [15] are reported a investigation with 10% (B10), 15% (B15) and 20% (B20) blends of n-Butanol. The investigation are carry out at different speeds loads of engine. The results show that the BSFC (Brake Specific Fuel Consumption) for fuel blends is closer to this with neat diesel fuel, (at higher engine speeds and mixtures with corrected cetane number). The exhaust smoke for blends is lower than for the neat diesel fuel and blends without cetane number improver.
The main objective of the paper [16] is to investigate the possibility to use of algae oil and butanol as alternate for fuels IC engines. The torque power, brake specific energy consumption, CO, NO and HC emissions gets improved with butanol addition. CO2 and NOx emissions are higher than by diesel fueling. The combustion, emissions and engine performance by four mixtures of diesel-biodiesel-butanol have been investigated. The results are presented in [17]. Emissions for blends are reduced (CO by 55.55% to 70.37%; smoke by 37.69% to 50.77%; and NOx by 3.37% to 8.55%) compared to diesel. In authors opinion addition of butanol can be influenced of reduction in NOx emission.
Similar, in the [18] deals with the effects made by using various n-butanol-diesel blends on the combustion, diesel engine emissions and performance. The results are achieved only at 1800 rpm and 2500 rpm of engine. Similar to [16] four a diesel and n-Butanol fuel blends are prepared. The mixtures preparing that is by pouring—in weight—4.65% (BD1), 9.30% (BD2), 13.95% (BD3), and 18.65% (BD4) n-Butanol to diesel fuel. At the same speeds load characteristics of engine were taken. The changes in combustion, emissions of NOx, CO, THC, smoke and engine efficiency was analyzed on comparative bases with diesel fuel.
In [19] are presented the investigation with iso-butanol and n-butanol as butanol-acetone (BA) components mixture for diesel blend.
Investigated was fuel spray, combustion, performance and engine emissions. It was concluded that iso-BA-diesel blends leaded slight improvement in power and higher burning pressure. n-BA blends resulted in lower UHC and NOx emission. Therefore, using iso-BA and n-BA together, could be a suitable diesel blend to obtain of optimum in engine performance.
Interesting experimentation are presented in [20]. On PCCI (premixed charged compression/ignition combustion) engine mode were tested a diesel n-Butanol (B10, B20, B30 and B40) blends. By high load operation, B40 provided 6.9%, 8.1%, 12.9% and 13.7% higher brake thermal efficiency over B30, B20, B10 and diesel respectively but with small increment in BSFC. Observed were CO and smoke emissions reduction. However, for higher performance for lowering of HC and NO emissions, B40 seems better.
Based on tests under NEDC conditions (which was the norm until 2018), it was found [21] that, alcohols produced from lignocellulosic or waste materials, as diesel fuel component constitute a sustainable alternative for fossils ones. In general, including n-Butanol as a blend component is beneficial for particulate emissions and engine performance, but the blending is limited by start ability problems at very low ambient temperature.
From analyze of all above publications to notice is lack of implementation of any investigated mixtures as fuels in vehicles operation and such investigations art and results cannot lead to them. Of course, every novelty (even if it is the simplest) comes into use quite slowly and reluctantly. However, must be there the other factors that are not often taken into account for achieve such implementations aims.
The conclusions that follow from these publications analyses are not clear. On the one hand, the use of butanol as a fuel component is attractive (because it may come from biomass waste, but not from consumption one), on the other hand, it is not known whether the intended progress will actually be achieved. In particular, it is not known whether emission reductions (especially CO2) can be achieved and whether any differences in emissions are significant. There is also no clear answer to the basic question of how fuel consumption will develop, and this is a decisive factor when implementing new solutions. These issues are extremely important taking into account that to achieve real progress (in reducing emissions, especially CO2), it is necessary to achieve the bio-component content in the fuel in amounts of several dozen percent. But how much bio-component (and what) should be used to achieve, for example, several dozen percent reduction of CO2 is not known. The research method is not clear from the publications.
One of the reasons also for heavy alcohols not being implemented as fuel components are there probably very different opinions regarding this solution. These diverse opinions come from the lack of agreed research procedures. Used test procedures are very different, In the cited literature it can be noted the testing by the max load (by changing the engine revolutions) or by constant revolutions (and different loads), up to an incomplete European Stationary Cycle (ESC) test.
It therefore makes sense to first standardize the research procedure.
The aim of this paper is to show the minimum procedural steps to complete the assessment of the implementation of proposed solutions that involve new mixture as fuels with a high heavy alcohol content.
It was, therefore, necessary to use the test procedure including engine tests on a test bench (here ESC test [22]), recalculations of the measurement data, statistical analysis of the obtained data, and determination of the significance of achieved differences before and after the changes (different fuel mixtures in this case) were introduced.
In order to try to answer the question of what bio component should be used in the future, tests were carried out using standard diesel fuel (which contains 7% rapeseed oil methyl ester). This fuel was mixed with more of this ester and, for comparison, the standard fuel was mixed with a greater amount of butanol. Calculations and statistical analysis, it is possible to clearly indicate which type of blending may be meaningful. By the way in this work, the attention is also drawn to the fact that completely opposing conclusions can be derived from the same measurement data, which may be one of the reasons for the very diverse views as to the predicted effects of introducing this type of new “fuels”.
2. Experiment and Results
Materials: This paper presented the use of heavy alcohol (n-Butanol) as solvent of standard diesel fuel. The standard diesel fuel in Europe contains nowadays 93% v/v of hydrocarbons and 7% v/v of Fatty Acid Methyl Ester (FAME). This standard diesel fuel is called here as “D”.
As the first fuel mixture for investigation used a D mixed with n-Butanol (D 70% v/v, n-Butanol 30% v/v). This mixture is called here DB.
For comparison, another mixture was prepared. This mixture contains 70% v/v of D and 30% of FAME. This mixture is called DF.
Because the D contains 7% v/v of FAME, DB contains (volumetric) 65.1% hydrocarbons, 4.9% FAME, and 30% n-Butanol.
For the same reason, DF contains 65.10% v/v of the hydrocarbons and 34.9% v/v of FAME.
Volumetric compositions of achieved mixtures are presented in Figure 1.
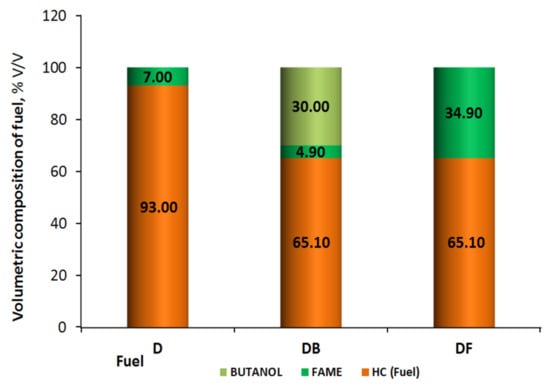
Figure 1.
Volumetric composition of fuel for experiments.
D, n-Butanol. and FAME, used in this study, were obtained commercially. The properties of each component are available on the internet. At the stage of research presented in this work, no accurate determination of the properties of composed mixtures was performed. It is of course possible (see examples in References [5]), but the purpose of this work was to develop a complex of test methods and not to show the properties of a specific fuel ready for putting into service for engines.
Prepared, under laboratory conditions, mixtures were supplied as fuel to the engine, and the engine was investigated, under conditions of ESC test [22], on the dynamometer test bank.
The ESC (European Stationary Cycle) test was introduced—Directive 1999/96/EC.
The ESC is a 13-mode, steady-state procedure [22].
The engine is tested on an engine dynamometer over modes as in Figure 2.
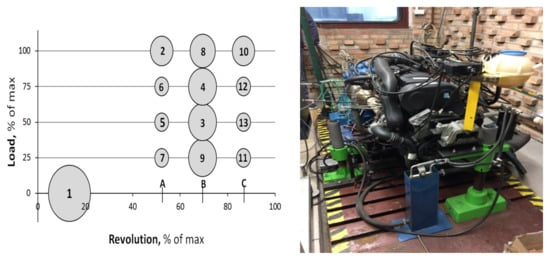
Figure 2.
European Stationary Cycle (ESC), 13 modes test, and research position.
The engine must be run for 2 min in each mode (except 1-st mode “Low idle” duration 4 min).
The required engine load and speed must be achieved within the first 20 s of each mode duration.
The required speed, in each mode, shall be kept to ±50 rpm, and the specified torque to ±2% of the maximum torque, at that mode speed.
The emissions are measured in each mode and then using a set of modes weighting factors, calculated over the test for achieve one value. This value is charcteristic and represent for all test modes together and it is reported as the sum of test (ST). Particulate emissions are sampled on a single filter in 13 modes (throughout the test).
Emission results must be expressed in g/kWh [22]
The engine speeds are defined as follows:
- High speed (in the test) is defined as speed which occurs at 70% of the declared maximum net power and is defined as “C” and nhi.
- The free speed nlo shall be determined at 50% of the declared maximum net power. It is referred to as “A” nlo. “B” is an intermediate value between A and C.
- The engine speeds A, B, and C used during the test [22] are calculated from the formulas:
A = nlo + 0.25(nhi − nlo)
B = nlo + 0.50(nhi − nlo)
C = nlo + 0.75(nhi − nlo)
The ESC test is characterized by very high exhaust gas temperature values, resulting from high average engine load.
In Table 1, the engine parameters in its operation in the ESC test are given.

Table 1.
Parameters of the investigated engine.
The test bench was equipped with suitable measurement devices, i.e., electronically controlled electro-wire dynamometer (AVL), equipment for dynamic measurements of fuel consumption meter (AVL), emissions meters (HORIBA), and others.
Every test for each fuel and mixtures (D, DB, and DF) was repeated 6 times.
During the test, the following were measured:
- FC fuel consumption,
- NOx emissions,
- CO emissions,
- Smoke emissions as FSN (Filter Smoke Number),
- CO2 emissions.
For technical reasons (unfortunately), no hydrocarbon (HC) emissions in engine exhaust were measured.
The fuel consumption (FC), after the test measurement, was converted to the brake-specific fuel consumption (BSFC) expressed in [g/kWh]. Emissions of CO2, CO, and NOx are expressed in [g/kWh].
Fuel consumption (or emissions) is in the test procedure in each of the separate test modes measured, but for total test result evaluation the result for all test modes together is important. Such value is a ST (Sum of Test), which is given as:
where;
—Sum of Test for n-th parameter [g/kWh],
i—i-th test mode,
—Emission of n-th component in i-th test mode [g/kWh],
—Weight in i-th test mode [%].
Next, because each test was repeated 6 times, a simple statistical analysis (the six values can be statistically treated as a sample from the general population) carry out was possible. As a result of this statistical analysis, designated, among others:
- average,
- standard deviation,
- variance,
- and other statistical parameters.
The data for the comparison of engine parameters fed with prepared fuels are shown in the next figures.
In Figure 3, a comparison of brake specific fuel consumption (BSFC) is shown. In these drawings, BSFCav means the average value of brake specific fuel consumption, BSFCav + SD is the average value plus standard deviation, and BSFCav-SD is the average value minus standard deviation value.
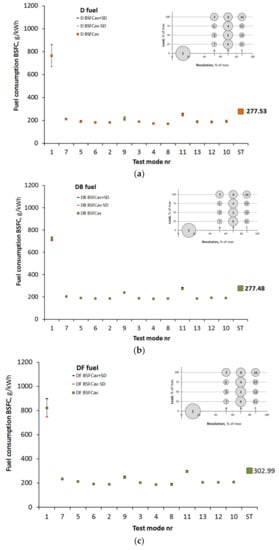
Figure 3.
Fuel consumption (brake-specific fuel consumption (BSFC)) of the engine in ESC 13 mode test fed with Diesel fuel (a), with DB fuel (b), and with DF fuel (c).
Figure 3 shows the BSFC in each test mode and as ST. It can be seen that the differences, when the engine is powered by each particular mixture, are small. The engine efficiency is proportional to the BSFC. From Figure 3, it is, therefore, concluded that the efficiency by feeding the engine with DB is a little bit higher than by feeding with D and, in opposition, by feeding with DF, efficiency is a little bit smaller than by feeding with D. Whether these differences are significant can be inferred after the next stage of statistical analysis.
Points on the graphs are arranged characteristically, encountered with the research of engines. BSFC is the largest at low engine loads (here, mods 7, 9, 11). As the load increases, the BSFC decreases (if RPM is constant).
Figure 3 shows the average values and the respective standard deviations. It can be seen that the standard deviations are relatively narrow. The exception occurs only for test mode 1 (the idling of the engine). It is noteworthy that by fueling with DB, the bigger standard deviation for idle is not registered (unexpected).
The values determined (respectively) for the entire test were given as ST (Sum of Test) and are marked with the largest squares in the diagrams. Comparison of these values leads to the conclusion that the differences are probably not important (more information about the testing method of the significance of differences is given later in this work).
The differences at individual modes of the test are not more than 12% (when the engine is powered by BD) and not more than 17% (by DF). In a total of the test (ST), the BSFC at the BD engine supply decreases by 0.02% and at the DF engine supply increases by 9.17%. It is interesting that during idle, it is better to power the engine by BD.
It can be seen that the BSFC by DB feed is lower than by feeding with DF or with D fuel. This is mainly due to the lower BSFC during the idle. In the test, the share of idle time is 15%, which is relatively long. In some publications it has been noted that idling is not included for consideration. As can be seen, this may lead to an erroneous evaluation of the results.
In many publications also, it can be seen that the tests of engines are carried out only at maximum loads. Such conditions occur here in test modes 2, 8, and 10.
It is clear here that at max load conditions, the lowest BSFC is by feeding with D fuel. By feeding with DB, fuel consumption increased 0.45% to 8.50% (ST decreases about 0.02%). By fueling with DF, average BSFC increases 4.75% to 10.05%, but by ST to 9.17%. On the margin, it can be asked how often the engine works in a wide range of rotational speeds at maximum load?
A similar erroneous evaluation can be seen when analyzing the BSFC by the constant RPM (A, B, or C) and growing loads. The differences in BSFC in such conditions by comparison to ST are clear. However, such conditions can be registered in reality by exploiting the engine, for example, in power plant. In this case, the errors do not occur.
Similar to the earlier BSFC comparison, emissions of nitrogen oxides (NOx) were compared (Figure 4).
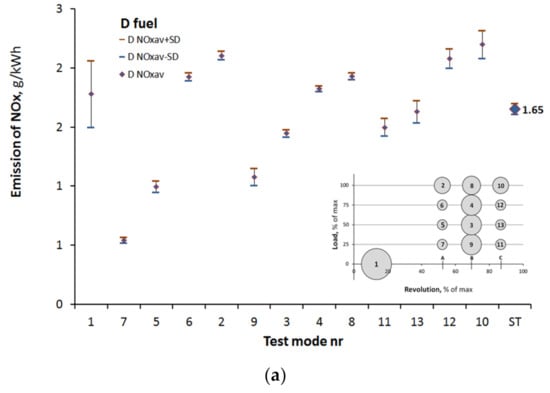
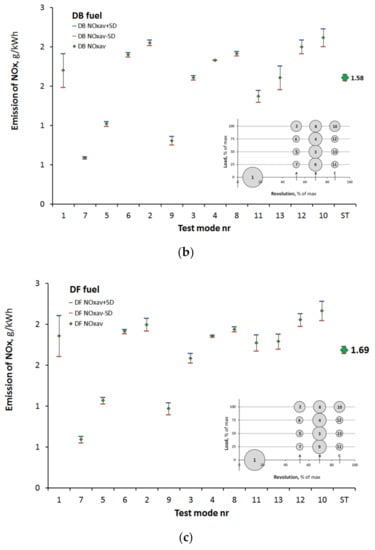
Figure 4.
Emissions of NOx of engine in ESC 13 mode test fed with D (a), with DB fuel (b), and with DF fuel (c).
The average emissions in each mode are arranged in a distinctive pattern. There are not many test differences between the NOx emissions of the engine powered by the used fuels. Especially, test results (as ST) differ around 2.5% (but in plus and minus), so they do not differ much.
Other results are noticeable in each test mode. The differences occur −25% in test mode 9 by feeding with DB and +18.5% by feeding with DF in 11 test mode. Such differences can be as bigger as expected.
At low loads, if the fuel contains more bio-component, there is a noticeable increase in NOx emissions. However, the data show that at a constant speed, along with the increase in load, there is a reduction in NOx emissions if the engine is fed with fuels with a higher content of bio-component.
Analysis of differences by a max load of the engine in all tests produces an interesting result. By feeding with DF, on basis of values by the max load can be rather supposed that NOx emission decrease, but in the sum of test can be registered increasing.
Data regarding carbon monoxide (CO) emissions are shown here in Figure 5.
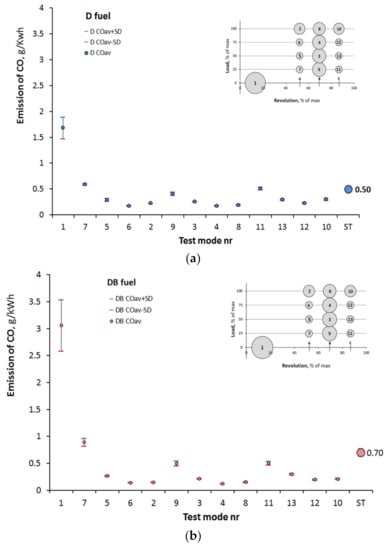
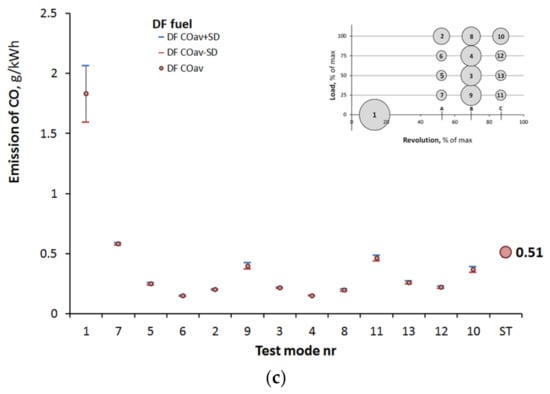
Figure 5.
Emissions of CO of engine in ESC 13 mode test fed with D (a), with DB fuel (b), and with DF fuel (c).
CO emissions in the entire test (ST) are clearly higher when the engine is fed with DB, because of an increase of more than 40%.
When fed with DF, CO emissions growth was not so much (ca 2.5%). The remarks about the CO emissions data comparison are especially interesting in the case of the engine fed with DB (n-Butanol content fuel.
Except the modes 1, 7, 9, and 13, a decrease in CO emissions in all other 9-th modes is registered. The reductions are not so small, therefore, a total reduction of emissions in the test could be expected. However, this does not happen. The reason lies in the fact that it is necessary not only to take into account emissions but also the shares of individual modes in the test.
Unfortunately, these research requirements are often not taken into account which, as can be seen, can lead to misunderstandings in the interpretation of measurement results.
Figure 6 contains the results of appropriately developed smoke measurements.
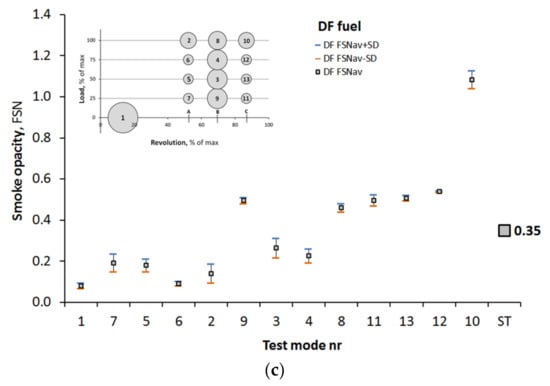
Figure 6.
Emissions of smoke FSN of engine in ESC 13 mode test fed with D (a), DB fuel (b), and DF fuel (c).
Even without further analysis, it can be seen that the engine fed with both new fuels has a positive effect here. The smoke pollution, in this case, is clearly lower.
By feeding the engine with DB, a reduction in FSN differ in test modes up about 56% (test mode 1) to over 76% (test mode 7). By feeding the engine with DF fuel, results are also good, but not as good as with DB.
Interestingly, the decrease in smoke opacity is recorded when the engine is idling and at low loads.
If these results were confirmed in wider studies, an improvement in emissions would be obtained, which is difficult to obtain in another way.
As it can be seen, when the engine is fed with fuel of higher bio-components content, the reduction of smoke opacity is so great at each test mode that the analysis only at selected of those does not lead to fundamental mistakes.
However, on the margin analyzing how the measurement results are arranged on graph 9, it can be concluded that there is some similarity regardless of what fuel the engine is powered with. However, this similarity is not as clear as for other parameters. Therefore, it seems that further measurements of particle emissions should be carried out using more adequate tools.
The correctness of CO2 emission measurements is visible in Figure 7.
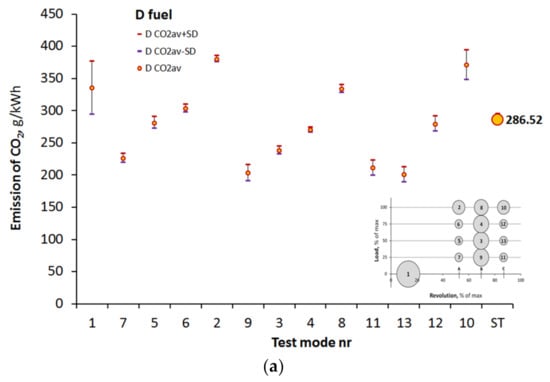
Figure 7.
Emissions of CO2 of engine in ESC 13 mode test fed with D (a), with DB fuel (b), and with DF fuel (c).
These emissions were determined in direct engine measurements on the test bench. They are not suitable for the overall assessment of CO2 emissions. This analysis should be done using LCA (Life Cycle Assessment). The engine emission results are only (but very important) part of data for such LCA analysis.
It is interesting, however, that there is a relatively large dispersion of standard deviation values (Figure 8).
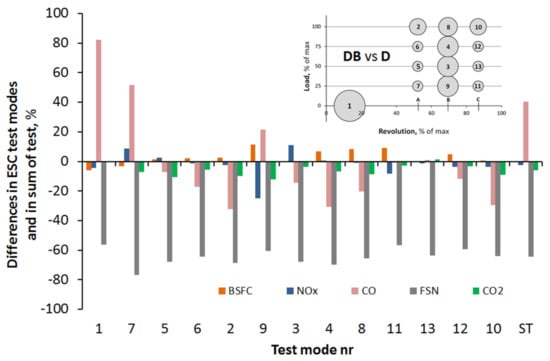
Figure 8.
Differences in averages by feeding the engine with DB vs. feeding with D fuel (in percent).
CO2 emissions in the ST are lower when the engine is feed with DB fuel. This can be explained by the fact that both higher fatty acids and alcohols have a structure in which for each carbon atom there are more hydrogen atoms. In terms of reducing CO2 emissions, the DB engine also has a direct positive effect.
The differences may not be seen as particularly large (up to above 12%), however, it is positive that when the engine is fed with new mixtures, the differences can be registered and they are positive (CO2 emissions are reduced). When the engine is supplied with fuel containing n-Butanol, the difference appears to be more significant than with fuel containing FAME as a bio-component.
From analysis by max engine load, the results in these conditions are better as achieved in some of the tests.
The achieved data are illustrated in Figure 8 and Figure 9. The differences in the individual test modes and in the whole test (at ST) are clearly visible.
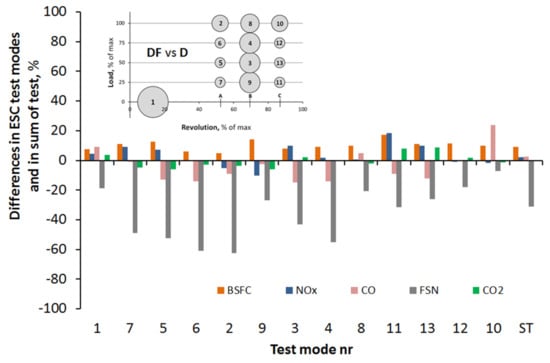
Figure 9.
Differences in averages by feeding the engine with DF vs. feeding with D fuel (in percent).
Clear differences, i.e., those that exceed 20%, are visible in relation to emissions of CO and FSN when engine fed DB or only in relation to FSN when the engine fed DF.
At this workplace, the question arises whether the differences actually recorded are large or small and whether they are significant.
Such questions can be answered after statistical processing of measurement results. The use of simple statistical methods for this purpose is shown below.
3. Statistical Verification
From the statistical point of view, the repeat of measurements 6 times did not give a big sample number. It will be much better to have, for example, a thirty-element set. However, with so small sets (as here), only a very simple analysis is possible.
Earlier, in Figure 3, Figure 4, Figure 5, Figure 6 and Figure 7, averages of fuel consumption and emissions are given. Together with these data, the deviation from the average, as a standard deviation, is shown. Both values can be used to create the coefficient of deviation, that is the proportion of the standard deviation to the average value. Such a coefficient is treated as a good tool for assessing data dispersion. The corresponding calculations were, therefore, carried out. The graphical presentation of the results of those calculations is presented in Figure 10.
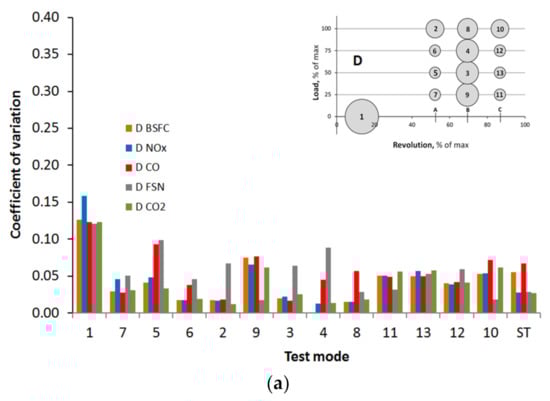
Figure 10.
Values of the coefficient of variation in each test mode and in the sum of the ESC test (ST) of engine fed with D fuel (a), with DB (b), and with DF (c).
It is noticed that a relatively small dispersion of the data occurs if the engine is fed with standard diesel fuel. By feeding with DB, dispersion of data of CO emissions and also by FSN are larger. By feeding the engine with DF, the dispersion is unexpectedly bigger for FSN.
The reasons for this can be found in fuel mixtures homogeneity. It seems that the investigated mixtures are generally homogeneous. This does not mean, however, that there can be no deviation from this homogeneity in individual volumes of fuel. If the fuel is ternary like DB, this may be likely. This issue requires further research (which will undoubtedly be conducted). Importantly, however, there is a math tool that can be used for assessing of dispersion of engine burning process results.
With existing data scattering, which can be relatively large compared to the average, the question is whether the recorded differences between the mean values are significant, especially if these differences are not large. This topic in comparative studies (like here) is particularly important.
To clarify this issue, a simple statistical method was used.
Only representative values analyzed for the entire test were (the sum of the test-ST) referred here.
Every pair of ST is compared (engine is fed with D and ST if with DB in Tests no 1, 2, 3 etc. The same comparison was done for D and DF.
Thus, for each parameter (BSFC, NOx, etc.) and each fuels pair, a six-element set is created.
This sets can be analyzed by using the statistical Student’s t-test.
The results of statistical calculations for comparison of the engine fed with D and DB are presented in Table 2 as “Statistics”. Table 3 contains the data for comparison if the engine fed D and DF.
Table 2.
Statistical evaluation of achieved results by feeding the engine with DB fuel vs. feeding with conventional diesel.
Table 3.
Statistical evaluation of achieved results by feeding the engine with DF fuel vs. fed with conventional diesel.
Two hypotheses were put forward:
- H0, that the values of the test differ significantly (then t | > tkr), Difference Important (DI),
- H1, that the test values do not differ significantly (then t | < tkr), Difference Not Important (DNI).
with
t—t-Student’s distribution value,
tkr—t-Student’s distribution critical value.
The same analysis was carried out for the result if the engine fed with DF mixture vs. with conventional D fuel. The results are given in Table 3.
The differences in the test total (ST) and statistical verification of their significance are given in Figure 11.
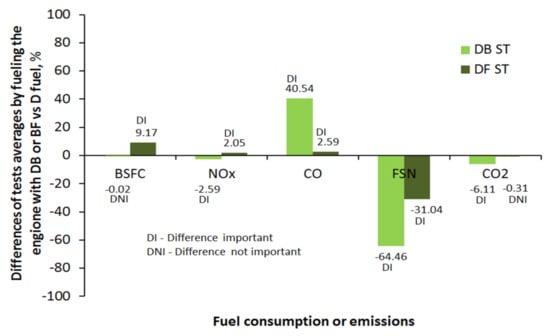
Figure 11.
Differences in ESC test results by feeding the investigated engine with both mixtures in comparison to feeding with standard diesel fuel.
The lowering of BSFC by 0.02% is not significant, which is understandable, but the change in the NOx emission only by about 2% or 2.5% is important, fully unexpected, and interesting. The same applies to a 2.6% growth in CO emissions (engine fed with DF).
For the aim of such type of work (as here), it is important to know if by changing the fuel the lowering of CO2 emission can be expected. Figure 12 is showing that by feeding with DB it is possible to achieve a small (6% but significant) lowering emission of CO2 in engine exhaust. The engine fed with DF also lead to lowering the CO2 emission (0.3%) in exhaust, but that is not significant. However, CO2 emissions from the engine are not reliable for solving the global emissions problem. Here, it is more interesting if, when adding an additive from renewable resources to the fuel, as long as the consumption of fuel components from non-renewable resources (mineral hydrocarbons) can be reduced.
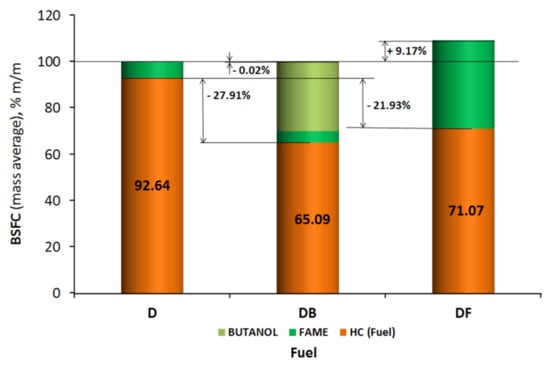
Figure 12.
Percentage by relative mass of components in fuels consumed in the ESC test.
4. CO2 Emissions Lowering by the Fuel Composed with Bigger Amount of Bio-Components
Vehicle fuels are sold by volume (in liters or gallons). All chemical reactions (including combustion of fuels) take place in mass proportions. It is important to assess how much of the conventional hydrocarbon mass (without additives) can be replaced by the mass of bio-components. This can also be expressed with an equivalent question—if bio-additives are introduced into conventional mineral fuel, then how will the share of mass of hydrocarbons (derived from crude oil) change in order to achieve the assumed energy effect. By using test results in line with the ESC test requirements, such a question is relatively easy to answer.
DB or DF fuel in 34.9% (v/v) of fractions are derived from renewable resources, therefore, they are (should be) at least neutral in terms of CO2 emissions. The use of such fuel components would be a major step in reducing CO2 emissions, which would have a positive influence on the greenhouse effect.
Relative proportions in mass fuel consumption to achieve the same energy effect are shown in Figure 12. The absolute values of mass fuel consumption (BSFC) are given in Figure 3.
As it is shown, the mass proportion of components of used fuels are also different.
Assuming that the use of bio-components is at least neutral due to the CO2 balance, it becomes important as long as the mass of fuel components coming from non-renewable sources is reduced.
The percentages are shown in Figure 12.
The lowering of the mass of hydrocarbons (to achieve the same energy effect) is different. The mass of hydrocarbons reduction is mostly greater by feeding the engine with DB, which is unexpected. About 28% reductions achieved.
It is noteworthy that the mass consumption of DF vs. consumption of D fuel is more than 9%. That lead together also with the rise of HC fuels consumption and as result the effect of using the DF lead to the total reduction of hydrocarbons consumption by mas “only” around 22% (for achieving the same energy effect).
By using the fuel with 34.9% (v/v) bioagent mixture (4.9% v/v FAME plus 30% v/v n-Butanol in full volume of DB), we can expect about 28% m/m (mass) reduction of hydrocarbons from nonrenewable sources. Contrarily, by using the fuel with 34.9% (v/v) FAME as bioagent in the full volume of DF, the HC fuels mass reduction in consumed fuel around is 22% m/m.
By coming back to Figure 2, then it will be supposed that more bioagent must be led to the potential lowering of CO2 emissions in the same proportion as the volumetric minimalization of hydrocarbons (from non-renewable sources) in fuel content.
However, the mass proportions of bioagents in fuel compositions differ from the volumetric proportions.
Therefore, solving the problem of greenhouse CO2 reduction is not so simple as expected earlier.
It is not enough to compose the fuel from the agents from renewable sources content. The result does not necessarily have to be proportional to the amount of bio-compounds in fuel composition.
Critical parameters are the amount of bio-compounds and also the chemical structure and burning possibility of the achieved mixture in the engine. This leads to achieve the CO2 lowering aims nonlinearly.
It is worth emphasizing here that if the engine is powered by DB fuel, the efficiency of energy use of this fuel increases (BSFC is smaller). Statistically, it is meaningless but economically it is significant. On the other hand, if the engine is powered by DF, the efficiency of energy use of this fuel decreases. Statistically, this is significant. It seems that it may be also economically significant, but unfortunately negative. The reason for not introducing such (expensive) bio-components into fuels on a larger scale is slowly becoming clear. Statistically, this change is significant. It seems that it may be economically significant.
5. Conclusions
The main need now around the World is to reduce emissions, including from transport, which is one of the main sectors of the economy.
All available forecasts indicate that until at least 2050 diesel fuel will be used in the transport of vehicles with IC engines.
Currently, the main global emissions problem is CO2 emissions.
The basis for reducing CO2 emissions from transport is the acquisition of energy for vehicles operation from renewable sources. Using such fuels means that the problem of emissions (especially CO2) can be solved immediately.
This paper presents the possibility of using heavy alcohols in a bigger amount (30% v/v) as a component of fuels for a diesel engine. The use of bio-components in higher concentrations in fuels is not reported in the literature on the subject.
One of the reasons for this is probably very different opinions regarding this solution.
These diverse opinions come from the lack of agreed research procedures.
The aim of this paper is to show minimum procedure steps to achieve the assessment of the implementation of proposed solutions involving new mixtures of fuels with high heavy alcohol content.
The test procedure used included; engine tests on test bench, recalculations of the measurement data, statistically analysis of the obtained dispersions and determination of significance of achieved differences before and after the changes were introduced.
A relevant procedure was presented to assess using of two mixtures with bio-components.
Test mixtures were composed of a standard diesel (B7), composing of 7% v/v of Fatty Acid Methyl Ester (FAME) with a bio agent 30% v/v added to it. In the first case, n-Butanol (the obtained mixture is called as DB), and for comparison, in the second case FAME used (achieved mixture called here as DF).
Despite the addition of n-Butanol (which has a lower density), BSFC remained at a similar level as by use of B7 diesel (a negligible decrease in BSFC by 0.02% was noted, Figure 3). After the addition of FAME (which has a higher density like diesel), a significant increase in BSFC by 9.17% was noted (Figure 3). The reason may be the incomplete combustion of DF.
After the addition of n-Butanol, there is a not very large but significant NOx emission lowering it is noticeable (−2.59%, Figure 4). Contrarily, the addition of FAME did not lower the emission much, (which was up to 2.05%), but it is statistically important. The reason here is that probably the earlier evaporation of butanol led to the lowering of burning temperature and then lowering of NOx formation.
Important growth (40.54%) of CO emissions (Figure 5) and in the same time small decrease in fuel consumption (Figure 3) by adding of n-Butanol may indicate that the combustion process still has reserves for its optimization. The present investigation was carried out without any interference in the engine control system (created for supplying with diesel fuel).
An increase in the CO emissions by 2.59% (Figure 5) with the addition of FAME is statistically significant.
Large drops in smoke opacity, which was noted here (Figure 6), were not expected for both fuels—especially a 64.46% decrease in FSN with the addition of n-Butanol is something extraordinary. Usually, a reduction in FSN is noted but with a simultaneous increase in NOx emissions. There was nothing like that here. The ways to achieve a reduction of PM and NOx together are very understood.
A 6.11% reduction in CO2 emissions from the exhaust gas of an n-Butanol content fuel fed engine (Figure 7) may not matter as much as the simultaneous replacement of 27.91% of hydrocarbons from non-renewable resources with this component. However, it must be at the same time stated that the large FAME addition did not lead to this state.
The key conclusions are:
- It is possible to lower emissions from engines by using the n-Butanol as a large scale diesel fuel component
- A double positive ecological effect can be obtained—a decrease in CO2 emission from the engine and at the same time because the fuel contained a significant share of bio-carbon.
- NOx and FSN emissions can be reduced together (FSN in higher percentage); usually, if NOx emissions are reduced, FSN increases, and vice versa.
- If the research is carried out using an appropriately advanced procedure, it can be shown that the use in future of heavy bio alcohol (bio n-Butanol) makes more sense than today’s widespread use of bio esters of higher fatty acids, although the withdrawal of these esters is not justified.
Author Contributions
Conceptualization, L.J.S. and Z.J.S.; methodology, M.A.-Z.; software, L.J.S. and M.A.-Z.; validation, L.J.S., Z.J.S., and M.A.-Z.; formal analysis, Z.J.S.; investigation, M.A.-Z.; resources, L.J.S.; data curation, Z.J.S.; writing—original draft preparation, L.J.S.; writing—review and editing, M.A.-Z.; visualization, M.A.-Z.; supervision, Z.J.S.; project administration, L.J.S.; funding acquisition, Z.J.S. All authors have read and agreed to the published version of the manuscript.
Funding
This research received no external funding.
Institutional Review Board Statement
Not applicable.
Informed Consent Statement
Informed consent was obtained from all subjects involved in the study.
Data Availability Statement
Not applicable.
Conflicts of Interest
The authors declare no conflict of interest.
References
- UN Environment Programme. Emissions Gap Report. 2019. Available online: http://www.unenvironment.org/emissionsgap (accessed on 18 November 2020).
- Siva Prasad, K.; Srinivasa Rao, S.; Raju, V.R.K. Effect of compression ratio and fuel injection pressure on the characteristics of a CI engine operating with butanol/diesel blends. Alex. Eng. J. 2020. [Google Scholar] [CrossRef]
- Sheehan, J. The Role of Bioethanol in Global Climate Change; National Renewable Energy Lab.: Albuquerque, NM, USA, 1998. [Google Scholar]
- Todts, W. CO2 Emissions from Cars: The Facts. European Federation for Transport and Environment AISBL, 4 September 2018. Available online: https://www.transportenvironment.org/sites/te/files/publications/2018_04_CO2_emissions_cars_The_facts_report_final_0_0.pdf (accessed on 18 November 2020).
- Laza, T.; Bereczky, A. Basic fuel properties of rapeseed oil-higher alcohols blends. Fuel 2011, 90, 803–810. [Google Scholar] [CrossRef]
- Advanced Motor Fuels, International Energy Agency (IEA). IEA Agreement on Advanced Motor Fuels. 2014. Available online: https://www.iea-amf.org/content/fuel_information/butanol/properties (accessed on 18 November 2020).
- Brandao, L.F.P.; Braga, J.W.B.; Suarez, P.A.Z. Alternative butanol/gasoline and butanol/diesel fuel blends: An analisis of the interdependence between physical-chemical properties by a multivariate principal component analysis model. Energy Environ. 2018, 5, 733–754. [Google Scholar] [CrossRef]
- Brandao, L.F.P.; Suarez, P.A.Z. Study of kinematic viscosity, volatility and ignition quality properties of butanol/diesel blends. Braz. J. Chem. Eng. 2018, 35, 1405–1414. [Google Scholar] [CrossRef]
- Yüksel, B.; Yilmaz, N.; Atmanlı, A.; Ileri, E. Extensive analyses of diesel–vegetable oil–n-Butanol ternary blends in a diesel engine. Appl. Energy 2015, 145, 155–162. [Google Scholar]
- Zoldy, M. Fuel Properties of Butanol—Hydrogenated Vegetable Oil Blends as a Diesel Extender Option for Internal Combustion Engines. Period. Polytech. Chem. 2019, 64, 205–212. [Google Scholar] [CrossRef]
- Stark, A. Conversion of Waste into Butanol and Hydrogen. Process-Worldwide. 2018. Available online: https://www.process-worldwide.com/conversion-of-waste-into-butanol-and-hydrogen-a-673710 (accessed on 18 November 2020).
- Farmanbordard, S.; Karimiab, K.; Amiric, H. Municipal solid waste as a suitable substrate for butanol production as an advanced biofuel. Energy Convers. Manag. 2017, 157, 396–408. [Google Scholar] [CrossRef]
- Tian, W.; Wang, L.; Han, Z.; Chu, Y.; Wang, X.; Xia, Q. Effects of Combustion Parameters on Emissions of Diesel, Diesel/n-Butanol, and Diesel/n-Butanol/2-Ethylhexyl Nitrate Fuels at Different Intake-Oxygen Concentrations in a Diesel Engine. J. Energy Eng. 2020, 147, 4020081. [Google Scholar] [CrossRef]
- Mahmudul, H.M.; Hagos, F.Y.; Mukhtar, M.N.; Mamat, R.; Abdullah, A.A. Effect of Alcohol on Diesel Engine Combustion Operating with Biodiesel-Diesel Blend at Idling Conditions. IOP Conf. Ser.: Mater. Sci. Eng. 2018, 318, 12071. [Google Scholar] [CrossRef]
- Stenchov, H.; Markov, K. Investigation of diesel engine operated with diesel fuel-butanol blends and cetane improver. In Proceedings of the International Congress Motor Vehicles & Motors, Kragujevac, Serbia, 4–5 October 2018. [Google Scholar] [CrossRef]
- Saraswat, M.; Chauhan, N.R. Comparative assessment of butanol and algae oil as alternate fuel for SI engines. Eng. Sci. Technol. 2020, 23, 92–100. [Google Scholar] [CrossRef]
- Thomas, K.G.; Nath, B.; Jackson, R.J.; Sharon, H. Combustion characteristics assessment of diesel engine fueled by diesel-butanol-used cooking oil biodiesel blends. AIP Conf. Proc. 2020, 2225, 030001. [Google Scholar] [CrossRef]
- Labeckas, G.; Slavinskas, S.; Rudnicki, J.; Zadrąg, R. The Effect of Oxygenated Diesel-N-Butanol Fuel Blends on Combustion, Performance, and Exhaust Emissions of a Turbocharged CRDI Diesel Engine. Pol. Marit. Res. 2018, 25, 108–120. [Google Scholar] [CrossRef]
- Algayyim, S.J.M.W.; Andrew, P.Y.T.H. The impact of n-butanol and iso-butanol as components of butanol-acetone (BA) mixture-diesel blend on spray, combustion characteristics, engine performance and emission in direct injection diesel engine. Energy 2017, 140, 1074–1086. [Google Scholar] [CrossRef]
- Karwade, A.; Thombre, S.; Bhiogade, G. Investigations on premixed charge compression ignition type combustion using butanol-diesel blends. J. Therm. Sci. Tech. 2020, 15, JTST0026. [Google Scholar] [CrossRef]
- Lapuerta, M.; Ramos, A.; Barba, J.; Fernandez-Rodriguez, D. Cold- and warm-temperature emissions assessment of n-butanol blends in a Euro 6 vehicle. Appl. Energy 2018, 218, 173–183. [Google Scholar] [CrossRef]
- European Stationary Cycle (ESC). Available online: https://dieselnet.com/standards/cycles/esc.php (accessed on 18 November 2020).
Publisher’s Note: MDPI stays neutral with regard to jurisdictional claims in published maps and institutional affiliations. |
© 2020 by the authors. Licensee MDPI, Basel, Switzerland. This article is an open access article distributed under the terms and conditions of the Creative Commons Attribution (CC BY) license (http://creativecommons.org/licenses/by/4.0/).