Article

A Method for Establishing a Hygrothermally Controlled Test Room for Measuring the Water Vapor Resistivity Characteristics of Construction Materials

1
Architecture and Design, College of Sciences and Engineering, Inveresk Campus, University of Tasmania, Launceston 7250, Australia
2
Fraunhofer Institute for Building Physics IBP, Fraunhoferstr. 10, 83626 Valley, Germany
*
Author to whom correspondence should be addressed.
Energies 2021, 14(1), 4; https://doi.org/10.3390/en14010004
Submission received: 10 November 2020 / Revised: 14 December 2020 / Accepted: 19 December 2020 / Published: 22 December 2020

Abstract

:
Hygrothermal assessment is essential to the production of healthy and energy efficient buildings. This has given rise to the demand for the development of a hygrothermal laboratory, as input data to hygrothermal modeling tools can only be sourced and validated through appropriate empirical measurements in a laboratory. These data are then used to quantify a building’s dynamic characteristic moisture transport vis-a-vis a much more comprehensive energy performance analysis through simulation. This paper discusses the methods used to establish Australia’s first hygrothermal laboratory for testing the water vapor resistivity properties of construction materials. The approach included establishing a climatically controlled hygrothermal test room with an automatic integrated system which controls heating, cooling, humidifying, and de-humidifying as required. The data acquisition for this hygrothermal test room operates with the installation of environmental sensors connected to specific and responsive programming codes. The room was successfully controlled to deliver a relative humidity of 50% with ±1%RH deviation and at 23 °C temperature with ±1 °C fluctuation during the testing of the water vapor diffusion properties of a pliable membrane common in Australian residential construction. To validate the potential of this testing facility, an independent measurement was also conducted at the Fraunhofer Institute of Building Physics laboratory (IBP) Holzkirchen, Germany for the diffusion properties of the same pliable membrane. The inter-laboratory testing results were subjected to statistical analysis of variance, this indicates that there is no significant difference between the result obtained in both laboratories. In conclusion, this paper demonstrates that a low-cost hygrothermally controlled test room can successfully replace the more expensive climatic chamber.

1. Introduction

Over the last three decades, the increased expectations for energy efficient buildings combined with greater thermal comfort has established significant differences between the interior and exterior environmental water vapor pressure. This has created the need to manage water vapor diffusion and moisture, and has led to an increased demand for appropriate hygrothermal assessment [1]. Hygrothermal analysis is capable of calculating the dynamic transport of moisture, heat, and air in a building envelope. In most developed nations, this has become an essential part of the production of durable, healthy, comfortable, and energy-efficient buildings [2,3]. The presence of uncontrolled moisture above a critical limits can result in various degrees of deterioration which can include corrosion, rusting, freezing, and swelling of many materials used in the building [2,4]. The most concerning aspect of uncontrolled moisture in a building is the opportunity for mold to grow within interior spaces. This can have serious implications for the health of the occupants [5,6]. In addition, recent research has shown that high levels of moisture can impact the energy performance of a building and the quality of the indoor air [7,8,9,10].
In Australia, moisture problems have become apparent in many new buildings. Up to 50% of National Construction Code Class 1 and Class 2 buildings constructed in the last 15 years have a visible internal formation of condensation [11]. The complexity involved in understanding water vapor transport through appropriate hygrothermal calculation is posing significant challenges to the design and construction professionals in Australia especially when considering moisture management and energy efficiency in buildings [12,13,14].
While hygrothermal assessment, the key scientific approach to managing condensation and mold in buildings, has been deployed to address these challenges in many other developed nations, it is an emerging field in the Australia [13]. This may be because there were no building regulations requiring insulation in building envelopes until 2003, and the first regulations regarding risk of condensation management only came into effect in 2019. The long-term impact of moisture accumulation on building durability and human health has now become a critical aspect of the Australian regulatory agenda for new buildings.
Across other developed nations, hygrothermal analysis has evolved from manual calculation methods to computer simulations [15,16,17]. In the last two decades, this has moved from a limited focus on condensation risk analysis to a greater understanding of moisture accumulation, energy efficiency, and the drying capacity envelopes. Over the same period of time, the simulation method has advanced from steady state to transient simulation [18,19,20].
Several elements need to be considered in choosing an appropriate approach to hygrothermal modeling. In addition to precision and accuracy, the flexibility to allow selection from a variety of climatic zones and the quality of the climatic data are important aspects [21]. Other things to consider include the simulation runtime, the size of the material data library, and how the vapor diffusion and moisture absorption data have been sourced and validated. For instance, WUFI Pro [15], which appears to be the most popularly used hygrothermal software in Europe and North America, has been considered to be reliable because of its ability to deliver a realistic transient calculation and also because all the construction materials in its data library have been well validated [15,22].
The most appropriate method to source and validate construction material’s vapor diffusion properties is to conduct measurements in the laboratory. For many nations, the laboratory measurement of water vapor diffusion characteristics of individual construction materials is evolving, and robust databases are being created. The internationally accepted method to represent vapor diffusion is material vapor resistivity. Due to Australia’s slower adoption of highly insulated envelopes and vapor resistivity material data has not been required. It is inappropriate to adopt internationally available data directly for use in Australia without appropriate empirical evaluation of their applicability to materials used in Australia’s envelope systems and the physical properties of Australian manufactured construction materials. As of 2019, the Australian National Construction Code requires hygrothermal calculations [23,24] in order for the design of new buildings to be approved. Early adopters are using non-Australian data from international material databases for hygrothermal modeling; however, these data may not provide a true representation of Australian construction materials. Without empirical information regarding the vapor diffusion properties of Australian construction materials, there is the potential that inappropriate decisions will be made.
Four types of laboratory-based test methods are internationally recognized for the quantification of the water vapor diffusion properties of materials. These include the electron-analytical, sweating guarded hot plate, dynamic moisture permeation cell test, and the gravimetric methods [4,25,26,27,28,29,30,31]. The testing process requires the establishment of two environments with different vapor pressures on each side of the material. Increasingly, the most preferred method for establishing the water vapor diffusion properties of most construction materials is the gravimetric method [26,32,33,34,35,36]. This involves the measurement of the mass of moisture that has resulted from water vapor diffusion into or out of a test dish assembly, often referred to as the wet-cup or dry-cup test method, respectively [25,32,37]. Depending on whether it is a wet-cup or dry-cup test, salt solutions, distilled water or a desiccant are used to establish a predetermined relative humidity within the test dish. The material is cut and attached to the test dish and then placed in a temperature and humidity-controlled cabinet or room. The humidity outside the cup, in the room, or cabinet, is controlled so that the desired relative humidity condition outside is achieved [37,38]. The conditions created within the cabinet or test room are designed to replicate the hygrothermal conditions the material may expect to experience as a component of the built fabric. The focus of this paper centers on the establishment of an appropriately hygrothermally controlled test room required for gravimetric vapor diffusion testing.
The general principle for the gravimetric method (shown in Figure 1) is to create two environments with different vapor pressures, by establishing different relative humidities inside and outside the cup, while the temperature remains constant. During the test period, the dish is weighed at regular intervals until the mass does not change, indicating the vapor pressure of the test dish and the room have reached equilibrium. For wet cup gravimetric testing (shown in Figure 2, the vapor flux is expected to go from the cup which has a higher RH through the material being tested to the environment which has a lower RH. The reverse is the case for dry cup gravimetric testing, shown in Figure 3. The process is discontinued after a minimum of four consecutive weighing which shows no change in mass.
While many research papers have reported different procedures for quantifying the water vapor diffusion of construction materials using the gravimetric method in a climatic cabinet [34,39,40], no research has reported the development of a hygrothermally controlled test room. However, the demand for more hygrothermally controlled test rooms will increase over the coming years both in Australia and internationally. This is because the demand for energy efficient buildings has increased in many jurisdictions as building codes have moved towards the requirement of near-zero energy consumption in buildings. Hence, the need to establish more hygrothermally suitable construction systems will increase and laboratory testing will be required to establish the hygrothermal properties of individual component materials.
The merits of a hygrothermally conditioned test room over the climatic cabinet is the elimination of experimental errors. During the gravimetric weighing, process errors may arise from opening, closing, and transporting test dishes from the cabinet. In a test room, all weighing activities occur within the climatically controlled space. Despite this distinct advantage, little or no research has reported the design, construction, installation of the equipment, and the operations of such a laboratory. This may be because the acquisition and installation of laboratories is not regarded as a research output. In addition, due to commercial reasons, those engineering firms that have built such rooms have never made available the details of the design, construction, and installation of such a facility. This paper describes the methods employed to develop Australia’s first hygrothermal laboratory for quantifying the diffusion properties of materials using common appliances, which included a round-robin test conducted between Fraunhofer Institute of Building Physics laboratory (IBP) Holzkirchen Germany, and this hygrothermal testing laboratory at the University of Tasmania (UTAS), Australia.
The approach employed included establishing a climatically controlled hygrothermal test room with an automatic integrated system which allows heating, cooling, humidifying, and de-humidifying as required. The data acquisition for this hygrothermal test room operates with the installation of environmental sensors connected to specific and responsive programming codes. The room reported here, has been used to successfully complete wet and dry cup vapor diffusion material testing for relative humidities RH between 50% with ±1%RH deviation and temperatures between 23 °C with ±1 °C fluctuation. The test results indicate that a hygrothermally controlled test room can successfully replace the more expensive climatic chamber.

2. Materials and Methods

To establish a conditioned hygrothermally controlled test room, it was necessary to design and install environmental equipment that controls the interior temperature and relative humidity within the conditioned room. The accurate control of temperature and relative humidity conditions, within the bandwidths prescribed in ISO 12572, is critical to enable gravimetric based testing of building material vapor resistivity properties. For this research, a test building located at the Newnham campus of the University of Tasmania, was reconfigured to enable the conditioned room to be dynamically controlled. The controls included heating, cooling, humidification, and dehumidification. The second stage involved a round-robin testing of the water vapor resistivity properties of a pliable membranes at Fraunhofer Institute of Building Physics laboratory Holzkirchen Germany, and at this hygrothermal testing laboratory. The following sections discuss the design, installation, operation, and the performance of test room, the inter-laboratory testing that was conducted to compare test facilities and results for measuring vapor resistivity properties.

2.1. Design and Description of the Thermal Test Building

The University of Tasmania has three thermal test buildings at the Newnham campus in Launceston. They include an unenclosed-perimeter platform-floored building, an enclosed-perimeter platform-floored building and a concrete slab-on-ground floored building. Previous research had established that the well-insulated concrete slab-on-ground floored test building demonstrated the most stable interior temperatures without any stratification in both conditioned and unconditioned modes of operation. This building has an internal floor area of 30.03 m2 (5.48 m by 5.48 m), a ceiling height of 2.44 m and total volume of 73.3 m3 and has no window, as shown in Figure 4 and Figure 5. The building, constructed in 2006, applied Australian best practice wall and ceiling insulation and air-tightness methods. The combination of the ground keyed concrete slab, external walls with R2.5 in-frame wall insulation, R4.2 ceiling insulation, and a well-installed air barrier system ensured a high-quality test building with minimal internal temperature variability.

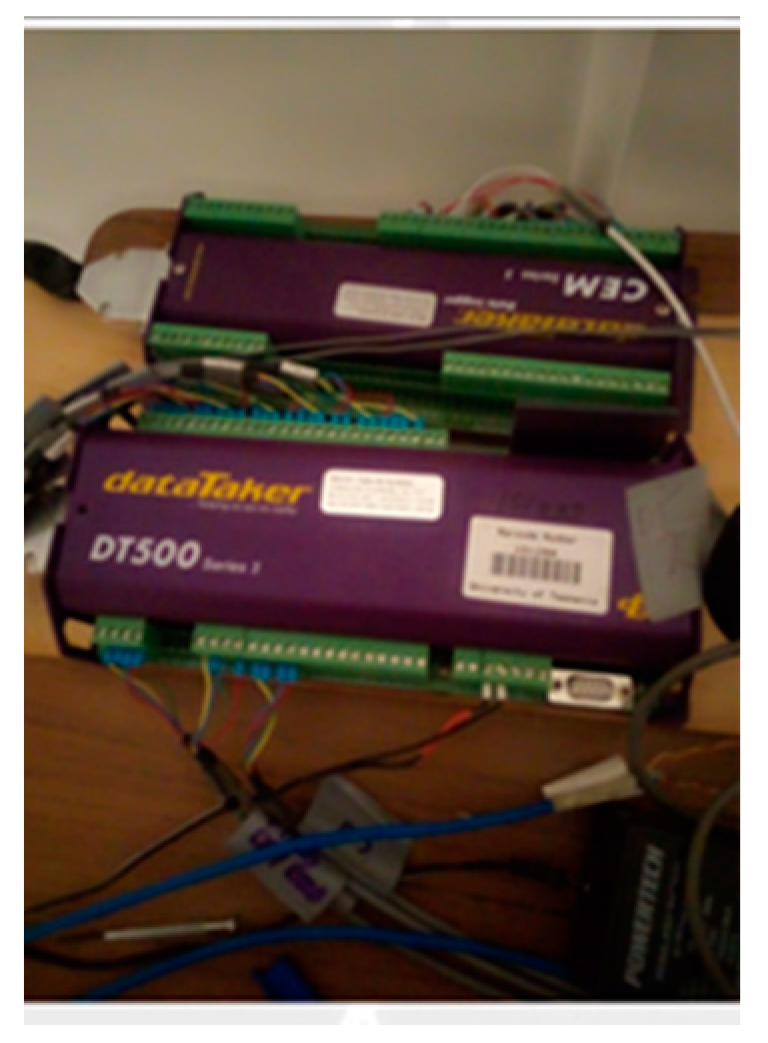
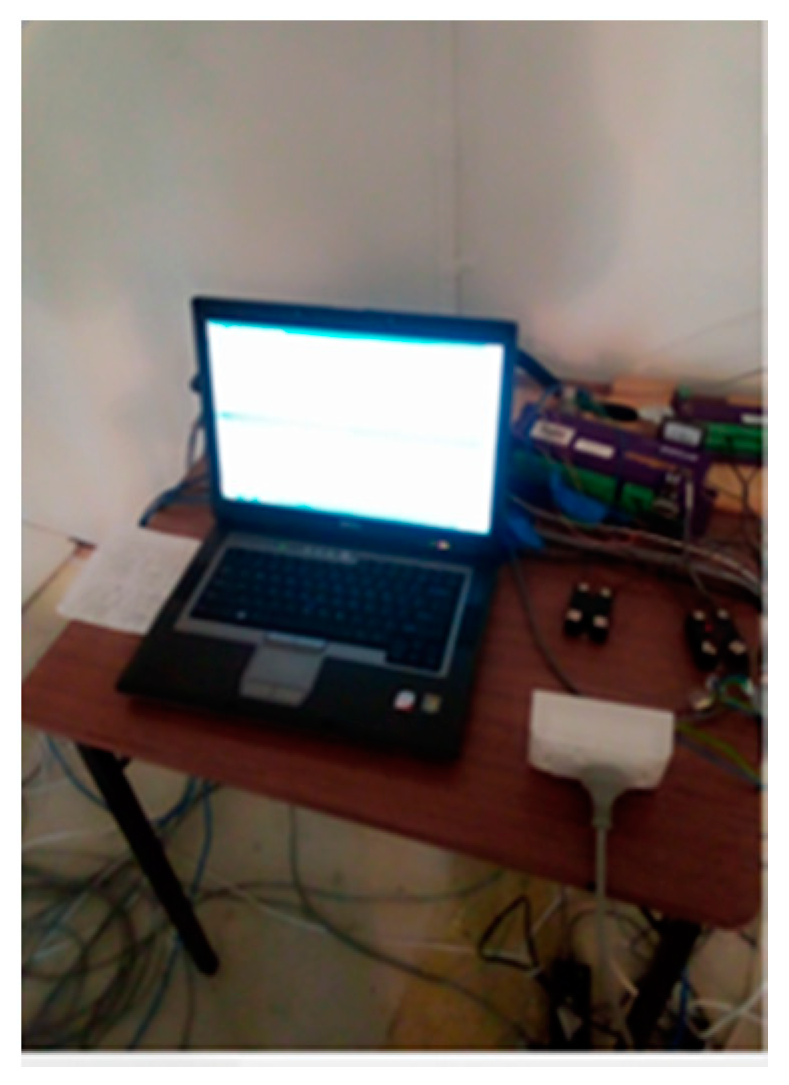
2.2. Cabling and Installation of Integrated Data Acqusition System

The control of air temperature and relative humidity are critical to the successful operation of a hygrothermally controlled test room. To enable accurate control of the test room interior a data acquisition system was used. Normally, data acquisition requires one or more transducers (sensors) to sense, process, and send signals from a measuring instrument to the system, the data acquired is then stored or logged into the central processing unit of a computer or external memory for later analysis. The data acquisition system generally includes: the sensors; a device that converts the primary signal from the sensors into a compactible form with the information processing systems; a computer by which the overall system is able to be managed and on which data from sensors are stored. For this research, DataTaker DT500 dataloggers with a channel extension module (CEM) (see Figure 6) were used. Connection between the Datataker and Dell PC was established via a RS232 communication cable (Figure 7). The De Transfer interface software was used for communication between the DT500 data logger and the Dell PC. Two DT 500 DataTaker data-loggers were used, one for temperature sensors and the second for the relative humidity sensors. An array of four wire PT100 sensors were used to measure temperature. An array of two wire Vaisala HMW40U relative humidity sensors were used to measure relative humidity. Due to the number of terminals required for the array of four wire PT100 sensors, they were connected to both the data-logger and the CEM. The second DT500 DataTaker was used to connect the array of relative humidity sensors used for this project. The primary sensor location was on a pole located in the center of the room (see Figure 8). The need for at least three sensors in each location was based on previous research, which queried the reliability of single sensors and when two sensors had varied measured values [41]. The sensors and other apparatus used to control the room are described in Table 1.

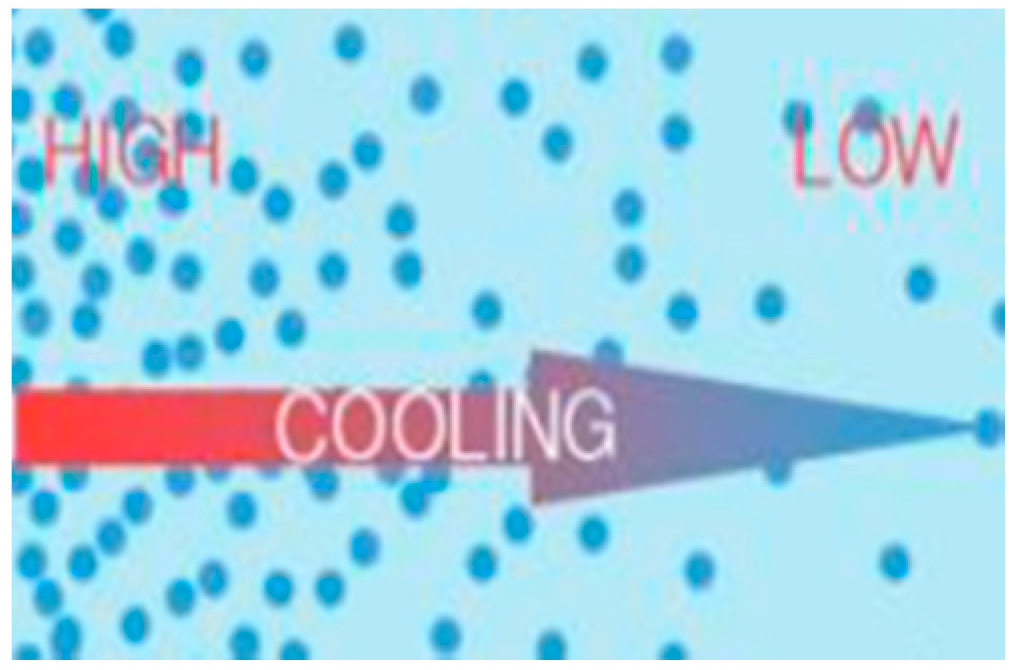
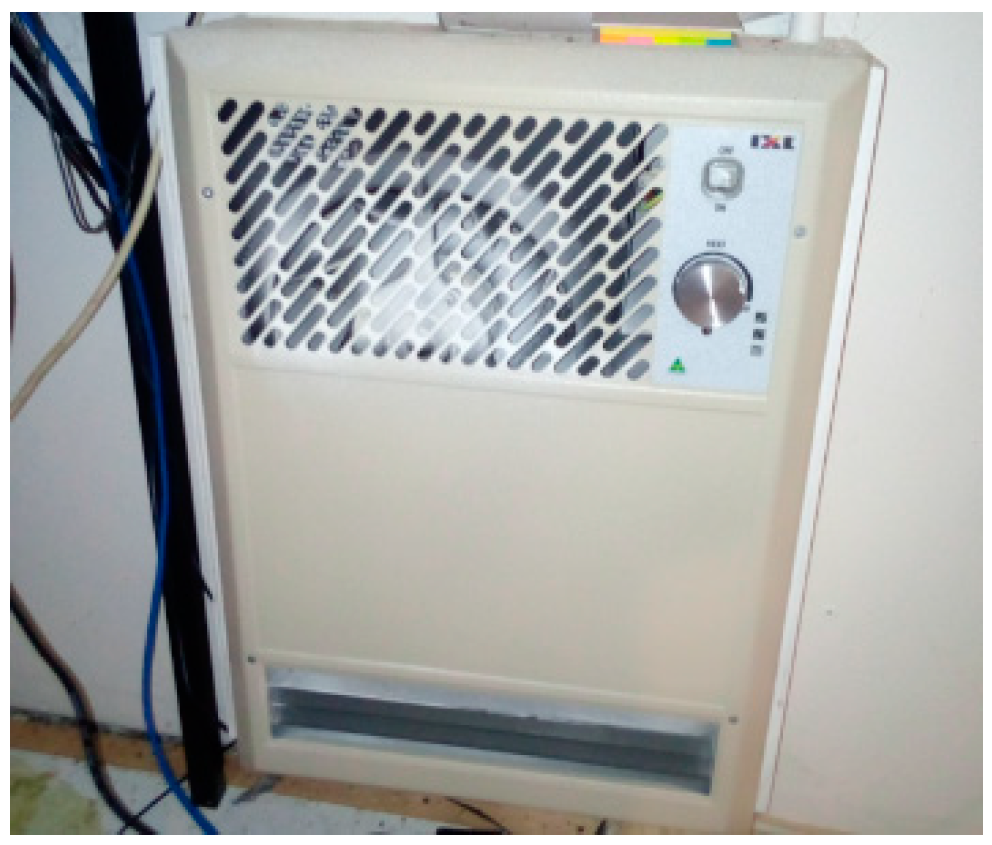
2.3. Cooling and Heating System

Automated heating and cooling were essential for the control of this hygrothermally conditioned test room. Figure 9 shows the position of the air-conditioner within the test room. This equipment is a reverse-cycle heat pump and can heat up to 30 °C. When heating above 30 °C was required for the room, the wall mounted electric heater shown in Figure 10 was turned on. Silicone DC relays (Figure 11) was used as the power switching interface between the data-logger and the appliances.

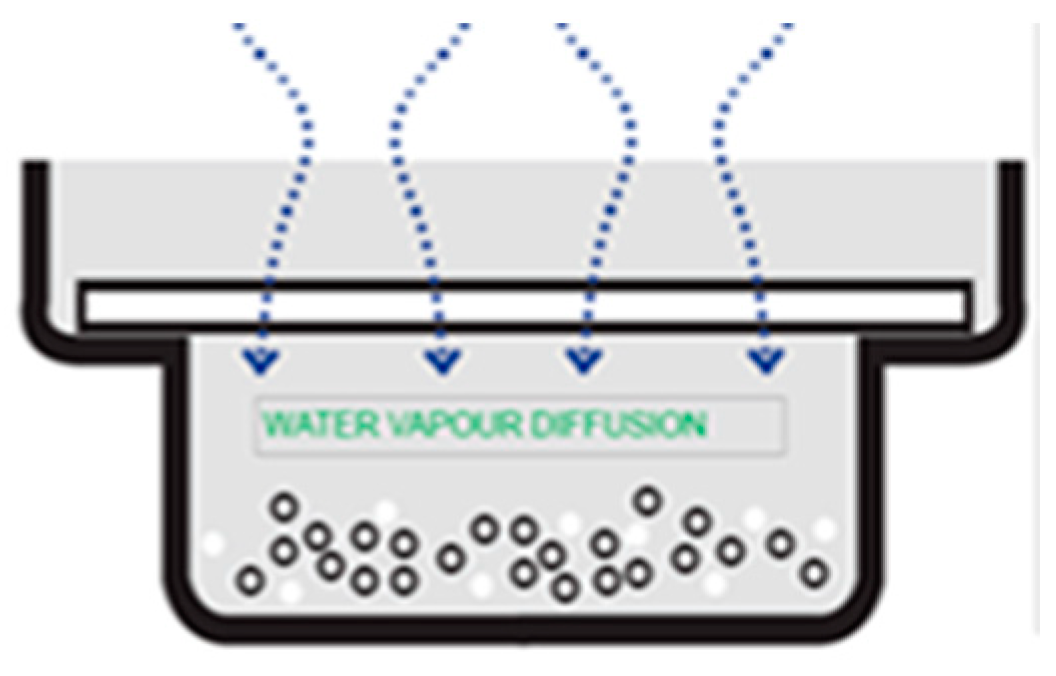
2.4. Humidity and Pressure Control System

The capability to control humidity was essential for this hygrothermally controlled room. For this research, this was achieved through the installation of humidity equipment which enabled water vapor to either be added or removed as required. The power switching for the humidity equipment utilized two solid-state relays shown in Figure 12. The first method to add water vapor to the air was to use a fishpond with a water heater. However, after preliminary testing and discussions with other research collaborators, it was established that there would be a significant water vapor lag with this method. This led to an analysis of quick response humidifiers. This resulted in the selection of a 6 L Ultrasonic Cool Mist Steam Nebulizer Diffuser Purifier (shown in Figure 13). This humidifier quickly demonstrated a very fast response to add extra water vapor to the room. Similarly, a Breville Smart dry de-humidifier (Figure 14), was installed to remove excessive water vapor from the room. The power supply for the humidifier and dehumidifier was controlled by a solid-state relay, which in turn was controlled by the DT500 data-logger. In practical terms, when the relative humidity in the room was too high the programmed data logger alarm switched the relay, thus providing power to the dehumidifier. When the desired relative humidity value was achieved, the programmed data logger alarm switched the relay off. Conversely, when the relative humidity was too low, the data logger alarm switched the relay to provide power to the humidifier, thus adding water vapor into the room until the required relative humidity setpoint was reached.
Additionally, a household fan was installed to provide circulation of the air in the room to minimize water vapor stratification.

2.5. Calibration of the Environmental Instruments

Calibration of the temperature and relative humidity sensors was completed to avoid intrinsic error that may have existed in the devices or data logging equipment. In the first instance, all sensors were carefully chosen for their level of accuracy and long-term reliability. A diagnostic procedure was established to ensure that wiring from the data logger to each sensor did not cause errors in measurements. The on-site calibration utilized pre-calibrated NATA certified temperature and relative humidity sensors provided by Industrial Technik. The calibration of the temperature sensors included zero degrees, room temperature and near boiling temperature. This was to ensure that there were no linear or non-linear errors. Any sensor that had erroneous outputs was replaced. The output from the relative humidity sensors was compared to a certified and pre-calibrated sensor, whilst the relative humidity was increased and decreased

2.6. Monitoring and Controlling Environmental Conditions

As previously mentioned, the DataTaker DT500 data logger was used for data acquisition. This system relied on programming code for data acquisition from the sensors and to control the switching relays for the heating, cooling, humidifying, and de-humidifying appliances. The acquisition systems collected temperature and relative humidity data from the sensors and simultaneously stored the data in the memory of Datataker for later use. Figure 15 shows a snapshot of an example of the programming code use to operate and collect temperature data from the PT100 sensors. This code was written according to the sensor type. Similarly, the programming code for acquiring the relative humidity data within the hygrothermal room is shown in Figure 16. In this research, temperature and relative humidity data was collected every 10 min. The examples of the programing code also show alarm codes. The coding shows minimum and maximum values for temperature and relative humidity. The alarms required the data logger to continuously monitor the relative humidity and temperature conditions in the test room. The alarm-controlled power supply to the digital switches on the data loggers. In turn, the digital switches controlled the power supply to the silicone and solid-state relays, which controlled the appliances. The combination of continuous measurement and the control of the four appliances, enabled the room temperature and relative humidity to be adequately controlled by the heating, cooling, humidifying, and dehumidifying appliances.

2.7. Inter-Laboratory Testing of Wet-Cup and Dry-Cup Dishes

The procedure for the interlaboratory testing involved the selection of a pliable membrane classified as permeable material in clause AS 4200:1 and carrying out a standard test as referred to in ISO 12572. The independent testing of water vapor resistivity properties was completed on a pliable membrane commonly used in Australian external envelope construction systems. The same material was tested under the same climatic condition of 23 °C/50%RH at both the hygrothermal laboratory at Fraunhofer IBP Germany, and UTAS, Australia. Table 2 shows the comparison of the important testing parameters that were used.
It was necessary to employ very similar round glass dishes with diameter of 200 mm. While the depth of the dishes at IBP is 80 mm, at UTAS, the dept is 60 mm. For accuracy, three dishes were used for wet-cup and another three were used for dry-cup gravimetric measurement both in Germany and in Australia. To achieve the desired humidity testing condition within wet-cup dishes, ammonium dihydrogen phosphate solution was placed in the dish, by both laboratories during the testing. This achieved a dish relative humidity of 93% (Figure 17). Similarly, to achieve the desired testing humidity condition within the dry-cup test dishes, silica gel beads were used at both laboratories, as shown in Figure 18. This achieved relative humidity of 3% within the dishes. Both laboratories employed a 20 mm air space between the top surface of the substrates and the bottom surface of the test specimen. The pliable membrane specimens were then glued to the top edge of the dishes. To avoid water vapor leakages between the dishes and test specimens, the edges between the materials were taped and sealed with molten paraffin wax at 100 °C. The dishes were then placed on shelving within these test rooms, as shown in Figure 19 and Figure 20.
Regular weighing measurements of the test dishes were taken every two hours until equilibrium was achieved. The measurements were in milligrams and all weighing data were recorded. The calculations of the water vapor resistivity properties were obtained mathematically (see Table 3 and Table 4). Microsoft Excel 365 was used to complete a statistical analysis of variance to establish if there was any significant difference between the result obtained from the laboratory at Fraunhofer IBP and UTAS.

3. Results

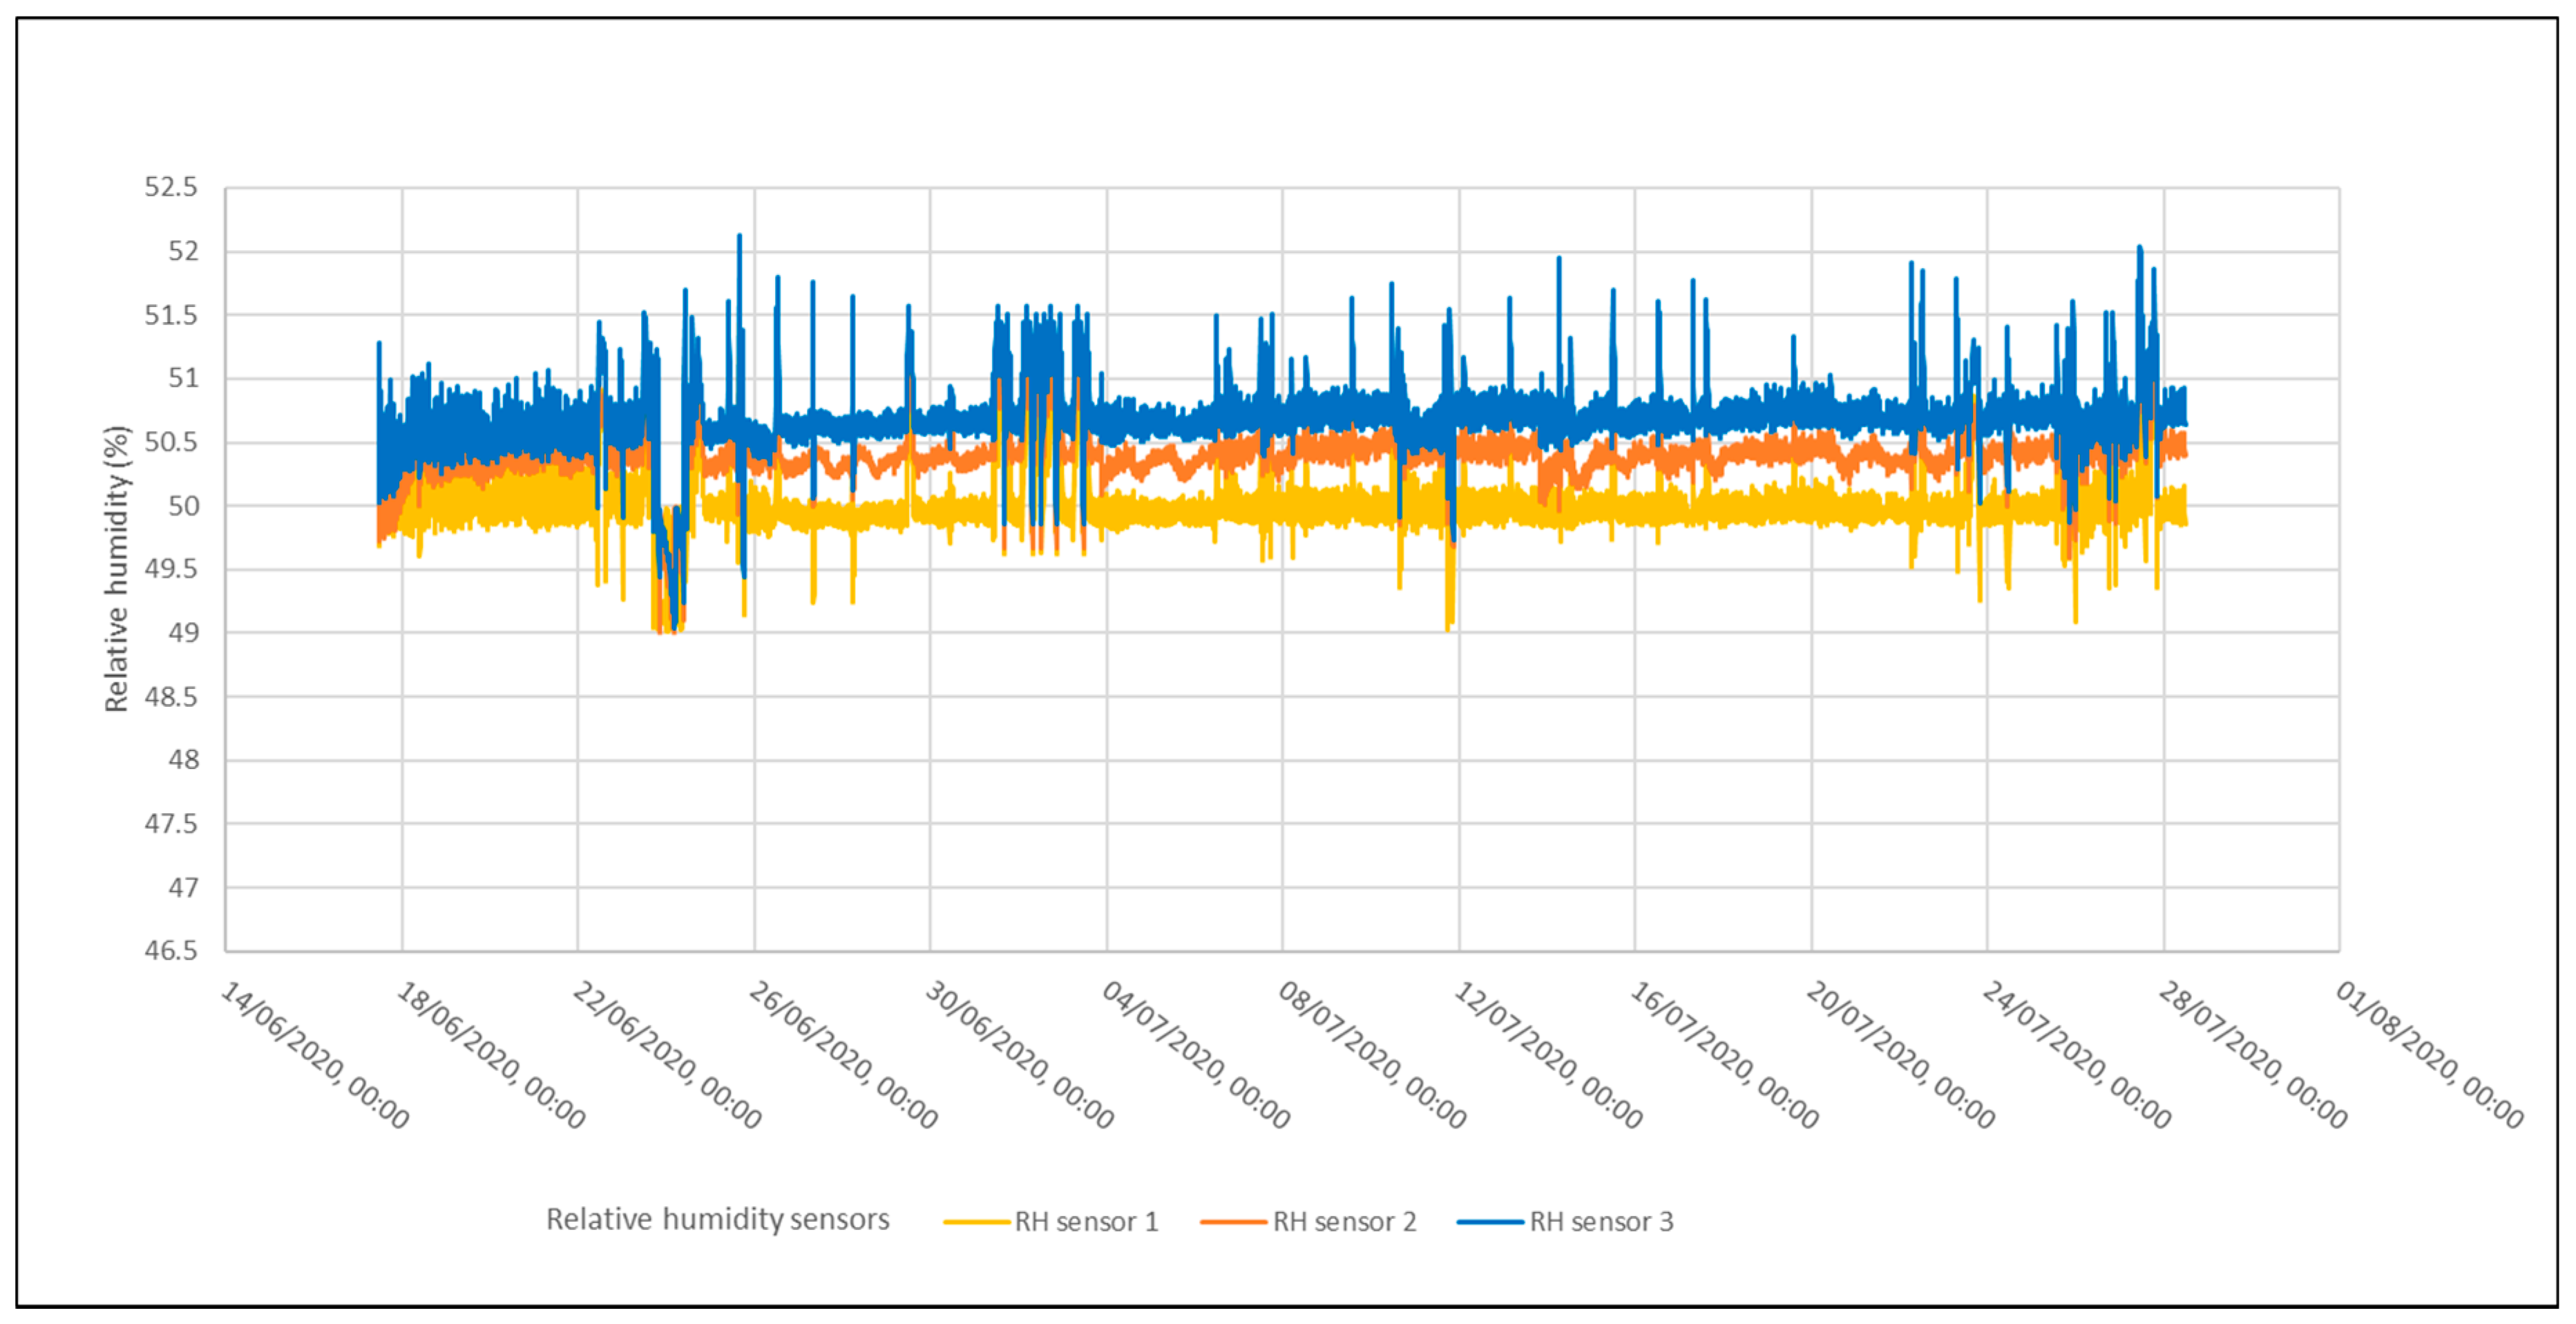
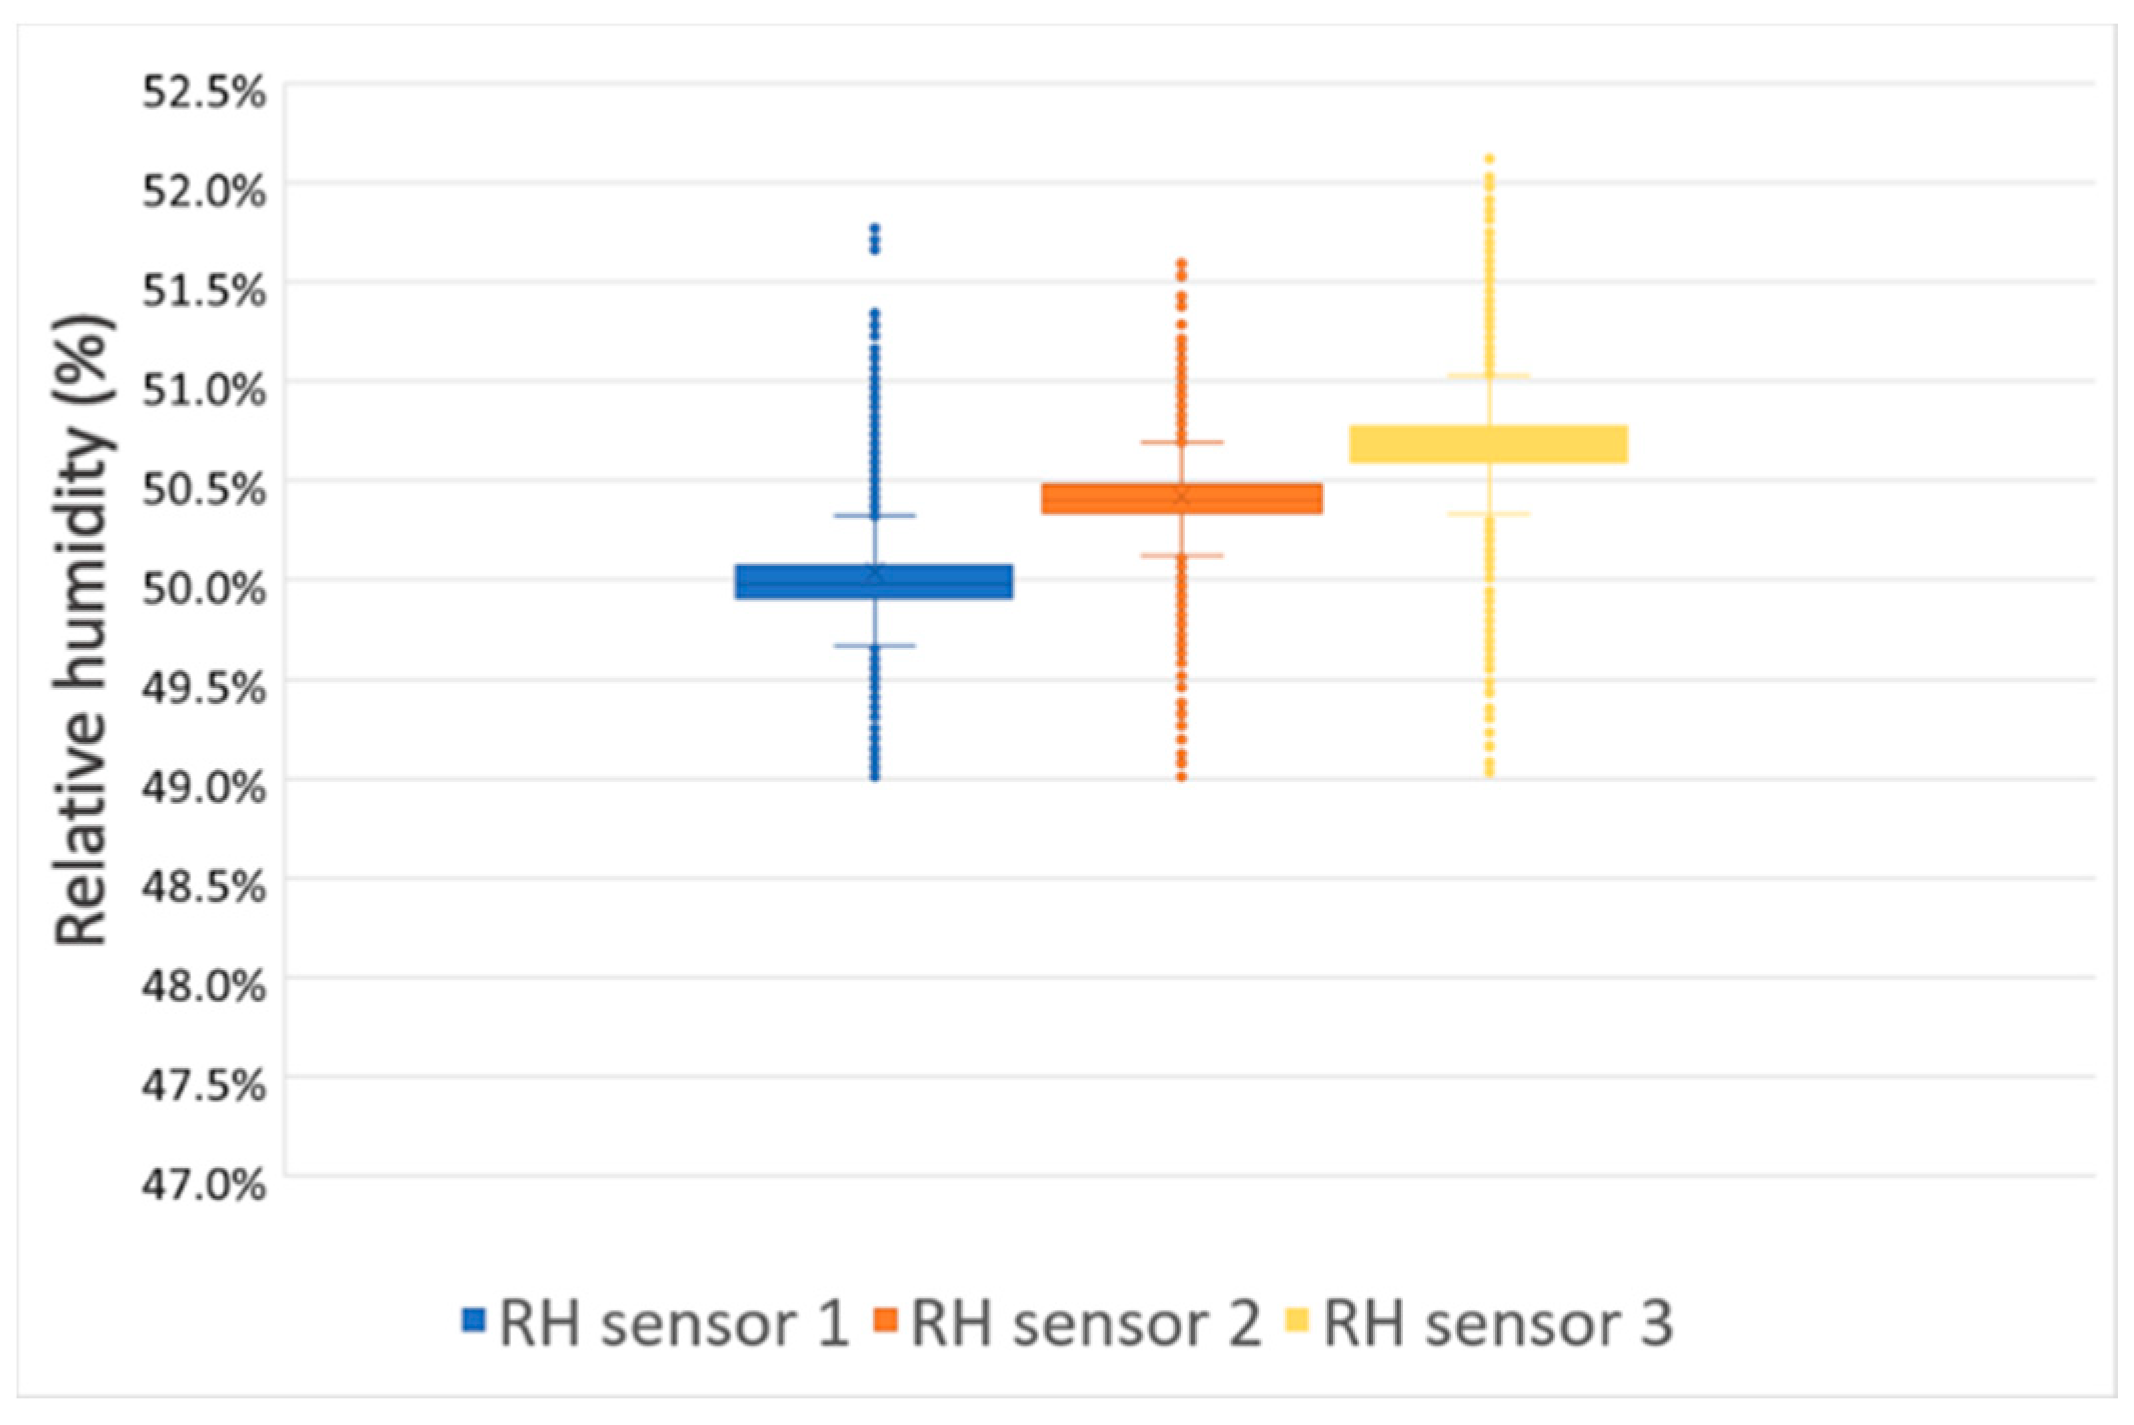
3.1. Hygrothermal Control of the Test Room

This section discusses the result from the climatic control of the hygrothermal test room which was used to quantify the water vapor diffusion properties of the permeable pliable membrane, when the test room was maintained at 50% relative humidity and the temperature remained at 23 °C (±1 °C) for the material testing periods. It was found that the room would take up to 72 h to initially reach and stabilize at the desired temperature and relative humidity.
During the establishment of the test room, sensors which controlled the operation of heating, cooling, humidifying, and dehumidifying appliances were moved until adequate control of the room was established. The final two versions of the sensor locations are shown in Table 1. The principle reason for the change in sensor location between Version 1 and Version 2 was a measured, and significant time lag for room temperature control. The time lag issues were addressed by the Version 2 configuration.
To demonstrate the potential of this hygrothermally controlled room at UTAS, the temperature and relative humidity during the material testing period was retrieved for analysis. Figure 21 shows the temperature profile of test room for the period of six weeks, while Figure 22 shows the relative humidity profile for this same period which required the relative humidity be kept at 50%. The blue box plot (Figure 23) shows the observations from three temperature sensors located 1800 mm above the floor, the orange box plot shows the observations from three temperature sensors located 1200 mm above the floor, the grey box plot shows the observations from three globe temperature (mean radiant) sensors located 1200 mm above the floor, and the yellow box plot shows the observations from three temperature sensors located 600 mm above the floor. Summarily the box plot observation indicates that aside from occasional outliers, the temperature in the room was maintained between 23.2 °C and 22.6 °C, with an average of 22.9 °C (±1 °C). Figure 24 shows the results from the three relative humidity sensors for the corresponding period, and the box plots show that aside from occasional outliers, the relative humidity was maintained between 49.8% and 50.8%, with an average humidity of 50.4% (±1%).

3.2. Comparison of the Interlaboratory Results for the Water Vapor Diffusion Properties

The gravimetric measurement of change in mass over a particular period commenced as soon as the dishes were placed in the test room. Initially, weighing was completed at two hourly intervals. This was to establish if the dish gained or lost weight (depending on the dry-cup or wet-cup substrate). Table 3 and Table 4 show the water vapor resistivity properties measured for the permeable pliable membrane commonly used for Australian construction system.
The analysis of variance that was completed shows that there was no significant difference (p = 0.38) between the results of the water vapor resistance factor (Table 5) for the wet-cup test obtained in both IBP and UTAS. Similarly, for the dry-cup test, the there was no significant difference (p = 0.77) between the results of the test obtained in both laboratories. Table 6 also indicates that there was no significant difference (p = 0.34) between the result of the wet-cup test obtained in both IBP and UTAS for the diffusion-equivalent air layer thickness, and there was no significant difference (p = 0.89) between the results of the dry-cup test obtained in both laboratories.

4. Discussion

Firstly, the set-up and configuration of the test room followed many practices common for the establishment of environmentally controlled spaces. The points of interest were the challenges in controlling the room temperature and the configuration and operation of the humidifier and de-humidifier. The ability to keep the temperature and relative humidity within specific bandwidths was critical. The temperature was kept within +/−1 °C and the relative humidity was kept within +/− 1% RH. Table 1 makes note of Version 1 and Version 2 for the measurement of dry bulb air temperature. The data logger combined with relay switches demonstrated a simple mechanism to control room temperature. However, there was a recognized time lag and regular over-heating of the test room. After several iterations of data logger programming and the co-location of additional sensors around the air-conditioning appliance, localized temperature stratification near the appliance was identified. An additional PT100 temperature sensor was installed close to the air-conditioner thermostat to establish the step difference that was occurring. This extra data allowed for a more informed approach to the data-logger alarm bandwidths, which controlled the air-conditioner power supply.
Secondly, the result of the inter-laboratory measurement of the water vapor resistance factor and the diffusion equivalent air layer thickness of a permeable membrane was investigated to validate the performance of the UTAS laboratory. Under the same experimental procedure and parameters, similar results were obtained, while experimental procedural error was minimized. Recent research [42] had indicated that irrespective of the material to be tested or the test procedure, discrepancies in results may normally occur during any inter-laboratory measurement to determine the water vapor diffusion properties of material through gravimetric cup test. The ANOVA test for this research has demonstrated that discrepancies in the result of interlaboratory measurement of pliable membrane is insignificant. This implies that the hygrothermally controlled room at UTAS can be used for the same experimental purposes obtained at IBP.
The results of the water vapor diffusion properties from the interlaboratory testing with the world leading IBP laboratory indicates that the operation of this laboratory is promising, as this method can be employed to set up a low-cost hygrothermal testing facility.

5. Conclusions and Recommendations

Essentially, the equipment in the test cells, comprised of an all-embracing range of temperature and relative humidity sensors, and an integrated data acquisition system, which enable flexible monitoring and control of heating, cooling, humidifying, and dehumidifying appliance. This combination of equipment enabled the stabilization of temperature and relative humidity which are key parameters for construction material wet-cup and dry-cup water vapor diffusion testing. The integrated system enabled the stabilization of the temperature and the relative humidity through the use of simple data-logger programming code. The current configuration, operation, and performance of the test room temperature and humidity indicated that the precise profiles required for the vapor diffusion measurement were achieved and maintained for test room conditions of 23 °C with a 50% RH.
This paper reports the establishment of Australia’s first precisely controlled hygrothermal room for measuring the water vapor diffusion properties of building materials via the use of a conditioned test room. As a key component of this research is to provide national guidance and methods for the establishment of vapor diffusion properties of Australian Construction materials, this is a positive outcome. The use of an environmentally controlled test room for measuring water vapor diffusion properties of building materials is considered more appropriate than other published methods. This is because the process of taking test dishes in and out of conditioned cabinets for weighing allows for the possibility of intrinsic errors. In summary, this research has demonstrated that the establishment of a conditioned hygrothermal test room may not be financially onerous for prospective researchers seeking to establish a hygrothermally controlled laboratory, that can be used to quantify water vapor diffusion properties for locally made construction materials.

Author Contributions

T.S.O.—Main author carried out the experiments both at UTAS and IBP, involved in the conceptualization; collects data; analyze data; graphs and visualization; provide the original draft manuscript, and revised manuscript. M.D.—Second author provides guidance to experiment, source for funding to procure equipment; project administration; contribute to data analyze; data curation; contribute to graphs and visualization, edit and provided revision to the manuscript. H.K.—Provides guidance for the laboratory operation, supervision and validation at IBP, and revision of manuscript. All authors have read and agreed to the published version of the manuscript.

Funding

This research received no external funding.

Acknowledgments

These authors acknowledge the Commonwealth Scientific Industrial Research Organization (CSIRO) for co-funding this research project.

Conflicts of Interest

The authors declare no conflict of interest.

References

  1. Künzel, H.M.; Holm, A.; Zirkelbach, D.; Karagiozis, A.N. Simulation of Indoor Temperature and Humidity Conditions Including Hygrothermal Interactions with the Building Envelope. Sol. Energy 2005, 78, 554–561. [Google Scholar] [CrossRef]
  2. Künzel, H.M.; Zirkelbach, D. Advances in Hygrothermal Building Component Simulation: Modeling Moisture Sources Likely to Occur Due to Rainwater Leakage. J. Build. Perform. Simul. 2013, 6, 346–353. [Google Scholar] [CrossRef]
  3. Hall, M.R.; Casey, S.P.; Loveday, D.L.; Gillott, M. Analysis of Uk Domestic Building Retrofit Scenarios Based on the E. On Retrofit Research House Using Energetic Hygrothermics Simulation–Energy Efficiency, Indoor Air Quality, Occupant Comfort, and Mold Growth Potential. Build. Environ. 2013, 70, 48–59. [Google Scholar] [CrossRef]
  4. Nilsson, L. Methods of Measuring Moisture in Building Materials and Structures: State-of-the-Art Report of the Rilem Technical Committee 248-Mmb; Springer: Cham, Switzerland, 2018. [Google Scholar]
  5. You, S.; Li, W.; Ye, T.; Hu, F.; Zheng, W. Study on Moisture Condensation on the Interior Surface of Buildings in High Humidity Climate. Build. Environ. 2017, 125, 39–48. [Google Scholar] [CrossRef]
  6. Dewsbury, M.; Law, T. Temperate Climates, Warmer Houses and Built Fabric Challenges. Procedia Eng. 2017, 180, 1065–1074. [Google Scholar] [CrossRef]
  7. Fořt, J.; Šál, J.; Kočí, J.; Černý, R. Energy Efficiency of Novel Interior Surface Layer with Improved Thermal Characteristics and Its Effect on Hygrothermal Performance of Contemporary Building Envelopes. Energies 2020, 13, 2012. [Google Scholar] [CrossRef] [Green Version]
  8. Moon, H.J.; Ryu, S.H.; Kim, J.T. The Effect of Moisture Transportation on Energy Efficiency and Iaq in Residential Buildings. Energy Build. 2014, 75, 439–446. [Google Scholar] [CrossRef]
  9. Wang, Y.; Ma, C.; Liu, Y.; Wang, D.; Liu, J. Effect of Moisture Migration and Phase Change on Effective Thermal Conductivity of Porous Building Materials. Int. J. Heat Mass Transf. 2018, 125, 330–342. [Google Scholar] [CrossRef]
  10. Dong, W.; Chen, Y.; Bao, Y.; Fang, A. A Validation of Dynamic Hygrothermal Model with Coupled Heat and Moisture Transfer in Porous Building Materials and Envelopes. J. Build. Eng. 2020, 32, 101484. [Google Scholar] [CrossRef]
  11. Dewsbury, M.; Law, T.; Potgieter, J.; Fitzgerald, D.; McComish, B.; Chandler, T.; Soudan, A. Scoping Study of Condensation in Residential Buildings: Final Report; Australian Building Codes Board, Department of Industry Innovation and Science Canberra Australia: Canberra, Australia, 2016.
  12. Nath, S.; Dewsbury, M.; Orr, K. Is New Housing Health Hazard? In Proceedings of the Engaging Architectural Science: Meeting the Challenges of Higher Density, 52nd International Conference of the Architectural Science Association, RMIT University, Melbourne, Australia, 28 November–1 December 2018. [Google Scholar]
  13. Olaoye, T.S.; Dewsbury, M. Establishing an Environmentally Controlled Room to Quantify Water Vapor Resistivity Properties of Construction Materials. In Revisiting the Role of Architecture for ‘Surviving’ Development, Proceedings of the 53rd International Conference of the Architectural Science Association, Roorkee, India, 28–30 November 2019; Agrawal, A., Gupta, R., Eds.; Architectural Science Association (ANZAScA): Roorkee, India, 2019; pp. 675–684. [Google Scholar]
  14. Dewsbury, M.; Soudan, A.; Su, F.; Geard, D.; Cooper, A.; Law, T. Condensation Risk Mitigation for Tasmanian Housing; Department of Justice Tasmania, Hobart: Hobart, Australia, 2018.
  15. Woloszyn, M.; Rode, C. Tools for Performance Simulation of Heat, Air and Moisture Conditions of Whole Buildings. Build. Simul. 2008, 1, 5–24. [Google Scholar] [CrossRef]
  16. International Standard Organization. Hygrothermal Performance of Building Components and Building Elements—Internal Surface Temperature to Avoid Critical Surface Humidity and Interstitial Condensation—Calculation Methods (ISO 13788:). In EVS-EN ISO 13788:2012; Estonian Center or Standardization: Brussels, Belgium, 2012. [Google Scholar]
  17. Ramos, N.M.; Delgado, J.Q.; Barreira, E.; de Freitas, V.P. Hygrothermal Properties Applied in Numerical Simulation: Interstitial Condensation Analysis. J. Build. Apprais. 2009, 5, 161–170. [Google Scholar] [CrossRef]
  18. Roels, S.; Depraetere, W.; Carmeliet, J.; Hens, H. Simulating Non-Isothermal Water Vapor Transfer: An Experimental Validation on Multi-Layered Building Components. J. Therm. Envel. Build. Sci. 1999, 23, 17–40. [Google Scholar] [CrossRef]
  19. Hagentoft, C.; Kalagasidis, A.S.; Adl-Zarrabi, B.; Roels, S.; Carmeliet, J.; Hens, H.; Grunewald, J.; Funk, M.; Becker, R.; Shamir, D.; et al. Assessment Method of Numerical Prediction Models for Combined Heat, Air and Moisture Transfer in Building Components: Benchmarks for One-Dimensional Cases. J. Therm. Envel. Build. Sci. 2004, 27, 327–352. [Google Scholar] [CrossRef]
  20. Glass, S.V.; TenWolde, A.; Zelinka, S.L. Hygrothermal Simulation: A Tool for Building Envelope Design Analysis; Wood Design Focus: LaGrange, GA, USA, 2013; Volume 23, Number 3; Fall Issue 2013; pp. 18–25. [Google Scholar]
  21. Libralato, M.; Saro, O.; de Angelis, A.; Spinazzè, S. Comparison between Glaser Method and Heat, Air and Moisture Transient Model for Moisture Migration in Building Envelopes. Appl. Mech. Mater. 2019, 887, 385–392. [Google Scholar] [CrossRef]
  22. Pallin, S.; Boudreaux, P.; Shrestha, S.; New, J.; Adams, M. State-of-the-Art for Hygrothermal Simulation Tools; US Department of Energy: Springfield, VA, USA, 2017.
  23. ABCB. The National Constrcution Code: Volume 1; Australian Building Codes Board: Canberra, Australia, 2019.
  24. ABCB. The National Construction Code: Volume 2; Australian Building Codes Board: Canberra, Australia, 2019.
  25. ASTM. Standard Test Methods for Water Vapor Transmission of Materials. In E96/E96M; ASTM International: ASTM: West Conshohocken, PA, USA, 2010. [Google Scholar]
  26. Borjesson, F. An Investigation of the Water Vapor Resistance-the Humidity Detection Sensor Method in Versmaperm Mkiv Compared to the Gravimetric Method. Master’s Thesis, Chalmers University of Technology, Gothenburg, Sweden, 2013. [Google Scholar]
  27. McCullough, E.A.; Kwon, M.; Shim, H. Comparison of Standard Methods for Measuring Water Vapor Permeability of Fabrics. Meas. Sci. Technol. 2003, 14, 1402–1408. [Google Scholar] [CrossRef]
  28. Gibson, P.; Rivin, D.; Berezin, A.; Nadezhdinskii, A. Measurement of Water Vapor Diffusion through Polymer Films and Fabric/Membrane Laminates Using a Diode Laser Spectroscope. Polym. Plast. Technol. Eng. 1999, 38, 221–239. [Google Scholar] [CrossRef]
  29. Huang, J.; Qian, X. A New Test Method for Measuring the Water Vapor Permeability of Fabrics. Meas. Sci. Technol. 2007, 18, 3043–3047. [Google Scholar] [CrossRef]
  30. Richter, J.; Staněk, K. Measurements of Water Vapor Permeability—Tightness of Fibreglass Cups and Different Sealants and Comparison of Μ-Value of Gypsum Plaster Boards. Procedia Eng. 2016, 151, 277–283. [Google Scholar] [CrossRef] [Green Version]
  31. ISO, International Standard Organization EN. Hygrothermal Performance of Building Materials and Products—Determination of Water Vapor Transmission Properties—Cup Method Iso 12572. In EVS-EN ISO 12572:2016; Estonian Center or Standardization: Brussels, Belgium, 2016. [Google Scholar]
  32. Janz, M. Methods of Measuring the Moisture Diffusivity at High Moisture Levels. Ph.D. Thesis, Building Materials LTH, Lund Unversity, Lund, Sweden, 1997. [Google Scholar]
  33. Li, K.; Xu, Z.; Jun, G. Experimental Investigation of Hygrothermal Parameters of Building Materials under Isothermal Conditions. J. Build. Phys. 2009, 32, 355–370. [Google Scholar]
  34. Olaoye, T.S.; Dewsbury, M. Australian Building Materials and Vapor Resistivity. In Building Physics Forum; AIRAH: Wollogong, Australia, 2018. [Google Scholar]
  35. Bomberg, M.; Pazera, M. Methods to Check Reliability of Material Characteristics for Use of Models in Real Time Hygrothermal Analysis. In Research in Building Physics—Proceedings of the First Central European Symposium on Building Physics, Cracow–Lodz, Poland, 13–15 September 2010; Gawin, D., Kisielewicz, T., Eds.; Technical University of Cracow: Cracow-lodz, Poland, 2010. [Google Scholar]
  36. Galbraith, G.H.; Kelly, D.J.; McLean, R.C. Alternative Methods for Measuring Moisture Transfer Coefficients of Building Materials. In Proceedings of the 2nd International Conference on Building Physics, Antwerpen, Belgium, 14–18 September 2003; pp. 249–254. [Google Scholar]
  37. Couturier, M.; Boucher, C. Dynamic Water Vapor Permeance of Building Materials and the Benefits to Buildings. In Proceedings of the 26th RCI International Convention and Trades Show, Reno, NV, USA, 29 April 2011. [Google Scholar]
  38. Wu, Y. Experimental Study of Hygrothermal Properties for Building Materials. Master’s Thesis, Concordia University, Montreal, QC, USA, 2007. [Google Scholar]
  39. Rafidiarison, H.; Rémond, R.; Mougel, E. Dataset for Validating 1-D Heat and Mass Transfer Models within Building Walls with Hygroscopic Materials. Build. Environ. 2015, 89, 356–368. [Google Scholar] [CrossRef]
  40. Dewsbury, M.; Fay, M.R.; Nolan, G.; Vale, R.J.D. The Design of Three Thermal Performance Test Cells in Launceston. In Towards Solutions for a Liveable Future: Progress, Practice, Performance, People; Dirk, J.S., Coulson, T.R., Eds.; Deakin University: Geelong, Australia, 2007; pp. 91–100. [Google Scholar]
  41. Dewsbury, M.; Fay, R.; Nolan, G. Thermal Performance of Light-Weight Timber Test Buildings. In Proceedings of the World Congress of Timber Engineering, Miyazaki, Japan, 2–5 June 2008. [Google Scholar]
  42. Feng, C.; Guimarães, A.S.; Ramos, N.; Sun, L.; Gawin, D.; Konca, P.; Hall, C.; Zhao, J.; Hirsch, H.; Grunewald, J. Hygric Properties of Porous Building Materials (Vi): A Round Robin Campaign. Build. Environ. 2020, 185, 107242. [Google Scholar] [CrossRef]
Figure 1. Diagram of water vapor diffusion [13].
Energies 14 00004 g001
Figure 2. Diagram of wet cup test method [13].
Energies 14 00004 g002
Figure 3. Diagram of dry cup test method [13].
Energies 14 00004 g003
Figure 4. Floor plan of test building.
Energies 14 00004 g004
Figure 5. Architectural section of test building.
Energies 14 00004 g005
Figure 6. Data acquisition system (DT 500 datalogger).
Energies 14 00004 g006
Figure 7. Desk control.
Energies 14 00004 g007
Figure 8. Environmental control equipment.
Energies 14 00004 g008
Figure 9. Air-conditioner.
Energies 14 00004 g009
Figure 10. Wall-mounted heater.
Energies 14 00004 g010
Figure 11. Silicone DC relays.
Energies 14 00004 g011
Figure 12. Solid state relay.
Energies 14 00004 g012
Figure 13. 6 litres Ultrasonic Humidifier.
Energies 14 00004 g013
Figure 14. Dehumidifier.
Energies 14 00004 g014
Figure 15. Example of temperature programming code.
Energies 14 00004 g015
Figure 16. Example of relative humidity programming code.
Energies 14 00004 g016
Figure 17. Wet-cup test method.
Energies 14 00004 g017
Figure 18. Dry-cup test method.
Energies 14 00004 g018
Figure 19. Shelving in the interior of test room at IBP Germany.
Energies 14 00004 g019
Figure 20. Shelving in the interior of test room at UTAS, Australia.
Energies 14 00004 g020
Figure 21. Temperature profile of the room aimed at 23 °C (+/−0.5 °C) for the testing period 2.
Energies 14 00004 g021
Figure 22. Relative humidity profile of the room aimed at 50% for the testing period 2.
Energies 14 00004 g022
Figure 23. Box and whisker plot of temperature observations during test 2.
Energies 14 00004 g023
Figure 24. Box and whisker plot of relative humidity observations during test 2.
Energies 14 00004 g024
Table 1. Summary of sensors and other equipment.
Sensor/EquipmentTypeLocationFunction
Dry bulb air temperature (V1)Four wire Platinum RTDVersion 1–Center of room, three sensors at each reference height of 600 mm, 1200 mm, and 1800 mmTo measure test room air temperature and to inform the control of the air conditioner
Dry bulb air temperature (V2)Four wire Platinum RTDVersion 2–same as Stage 1 plus air-conditioner supply airSame as above
Mean radiant temperature Four wire Platinum RTD within 150 mm diameter copper globesCenter of room, 3 sensors at 1200 mmInformation only
Relative HumidityTwo wire Vaisala HMW40UCenter of room, 3 sensors at 1200 mmTo measure test room relative humidity and to inform the control of the humidifier and de-humidifier
Air-conditionerDaikin split systemSouth east cornerTo heat or cool the room
Humidifier6 L Air Humidifier Ultrasonic Cool Mist Steam Nebulizer Diffuser Purifier ESouth east cornerTo provide additional water vapor to the test room air
De-humidifierBreville The Smart Dry DehumidifierCenter of roomTo remove water vapor from the test room air
Data AcquisitionDatataker DT500 with Channel expansion module To continuously collect measured room temperature and relative humidity data
RelaySolid stateRelay boardTo control and switch humidifier and de-humidifier operation with alarm programming code
Silicone DC relays South east wall connected to air-conditionerTo control and switch heating and cooling with switch alarm programming code
Table 2. Summary of testing parameters.
ParameterAt IBP, LaboratoryAt UTAS
DishesRound glass dish (80 × 200 mm)Round glass dish (60 × 195 mm)
Air space 20 mm20 mm
Average barometric pressure933.26 hPa1030.5 hPa
Water vapor permeability of air2.12 × 10−10 kg/(m·s·Pa)1.92 × 10−10 kg/(m·s·Pa)
Table 3. Water vapor diffusion properties measured at IBP.
Wet cup @ 23°C 93/50% Test @IBP Germany
SpecimenMean thickness d (m)Area m2Mass of specimen (g)Water vapour flux g = G/A in kg/(s*m2)Water vapour permeance W = g/dp in kg/(s*m2*Pa)Water vapour resistance Z = 1/W in (s*m2*Pa)/kgWater vapour resistance factor µDiffusion-equivalent air layer thickness Sd (m)
TA10.000820.02937.403.53 × 10−62.68 × 10−93.74 × 10871.860.0590
TA20.000800.02907.313.44 × 10−62.61 × 10−93.83 × 10876.170.0610
TA30.000840.02877.822.84 × 10−62.15 × 10−94.65 × 10893.840.0790
Mean value0.000820.02907.513.27 × 10−62.48 × 10−94.07 × 10880.620.0663
Standard deviation0.000020.00030.273.77 × 10−72.86 × 10−105.01 × 10811.650.0110
Dry cup @ 23°C 3/50% Test @IBP Germany
SpecimenMean thickness d (m)Area m2Mass of specimen (g)Water vapour flux g = G/A in kg/(s*m2)Water vapour permeance W = g/dp in kg/(s*m2*Pa)Water vapour resistance Z = 1/W in (s*m2*Pa)/kgWater vapour resistance factor µDiffusion-equivalent air layer thickness Sd (m)
TA40.000790.02847.274.06 × 10−63.08 × 10−93.25 × 10862.180.0490
TA50.000810.02817.094.24 × 10−63.21 × 10−93.11 × 10857.040.0460
TA60.000820.02787.563.95 × 10−62.99 × 10−93.34 × 10861.630.0510
Mean value0.000810.02817.304.08 × 10−63.09 × 10−93.24 × 10860.280.0487
Standard deviation1.53 × 10−50.00030.241.44 × 10−71.09 × 10−101.13 × 1072.820.0025
Table 4. Water vapor diffusion properties measured at UTAS.
Wet cup @ 23 °C 93/50% Test @University of Tasmania, Australia
SpecimenMean thickness d (m)Area (m2)Mass of specimen grammes (g)Water vapour flux g = G/A in kg/(s*m2)Water vapour permeance W = g/dp in kg/(s*m2*Pa)Water vapour resistance Z = 1/W in (s*m2*Pa)/kgWater vapour resistance factor µDiffusion-equivalent air layer thickness Sd (m)
TA10.0008190.02757.053.08 × 10−62.33 × 10−94.28 × 10876.020.0623
TA20.0007940.02666.953.03 × 10−62.30 × 10−94.35 × 10880.090.0636
TA30.0007840.02607.213.98 × 10−63.01 × 10−93.32 × 10855.760.0437
Mean0.0007990.02677.073.36 × 10−62.55 × 10−93.99 × 10870.620.0565
Standard deviation1.80 × 10−50.000760.131148775.32 × 10−74.03 × 10−105.78 × 10713.030.0111
Dry cup @ 23 °C 3/50% Test @University of Tasmania, Australia
SpecimenMean thicknessd (m)Area m2Mass of specimen grammes (g)Water vapour flux g = G/A in kg/(s*m2)Water vapour permeance = g/dp in kg/(s*m2*Pa)Water vapour resistance Z = 1/W in (s*m2*Pa)/kgWater vapour resistance factor µDiffusion-equivalent air layer thickness Sd (m)
TA40.0008240.02757.433.34 × 10−62.76 × 10−93.62 × 10860.990.0503
TA50.0008040.02787.403.55 × 10−62.94 × 10−93.40 × 10857.150.0459
TA60.0008050.02757.173.40 × 10−62.82 × 10−93.55 × 10860.810.0490
Mean0.0008110.02767.333.43 × 10−62.83 × 10−93.52 × 10859.650.0484
Standard deviation1.13 × 10−50.0001607280.1422439221.11 × 10−79.28 × 10−111.13 × 10702.170.0023
Table 5. Inter-laboratory comparison of the ANOVA result for the resistance factor (μ) of wet-cup test.
Water Vapour Resistance Factor (µ)
Anova: Single Factor
SUMMARY
GroupsCountSumAverageVarianceStandard deviation GroupsCountSumAverageVarianceStandard deviation
Wet-cup test IBP3241.8780.62333135.654211.64706973 Dry-cup test IBP 3180.8560.283337.9650332.822239064
Wet-cup test UTAS3211.8770.62333169.830213.03189293 Dry-cup test UTAS3178.95459.651334.6856052.164625911
ANOVA ANOVA
Source of VariationSSdfMSFp-valueF critSource of VariationSSdfMSFp-valueF crit
Between Groups15011500.9820470.3777898067.708647Between Groups0.59913610.5991360.094720.773619567.708647
Within Groups610.96894152.7422 Within Groups25.3012846.325319
Total760.96895 Total25.900415
Table 6. Inter-laboratory comparison of the ANOVA result for the diffusion-equivalent air layer thickness Sd(m) of dry-cup test.
Diffusion-Equivalent Air Layer Thickness Sd(m)
Anova: Single Factor
SUMMARY
GroupsCountSumAverageVarianceStandard deviation GroupsCountSumAverageVarianceStandard deviation
Wet-cup test IBP 30.1990.0663330.0001210.011015141 Dry-cup test IBP30.1460.0486676.33 × 10−60.002516611
Wet-cup test UTAS30.16960.0565330.0001240.011132984 Dry-cup test UTAS30.145150.0483835.08 × 10−60.00225407
ANOVA ANOVA
Source of VariationSSdfMSFp-valueF critSource of VariationSSdfMSFp-valueF crit
Between Groups0.00014410.0001441.1746730.3394034547.708647Between Groups1.20 × 10−711.2 × 10−70.021099510.8915337157.708647
Within Groups0.00049140.000123 Within Groups2.28 × 10−545.70 × 10⁻⁶
Total0.0006355 Total2.29 × 10−55
Publisher’s Note: MDPI stays neutral with regard to jurisdictional claims in published maps and institutional affiliations.

