1. Introduction
Modern gear unit designs are being developed with an aim to increase working pressure [
1,
2,
3], while reducing energy-consumption [
4], efficiency pulsation, dynamic loads [
5], mass [
6] and noise emissions to the environment [
7]. Increasing the efficiencies of pumps, whose power may be as high as several tens of kilowatts, entails not only lower operating costs, but also, indirectly, reduced carbon dioxide emissions to the environment. Working pressures in a hydraulic system have a significant influence on the efficiency of the entire installation [
2]. The currently designed hydrostatically driven machines and devices demonstrate a trend for increasing the discharge pressures of displacement pumps while reducing the flow rate of the working medium [
8]. The flow velocity of the working fluid significantly influences the losses observed in the ducts, as well as in the hydraulic and fastening elements. The energy-consumption of a system is also significantly influenced by the total efficiency of a displacement unit [
9,
10,
11,
12,
13]. Total pump efficiency describes the relationship between the output (hydraulic) power
Nh and the input (mechanical) power
Nm or is defined by the product of the volumetric efficiency
ηv and the hydromechanical efficiency
ηhm.
The mechanical (input) power
Nm is defined as the product of the torque
M and the rotational speed
ω of the drive motor coupled to the gear pump.
The output (hydraulic) power
Nh is transmitted to the hydraulic drive system by a pump. It depends on the oil flow through the outlet hole
Qrz and the pressure increase Δ
p. The pressure rise Δ
p is a subtraction between the outlet pressure and the inlet pressure.
The above equation clearly shows that the power transmitted to the hydraulic system
Nh is influenced by the actual capacity
Qrz. The actual capacity
Qrz directly depends on the volumetric efficiency
ηv. The volumetric efficiency
ηv defines the internal hermeticity of the pump and is defined as the relationship between the actual capacity
Qrz and the theoretical capacity
Qt. The parameter Δ
Q defines real volumetric losses occurring in each pump [
7]. The level of these losses mostly depends on the types of gaps characteristic of a particular pump design [
2].
In theory, the hydromechanical efficiency of displacement pumps is defined as the relationship between the theoretical moment
Mt and the actual moment
Mrz [
7].
The above relationship indicates that the value of the actual moment Mrz which should be applied to the shaft of the driven unit is greater than the value of the theoretical moment Mt by a certain value of losses ΔM which occur in each pump. Therefore, the variable ΔM describes a certain moment of hydromechanical losses caused by the losses related to friction forces in the working liquid as well as by mechanical losses occurring in the bearings of the engaged gear surfaces and in the gears interacting with the bodies of slide bearings and with the body of the pump.
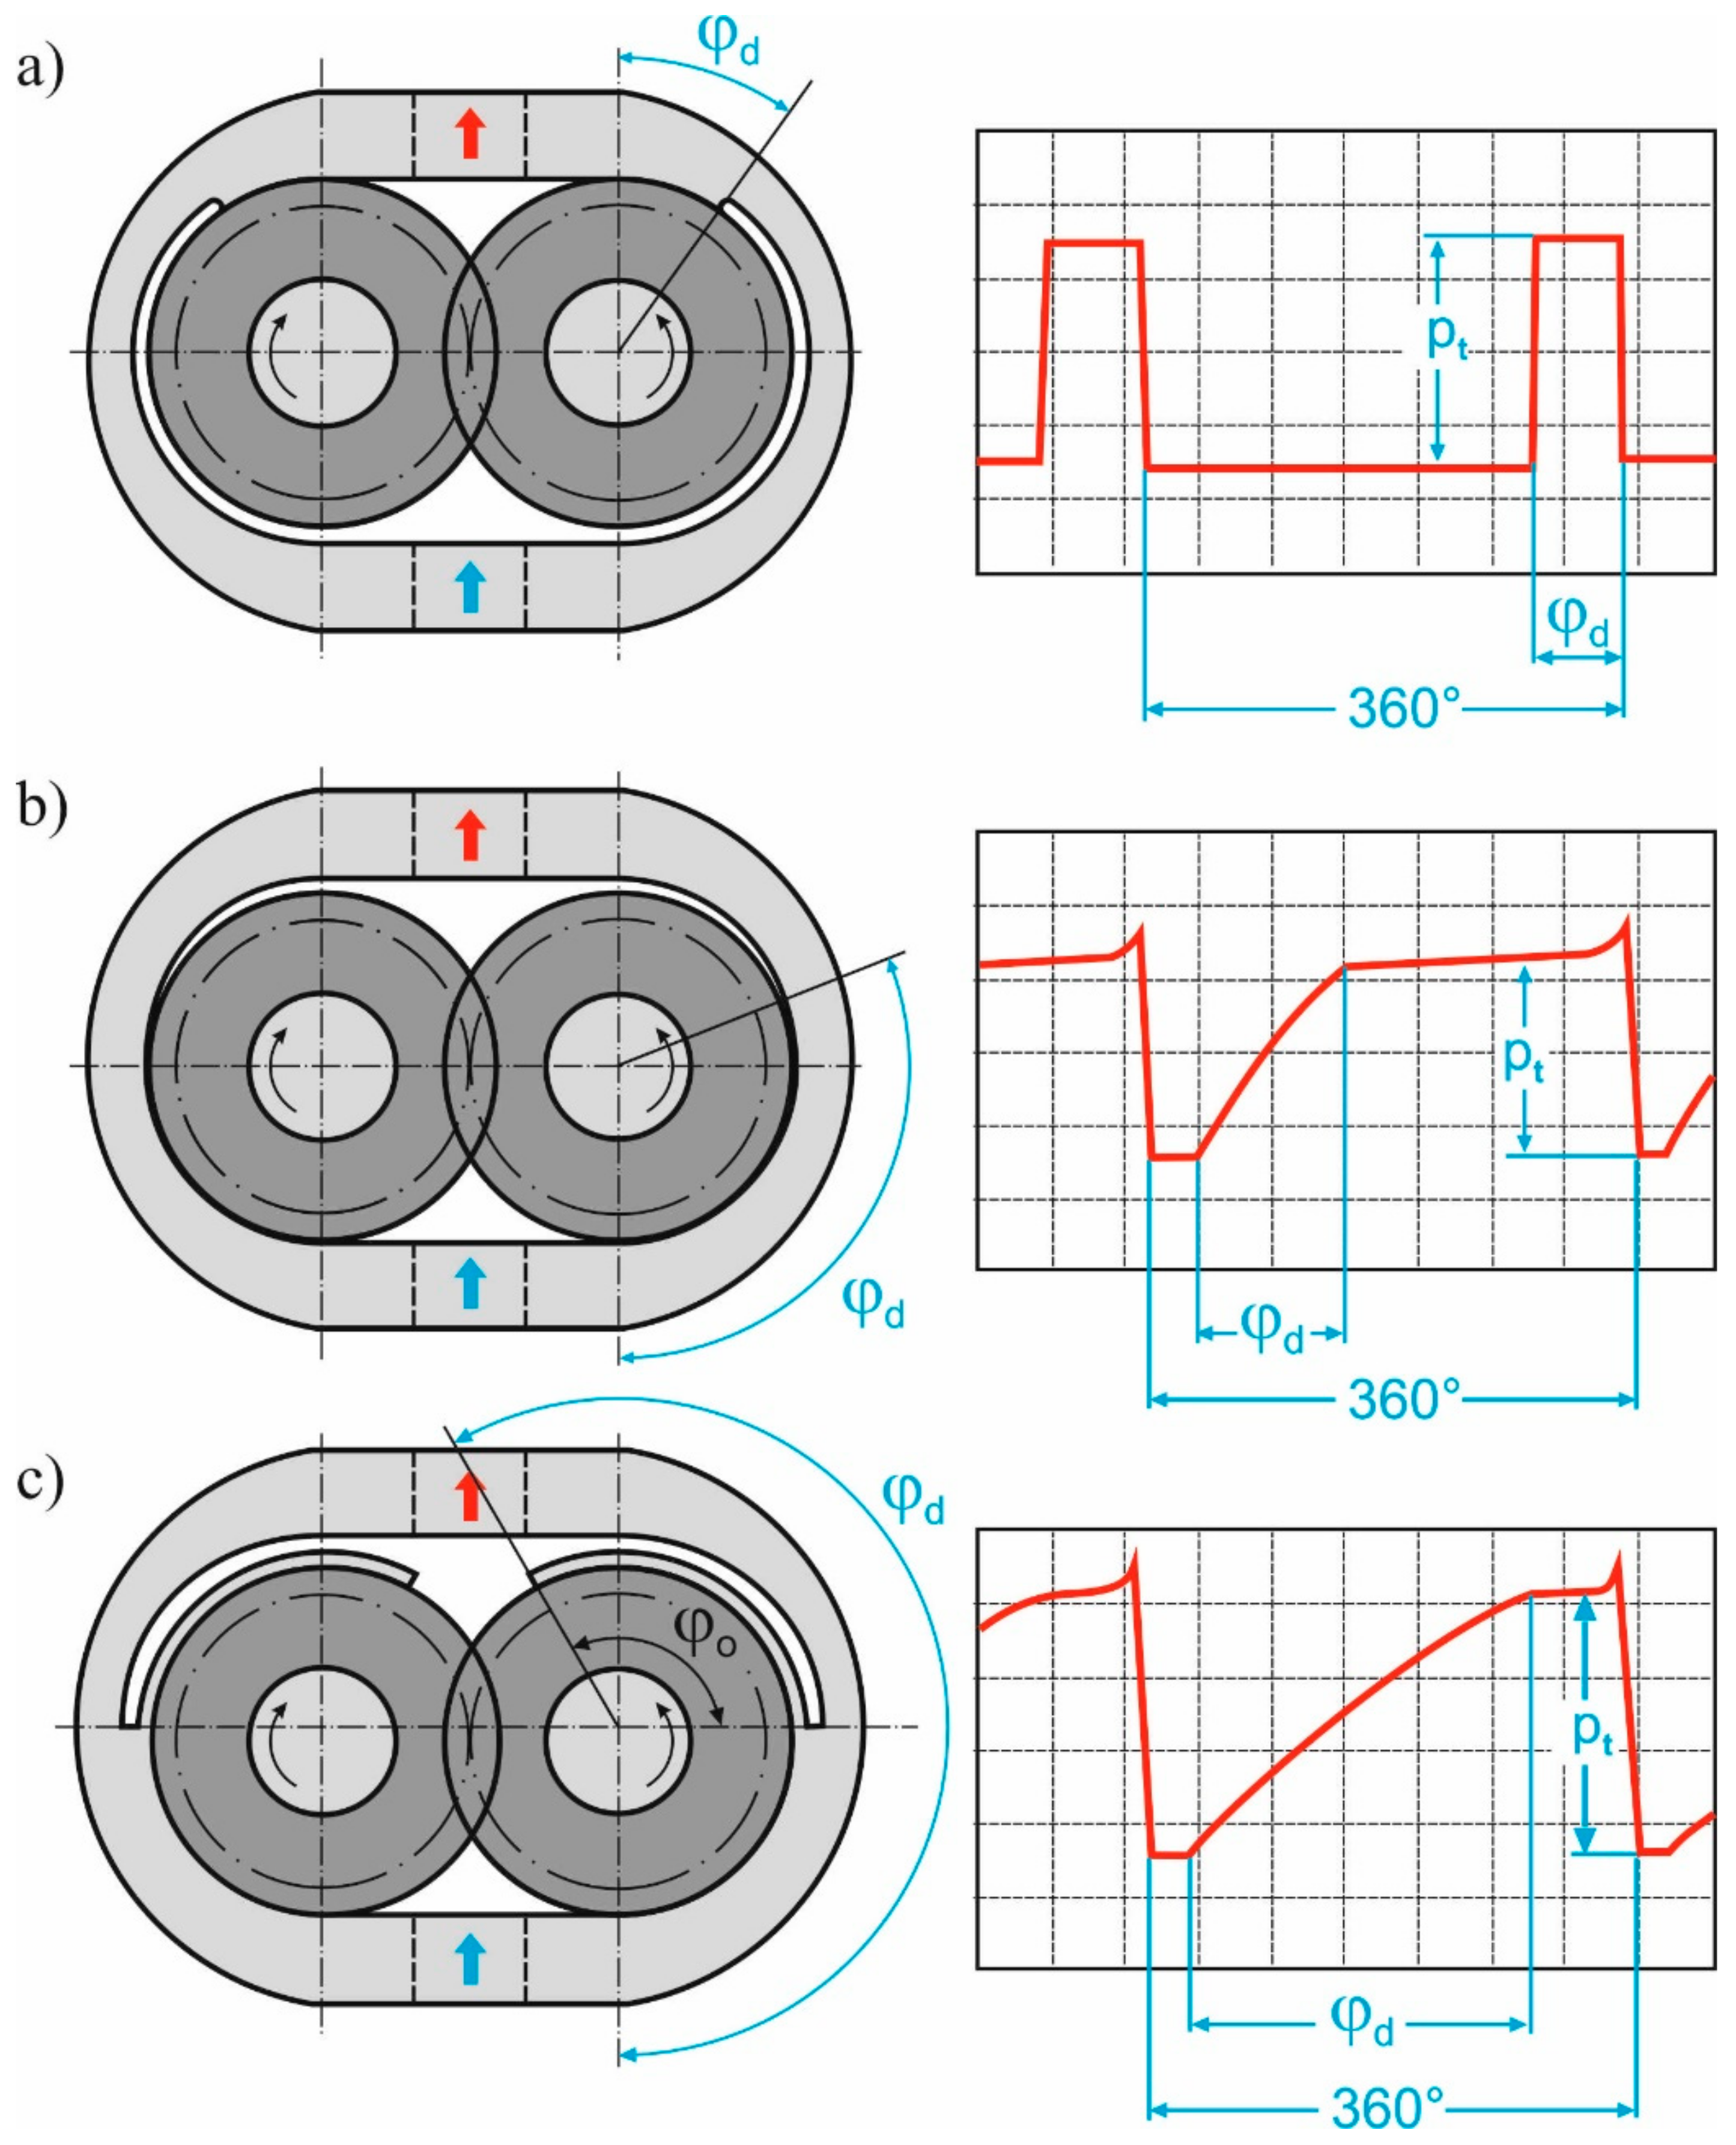
In modern designs, radial backlash is compensated by using circumferential compensation (
Figure 1a) or by providing additional sealing on the suction zone (
Figure 1b) as a result of pushing the gears under the influence of hydrostatic pressure [
14,
15]. In such case, the pushing of the gears towards the suction side within the bearing backlash causes a sickle-shaped gap to be formed on the pressure side (
Figure 1b). Meanwhile, as the pump is wearing in, the material on the suction side in the pump body is “milled” by the gears. In typical pumps, the milling depth is approximately 0.1 mm. As a result, the sickle-shaped gap in its widest point and with allowance for the measurement tolerance between the gear circumference and the body sump diameter is approximately 0.15 mm. The formation of this gap limits the distance at which pressure increases along the circumference. In effect, gear pumps with additional sealing provide a discharge pressure of 30 MPa over a short distance. By taking into consideration the criterion of internal hermeticity it is possible to observe that the greatest volumetric efficiency is obtained in the case of units with the smallest gap width but the greatest gap length. In units with circumferential backlash compensation, the value of the backlash along the circumference of the engaged gears and the pump body is constant and does not depend on the shift of the gears towards the suction side. The circumferential compensation is always pressed against the teeth points by the pressure provided through narrow channels diverging from the pressure channel. By improving the sealing with the circumferential backlash compensation (
Figure 1c), it is possible to increase the discharge pressure to 40 MPa.
The advantages of using circumferential compensation are most clearly observed in the case of low rotational speeds [
1].
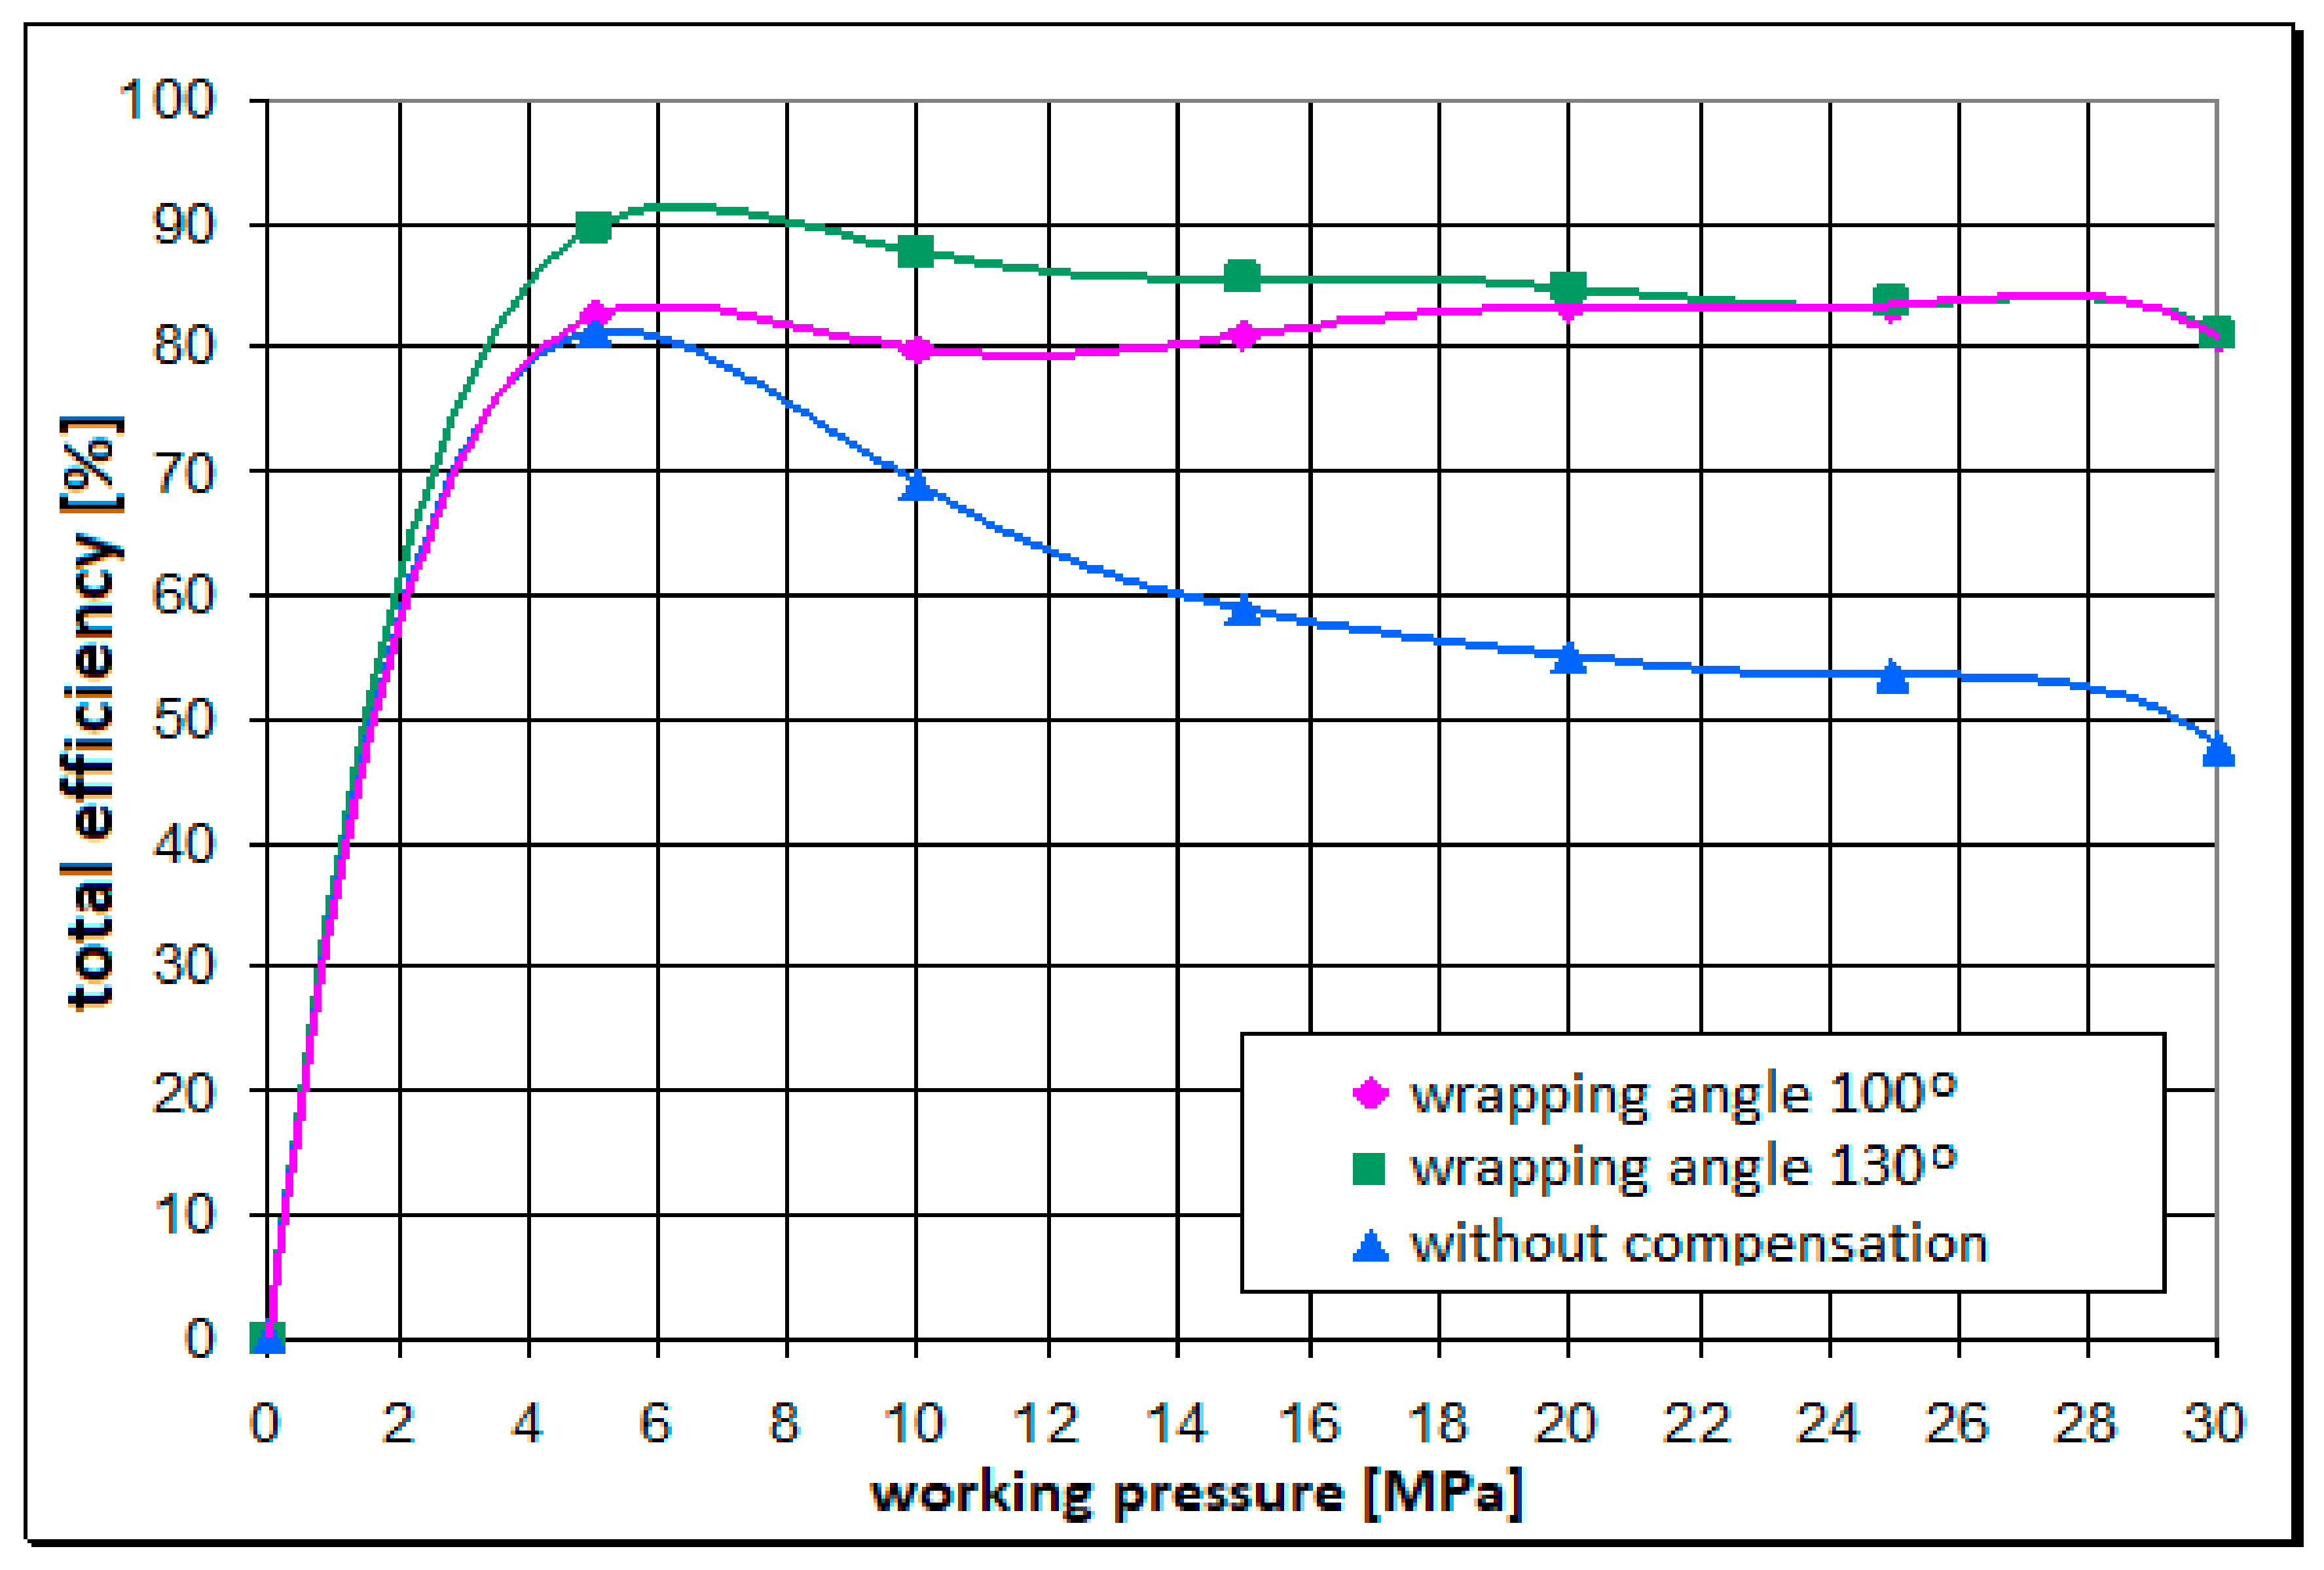
Figure 2 and
Figure 3 show selected characteristics of the volumetric and total efficiencies for the conventional pump and for the prototypes with circumferential compensation. The aspect of how circumferential compensation influences pump efficiency depending on the discharge pressure and the rotational speed is discussed in more detail in [
1,
2].
Analyzing the static characteristics of the volumetric efficiency ηv, we can see that the amount of hydraulic energy Nh transferred to the hydraulic system by the pump depends on its internal tightness (represented by the caulk angle).
This implies that the gear pumps with circumferential backlash compensation transfer, for the analyzed rotational speed and working pressures above 20 MPa, from 35% to 40% more energy than in the case of conventional solutions without circumferential backlash compensation (
Figure 2). Regarding the input (mechanical) power
Nm, the overall pump efficiency
ηc for pressures above 20 MPa is higher than 30–35% (
Figure 3). The value of the increase in total efficiency
ηc is lower than the value of the increase in volumetric efficiency
ηv due to higher hydraulic and mechanical losses resulting from caulk. The above results were obtained for prototype pumps with circumferential backlash compensation. Currently, pump manufacturers do not offer pumps with circumferential backlash compensation. These pumps are at the prototyping stage. The prototype research is focused on ensuring high durability of the compensating elements.
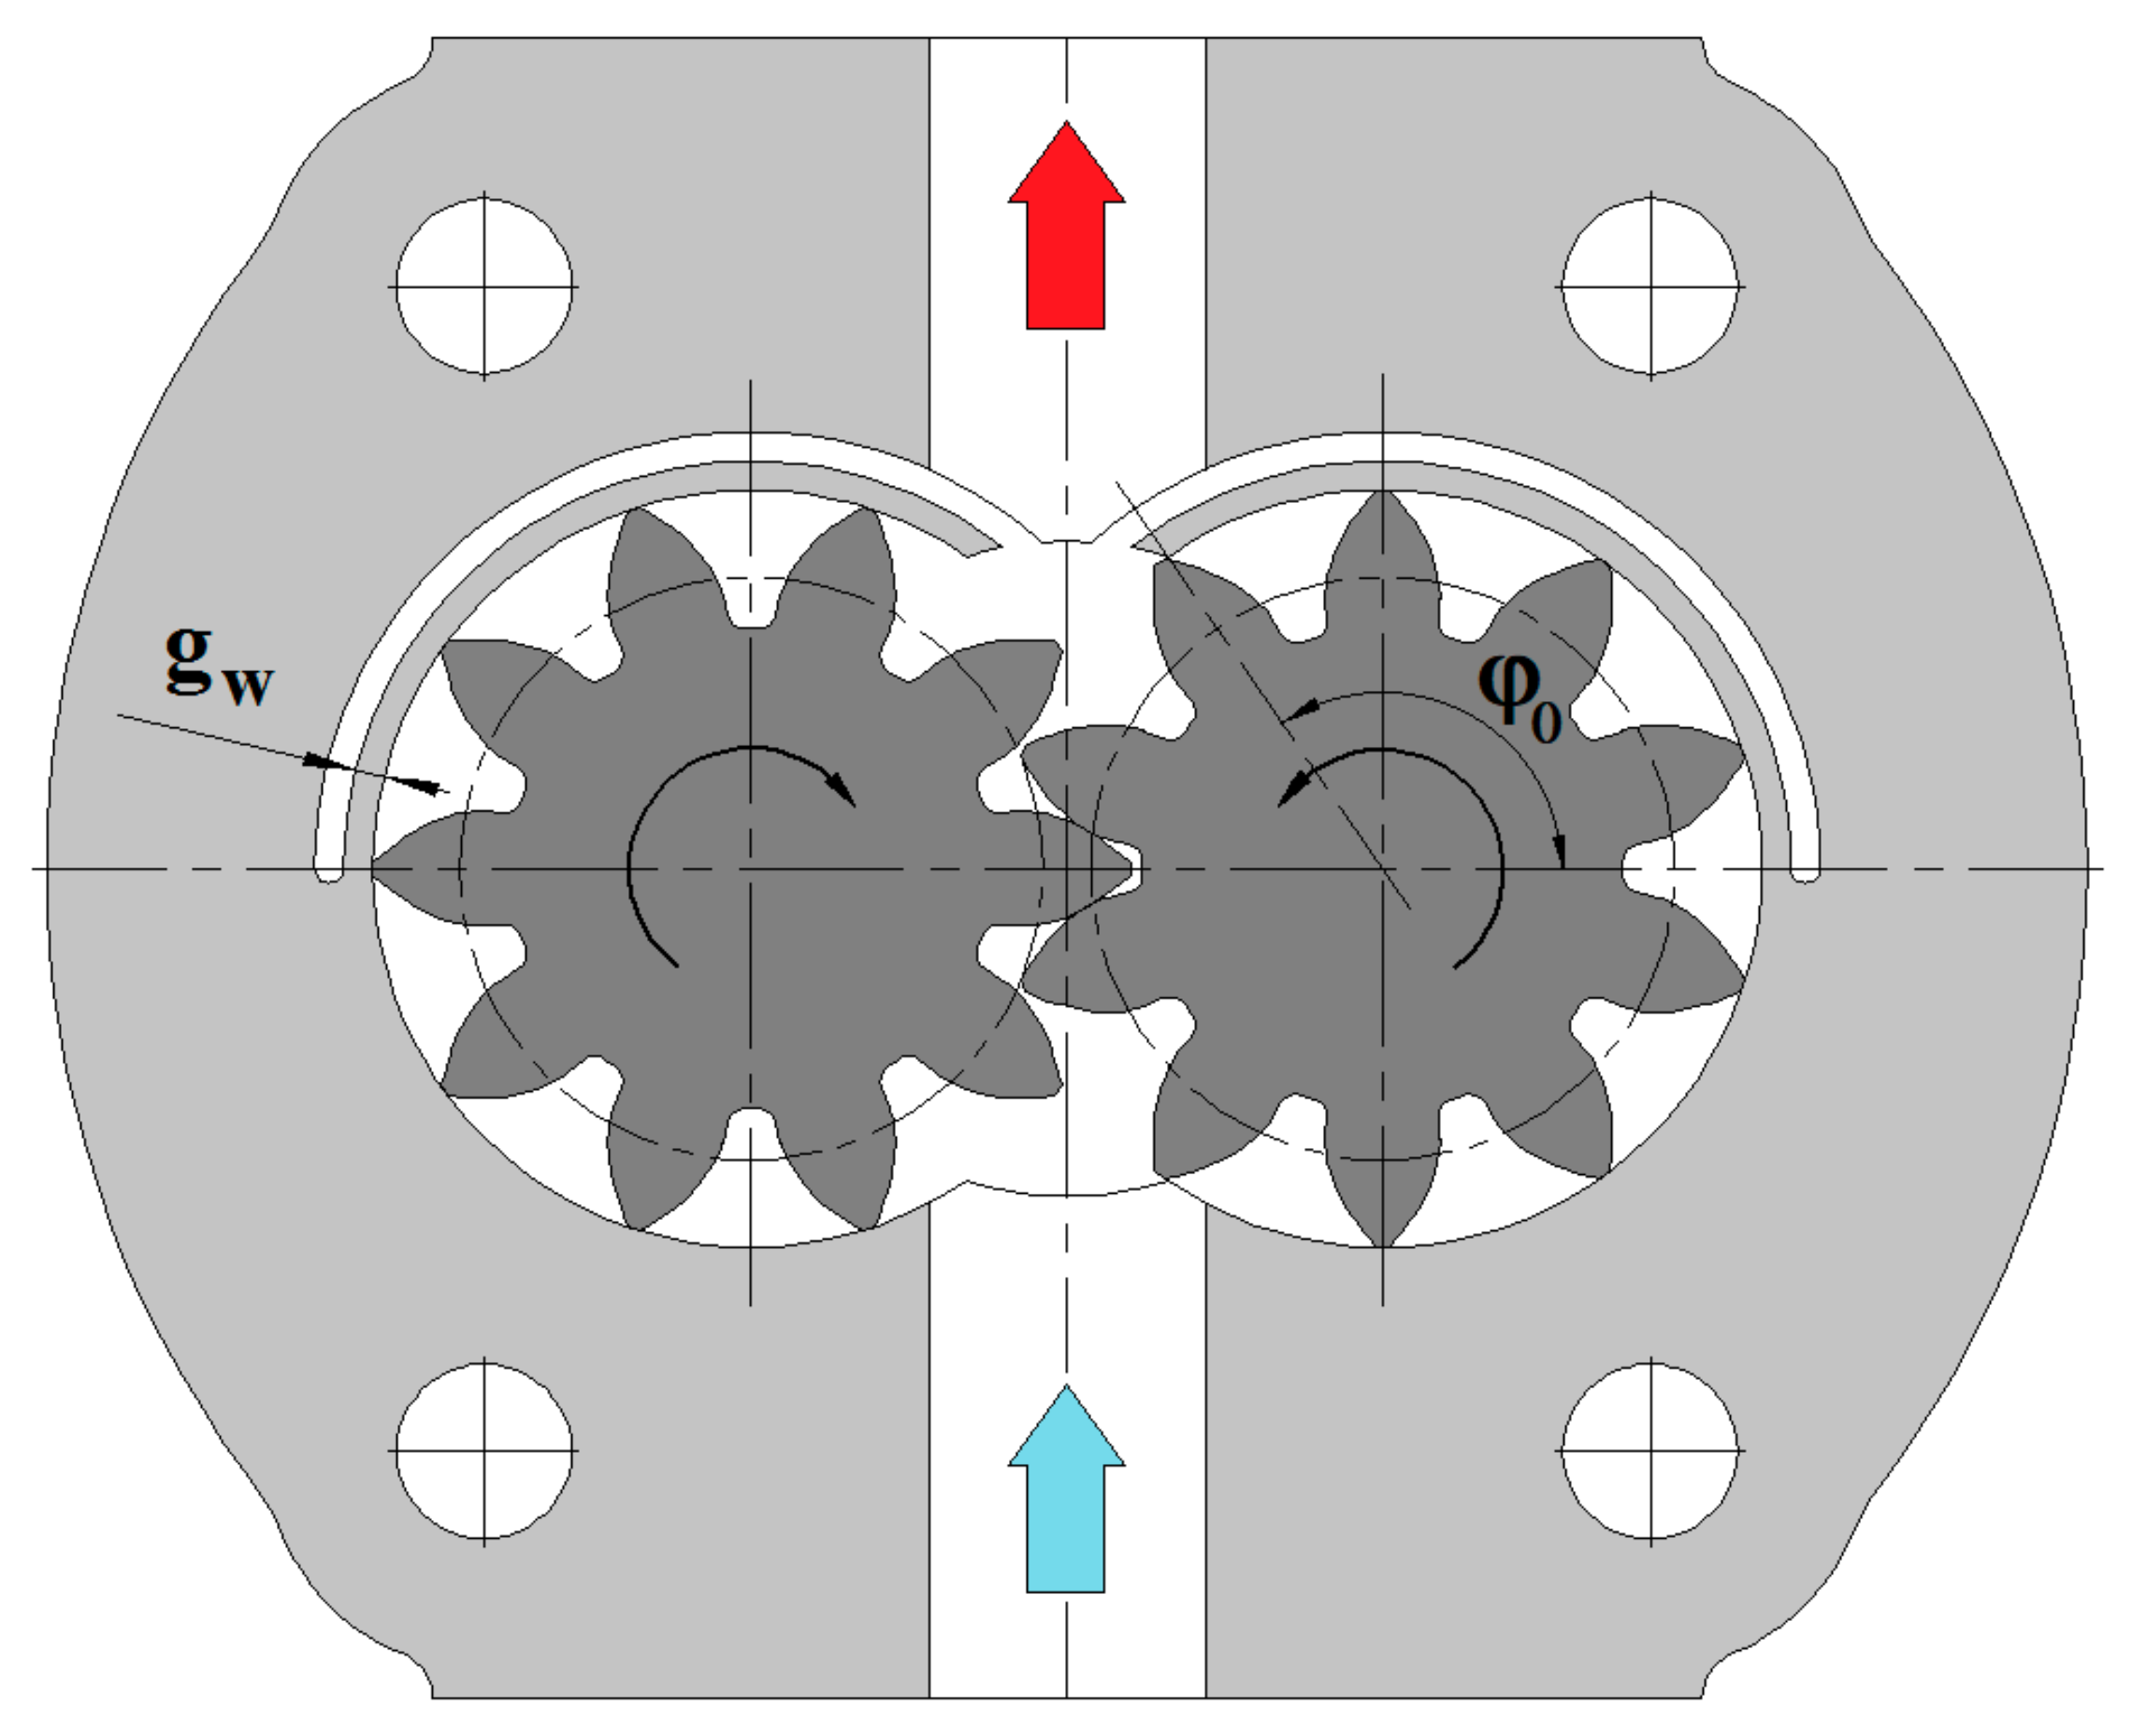
The first design of a pump with circumferential backlash compensation was based on Patent Application No. P.397539 (Patent No. PL221099 [
16]). In this design, the lip was initially assumed to have a constant thickness
gw of 2 mm and wrapping angle
φo = 130° (see
Figure 4). The patent application was submitted to the patent office at the turn of 2011 and 2012. The first prototype was tested in 2012. Previously, the idea of caulking around the entire circumference of a gear pump was not analyzed and tested. The first design and construction solution with a new type of compensation was created.
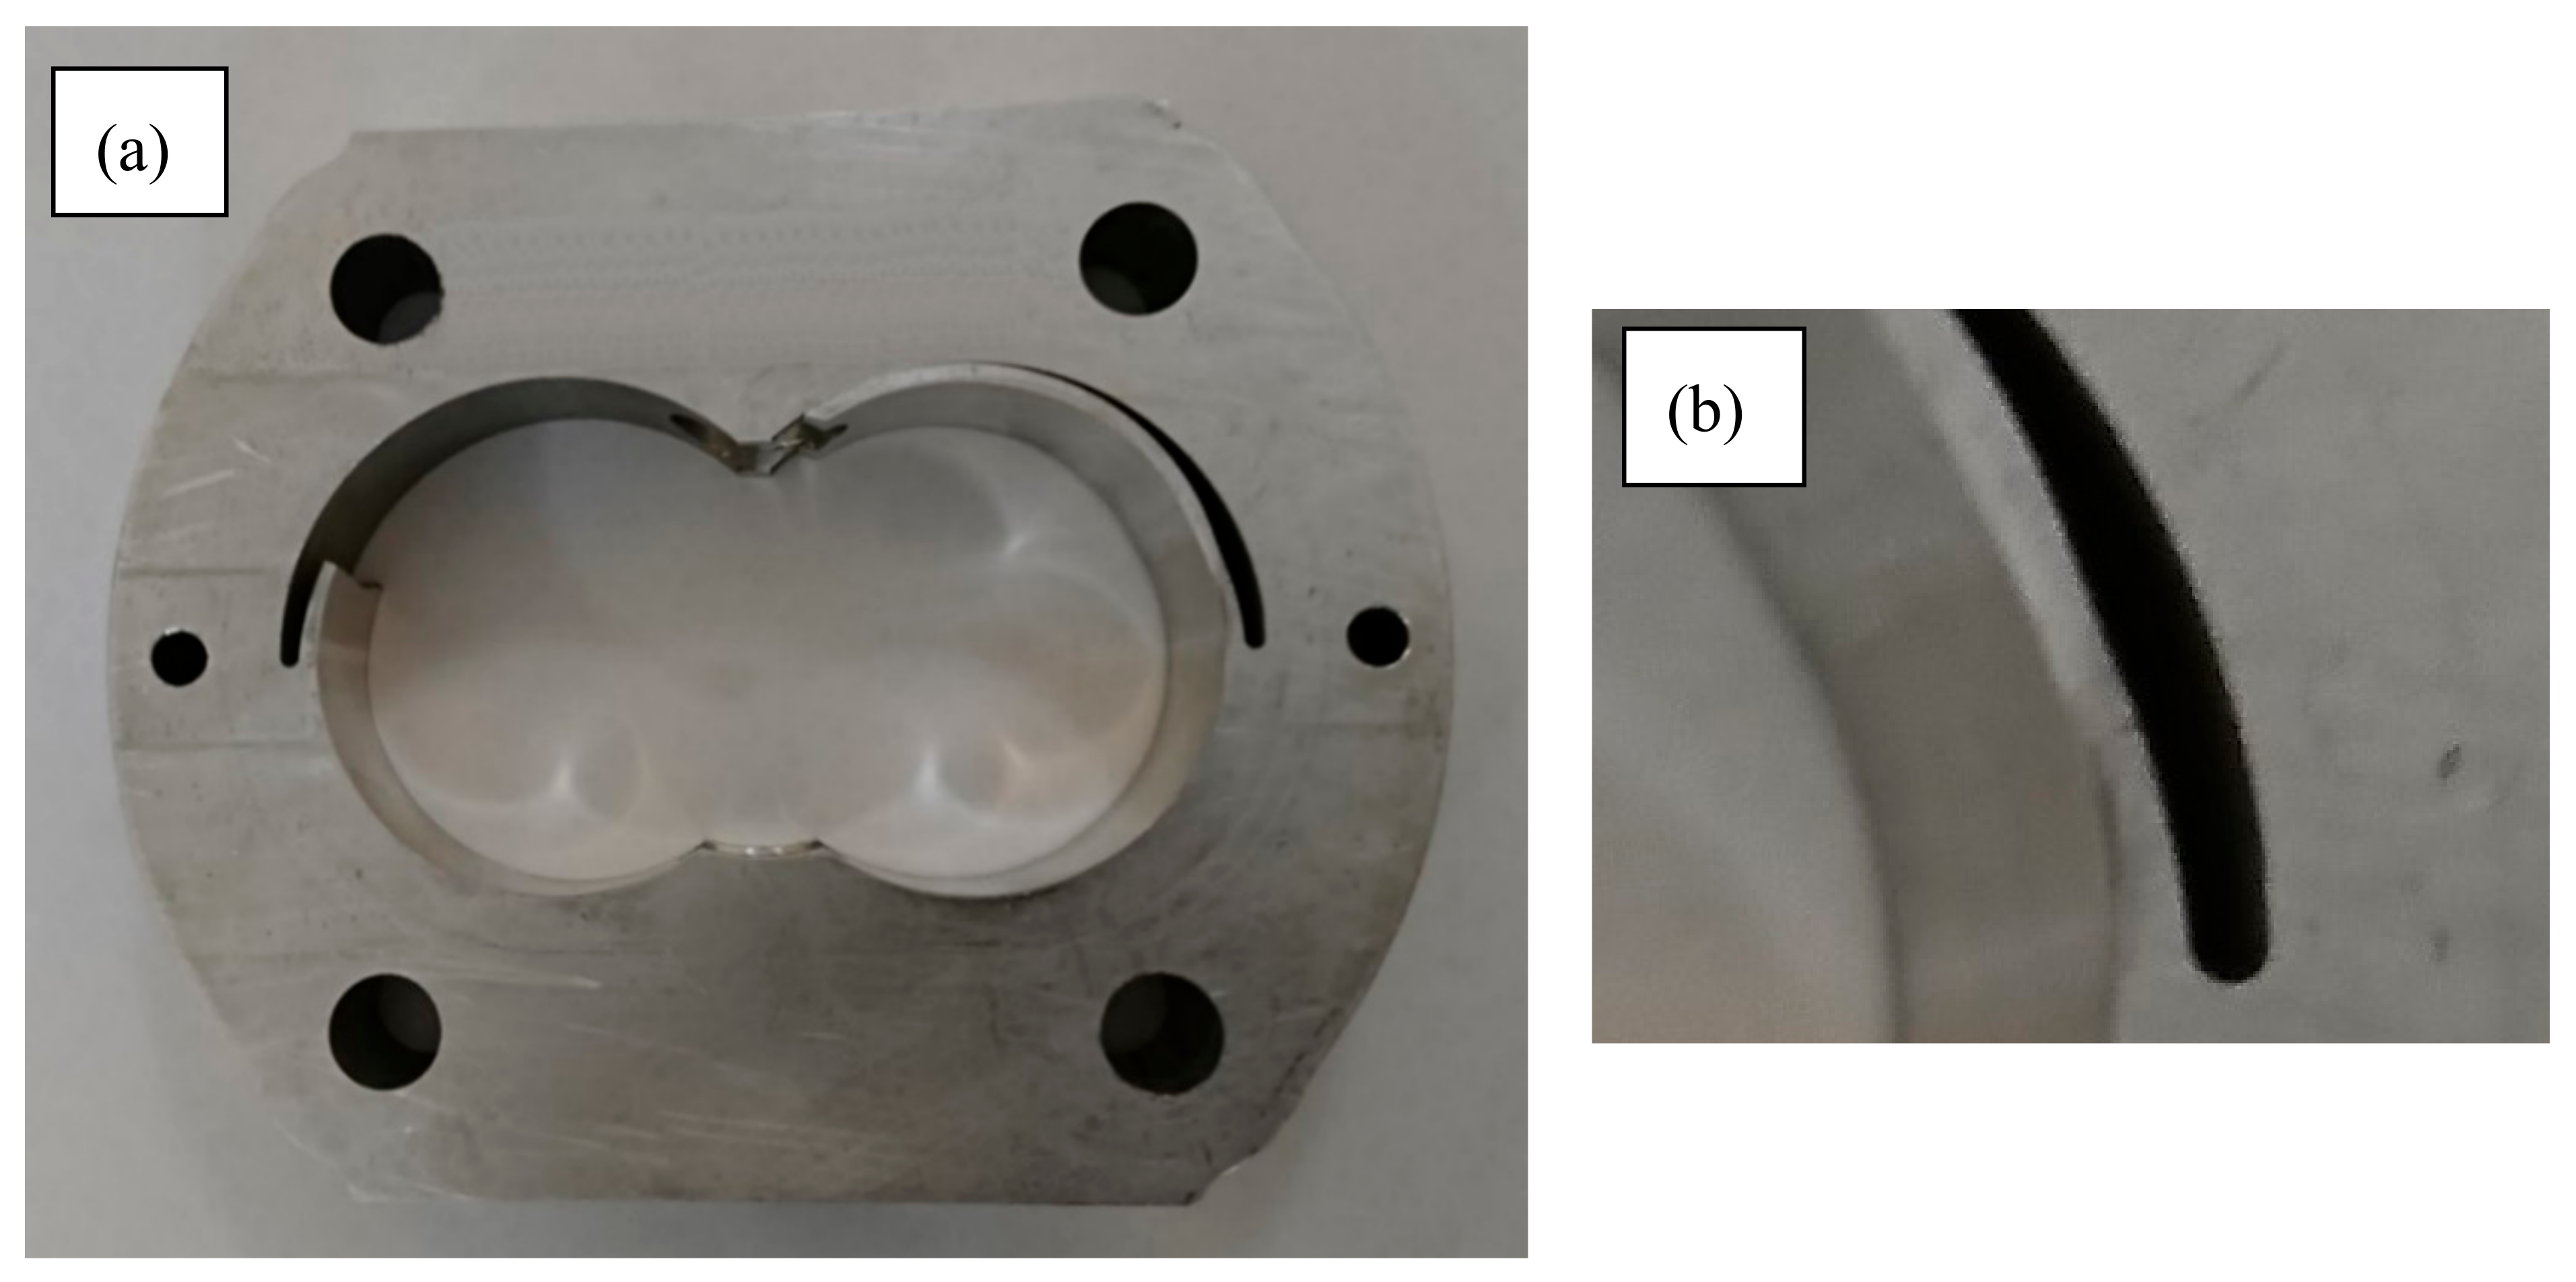
The results of the first operating tests of the prototype pump with the circumferential backlash compensation lip demonstrated that the lip is an element particularly prone to damage (see
Figure 5), which is manifested in the form of lip fractures in the restraint cross-section (or in the vicinity of this section) [
2].
Circumferential compensation is a pioneering solution. Nevertheless, it is still necessary to carry out the strength and durability research works aimed at implementing the concept of circumferential clearance compensation into production. A properly designed lip should foremost have a precise and optimally selected thickness, which on the one hand provides the required elasticity and flexibility, and on the other hand—has sufficient strength to resist fatigue stresses.
Some of the first research efforts at identifying the minimum thickness of the lip are described in [
1,
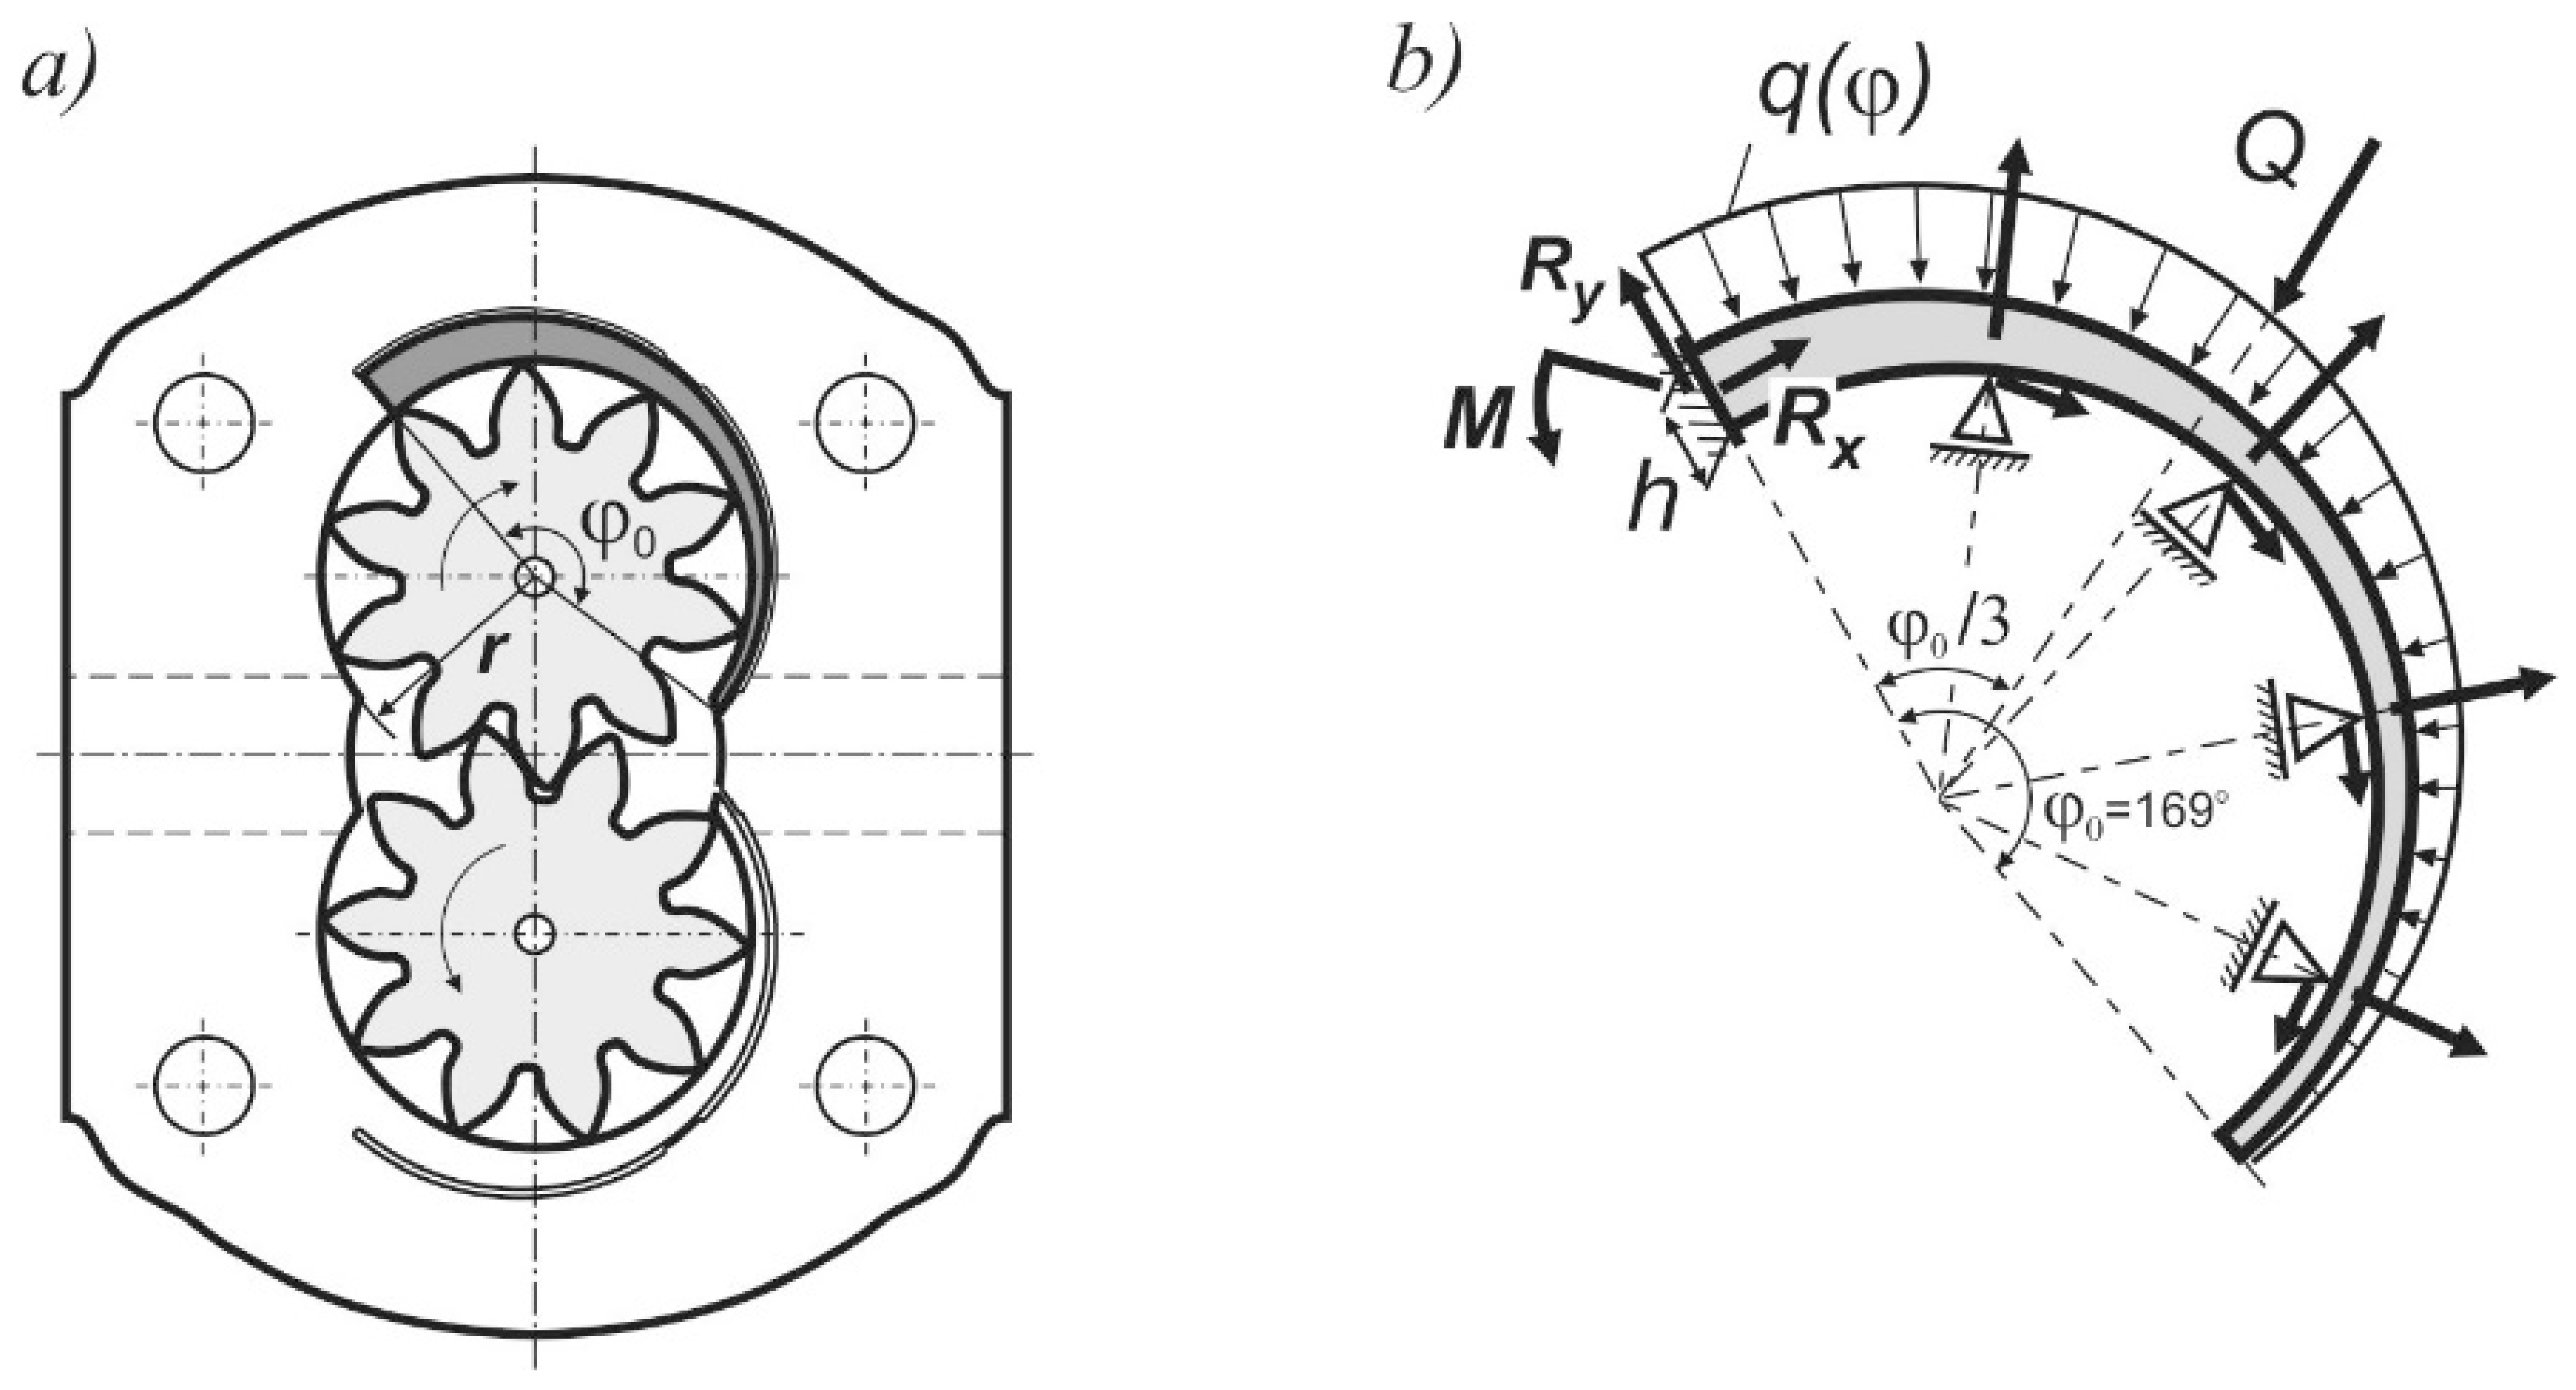
3], with the latter publication including calculations for a static system which corresponds to the most unfavorable position of the pump gear with respect to the lip: when the cross-section of the lip restraint overlaps with the centerline of one of the gear teeth (
Figure 6a). In this case, the lip is subjected to a continuous load
q(φ), which is the resultant force of the pressure differences on the two sides of the lip (
Figure 6b). Three different lip lengths were considered, which corresponded to the length of a circular segment with the wrapping angle
φ equal to 102°, 132° and 169°, with the lip being in contact with three, four and five teeth, respectively. As described in [
15], the result of calculations for a pump with an internal radius
r = 26.00 mm provided the respective values of the required lip thickness (
hmin) at 2.98, 3.26 and 3.99 mm.
Further works on the design model of the pump prototype led to a small modification of this geometry: the radius r of the internal chamber was reduced to 24.90 mm. In the next step, this modification allowed the lip thickness to be increased on the basis of an assumption that the profile of the rod used for the pump body has a uniform geometry. This assumption was also held in this work.
2. Materials and Methods
From the perspective of the mechanical system, the lip may be viewed as a cantilever beam which is subjected to pressure pulsations and it is therefore under a continuous fatigue-type load acting on both of its sides
The compensation lip of the design discussed here is particularly prone to fatigue stresses, as it includes a notch which significantly increases local stress values. The theoretical foundations for fatigue-related calculations in such designs were laid by Thum, Buchman and Peterson in the 1930s [
17,
18]. According to the equations used in this theory, the so-called fatigue strength is calculated by reducing the strength defined for the structure operated under static conditions. For this purpose, an assumption is made about a number of coefficients which influence the strength of the structure operated under variable load, including the size of the structure, the shape coefficient, the condition of the surface, and the notch sensitivity of the material. By following this method and assuming an adequate model for the variable load on the compensation lip, its minimum thickness can be calculated.
2.1. Resultant Values of Static Calculations
By following the calculations presented in publication [
3], with the lip wrapping angle
φo = 169°, the internal chamber radius
r = 24.9 mm and the maximum pressure in the compensation chamber
p = 40 MPa, the following values of internal forces in the restraint cross-section are obtained:
N = 1132.4 N,
T = 4721.6 N and
Mg = 29,197.0 Nmm (
Figure 7).
The strength criterion to permissible normal stresses (tensile or compressive) must allow for the tensile (compressive) and bending stresses simultaneously exerted in the outermost fibers:
Modifying Equation (6) with the values of normal and bending stresses described with equations:
allows an equation describing the minimum beam thickness value
hmin:
From Equation (8), the actual cross-section width
b = 26.3 mm and the permissible stress value
kr = 490 MPa allow the calculation of the minimum cross-section height for static loads:
The reduced stresses in individual layers of the cross-section are (according to the Huber hypothesis):
The greatest effort is then observed in the extreme fibers (a–b and e–f) and these should be the objects of the fatigue calculations.
As already mentioned, the research described in [
3] focused only on the calculations and static tests of the lip. This article is the first to focus on dynamic tests which determine the fatigue strength of the lip.
2.2. Calculations of Minimum Beam Thickness Using the Fatigue Strength Condition
The fatigue cycle in the cross-section considered here is a purely pulsating load, and the normal stress changes due to the compressive force and the bending moment are not shifted in phase.
Based on [
19], the AW7075 material used for the pump body was assumed to have the following mechanical properties: tensile strength
Rm = 550 MPa, bending yield strength
Reg = 220 MPa, reversed bending fatigue strength
Zgo = 150 MPa, pulsating bending fatigue strength
Zgj = 240 MPa and permissible tensile/compressive pulsating stresses
krj =
kcj = 80 ÷ 100 MPa. The base number of cycles used to determine the fatigue properties was
nz = 10
8 cycles.
As the ratio between the compressive stresses and the bending stresses for layers
a–b and
e–f is
σc/
σg max < 0.05, the load state was simplified to the form of only cyclically variable pulsating bending (
Figure 8). In this case, the maximum stresses in the outermost fibers on the tensioned side and on the compressed side are caused only by the bending moment
Mg and have equal absolute values, while the mean stresses and the stress amplitude are equal at:
σm =
σa =
σmax/2.
The lip restraint cross-section should assume the presence of a notch with a fillet radius
ρ = 0.75 mm (
Figure 8). Due to the notch and a substantial surface roughness, the location most prone to fatigue failure is the
e–f layer.
The fatigue strength calculations aimed at determining the required cross-section height involve verifying the following three conditions:
- (a)
The maximum stresses in the cross-section must not exceed the values permitted in the pulsating bending fatigue (kgj):
where:
Mg = 29167 Nmm,
b = 26.1 mm,
kgj = krj = 80 MPa.
From this equation the minimum cross-section height
hz min can therefore be approximately calculated as:
- (b)
The fatigue factor of safety xz, being related to the bending fatigue strength and the coefficients defining the conditions of the structure in fatigue operation, must not be smaller than its required value xzw. For the load increase of σa/σm = const, this condition is expressed with the following equation:
- (c)
The fatigue factor of safety xz must also satisfy the relationship for yield strength during fatigue bending:
The required safety factor
xzw found in Equations (15) and (16) is calculated as a product of four individual component coefficients
xi. Their values in the case considered here are:
x1 = 1.5—reliability factor,
x2 = 1.10—object importance coefficient,
x3 = 1.10—material uniformity coefficient,
x4 = 1.00—dimension preservation coefficient. In addition, the value of factor
xzw is increased by 40% for light alloys and non-ferrous metals (in accordance with the recommendations in [
19]), and its final value is:
xzw = 1.15 1.10 1.10 1.00 1.40 = 1.95.
The values of the remaining coefficients were obtained in the following manner:
- -
Cross-section area coefficient:
γ = 1.45—was determined from graph 8.5 in [
19] for shaft diameter
d = 17.5 mm, equivalent to the area of the lip restraint cross-section:
b ×
h = 26.3 × 9.12 = 240 cm
2. This coefficient is defined as the relationship between the fatigue strength of the specimen (or element) having a certain cross-sectional diameter and the strength of the standard specimen, made of the same material and having a diameter of 7–10 mm. In the case of elements having their cross-sectional shape different than circular, the applied graphs are based on the equivalent cross-sectional area.
- -
Fatigue stress concentration factor:
β = 1.81—was calculated from the equation:
β = β
k·β
p= [1 +
η(
αk − 1)]β
p, where β
k is the value of fatigue strength reduction due to the notch and is defined on the basis of the relationship between the fatigue strength of the unnotched specimen and the fatigue strength of the notched specimen, and β
k—the surface factor—is defined as the relationship between the strength of the polished specimen and the strength of the machined element. Factor β
k was calculated on the basis of: notch sensitivity coefficient η = 0.53—assumed on the basis of Graph 8.10 in [
19] for notch radius ρ = 0.75 mm; stress-concentration factor αk = 2.03—assumed as per Graph 8.31 in [
19], for relationships ρ/h = 0.75/9.12 ≈ 0.08 and a/h = 18.00/9.12 ≈ 2.0, where a = 18 mm is the pump body wall thickness (
Figure 8); surface factor βp = 1.17—assumed on the basis of Graph 3.53 in [
20] for material ultimate strength Rm = 550 MPa and surface porosity obtained for a rough environment, which is a method equivalent to the electrical discharge drilling of the compensation chamber.
Conditions (12) and (13), with the assumption that σm = σa = σmax/2, may serve to define the maximum stresses possible in the lip restraint cross-section:
The permissible stress must be assumed to be the lower of the two values:
σmax = 53.6 MPa. If Condition (9) is applied, the new minimum lip height is obtained:
The obtained value
hz min is significantly different than the value defined in Equation (14), and has an influence on the value of factor β used in Equations (15) and (16). Its recalculation leads to:
β = 1.76, and its application in Equations (15) and (16) allows the value of the permissible stress in the cross-section to be recalculated, leading to:
σmax = 55.0 MPa. If Relationship (13) is used for this value, the final result is:
In this case, the difference of hz min between the results obtained from Equations (19) and (20) is sufficiently small for its influence to be neglected in the stress concentration factor β.
An identical method was used to calculate the minimum thicknesses for smaller length lips, i.e., in the cases of the wrapping angles 132° and 102°. The results of these calculations are shown in
Table 1.
3. Experimental Tests
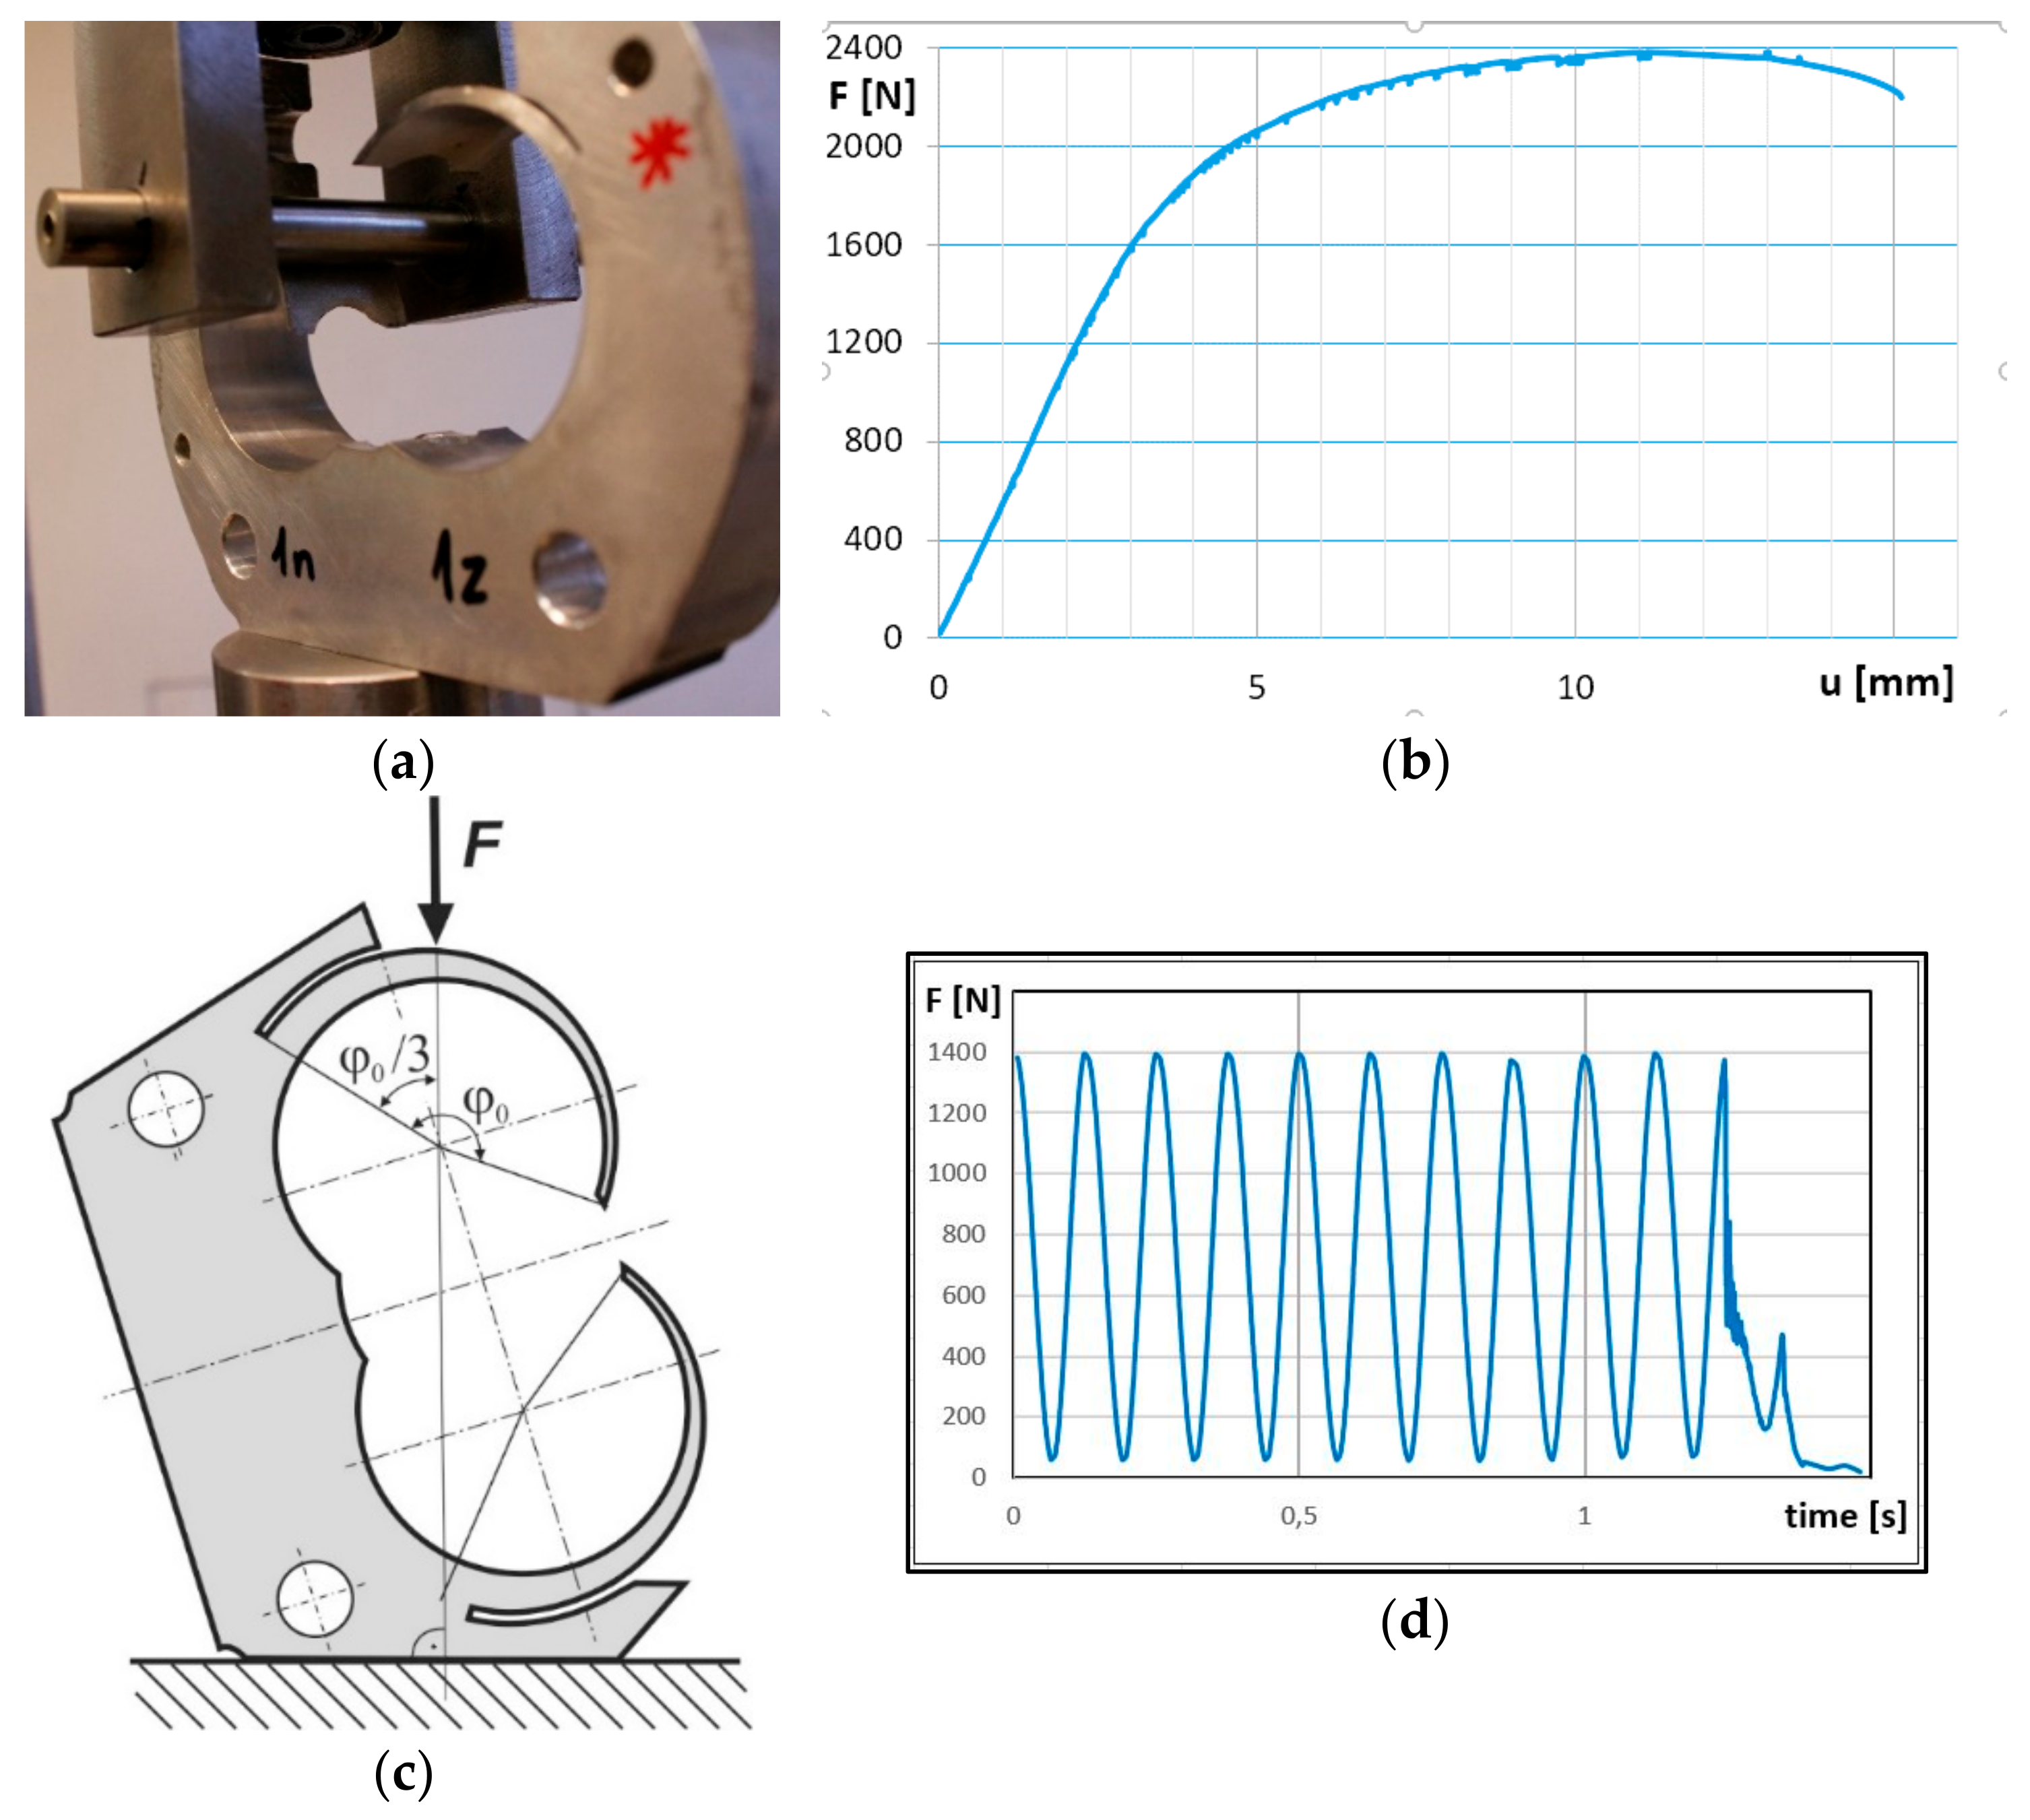
The minimum lip thickness calculated in the previous section required confirmation in experimental tests. The tests were performed for three pump bodies with lips which have wrapping angles equal to 132°, in which one lip was subjected to static tests, and the other—to fatigue tests. The static tests were aimed at defining the load—displacement diagram during lip bending (
Figure 9a,b). The values of maximum forces are shown in
Table 2.
The fatigue tests were performed for pump bodies prepared in a manner to allow loading of the lip in accordance with the assumed theoretical model, i.e., with a concentrated force applied at an angular distance of 1/3 of the total lip span angle (
Figure 9c). In this case, the concentrated force
F applied at this point corresponds to the resultant force
Q shown in
Figure 6. The force used was sinusoidally variable at a frequency
f = 10 Hz. Each test series was performed until the number N = 2.5 × 10⁶ of cycles was reached (which corresponds to 2.5 times the number of cycles used in the pump wear margin tests) or until lip failure. If failure did not occur, the subsequent test was performed at a maximum force
Fz max being 50 or 100 N greater than the force applied in the previous test. The minimum force
Fz min in the cycle was always 50 N. The tests were performed on a universal MTS 858.02 Mini Bionix machine which has an operating range of 0–15 kN.
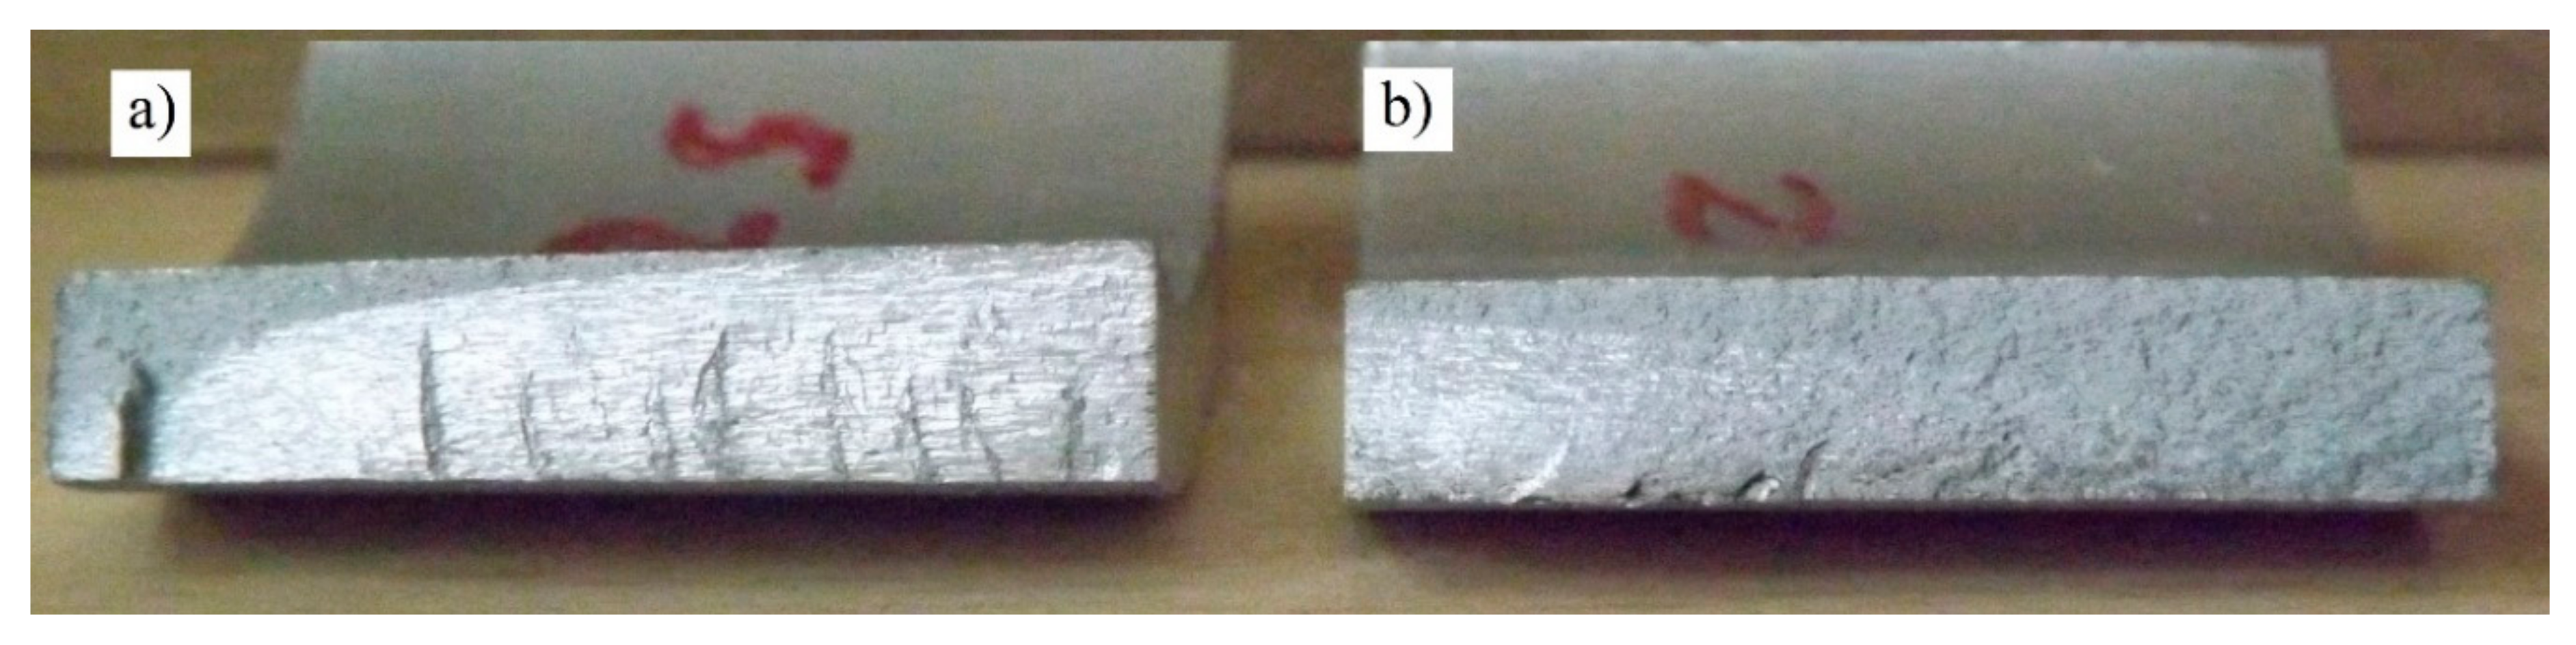
In the case of both the first and the second lip (test specimens from Pump Bodies 1 and 2), the fatigue tests were performed with the use of a slightly beveled tool (shaft) pressing against the lip in order to demonstrate the influence of an imprecise lip construction, which results in non-uniform load distribution on the lip surface. The test results are provided in
Table 2. The stresses were calculated with allowance solely for the bending moment, as was the case in prior theoretical calculations. Specimen 2 had already failed in the first test.
In the case of Specimen 3, the bevel in the tool was removed so as to provide uniform load distribution on the lip surface. This specimen failed at force
Fz max = 1400 N, and its failure diagram is shown in
Figure 9d. The last test, in which failure did not occur, was performed at
Fz max = 1300 N.
The effect of the non-uniform load can be observed on the lip fracture—it takes the form of a unilaterally developed fatigue cracks and surface slips in the immediate fracture zone (
Figure 10).
4. Conclusions
The theoretical calculations discussed in
Section 2 allowed the identification of the theoretical minimum restraint thickness for the compensation lip. For pumps with lips having lengths defined by the wrapping angle
φ equal to 102°, 132° and 169°, these thickness values were 10.70, 10.82 and 11.00 mm, respectively. It should be noted, however, that the calculations were performed for the material fatigue failure parameters for the base number of cycles being
nz = 10
8, while at an expected lower number of cycles (e.g., the number used in wear margin tests of rotary pumps, i.e.,
nz = 10
6 cycles), the values of fatigue strength or permissible stresses are higher and thus the calculated
hz min would be lower. However, precise identification of
hz min for the cycle number
nz = 2 × 10
6 is not possible, as no data are available on the values of the relevant properties of the AW7075 alloy for this number of cycles.
The experimental tests discussed in
Section 3 demonstrated that at the number of fatigue cycles
nz = 2.5 × 10
6, the actual maximum stresses which the compensating lip of specimen 3 can carry are
σz max = 198 MPa. They are significantly higher than the permissible stress value at fatigue bending (
kgj = krj = 80 MPa) assumed in Equation (8). The safety stress margin is thus
n = σ
z ma/
kgj = 2.47.
The value of the strength safety factor n obtained for the investigated design element is the most important (if not the only important) result of the strength tests. It provides information on whether during its destruction the tested element transferred the stress value assumed as the limit value for the particular material (in this case it is kgj = krj = 80 MPa), and if yes, then how much the value was exceeded. In the case of the presented test results, the limit value was exceeded approximately 2.5 times, and this value clearly indicates that the assumed lip geometry is proper. On the one hand, it allows a sufficient safety margin for the pump operated in actual conditions (for this purpose the factor n should have a value higher or equal to 1.5). On the other hand it does not lead to the adverse consequences of using a lip of excessive thickness if the margin was three times kgj or more (this would entail the need to use pump body walls of greater thickness, and therefore to increase the pump mass and the manufacturing costs).
The lip thickness
h = 5.10 mm can be therefore believed sufficient for a pump life corresponding to the assumed
nz number of fatigue cycles. At lower lip thickness values the lip will fail (see
Figure 5). However, it must be emphasized that any construction inaccuracies related to the shape and dimensions of the lip, and in particular to the lateral dimension of its upper surface, will cause load distribution to be non-uniform and in such case the fatigue strength will radically decrease. This observation is based on the results of fatigue tests for Specimens 1 and 2, which had this type of defect, and which failed under a breaking stress two- or even three-fold smaller than the stress applied to Specimen 3 (see
Table 2). The significantly different results observed in the case of Specimens 1 and 2 also indicate a substantial dispersion of the fatigue test-related results. Importantly, the type of the applied test did not allow the material of the lip to be subjected to plastic necking, which is observed in actual pump operating conditions and which precedes eventual lip failure. This fact also indicates that the actual designs based on the results of these tests should involve an adequately high safety factor (
n > 1.5). In the case of high-pressure pumps, i.e., pumps working at pressures exceeding 30 MPa, integrated lips may also be considered as an alternative [
2,
21,
22]. Structures of this type allow greater loads, as radial forces occurring in opposite lips cancel each other. Another factor affecting the fatigue strength of a beam functioning as a compensation lip is the design-related notch. Its negative influence may be reduced by increasing its radius
ρ (see
Figure 8), e.g., by providing the lip end with a drilled opening which would have a diameter greater than the width of the compensation chamber. Such a solution has an additional positive effect by increasing the smoothness of the surface at the bottom of the notch.
It should also be noted that the obtained results are based on certain geometrical assumptions behind the pump model and the lip load system, as well as on the estimation accuracy for the values of the fatigue coefficients, which have a significant influence on the simplifications in theoretical calculations. More accurate theoretical calculations, allowing for example the prediction of lip life, would require the determination of the crack growth rate equation. Since the lip geometry is complex, it would be necessary to apply numerical calculations for this, as well as derive the dimensionless geometry factor for the lip. It is necessary to calculate the stress intensity range. On the other hand, the experimental studies, due to the observed scatter of the results, require conducting studies on a large number of samples, allowing for statistical processing of the results. Such tests are planned in the next stage of work.


