Biometric Data as Real-Time Measure of Physiological Reactions to Environmental Stimuli in the Built Environment


Abstract
:
1. Introduction
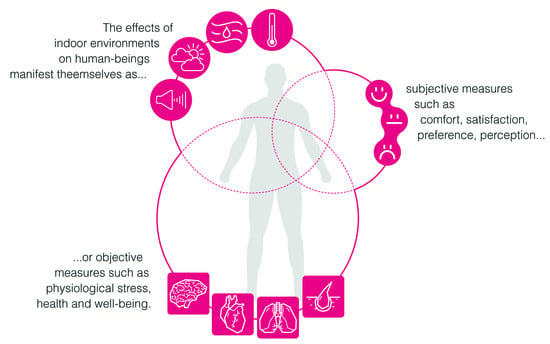
1.1. Measuring Human Wellbeing and Health in Indoor Environments
- Self-selection metrics include preference, acceptance, satisfaction and comfort;
- Performance-based metrics include attention, distractibility, productivity and mental workload;
- Physiological metrics include discomfort and stress.
1.2. Self-Selection Metrics
1.2.1. Preference, Acceptance and Satisfaction
1.2.2. Comfort
1.2.3. Considerations on Self-Selection Metrics
- Indoor comfort and indoor health are related concepts but refer to two essentially different timeframes. While comfort is perceived in an immediate and narrowly defined point in time, potentially changing within hours, minutes or seconds, health is the result of a multitude of actions happening over a much longer lapse of time, and can as such not be assessed by users in the present time but only retrospectively;
- The use of self-selection measures, such as preference, satisfaction and to some degree also comfort, to determine the quality of an environment (often implying also health), is essentially driven by the idea that users are able to distinguish the conditions that are positive from those that are detrimental to their health. This is however not always the case as even in the cases where the long-term health effects of a specific action are known, the choice between an immediate gratification (e.g., smoking) and a delayed gratification (health) is in psychological terms not always obvious [73].
1.3. Performance-Based Metrics
1.3.1. Productivity
1.3.2. Attention and Distraction
1.3.3. Mental Workload
1.3.4. Considerations on Performance-Based Metrics
1.4. Physiological Metrics
1.4.1. Discomfort
1.4.2. Stress
1.4.3. Considerations on Physiological Metrics
1.5. Research Gap
- Review the current state of knowledge in neighboring fields of study that can be of use in the field of building physics;
- Review the current parameters and measures used to describe indoor environments;
- List and assess relevant biosignals highlighting their effectiveness and reliability with regard to stress detection;
- Establish the relationship between the multitude of biosignal features and their corresponding behavior under different environmental conditions;
- Establish reliable biosignal (and multimodal biosignal) indices that reveal the underlying physiological mechanisms of the stress response;
- Discuss existing limits and solutions of the methods reviewed.
2. Materials and Methods
2.1. Methods for Measuring Human Wellbeing and Health in Indoor Environments
2.2. State of Art: Indoor Environmental Quality (IEQ) Parameters
- Threats to human health and wellbeing;
- Variables and sub-parameters;
- Solutions and strategies to improve the specific IEQ parameters and achieve healthy ranges for the indoor conditions;
- Parameter measurements, units in use, methods of measurement, limits to the methods.
2.3. Background Research on Physiological Signatures
2.4. Selection of Biosensing Techniques
3. Results
3.1. Indoor Environmental Parameters
3.1.1. Indoor Air Quality (IAQ)
- Airborne Contaminants
- Polychlorinated biphenyls (PCBs) used in electrical equipment, caulking, paints and surface coatings;
- Chlorinated and brominated flame retardants, used in electronics, furniture, and textiles;
- Pesticides used to control insects, weeds, and other pests in agriculture, lawn maintenance, and the built environment;
- Phthalates used in vinyl, plastics, fragrances, and other products;
- Alkylphenols used in detergents, pesticide formulations, and polystyrene plastics;
- Parabens used to preserve products such as lotions and sunscreens.
- Ventilation Rate
- Humidity
3.1.2. Thermal IEQ
- Definition
- Thermal Comfort Models
3.1.3. Visual IEQ
- Light
- Views
3.1.4. Acoustic IEQ
3.2. Biosignals
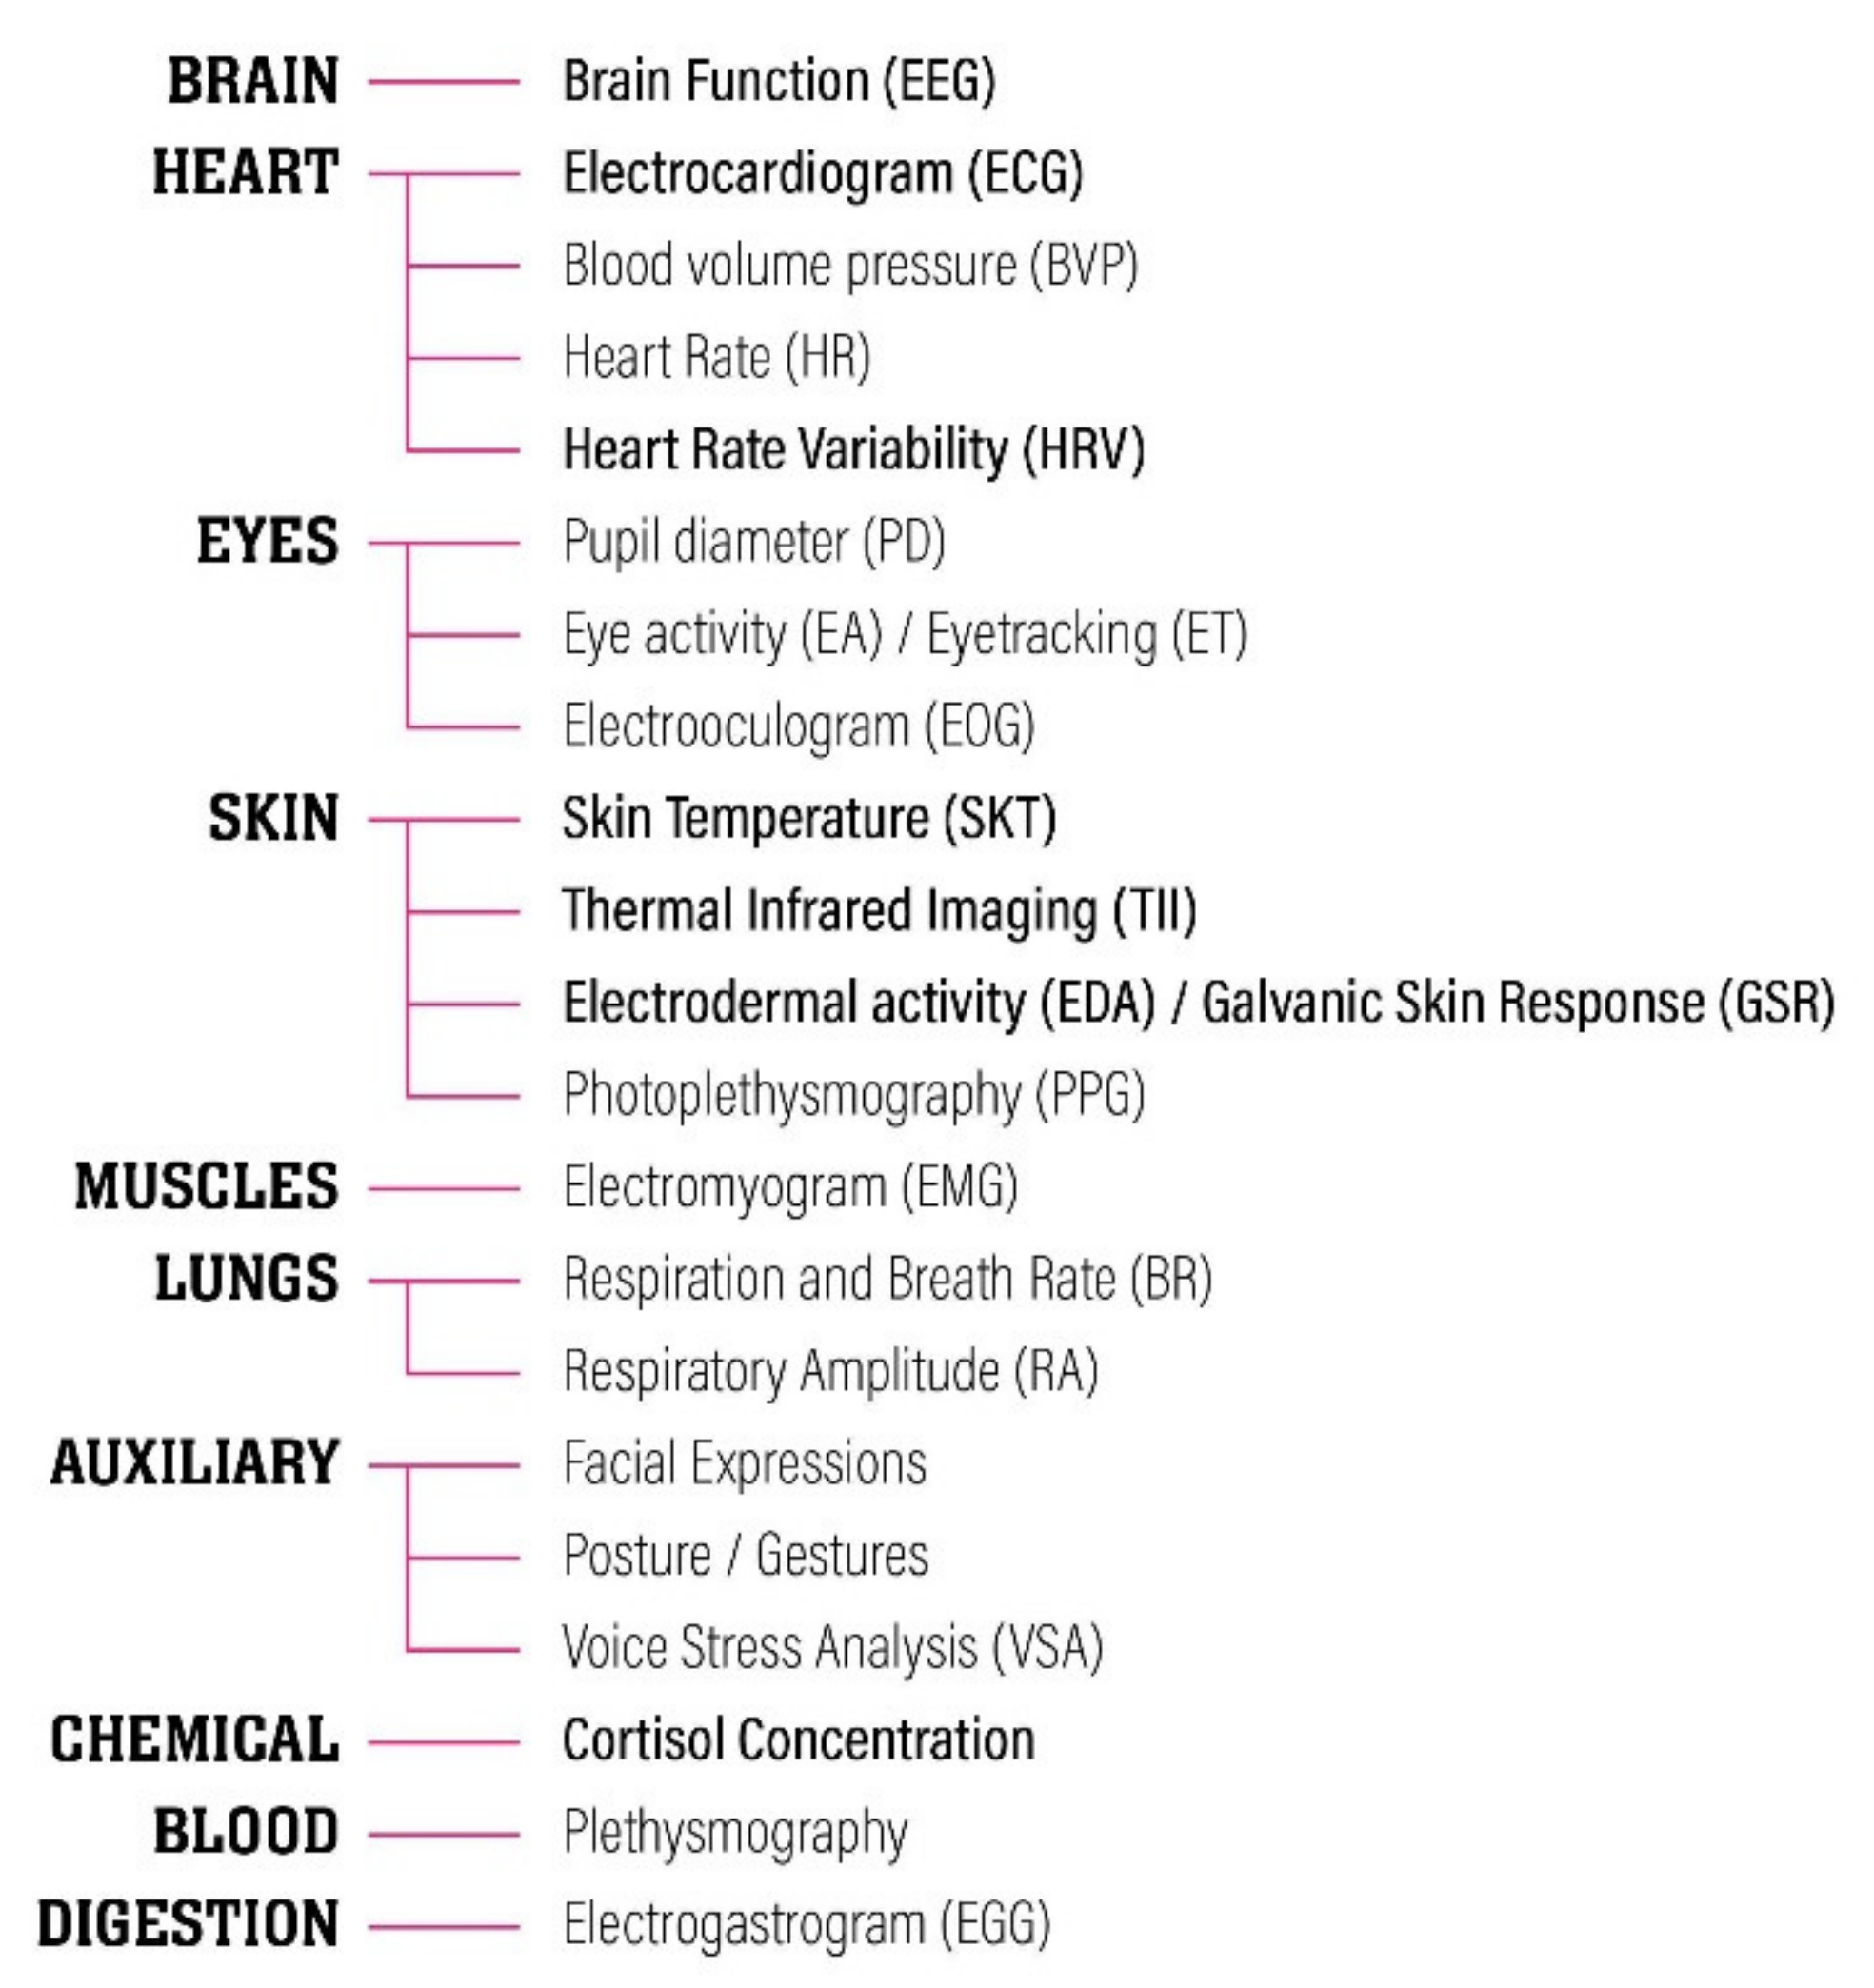
3.2.1. Definitions and Classifications
- Spatial (mono-dimensional biosignals, e.g., electrocardiogram (ECG) associated with heart muscle contractions measures heart activity by detecting changes);
- Temporal (two-dimensional biosignals, e.g., functional magnetic resonance changes associated with blood flow imaging (fMRI, functional magnetic resonance imaging measures brain activity by detecting); or
- Spatio-temporal (three-dimensional biosignals, e.g., a medical ultrasound movement by detecting changes in the reflection of measured surfaces or internal organs structural sound waves on the tissues) records of a biological event [173].
- Bioelectric signals: Bioelectric signals are the most common and well-known biosignals. Bioelectric phenomena have had scientific value for the past 200 years in terms of modern medicine [175]. They convey the electrical activity created by nerve and muscle cells. Well known examples can be listed as electroencephalogram (EEG), electrocardiogram (ECG), electroretinogram (ERG), electrooculogram (EOG), electrogastrogram (EGG), electroneurogram (ENG), electromyogram (EMG), galvanic skin response (GSR) [176].
- Bioimpedance signals: Bioimpedance signals are useful for estimating body composition through the amount of electric impedance passing through the body. Using bioimpedance signals, parameters can be figured such as: body cell mass, extracellular mass, fat-free mass, fat mass or total body water [177,178].
- Biomagnetic signals: Several organs produce weak magnetic fields, as a result of their electric activity. For instance, the source for the magnetocardiogram (MCG) or magnetoencephalogram (MEG) is the electric activity of the cardiac muscle or nerve cells, respectively, as it is the source of the electrocardiogram (ECG) and electroencephalogram (EEG) [175].
- Biomechanical signals: Results from the mechanical functions of the body, such as pressure, tension, motion. Examples can be listed as blood pressure data, human movement data via accelerometer sensors in Parkinson’s disease patients, gait, balance and pose (Parkinson’s disease, mobile applications, fitness). Biomechanical signals are particularly of interest in sports science, or physical rehabilitation processes [179].
- Bioacoustic signals: Several physiological activities make noise and can be captured as acoustic data when amplified. Examples are cardiac sounds (phonocardiography) to examine heart valves’ closure strength and stiffness, recording snoring in order to investigate sleep apnea, listening to respiratory sounds to detect pulmonary disorders. Apart from the medical field, use of bioacoustic data had been an important tool for animal researchers, identifying animal behavioral patterns [180,181].
- Biochemical signals: Provide information about concentration of various chemical agents in the body. Common examples are glucose level data for diabetes control, blood oxygen level data for asthma, obstructive pulmonary disease, or heart and kidney failure detection. Biochemical signals, in general, are deemed as amongst the highest accuracy signals to detect stress levels in the human body, particularly via urine, saliva, or blood samples [182].
- Bio-optical signals: Bio-optical signals are naturally occurring or induced optical functions of the examined biologic system. Examples of use include estimating blood oxygenation by measuring transmitted vs. backscattered light from a tissue, using dye dilution and monitoring the bloodstream to observe cardiac output, or controlling fluorescence characteristics of the amniotic fluid to acquire information about the health of the fetus [171].
3.2.2. Use of Biosignals in the Field of Building Engineering
3.2.3. Limitations
- 1.
- Technical problems
- 2.
- Problems with data acquisition:
- 3.
- Need for self-reporting:
- 4.
- Need for multi-modal biosignals for better insight:
3.2.4. State of the Art
- Brain: Electroencephalogram (EEG)
- Delta (γ): 0.5–4 Hz in frequency. Delta waves are the slowest EEG waves, normally detected during deep and unconscious sleep.
- Theta (θ): 4–8 Hz in frequency. Theta waves are observed during some states of sleep and quiet focus.
- Alpha (α): 8–12 Hz in frequency. Alpha waves originate during periods of relaxation with eyes closed but still awake.
- Beta (β): 12–25 Hz in frequency. Beta waves originate during normal consciousness and active concentration and are associated with increase in alertness and arousal.
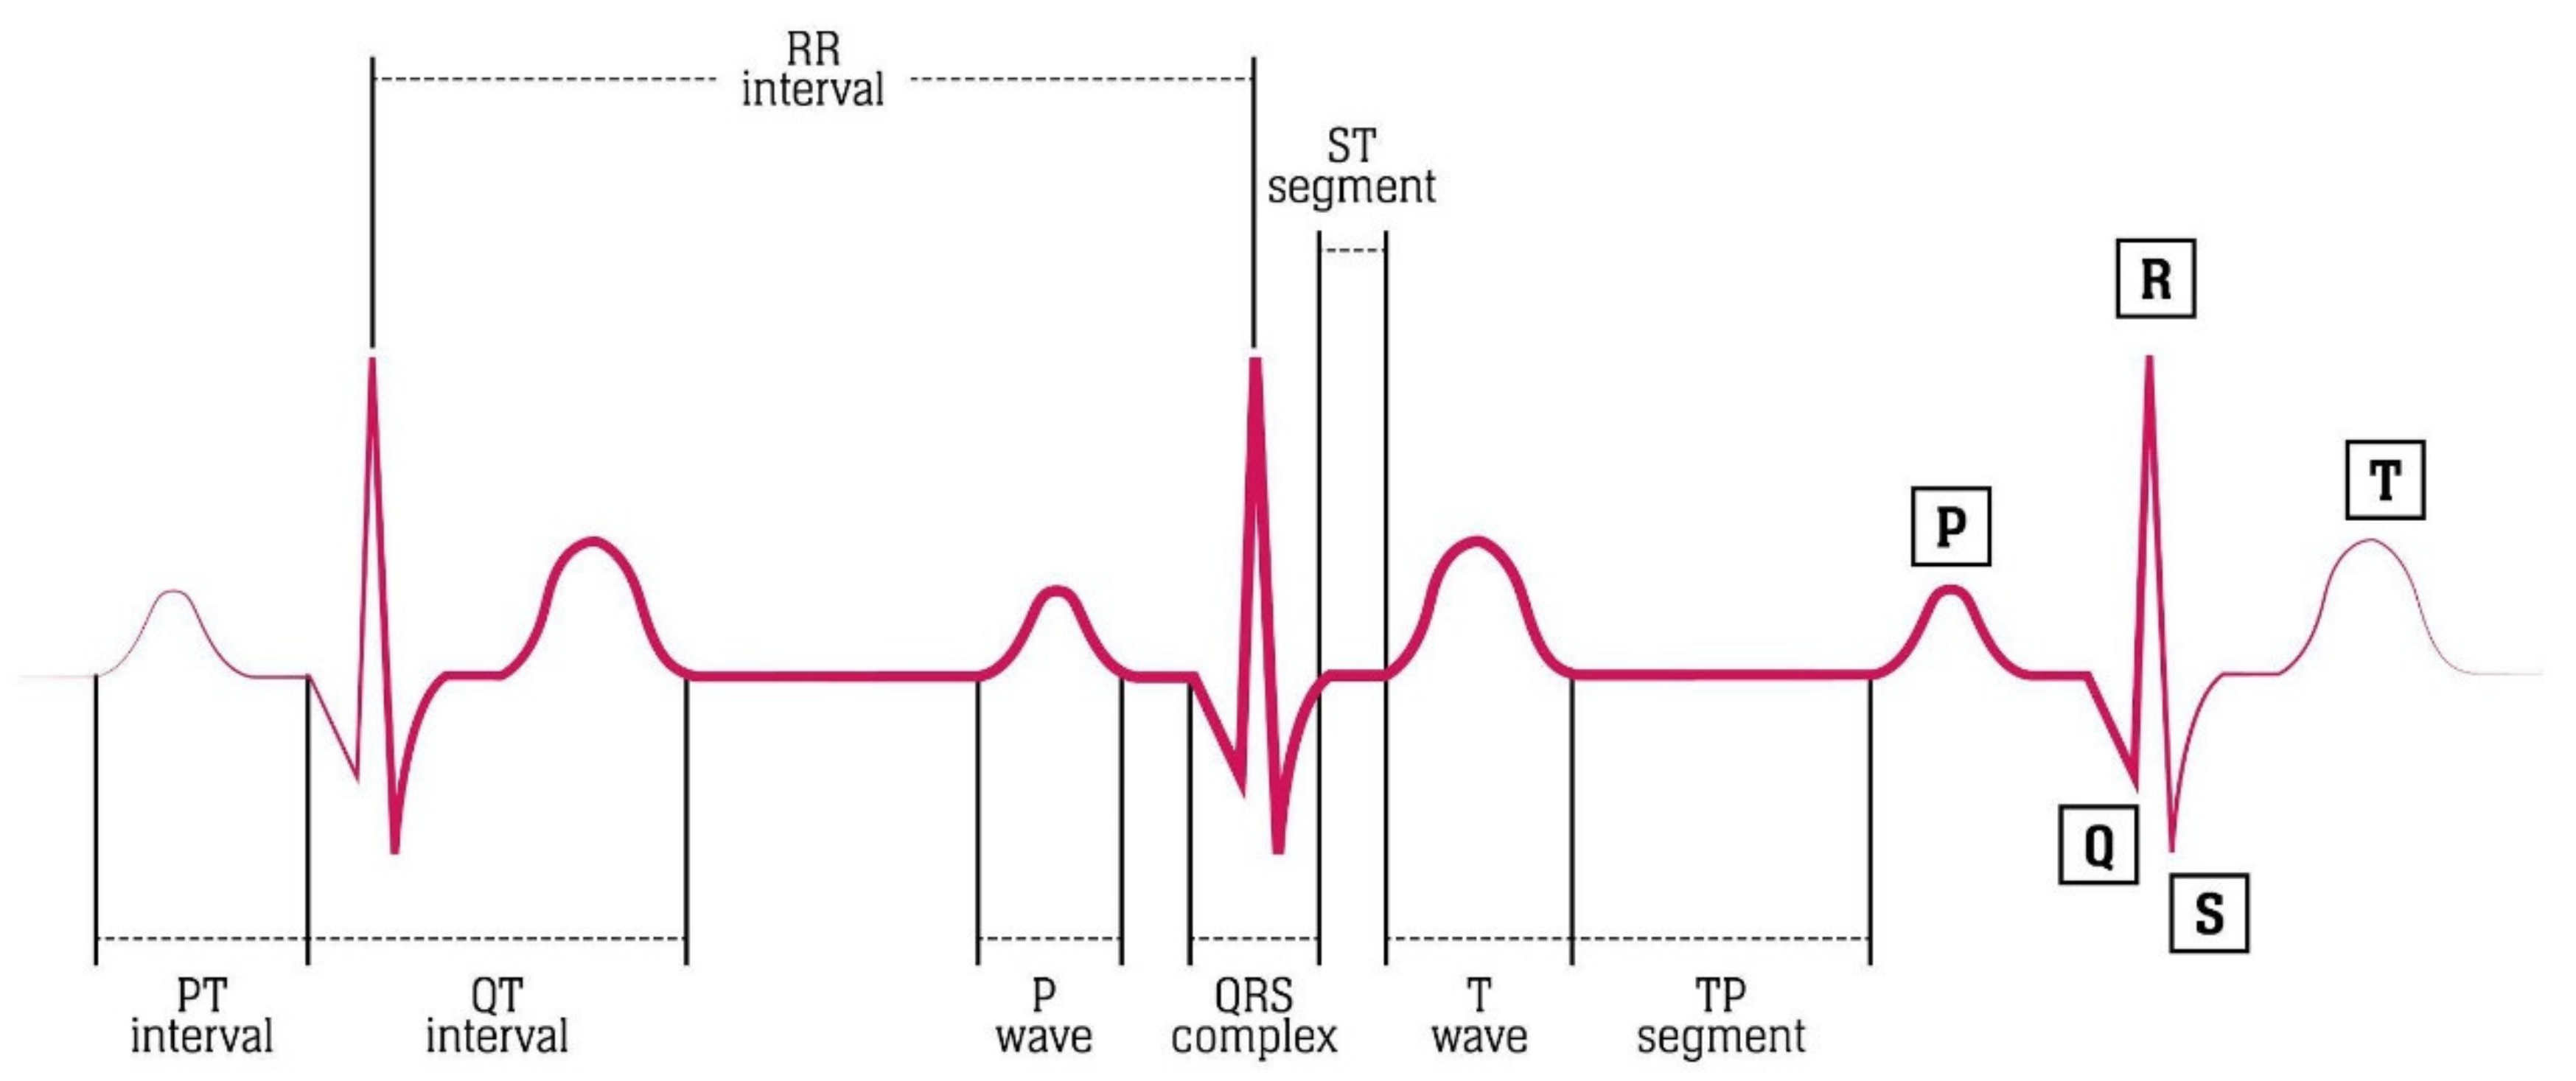
- Heart: Electrocardiogram (ECG) and Heart Rate Variability (HRV)
- Skin: Skin Temperature (SKT), Thermal Infrared Imaging (TII), Electrodermal activity (EDA)/Galvanic Skin Response (GSR)
- Chemical: Cortisol
4. Discussion
4.1. Summary and Research Gap
4.2. Approach
4.3. Main Findings
4.4. Limitations
- Multifaceted conditions of the indoor environment (temperature, light, air quality, humidity, etc.);
- Elaborate human psychophysiological reactions affecting the regulation of environmental conditions for conditioned buildings (individual preferences, personal methods of adaptive behavior, i.e., different levels of clothing, different body mass index (BMIs), different sense of comfort, etc.);
- Complex human psychophysiological reactions to the environmental conditions (stress, health, wellbeing, etc.);
- The many-to-many relationships between the factors mentioned above, and finally;
- The above-mentioned relationships being dependent on time factors (expectations changing together with the outdoor conditions and changing of the seasons, history of individual acclimatization, time of exposure to certain climatic conditions, etc.).
4.5. Future Directions
- The application of the identified biosignal measures in indoor environmental research, specifically starting with their use in test chamber lab experiments before staging exploratory studies in real-life indoor contexts and outdoor environments;
- Parallels with the existing research in the field of comfort studies need to be further deepened, both in order to use stress research with biosignals to support comfort studies and to build up knowledge concerning stress related biosignals supported by the existing knowledge from comfort studies;
- Implications in terms of building energy efficiency and indoor health are other parallel lines of research that open up, aiming to update the existing design practice as well as building regulations.
4.6. Conclusions
Author Contributions
Funding
Institutional Review Board Statement
Informed Consent Statement
Data Availability Statement
Conflicts of Interest
Abbreviations
| AH | absolute humidity |
| ANS | autonomic nervous system |
| APH | air-phase petroleum hydrocarbon |
| BMI | body mass index |
| BRI | building-related illnesses |
| BVP | blood volume pressure |
| ECG | electrocardiogram |
| EDA | electrodermal activity |
| EEG | electroencephalogram |
| EGG | electrogastrogram |
| EMG | electromyogram |
| ENG | electroneurogram |
| EOG | electrooculogram |
| ERG | electroretinogram |
| GSR | galvanic skin response |
| HF | high frequency |
| HPA | hypothalamic–pituitary–adrenal |
| HR | heart rate |
| HRV | heart rate variability |
| IAQ | indoor air quality |
| IEQ | indoor environmental quality |
| IP | air pollutants in indoor air |
| LW | low frequency |
| MCG | magnetocardiogram |
| MEG | magnetoencephalogram |
| MVOC | microbiological volatile organic compounds |
| NO | nitrogen oxides |
| PAH | polycyclic aromatic hydrocarbons |
| PCB | polychlorinated biphenyls |
| PMV | predicted mean vote |
| PPD | predicted percentage of dissatisfied occupants |
| RH | relative humidity |
| SAD | seasonal affective disorder |
| SBS | sick building syndrome |
| SKT | skin temperature |
| SPL | sound pressure levels |
| SWB | subjective wellbeing |
| SWD | shift work disorder |
| SWL | sound power |
| TNZ | thermoneutral zone |
| TO | toxic organic |
| TTI | thermal infrared imaging |
| VOC | volatile organic compounds |
Appendix A

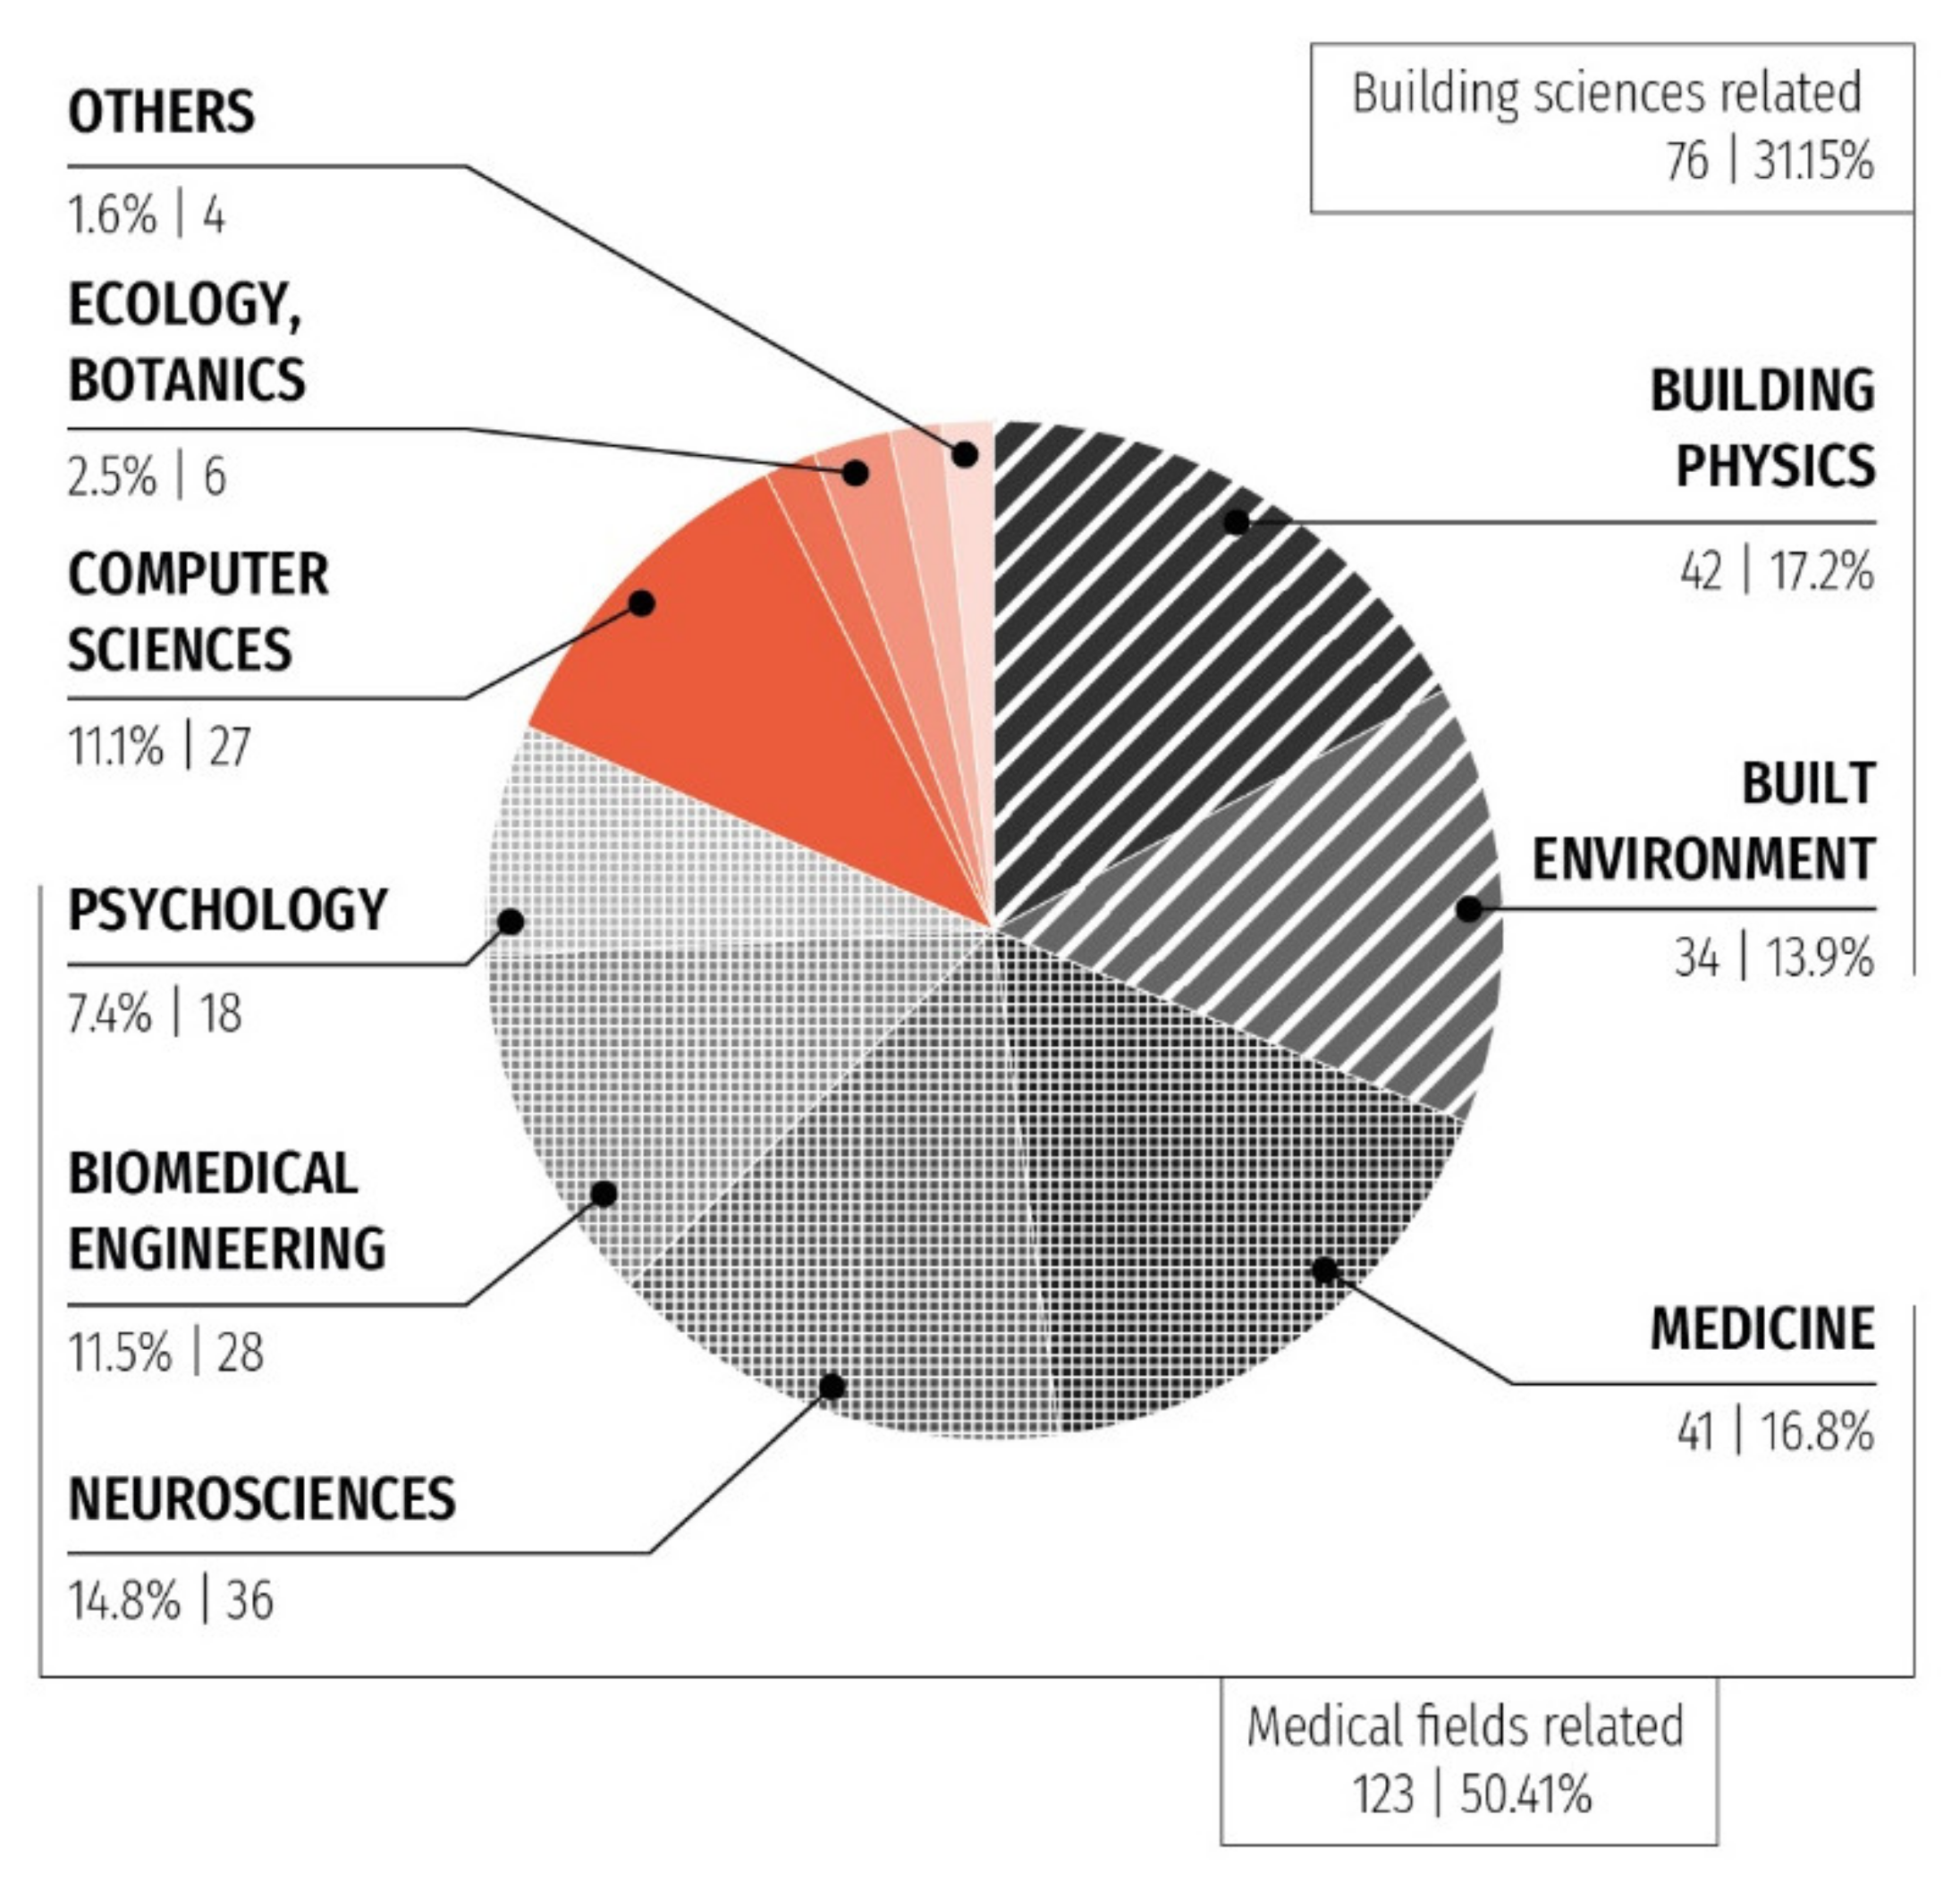
| Origin | Number (Total: 157) | References |
|---|---|---|
| Built environment | 28 | [2,6,14,15,16,17,30,42,43,46,47,49,50,51,57,59,60,64,74,75,76,77,81,82,85,103,111,131]. |
| Medicine | 27 | [3,7,19,20,31,38,40,62,65,66,73,79,90,98,107,114,115,116,121,122,124,127,149,151,184,222,241,242,243]. |
| Building physics | 24 | [9,11,13,32,39,48,53,61,71,72,112,134,141,147,148,150,156,161,166,167,168,199,201,246]. |
| Neurosciences | 24 | [21,28,86,88,91,92,101,102,104,105,106,108,125,126,128,129,157,185,186,188,189,196,205,206]. |
| Computer sciences, engineering | 17 | [56,89,93,94,96,97,110,120,190,191,194,210,224,234,235,238,240]. |
| Psychology | 13 | [8,22,25,37,38,63,87,100,117,118,123,125,126,130,158]. |
| Biomedical engineering, biology | 9 | [24,29,95,183,195,223,227,228,231]. |
| Economy, business | 4 | [35,36,55,80]. |
| Ergonomics | 4 | [34,83,84,113]. |
| Others | 3 | [26,54,119]. |
| Ecology, botanic | 2 | [33,159]. |
| Terms | Number (Total: 157) | References |
|---|---|---|
| Stress | 38 | [29,56,65,110,120,121,122,123,124,125,126,127,128,129,130,183,184,185,186,188,189,190,191,194,195,196,210,224,227,234,235,238,240,241,242,243]. |
| Comfort | 36 | [15,16,30,34,35,42,43,46,47,48,49,50,51,57,59,61,62,66,71,72,111,112,113,114,115,116,117,118,119,131,147,148,149,159,201,222,223,231,246]. |
| Health | 36 | [3,8,9,13,15,16,17,19,38,39,48,53,66,79,82,114,115,116,121,124,126,127,128,129,130,134,151,156,157,168,190,199,241,242,243,246]. |
| Performance | 21 | [2,31,53,74,75,76,77,82,83,84,103,104,105,106,107,111,120,122,161,190,206]. |
| Behaviour | 17 | [16,23,24,28,49,50,51,55,71,112,113,117,125,131,147,150,246]. |
| Attention | 16 | [86,87,88,89,90,91,92,93,94,95,96,97,98,100,101,102,206]. |
| Productivity | 14 | [13,14,33,35,36,76,77,79,80,81,85,89,158,168]. |
| Wellness, wellbeing | 13 | [19,20,22,37,38,40,82,84,118,158,187,205,243]. |
| Preference | 8 | [6,7,55,60,61,63,111,166]. |
| Satisfaction | 3 | [30,32,64]. |
| Type | Number (Total: 90) | References |
|---|---|---|
| Books, book chapters, theses | 6 | [36,52,74,76,146,156]. |
| Conference paper | 5 | [50,51,77,110,226]. |
| Journal paper | 72 | [2,4,5,8,9,11,12,13,14,15,16,21,31,32,33,35,42,44,45,46,47,48,49,53,60,61,62,66,67,68,69,70,71,75,78,79,81,82,83,108,111,131,132,133,134,135,137,138,139,141,142,143,144,150,152,153,154,155,158,159,161,162,165,166,167,169,199,225,228,230,232,233]. |
| Standards, guides, reports | 6 | [10,58,136,148,149,164]. |
| Website | 1 | [145]. |
| Origin | Number (Total: 90) | References |
|---|---|---|
| Building physics | 34 | [9,11,13,21,32,48,53,61,71,132,133,134,135,136,137,139,140,141,143,144,146,148,150,153,154,156,161,164,165,166,167,199,226,230]. |
| Built environment | 24 | [2,14,15,16,42,44,45,46,47,49,50,51,52,58,60,74,75,76,77,81,82,111,131,145]. |
| Medicine | 15 | [4,5,10,31,62,66,67,68,69,70,79,142,152,155,162]. |
| Ecology, botanics | 5 | [12,33,78,159,169]. |
| Biomedical engineering, biology | 3 | [138,228,232]. |
| Computer sciences, engineering | 3 | [110,225,233]. |
| Psychology | 2 | [8,158]. |
| Economy, business | 2 | [35,36]. |
| Neurosciences | 1 | [108]. |
| Ergonomics | 1 | [83]. |
| Terms | Number (Total: 90) | References |
|---|---|---|
| Health | 33 | [4,8,9,10,12,13,15,16,21,48,53,66,67,68,69,70,78,79,82,134,135,138,139,142,143,144,153,154,155,156,162,164,199]. |
| Comfort | 25 | [15,16,35,42,44,45,46,47,48,49,50,51,58,61,62,66,71,111,131,148,159,165,225,226,230]. |
| Productivity | 12 | [13,14,33,35,36,52,76,77,78,79,81,158]. |
| Performance | 11 | [2,31,53,74,75,76,77,82,83,111,161]. |
| Behaviour | 8 | [16,49,50,51,71,78,131,150]. |
| Preference | 5 | [60,61,111,132,166]. |
| Wellness, wellbeing | 2 | [82,158]. |
| Stress | 1 | [110]. |
| Satisfaction | 1 | [32]. |
| Parameter | Number (Total: 90) | References |
|---|---|---|
| Thermal | 26 | [2,42,45,46,48,50,51,58,62,66,67,68,69,70,71,83,111,131,146,148,199,225,226,228,230,232,233]. |
| Indoor air quality | 19 | [5,9,11,12,42,45,50,53,77,135,137,138,139,140,141,142,143,144,165]. |
| IEQ | 18 | [13,14,15,16,21,32,36,47,49,52,60,75,76,78,79,82,132,133]. |
| Visual | 12 | [8,33,44,150,152,153,154,155,156,158,159,199]. |
| Acoustic | 9 | [31,61,161,162,164,165,166,167,169]. |
| Type | Number (Total: 110) | References |
|---|---|---|
| Books, book chapters, theses | 13 | [116,170,171,173,174,175,176,180,182,196,198,203,237]. |
| Conference paper | 17 | [29,95,98,110,121,172,179,181,194,195,210,226,234,235,236,238,239]. |
| Journal paper | 78 | [7,8,17,28,56,65,66,67,68,69,70,86,87,88,91,99,101,102,104,105,108,109,120,122,142,149,151,163,177,178,183,185,187,188,189,190,191,192,193,197,199,200,201,202,204,205,206,207,208,209,211,212,213,214,215,216,217,218,219,220,221,222,223,224,225,227,228,229,230,231,232,233,240,241,242,243,244,245]. |
| Standards, guides, reports | 2 | [10,107]. |
| Origin | Number (Total: 110) | References |
|---|---|---|
| Neurosciences | 27 | [28,86,88,91,101,102,104,105,108,185,187,188,192,193,196,198,200,203,205,206,207,208,209,214,216,220,221]. |
| Biomedical engineering, biology | 26 | [29,95,170,171,172,173,174,175,176,177,178,179,180,181,182,183,195,204,215,217,218,223,227,228,231,232]. |
| Medicine | 23 | [7,10,65,66,67,68,69,70,98,107,116,121,122,142,149,151,219,222,241,242,243,244,245]. |
| Computer sciences, engineering | 22 | [56,110,120,189,190,191,194,197,202,210,212,213,224,225,229,233,234,235,236,238,239,240]. |
| Psychology | 6 | [8,87,99,109,211,237]. |
| Building physics | 5 | [163,199,201,226,230]. |
| Built environment | 1 | [17]. |
References
- United Nations. Department of Economic and Social Affairs. 2018. Available online: https://www.un.org/development/desa/en/news/population/2018-revision-of-world-urbanization-prospects.html (accessed on 29 November 2020).
- Wang, X.; Li, D.; Menassa, C.C.; Kamat, V.R. Investigating the effect of indoor thermal environment on occupants’ mental workload and task performance using electroencephalogram. Build. Environ. 2019, 158, 120–132. [Google Scholar] [CrossRef]
- Diffey, B. An overview analysis of the time people spend outdoors. Br. J. Dermatol. 2011, 164, 848–854. [Google Scholar] [CrossRef] [PubMed]
- Brasche, S.; Bischof, W. Daily time spent indoors in German homes—Baseline data for the assessment of indoor exposure of German occupants. Int. J. Hyg. Environ. Health 2005, 208, 247–253. [Google Scholar] [CrossRef] [PubMed]
- Klepeis, N.; Nelson, W.; Ott, W.; Robinson, J.; Tsang, A.M.; Switzer, P.; Behar, J.V.; Hern, S.C.; Engelmann, W.H. The National Human Activity Pattern Survey (NHAPS): A resource for assessing exposure to environmental pollutants. J. Expo. Sci. Environ. Epidemiol. 2001, 11, 231–252. [Google Scholar] [CrossRef] [Green Version]
- Chen, C.F.; Yilmaz, S.; Pisello, A.L.; De Simone, M.; Kim, A.; Hong, T.; Bandurski, K.; Bavaresco, M.V.; Liu, P.-L.; Zhu, Y. The impacts of building characteristics, social psychological and cultural factors on indoor environment quality productivity belief. Build. Environ. 2020, 185, 107–189. [Google Scholar] [CrossRef]
- Lee, E.; Kim, M. Light and Life at Night as Circadian Rhythm Disruptors. Chronobiol. Med. 2019, 1, 95–102. [Google Scholar] [CrossRef]
- Bedrosian, T.; Nelson, R. Timing of light exposure affects mood and brain circuits. Transl. Psychiatry 2017, 7. [Google Scholar] [CrossRef] [PubMed]
- Rudel, R.A.; Perovich, L.J. Endocrine disrupting chemicals in indoor and outdoor air. Atmos. Environ. 2009, 43, 170–181. [Google Scholar] [CrossRef] [PubMed] [Green Version]
- Scientific Committee on Emerging and Newly Identified Health Risks (SCENIHR). Health Effects of Artificial Light; European Union: Brussels, Belgium, 2012; ISBN 978-92-79-26314-9. [Google Scholar]
- Mentese, S.; Mirici, N.A.; Elbir, T.; Palaz, E.; Mumcuoğlu, D.T.; Cotuker, O.; Bakar, C.; Oymak, S.; Otkun, M.T. A long-term multi-parametric monitoring study: Indoor air quality (IAQ) and the sources of the pollutants, prevalence of sick building syndrome (SBS) symptoms, and respiratory health indicators. Atmos. Pollut. Res. 2020, in press. [Google Scholar] [CrossRef]
- Brilli, F.; Fares, S.; Ghirardo, A.; de Visser, P.; Catatyud, V.; Munoz, A.; Annesi-Maesano, I.; Sebastiani, F.; Alivemini, A.; Varriale, V.; et al. Plants for Sustainable Improvement of Indoor Air Quality. Trends Plant Sci. 2018, 23, 507–512. [Google Scholar] [CrossRef]
- Fisk, W.J. Estimates of potential nationwide productivity and health benefits from better indoor environments: An update. In Indoor Air Quality Handbook; Berkeley Lab: Berkeley, CA, USA, 2000; Volume 4, ISBN 9780071414845. [Google Scholar]
- Al Horr, Y.; Arif, M.; Haushik, A.; Mazroei, A.; Katafygiotou, M.; Elsarrag, E. Occupant productivity and office indoor environment quality: A review of the literature. Build. Environ. 2016, 105, 369–389. [Google Scholar] [CrossRef] [Green Version]
- Ortiz, M.A.; Kurvers, S.R.; Bluyssen, P.M. A review of comfort, health, and energy use: Understanding daily energy use and wellbeing for the development of a new approach to study comfort. Energy Build. 2017, 152, 323–335. [Google Scholar] [CrossRef]
- Šujanová, P.; Rychtáriková, M.; Sotto Mayor, T.; Hyder, A. A Healthy, Energy-Efficient and Comfortable Indoor Environment, a Review. Energies 2019, 12, 1414. [Google Scholar] [CrossRef] [Green Version]
- Van Marken Lichtenbelt, W.; Hanssen, M.; Pallubinsky, H.; Kingma, B.; Schellen, L. Healthy excursions outside the thermal comfort zone. Build. Res. Inf. 2017, 45, 819–827. [Google Scholar] [CrossRef] [Green Version]
- WHO. Constitution. Online Article. Available online: https://www.who.int/about/who-we-are/constitution#:~:text=Health%20is%20a%20state%20of,belief%2C%20economic%20or%20social%20condition (accessed on 29 November 2020).
- Cronin de Chavez, A.; Backett-Milburn, K.; Parry, O.; Platt, S. Understanding and researching wellbeing: Its usage in different disciplines and potential for health research and health promotion. Health Educ. J. 2005, 64, 70–87. [Google Scholar] [CrossRef]
- Lindert, J.; Bain, P.A.; Kubzansky, L.D.; Stein, C. Well-being measurement and the WHO health policy Health 2010: Systematic review of measurement scales. Eur. J. Public Health 2015, 25, 731–740. [Google Scholar] [CrossRef] [Green Version]
- Serrano-Jiménez, A.; Lizana, J.; Molina-Huelva, M.; Barrios-Padura, Á. Indoor Environmental Quality in Social Housing with Elderly Occupants in Spain: Measurement Results and Retrofit Opportunities. Build. Eng. 2020, 30. [Google Scholar] [CrossRef]
- Yetton, B.D.; Revord, J.; Margolis, S.; Lyubomirsky, S.; Seitz, A.R. Cognitive and physiological measures in well-being science: Limitations and lessons. Front. Psychol. 2019, 10, 1630. [Google Scholar] [CrossRef] [Green Version]
- Steimer, T. The biology of fear- and anxiety-related behaviors. Dialogues Clin. Neurosci. 2002, 4, 231–249. [Google Scholar] [CrossRef]
- Levitis, D.A.; Lidicker, W.A., Jr.; Freund, G. Behavioural biologists do not agree on what constitutes behaviour. Anim. Behav. 2009, 78, 103–110. [Google Scholar] [CrossRef] [Green Version]
- American Psychological Association (APA). Dictionary of Psychology. Available online: https://dictionary.apa.org/ (accessed on 26 November 2020).
- Oxford Lexico. Mannerism, Oxford English and Spanish Dictionary. Available online: https://www.lexico.com/definition/mannerism (accessed on 7 November 2020).
- Elliott, M.; Quintino, V. The Estuarine Quality Paradox Concept, Encyclopedia of Ecology, 2nd ed.; Elsevier: Amsterdam, The Netherlands, 2019; ISBN 978-0-444-64130-4. [Google Scholar]
- Jansen, A.; Nguyen, X.; Karpitsky, V.; Mettenleiter, M. Central Command Neurons of the Sympathetic Nervous System: Basis of the Fight-or-Flight Response. Sci. Mag. 1995, 5236, 644–646. [Google Scholar] [CrossRef]
- Nkurikiyeyezu, K.; Yokokubo, A.; Lopez, G. Importance of individual differences in physiological-based stress recognition models. In Proceedings of the 15th International Conference on Intelligent Environments (IE), Rabat, Morocco, 24–27 June 2019; pp. 37–43. [Google Scholar] [CrossRef]
- Langevin, J.; Wen, J.; Gurian, P.L. Modeling thermal comfort holistically: Bayesian estimation of thermal sensation, acceptability, and preference distributions for office building occupants. Build. Environ. 2013, 69, 206–226. [Google Scholar] [CrossRef]
- Jahncke, H.; Halin, N. Performance, fatigue and stress in open-plan offices: The effects of noise and restoration on hearing impaired and normal hearing individuals. Noise Health 2012, 14, 260. [Google Scholar] [CrossRef]
- Frontczak, M.; Schiavon, S.; Goins, J.; Arens, E.; Zhang, H.; Wargocki, P. Quantitative relationships between occupant satisfaction and satisfaction aspects of indoor environmental quality and building design. Indoor Air 2012, 22, 119–131. [Google Scholar] [CrossRef] [Green Version]
- Lohr, V.I.; Pearson-Mims, C.H.; Goodwin, G.K. Interior plants may improve worker productivity and reduce stress in a windowless environment. J. Environ. Hortic. 1996, 14, 97–100. [Google Scholar] [CrossRef]
- Macpherson, R. Thermal stress and thermal comfort. Ergonomics 1973, 16, 611–622. [Google Scholar] [CrossRef]
- Feige, A.; Wallbaum, H.; Janser, M.; Windlinger, L. Impact of sustainable office buildings on occupant’s comfort and productivity. J. Corp. Real Estate 2013, 15, 7–34. [Google Scholar] [CrossRef]
- Oseland, N. Environmental Factors Affecting Office Worker Performance: A Review of Evidence; CIBSE: London, UK, 1999; ISBN 0900953950. [Google Scholar]
- Evans, G.W.; Wells, N.M.; Moch, A. Housing and Mental Health: A Review of the Evidence and a Methodological and Conceptual Critique. J. Soc. Issues 2003, 59, 475–500. [Google Scholar] [CrossRef]
- Evans, G.W.; Wells, N.M.; Chan, H.Y.E.; Saltzmand, H. Housing quality and mental health. J. Consult. Clin. Psychol. 2000, 68, 526–530. [Google Scholar] [CrossRef]
- Ulrich, R.S. Effects of interior design on wellness: Theory and recent scientific research. J. Health Care Inter. Des. 1991, 3, 97–109. [Google Scholar]
- Hancock, T. Lalonde and beyond: Looking back at “a new perspective on the health of Canadians”. Health Promot. Int. 1986, 1, 93–100. [Google Scholar] [CrossRef] [PubMed]
- Lalonde, M. A New Perspective on the Health of Canadians: A Working Document; Government of Canada: Ottawa, ON, Canada, 1974. [Google Scholar]
- Ma, N.; Aviv, D.; Guo, H.; Braham, W.W. Measuring the right factors: A review of variables and models for thermal comfort and indoor air quality. Renew. Sustain. Energy Rev. 2021, 135. [Google Scholar] [CrossRef]
- Andargie, M.S.; Touchie, M.; O’Brien, W. A review of factors affecting occupant comfort in multi-unit residential buildings. Build. Environ. 2019, 160, 106–182. [Google Scholar] [CrossRef]
- Preto, S.; Gomes, C.C. Lighting in the Workplace: Recommended Illuminance (lux) at Workplace Environs. In Advances in Design for Inclusion. AHFE 2018. Advances in Intelligent Systems and Computing; Di Bucchianico, G., Ed.; Springer: Berlin/Heidelberg, Germany, 2019. [Google Scholar] [CrossRef]
- Rim, D.; Schiavon, S.; Nazaroff, W.W. Energy and Cost Associated with Ventilating Office Buildings in a Tropical Climate. PLoS ONE 2015, 10. [Google Scholar] [CrossRef] [Green Version]
- Kingma, B.R.M.; Frijns, A.J.H.; Schellen, L.; Lichtenbelt, W.D.V.M. Beyond the classic thermoneutral zone Including thermal comfort. Temperature 2014, 1, 142–149. [Google Scholar] [CrossRef] [Green Version]
- Chappells, H.; Shove, E. Debating the future of comfort: Environmental sustainability, energy consumption and the indoor environment. Build. Res. Inf. 2005, 33, 32–40. [Google Scholar] [CrossRef]
- Fang, L.; Wyon, D.P.; Clausen, G.; Fanger, P.O. Impact of indoor air temperature and humidity in an office on perceived air quality, SBS symptoms and performance. Indoor Air 2004, 14, 74–81. [Google Scholar] [CrossRef]
- Brager, G.S.; de Dear, R.J. Thermal Adaptation in the Built Environment: A Literature Review. Energy Build. 1998, 27, 83–96. [Google Scholar] [CrossRef] [Green Version]
- Brager, G.S.; de Dear, R.J. Climate, Comfort & Natural Ventilation: A new adaptive comfort standard for ASHRAE Standard 55. In Proceedings of the Moving Thermal Comfort Standards into the 21st Century 2012, Windsor, UK, 5 January 2016. [Google Scholar]
- De Dear, R.; Zhang, F. Dynamic Environment, Adaptive Comfort, and Cognitive Performance. In Proceedings of the 7th International Buildings Physics Conference 2018, Syracuse, NY, USA, 23–26 September 2018; pp. 1–6. [Google Scholar] [CrossRef]
- Heerwagen, J.H.; Orians, G.H. Humans, habitats, and aesthetics. In The Biophilia Hypothesis; Kellert, S.R., Wilson, E.O., Eds.; Island Press: Washington, DC, USA, 1993; pp. 138–172. [Google Scholar]
- Zhang, X.; Wargocki, P.; Lian, Z.; Thyregod, C. Effects of exposure to carbon dioxide and bioeffluents on perceived air quality, self-assessed acute health symptoms, and cognitive performance. Indoor Air 2017, 27, 47–64. [Google Scholar] [CrossRef] [Green Version]
- Merriam-Webster. Self-Select, Merriam-Webster Dictionary. Available online: https://www.merriam-webster.com/dictionary/self-select (accessed on 26 November 2020).
- Heckman, J.J. Selection Bias and Self-Selection; Durlauf, S.N., Blume, L.E., Eds.; Microeconometrics; The New Palgrave Economics Collection, Palgrave Macmillan: London, UK, 2010. [Google Scholar] [CrossRef]
- Giannakakis, G.; Grigoriadis, D.; Giannakaki, K.; Simantiraki, O.; Roniotis, A.; Tsiknakis, M. Review on psychological stress detection using biosignals. IEEE Trans. Affect. Comput. 2019. [Google Scholar] [CrossRef]
- Wang, J.; Wang, Z.; de Dear, R.; Luo, M.; Ghahramani, A.; Lin, B. The uncertainty of subjective thermal comfort measurement. Energy Build. 2018, 181, 38–49. [Google Scholar] [CrossRef]
- ASHRAE Standard 55. Thermal Environmental Conditions for Human Occupancy; American Society of Heating, Refrigerating and Air Conditioning Engineers: Atlanta, GA, USA, 2017.
- Djongyang, N.; Tchinda, R.; Njomo, D. Thermal comfort: A review paper. Renew. Sustain. Energy Rev. 2010, 14, 2626–2640. [Google Scholar] [CrossRef]
- Wong, L.T.; Mui, K.W.; Hui, P.S. A multivariate-logistic model for acceptance of indoor environmental quality (IEQ) in offices. Build. Environ. 2008, 43, 1–6. [Google Scholar] [CrossRef]
- Pellerin, N.; Candas, V. Effects of steady-state noise and temperature conditions on environmental perception and acceptability. Indoor Air 2004, 14, 129–136. [Google Scholar] [CrossRef]
- Fanger, P.O. Assessment of man’s thermal comfort in practice. Br. J. Ind. Med. 1973, 30, 313–324. [Google Scholar] [CrossRef] [Green Version]
- Lawless, H.T.; Heymann, H. Acceptance and Preference Testing. In Sensory Evaluation of Food; Springer: Boston, MA, USA, 1999. [Google Scholar] [CrossRef]
- Brager, G.; Baker, L. Occupant satisfaction in mixed-mode buildings. Build. Res. Inf. 2009, 37, 369–380. [Google Scholar] [CrossRef] [Green Version]
- Liu, T.K.; Chen, Y.P.; Hou, Z.Y.; Wang, C.C.; Chou, J.H. Noninvasive evaluation of mental stress using a refined rough set technique based on biomedical signals. Artif. Intell. Med. 2014, 61, 97–103. [Google Scholar] [CrossRef]
- Johnson, F.; Mavrogianni, A.; Ucci, M.; Wardle, J. Could increased time spent in a thermal comfort zone contribute to population increases in obesity? Obes. Rev. 2011, 12, 543–551. [Google Scholar] [CrossRef]
- Keith, S.; Redden, D.T.; Katzmarzyk, P.; Boggiano, M.; Hanlon, E.; Benca, R.; Ruden, D.; Pietrobelli, A.; Barger, J.; Fontaine, K.; et al. Putative contributors to the secular increase in obesity: Exploring the roads less traveled. Int. J. Obes. 2006, 30, 1585–1594. [Google Scholar] [CrossRef] [Green Version]
- Hansen, J.C.; Gilman, A.P.; Øyvind Odland, J. Is thermogenesis a significant causal factor in preventing the “globesity” epidemic? Med. Hypotheses 2010, 75, 250–256. [Google Scholar] [CrossRef]
- Moellering, D.R.; Smith, D.L., Jr. Ambient Temperature and Obesity. Curr. Obes. Rep. 2012, 1, 26–34. [Google Scholar] [CrossRef] [PubMed] [Green Version]
- Hanssen, M.J.; Hoeks, J.; Brans, B.; van der Lans, A.; Schaart, G.; van den Driessche, J.J.; Jörgensen, J.; Boekschoten, M.; Hesselink, M.; Havekes, B.; et al. Short-term cold acclimation improves insulin sensitivity in patients with type 2 diabetes mellitus. Nat. Med. 2015, 21, 863–865. [Google Scholar] [CrossRef] [PubMed]
- Nicol, J.F.; Humphreys, M.A. Adaptive thermal comfort and sustainable thermal standards for buildings. Energy Build. 2002, 34, 563–572. [Google Scholar] [CrossRef]
- Herrera-Limones, R.; Millán-Jiménez, A.; López-Escamilla, Á.; Torres-García, M. Health and Habitability in the Solar Decathlon University Competitions: Statistical Quantification and Real Influence on Comfort Conditions. J. Environ. Res. Public Health 2020, 17, 5926. [Google Scholar] [CrossRef] [PubMed]
- Mueller, E.T.; Landes, R.D.; Kowal, B.P.; Yi, R.; Stitzer, M.L.; Burnett, C.A.; Bickel, W.K. Delay of smoking gratification as a laboratory model of relapse: Effects of incentives for not smoking, and relationship with measures of executive function. Behav. Pharm. 2009, 20, 461–473. [Google Scholar] [CrossRef] [Green Version]
- Tullis, T.; Albert, B. Performance Metrics. In Measuring the User Experience. Collecting, Analyzing, and Presenting Usability Metrics, Interactive Technologies, 2nd ed.; Tullis, T., Albert, B., Eds.; Morgan Kaufmann: Burlington, VT, USA, 2013; Chapter 4; pp. 63–97. [Google Scholar] [CrossRef]
- O’Brien, W.; Gaetani, I.; Carlucci, S.; Hoes, P.-J.; Hensen, J.L.M. On occupant-centric building performance metrics. Build. Environ. 2017, 122, 373–385. [Google Scholar] [CrossRef]
- Seppanen, O.; Fisk, W.J. Title A model to estimate the cost effectiveness of the indoor environment improvements in office work. In Creating the Productive Workplace, 2nd ed.; Clements-Croome, D., Ed.; Taylor & Francis: Abingdon, UK, 2006. [Google Scholar] [CrossRef] [Green Version]
- Djukanovic, R.; Wargocki, P.; Fanger, P.O. Cost-benefit analysis of improved air quality in an office building. Proc. Indoor Air 2002, 1, 808–813. [Google Scholar]
- Armijos Moya, T.; van den Dobbelsteen, A.; Ottelé, M.; Bluysse, P.M. A review of green systems within the indoor environment. Indoor Built Environ. 2019, 28, 298–309. [Google Scholar] [CrossRef]
- Gray, T.; Birrell, C. Are Biophilic-Designed Site Office Buildings Linked to Health Benefits and High Performing Occupants? Int. J. Environ. Res. Public Health 2014, 11, 12205–12221. [Google Scholar] [CrossRef] [Green Version]
- Oseland, N.; Bartlett, P. Improving Office Productivity: A Guide for Business and Facilities Managers; Longman: London, UK, 1999; ISBN 978-0582357488. [Google Scholar]
- Heerwagen, J. Green Buildings, organizational success and occupant productivity. Build. Res. Inf. 2000, 28, 353–367. [Google Scholar] [CrossRef]
- Vimalanathan, K.; Babu, T.R. The effect of indoor office environment on the work performance, health and well-being of office workers. J. Environ. Health Sci. Eng. 2014, 12. [Google Scholar] [CrossRef] [PubMed] [Green Version]
- Ramsey, J.D. Task performance in heat: A review. Ergonomics 1995, 38, 154–156. [Google Scholar] [CrossRef] [PubMed]
- Paas, F.G.W.C.; Van Merriënboer, J.J.G. The efficiency of instructional conditions: An approach to combine mental effort and performance measures. Hum. Factors J. Hum. Factors Erg. Soc. 1993, 35, 737–743. [Google Scholar] [CrossRef]
- Lan, L.; Lian, Z.; Pan, L.; Ye, Q. Neurobehavioral approach for evaluation of office workers’ productivity: The effects of room temperature. Build. Environ. 2009, 44, 1578–1588. [Google Scholar] [CrossRef]
- Wais, P.E.; Rubens, M.T.; Boccanfuso, J.; Gazzaley, A. Neural Mechanisms Underlying the Impact of Visual Distraction on Retrieval of Long-Term Memory. J. Neurosci. 2010, 30, 8541–8550. [Google Scholar] [CrossRef] [PubMed]
- Buetti, S.; Lleras, A. Distractibility is a Function of Engagement, Not Task Difficulty: Evidence from a New Oculomotor Capture Paradigm. J. Exp. Psychol. General. 2016, 145, 1382–1405. [Google Scholar] [CrossRef]
- Fiebelkorn, I.C.; Pinsk, M.A.; Kastner, S. Namic Interplay within the Frontoparietal Network Underlies Rhythmic Spatial Attention. Neuron 2018, 99, 842–853. [Google Scholar] [CrossRef] [Green Version]
- Pizzamiglio, S.; Naeem, U.; ur Réhman, S.; Sharif, M.S.; Abdalla, H.; Turner, D.L. A Multimodal Approach to Measure the Distraction Levels of Pedestrians using Mobile Sensing. Procedia Comput. Sci. 2017, 113, 89–96. [Google Scholar] [CrossRef]
- Glenberg, A.M.; Schroeder, J.L.; Robertson, D.A. Averting the gaze disengages the environment and facilitates remembering. Mem. Cogn. 1998, 26, 651–658. [Google Scholar] [CrossRef] [Green Version]
- Song, K.; Meng, M.; Chen, L.; Zhou, K.; Luo, H. Behavioral oscillations in attention: Rhythmic α pulses mediated through θ band. J. Neurosci. Off. J. Soc. Neurosci. 2014, 34, 4837–4844. [Google Scholar] [CrossRef]
- Van Rullen, R.; Carlson, T.; Cavanagh, P. The blinking spotlight of attention. Proc. Natl. Acad. Sci. USA 2017, 104, 19204–19209. [Google Scholar] [CrossRef] [Green Version]
- Gallahan, S.L.; Golzar, G.F.; Jain, A.P.; Samay, A.E.; Trerotola, T.J.; Weisskopf, J.G.; Lau, N. Detecting and Mitigating Driver Distraction with Motion Capture Technology: Distracted Driving Warning System. In Proceedings of the IEEE Systems and Information Engineering Design Symposium, Charlottesville, VA, USA, 26 April 2013; pp. 76–81. [Google Scholar] [CrossRef]
- Hamaoka, H.; Hagiwara, T.; Masahiro, T.A.D.A.; Munehiro, K. A study on the behavior of pedestrians when confirming approach of right/left-turning vehicle while crossing a crosswalk. In Proceedings of the IEEE Intelligent Vehicles Symposium (IV), Gold Coast, QLD, Australia, 23–26 June 2013; pp. 106–110. [Google Scholar] [CrossRef]
- Mizoguchi, F.; Nishiyama, H.; Iwasaki, H. A new approach to detecting distracted car drivers using eye-movement data. In Proceedings of the IEEE 13th International Conference on Cognitive Informatics and Cognitive Computing, London, UK, 18–20 August 2014; pp. 266–272. [Google Scholar] [CrossRef]
- Zaki, M.H.; Sayed, T. Exploring walking gait features for the automated recognition of distracted pedestrians. IET Intell. Transp. Syst. 2016, 10, 106–113. [Google Scholar] [CrossRef]
- Uemura, Y.; Kajiwara, Y.; Shimakawa, H. Estimating Distracted Pedestrian from Deviated Walking Considering Consumption of Working Memory. In Proceedings of the International Conference on Computational Science and Computational Intelligence (CSCI), Las Vegas, NV, USA, 15–17 December 2016; pp. 1164–1167. [Google Scholar] [CrossRef]
- Killane, I.; Browett, G.; Reilly, R.B. Measurement of attention during movement: Acquisition of ambulatory EEG and cognitive performance from healthy young adults. In Proceedings of the Annual International Conference of the IEEE Engineering in Medicine and Biology Society, Osaka, Japan, 3–7 July 2013; pp. 6397–6400. [Google Scholar] [CrossRef]
- Almahasneh, H.; Chooi, W.T.; Kamel, N.; Malik, A.S. Deep in thought while driving: An EEG study on drivers’ cognitive distraction. Transp. Res. Part F Traffic Psychol. Behav. 2014, 26, 218–226. [Google Scholar] [CrossRef]
- Bigliassi, M.; Karageorghis, C.I.; Nowicky, A.V.; Wright, M.J.; Orgs, G. Effects of auditory distraction on voluntary movements: Exploring the underlying mechanisms associated with parallel processing. Psychol. Res. 2018, 82, 720–733. [Google Scholar] [CrossRef] [PubMed] [Green Version]
- Casteau, S.; Smith, D.T. Covert attention beyond the range of eye-movements: Evidence for a dissociation between exogenous and endogenous orienting. Cortex 2020, 122, 170–186. [Google Scholar] [CrossRef] [PubMed]
- Husain, M.; Kennard, C. Visual neglect associated with frontal lobe infarction. J. Neurol. 1996, 243, 652–657. [Google Scholar] [CrossRef] [PubMed]
- Aryal, A.; Ghahramani, A.; Becerik-Gerber, B. Monitoring fatigue in construction workers using physiological measurements. Autom. Constr. 2017, 82, 154–165. [Google Scholar] [CrossRef]
- Zhao, C.; Zheng, C.; Zhao, M.; Tu, Y.; Liu, J. Multivariate autoregressive models and kernel learning algorithms for classifying driving mental fatigue based on electroencephalographic. Expert Syst. Appl. 2011, 38, 1859–1865. [Google Scholar] [CrossRef]
- Holm, A.; Lukander, K.; Korpela, J.; Sallinen, M.; Müller, K.M.I. Estimating brain load from the EEG. Sci. World J. 2009, 9, 639–651. [Google Scholar] [CrossRef] [Green Version]
- Boksem, M.A.S.; Tops, M. Mental fatigue: Costs and benefits. Brain Res. Rev. 2008, 59, 125–139. [Google Scholar] [CrossRef] [Green Version]
- Kramer, A.F. Physiological Metrics of Mental Workload: A Review of Recent Progress; Navy Personnel Research and Development Center: California, CA, USA, 1990; ISBN 92152-6800. Available online: https://pdfs.semanticscholar.org/475f/074528e18cda79477ce02eb50fc1463fe56a.pdf (accessed on 28 November 2020).
- Bokiniec, P.; Zampieri, N.; Lewin, G.R.; Poulet, J.F. The neural circuits of thermal perception. Curr. Opin. Neurobiol. 2018, 52, 98–106. [Google Scholar] [CrossRef] [PubMed]
- Sur, S.; Sinha, V.K. Event-related potential: An overview. Ind. Psychiatry J. 2009, 18, 70–73. [Google Scholar] [CrossRef] [PubMed]
- Giannakakis, G.; Marias, K.; Tsiknakis, M. A stress recognition system using HRV parameters and machine learning techniques. In Proceedings of the 8th International Conference on Affective Computing and Intelligent Interaction Workshops and Demos (ACIIW), Cambridge, UK, 3–6 September 2019; pp. 269–272. [Google Scholar] [CrossRef]
- Chang, T.Y.; Kajackaite, A. Battle for the thermostat: Gender and the effect of temperature on cognitive performance. PLoS ONE 2019, 14. [Google Scholar] [CrossRef] [PubMed]
- Zhang, L.; Helander, M.G.; Drury, C.G. Identifying Factors of Comfort and Discomfort in Sitting. Hum. Factors 1996, 38, 377–389. [Google Scholar] [CrossRef]
- Cameron, J.A. Assessing work-related body-part discomfort: Current strategies and a behaviorally oriented assessment tool. Int. J. Ind. Ergon. 1996, 18, 389–398. [Google Scholar] [CrossRef]
- Ashkenazy, S.; DeKeyser Ganz, F. The Differentiation between Pain and Discomfort: A Concept Analysis of Discomfort. Pain Manag. Nurs. 2019, 20, 556–562. [Google Scholar] [CrossRef]
- Stanghellini, V. Review Article: Pain versus discomfort—Is differentiation clinically useful? Aliment. Pharmacol. Ther. 2001, 15, 145–149. [Google Scholar] [CrossRef]
- Eliav, E.; Gracely, R.H. Measuring and assessing pain. In Orofacial Pain and Headache; Benoliel, R., Sharav, Y., Eds.; Elsevier Ltd.: Amsterdam, The Netherlands, 2008; Chapter 3; pp. 45–56. [Google Scholar] [CrossRef]
- Grabisch, M.; Duchêne, J.; Lino, F.; Perny, P. Subjective Evaluation of Discomfort in Sitting Positions. Fuzzy Optim. Decis. Mak. 2002, 1, 287–312. [Google Scholar] [CrossRef]
- Zillmann, D.; Rockwell, S.; Schweitzer, K.; Sundar, S.S. Does humor facilitate coping with physical discomfort? Motiv. Emot. 1993, 17, 1–21. [Google Scholar] [CrossRef]
- Merriam-Webster. Discomfort, Merriam-Webster Dictionary. Available online: https://www.merriam-webster.com/dictionary/discomfort (accessed on 29 November 2020).
- Kyriakou, K.; Resch, B.; Sagl, G.; Petutschnig, A.; Werner, C.; Niederseer, D.; Liedlgruber, M.; Wilhelm, F.; Osborne, T.; Pykett, J. Detecting Moments of Stress from Measurements of Wearable Physiological Sensors. Sensors 2019, 19, 3805. [Google Scholar] [CrossRef] [Green Version]
- Dhabhar, F.S.; Satoskar, A.R.; Bluethmann, H.; David, J.R.; McEwen, B.S. Stress-induced enhancement of skin immune function: A role for γ interferon. Proc. Natl. Acad. Sci. USA 2000, 97, 2846–2851. [Google Scholar] [CrossRef] [PubMed] [Green Version]
- Healey, J.A.; Picard, R.W. Detecting stress during real-world driving tasks using physiological sensors. IEEE Trans. Intell. Transp. Syst. 2005, 6, 156–166. [Google Scholar] [CrossRef] [Green Version]
- Crum, A.J.; Salovey, P.; Achor, S. Rethinking stress: The role of mindsets in determining the stress response. J. Personal. Soc. Psychol. 2013, 104. [Google Scholar] [CrossRef] [Green Version]
- McEwen, B.S. Protective and damaging effects of stress mediators. N. Engl. J. Med. 1998, 338, 171–179. [Google Scholar] [CrossRef] [PubMed] [Green Version]
- Peters, A.; McEwen, B.S.; Friston, K. Uncertainty and stress: Why it causes diseases and how it is mastered by the brain. Prog. Neurobiol. 2017, 156, 164–188. [Google Scholar] [CrossRef] [PubMed]
- Marques, A.H.; Silverman, M.N.; Sternberg, E.M. Evaluation of stress systems by applying noninvasive methodologies: Measurements of neuroimmune biomarkers in the sweat, heart rate variability and salivary cortisol. Neuroimmunomodulation 2010, 17, 205–208. [Google Scholar] [CrossRef] [Green Version]
- McEwen, B.S. Central effects of stress hormones in health and disease: Understanding the protective and damaging effects of stress and stress mediators. Eur. J. Pharmacol. 2008, 583, 174–185. [Google Scholar] [CrossRef] [Green Version]
- Uchino, B.; Smith, T.; Holt-Lunstad, J.; Campo, R.; Reblin, M. Stress and Illness. In Handbook of Psychophysiology; Cacioppo, J.L., Tassinary, L.G., Berntson, G.G., Eds.; Cambridge University Press: Cambridge, UK, 2007; pp. 608–632. [Google Scholar]
- Cacha, L.A.; Poznanski, R.R.; Latif, A.Z.A.; Ariff, T.M. Psychophysiology of chronic stress: An example of mind-body interaction. NeuroQuantology 2019, 17, 53–63. [Google Scholar] [CrossRef]
- Schneiderman, N.; Ironson, G.; Siegel, S.D. Stress and health: Psychological, behavioral, and biological determinants. Annu. Rev. Clin. Psychol. 2005, 1, 607–628. [Google Scholar] [CrossRef] [Green Version]
- Baker, N.; Standeven, M. Thermal comfort for free-running buildings. Energy Build. 1996, 23, 175–182. [Google Scholar] [CrossRef]
- Lai, A.C.K.; Mui, K.W.; Wong, L.T.; Law, L.Y. An evaluation model for indoor environmental quality (IEQ) acceptance in residential buildings. Energy Build. 2009, 41, 930–936. [Google Scholar] [CrossRef]
- Larsen, T.S.; Rohde, L.; Trangbæk Jønsson, K.; Rasmussen, B.; Lund Jensen, R.; Knudsen, H.N.; Witterseh, T.; Bekö, G. IEQ-Compass—A tool for holistic evaluation of potential indoor environmental quality. Building Environ. 2020, 172. [Google Scholar] [CrossRef]
- Bluyssen, P.M.; Roda, C.; Mandin, C.; Fossati, S.; Carrer, P.; de Kluizenaar, Y.; Mihucz, V.G.; de Oliveira Fernandes, E.; Bartzis, J. Self-reported health and comfort in ‘modern’ office buildings: First results from the European OFFICAIR study. Indoor Air 2016, 26, 298–317. [Google Scholar] [CrossRef] [PubMed]
- Lizana, J.; Almeida, S.M.; Serrano-Jiménez, A.; Becerra, J.A.; Gil-Báez, M.; Barrios-Padura, A.; Chacartegui, R. Contribution of Indoor Microenvironments to the Daily Inhaled Dose of Air Pollutants in Children. Importance Bedrooms. Environ. 2020, 183, 107188. [Google Scholar] [CrossRef]
- U.S. Environmental Protection Agency. The Total Exposure Assessment Methodology (TEAM) Study: Summary and Analysis; EPA/600/6-87/002-a; Office of Research and Development U.S. Environmental Protection Agency: Washington, DC, USA, 1987.
- Geiss, O.; Giannopoulos, G.; Tirendi, S.; Barrero-Moreno, J.; Larsen, B.R.; Kotzias, D. TheAIRMEXstudy—VOC measurements in public buildings and schools/kindergartens in eleven European cities: Statistical analysis of the data. Atmos. Environ. 2011, 45, 3676–3684. [Google Scholar] [CrossRef]
- Panagiotaras, D.; Nikolopoulos, D.; Petraki, E.; Kottou, S.; Koulougliotis, D.; Yannakopoulos, P.; Kaplanis, S. Comprehensive experience for indoor air quality assessment: A review on the determination of volatile organic compounds (VOCs). J. Phys. Chem. Biophys. 2014, 4. [Google Scholar] [CrossRef] [Green Version]
- Wolverton, B.C.; Mcdonald, R.C.; Watkins, E.A. Foliage plants for removing indoor air-pollutants from energy efficient homes. Econ. Bot. 1984, 38, 224–228. [Google Scholar] [CrossRef]
- WSC POLICY #02-430. Indoor Air Sampling and Evaluation Guide; Commonwealth of Massachusetts Executive Office of Environmental Affairs, Department of Environmental Protection: Boston, MA, USA, 2002. Available online: https://www.mass.gov/doc/wsc-02-430-indoor-air-sampling-and-evaluation-guide-0/download (accessed on 29 October 2020).
- Fanger, P.O.; Fcibase Fashrae, D. Sc. Olf and decipol: New units for perceived air quality. Build. Serv. Eng. Res. Technol. 1988, 9, 155–157. [Google Scholar] [CrossRef]
- Arundel, A.V.; Sterling, E.M.; Biggin, J.H.; Sterling, T.D. Indirect health effects of relative humidity in indoor environments. Environ. Health Perspect. 1986, 65, 351–361. [Google Scholar] [CrossRef] [Green Version]
- Wolkoff, P. Indoor air humidity, air quality, and health—An overview. Int. J. Hyg. Environ. Health 2018, 221, 376–390. [Google Scholar] [CrossRef]
- Sundell, J.; Lindvall, T. Indoor air humidity and the sensation of dryness as risk indicators of SBS. Indoor Air 1993, 3, 382–390. [Google Scholar] [CrossRef]
- European Commission. Building Stock Characteristics, EU Buildings Factsheets Topics Tree, Energy. Available online: https://ec.europa.eu/energy/eu-buildings-factsheets-topics-tree/building-stock-characteristics_en (accessed on 29 November 2020).
- Hensen, J.L.M. On the Thermal Interaction of Building Structure and Heating and Ventilating System; Technische Universiteit Eindhoven: Eindhoven, The Netherlands, 1991; ISBN 90-386-0081-X. [Google Scholar]
- Berglund, L. Mathematical models for predicting thermal comfort response of building occupants. Ashrae J. Am. Soc. Heat. Refrig. Air Cond. Eng. 1977, 19, 17–91. [Google Scholar]
- 140 International Standard 7730. Moderate Thermal Environments—Determination of the PMV and PPD Indices and Specification of the Conditions of Thermal Comfort; International Standards Organization: Geneva, Switzerland, 2005. [Google Scholar]
- Pallubinsky, H.; Schellen, L.; Lichtenbelt, W.D.V.M. Exploring the human thermoneutral zone—A dynamic approach. J. Therm. Biol. 2019, 79, 199–208. [Google Scholar] [CrossRef] [PubMed]
- Butler, D.L.; Biner, P.M. Preferred Lighting Levels: Variability among Settings, Behaviors, and Individuals. Environ. Behav. 1987, 19, 695–721. [Google Scholar] [CrossRef]
- Stevens, R.G.; Hansen, J.; Costa, G.; Haus, E.; Kauppinen, T.; Aronson, K.J.; Castaño-Vinyals, G.; Davis, S.; Frings-Dresen, M.H.; Fritschi, L.; et al. Considerations of circadian impact for defining ‘shift work’ in cancer studies: IARC Working Group Report. Occup. Environ. Med. 2011, 68, 154–162. [Google Scholar] [CrossRef]
- Almutawa, F.; Vandal, R.; Wang, S.Q.; Lim, H.W. Current status of photoprotection by window glass, automobile glass, window films, and sunglasses. Photodermatol. Photoimmunol. Photomed. 2013, 29, 65–72. [Google Scholar] [CrossRef]
- Mottram, V.; Middleton, B.; Williams, P.; Arendt, J. The impact of bright artificial white and ‘blue enriched’ light on sleep and circadian phase during the polar winter. J. Sleep Res. 2011, 20, 154–161. [Google Scholar] [CrossRef] [Green Version]
- Rea, M.; Figueiro, M.; Bullough, J. Circadian photobiology: An emerging framework for lighting practice and research. Lighting Res. Technol. 2002, 34, 177–187. [Google Scholar] [CrossRef]
- Van Bommel, W.; van den Beld, G. Lighting for work: A review of visual and biological effects. Lighting Res. Technol. 2004, 36, 255–266. [Google Scholar] [CrossRef]
- Aries, M.B.C. Human Lighting Demands: Healthy Lighting in an Office Environment; Technische Universiteit Eindhoven: Eindhoven, The Netherlands, 2005. [Google Scholar] [CrossRef]
- Walker, W.H.; Walton, J.C.; DeVries, A.C. Circadian rhythm disruption and mental health. Transl. Psychiatry 2020, 10. [Google Scholar] [CrossRef] [Green Version]
- Kwallek, N.; Lewis, C.M.; Robbins, A.S. Effects of office interior color on workers’ mood and productivity. Percept. Motor Skills 1988, 66, 123–128. [Google Scholar] [CrossRef]
- Chang, C.-Y.; Chen, P.-K. Human response to window views and indoor plants in the workplace. HortScience 2005, 40, 1354–1359. [Google Scholar] [CrossRef] [Green Version]
- Kaplan, R.; Kaplan, S. The Experience of Nature: A Psychological Perspective; CUP Archive: Cambridge, UK, 1989; ISBN 978-0521341394. [Google Scholar]
- Ayr, U.; Cirillo, E.; Fato, I.; Martellotta, F. A new approach to assessing the performance of noise indices in buildings. Appl. Acoust. 2003, 64, 129–145. [Google Scholar] [CrossRef]
- Stansfeld, S.A.; Matheson, M.P. Noise pollution: Non-auditory effects on health. Br. Med Bull. 2003, 68, 243–257. [Google Scholar] [CrossRef] [PubMed]
- Evans, G.W.; Bullinger, M.; Hygge, S. Chronic noise exposure and physiological response: A prospective study of children living under environmental stress. Psychol. Sci. 1998, 9, 75–77. [Google Scholar] [CrossRef]
- World Health Organization. Environmental Noise Guidelines for the European Region; WHO Regional Office for Europe: Copenhagen, Denmark, 2018; ISBN 978-92-890-5356-3. [Google Scholar]
- Field, C.D.; Digerness, J. Acoustic design criteria for naturally ventilated buildings. J. Acoust. Soc. Am. 2008, 123, 9269–9273. [Google Scholar] [CrossRef]
- Mui, K.; Wong, L. A method of assessing the acceptability of noise levels in air-conditioned offices. Building Serv. Eng. Res. Technol. 2006, 27, 249–254. [Google Scholar] [CrossRef]
- Payne, S.R. The production of a perceived restorativeness soundscape scale. Appl. Acoust. 2013, 74, 255–263. [Google Scholar] [CrossRef]
- World Green Building Council (WGBC). Health, Wellbeing & Productivity in Offices, World Green Building Council. 2014. Available online: https://www.worldgbc.org/sites/default/files/compressed_WorldGBC_Health_Wellbeing__Productivity_Full_Report_Dbl_Med_Res_Feb_2015.pdf (accessed on 29 November 2020).
- Azkorra, Z.; Perez, G.; Coma, J.; Cabeza, L.F.; Bures, S.; Alvaro, J.E.; Erkoreka, A.; Urrestarazu, M. Evaluation of green walls as a passive acoustic insulation system for buildings. Appl. Acoust. 2015, 89, 46–56. [Google Scholar] [CrossRef] [Green Version]
- Ermes, M. Methods for the Classification of Biosignals Applied to the Detection of Epileptiform Waveforms and to the Recognition of Physical Activity; Tampere University of Technology: Tampere, Finland, 2009; Available online: http://www.vtt.fi/publications/index.jsp (accessed on 29 November 2020).
- Bronzino, J.D. Biomedical Engineering: A Historical Perspective. In Biomedical Engineering, Introduction to Biomedical Engineering, 3rd ed; Enderle, J.D., Bronzino, J.D., Eds.; Academic Press: Cambridge, MA, USA, 2012; Chapter 1; pp. 1–33. ISBN 9780123749796. [Google Scholar] [CrossRef]
- Fong, S.; Lan, K.; Sun, P.; Mohammed, S.; Fiaidhi, J. A time-series pre-processing methodology for biosignal classification using statistical feature extraction. In Proceedings of the IASTED International Conference on Biomedical Engineering (BioMed 2013), Innsbruck, Austria, 13–15 February 2013; pp. 207–214. [Google Scholar] [CrossRef] [Green Version]
- Escabí, M. Biosignal Processing. In Biomedical Engineering, Introduction to Biomedical Engineering, 3rd ed.; Enderle, J.D., Bronzino, J.D., Eds.; Academic Press: Cambridge, MA, USA, 2012; Chapter 11; pp. 667–746. ISBN 9780123749796. [Google Scholar] [CrossRef]
- Kaniusas, E. Biomedical Signals and Sensors I, Biological and Medical Physics, Biomedical Engineering; Springer: Berlin/Heidelberg, Germany, 2012; ISBN 978-3-642-24842-9. [Google Scholar]
- Malmivuo, J.; Plonsey, R. Bioelectromagnetism: Principles and Applications of Bioelectric and Biomagnetic Fields; Oxford University Press: Oxford, UK, 1995. [Google Scholar] [CrossRef]
- Towe, B.C. Bioelectricity and its Measurement. In Standard Handbook of Biomedical Engineering & Design; Kutz, M., Ed.; The McGraw-Hill Companies, Inc.: New York, NY, USA, 2009; Volume 1, Chapter 20; pp. 481–528. ISBN 9780071498388. [Google Scholar]
- Walter-Kroker, A.; Kroker, A.; Mattiucci-Guehlke, M.; Glaab, T. A practical guide to bioelectrical impedance analysis using the example of chronic obstructive pulmonary disease. Nutr. J. 2011, 10. [Google Scholar] [CrossRef] [Green Version]
- Kyle, U.G.; Bosaeus, I.; De Lorenzo, A.D.; Deurenberg, P.; Elia, M.; Gómez, J.M.; Heitmann, B.L.; Kent-Smith, L.; Melchior, J.C.; Pirlich, M.; et al. Bioelectrical impedance analysis-part I: Review of principles and methods. Clin. Nutr. 2004, 23, 1226–1243. [Google Scholar] [CrossRef] [PubMed]
- Callejas-Cuervo, M.; Alvarez, J.C.; Alvarez, D. Capture and analysis of biomechanical signals with inertial and magnetic sensors as support in physical rehabilitation processes. In Proceedings of the IEEE 13th International Conference on Wearable and Implantable Body Sensor Networks (BSN), San Francisco, CA, USA, 14–17 June 2016; pp. 119–123. [Google Scholar] [CrossRef]
- Hadjileontiadis, L.J.; Rekanos, I.T.; Panas, S.M. Bioacoustic Signals; Akay, M., Ed.; Wiley Encyclopedia of Biomedical Engineering: Hoboken, NJ, USA, 2006. [Google Scholar] [CrossRef]
- Pourhomayoun, M.; Dugan, P.; Popescu, M.; Risch, D.; Lewis, H.; Clark, C. Classification for Big Dataset of Bioacoustic Signals Based on Human Scoring System and Artificial Neural Network. In Proceedings of the ICML 2013 Workshop on Machine Learning for Bioacoustics, Atlanta, GA, USA, 16–21 June 2010. [Google Scholar]
- Karthikeyan, P.; Murugappan, M.; Yaacob, S. Detection of human stress using short-term ECG and HRV signals. J. Mech. Med. Biol. 2013, 13. [Google Scholar] [CrossRef] [Green Version]
- Neuman, M.R. Biomedical Sensors. In Sensors, Nanoscience, Biomedical Engineering, and Instruments (The Electrical Engineering Handbook), 3rd ed.; Dorf, R.C., Ed.; CRC Press: Boca Raton, FL, USA, 2006; Chapter 8; pp. 8.1–8.11. ISBN 9780849373466. [Google Scholar]
- Selye, H. Stress and the general adaptation syndrome. Br. Med J. 1950, 1, 1383–1392. [Google Scholar] [CrossRef] [PubMed] [Green Version]
- Godoy, L.D.; Rossignoli, M.T.; Delfino-Pereira, P.; Garcia-Cairasco, N.; de Lima Umeoka, E.H. A Comprehensive Overview on Stress Neurobiology: Basic Concepts and Clinical Implications. Front. Behav. Neurosci. 2018, 12. [Google Scholar] [CrossRef] [Green Version]
- Tan, S.Y.; Yip, A. Hans Selye (1907–1982): Founder of the stress theory. Singap. Med J. 2018, 59, 170–171. [Google Scholar] [CrossRef]
- Picard, R.W. Automating the Recognition of Stress and Emotion: From Lab to Real-World Impact. IEEE Multim. 2016, 23, 3–7. [Google Scholar] [CrossRef]
- De Santos, A.; Sánchez-Avila, C.; Guerra-Casanova, J.; Bailador-Del Pozo, G. Real-Time Stress Detection by Means of Physiological Signals. In Recent Application in Biometrics; Yang, J., Poh, N., Eds.; IntechOpen: London, UK, 2011; pp. 23–44. Available online: https://www.intechopen.com/books/recent-application-in-biometrics/hand-biometrics-in-mobile-devices (accessed on 29 November 2020). [CrossRef] [Green Version]
- Schmidt, P.; Reiss, A.; Dürichen, R.; Laerhoven, K.V. Wearable-Based Affect Recognition-A Review. Sensors 2019, 19, 4079. [Google Scholar] [CrossRef] [Green Version]
- Seshadri, D.R.; Li, R.T.; Voos, J.E.; Rowbottom, J.R.; Alfes, C.M.; Zorman, C.A.; Drummond, C.K. Wearable sensors for monitoring the physiological and biochemical profile of the athlete. NPJ Digit. Med. 2019, 2. [Google Scholar] [CrossRef] [Green Version]
- Can, Y.S.; Chalabianloo, N.; Ekiz, D.; Ersoy, C. Continuous stress detection using wearable sensors in real life: Algorithmic programming contest case study. Sensors 2019, 19, 1849. [Google Scholar] [CrossRef] [Green Version]
- Kappenman, E.S.; Luck, S.J. The effects of electrode impedance on data quality and statistical significance in ERP recordings. Psychophysiology 2010, 47, 888–904. [Google Scholar] [CrossRef] [Green Version]
- Cruz-Garza, J.G.; Brantley, J.A.; Nakagome, S.; Kontson, K.; Megjhani, M.; Robleto, D.; Contreras-Vidal, J.L. Deployment of Mobile EEG Technology in an Art Museum Setting: Evaluation of Signal Quality and Usability. Front. Hum. Neurosci. 2017, 11. [Google Scholar] [CrossRef] [PubMed]
- Wijsman, J.; Grundlehner, B.; Liu, H.; Penders, J.; Hermens, H. Wearable physiological sensors reflect mental stress state in office-like situations. In Proceedings of the 2013 Humaine Association Conference on Affective Computing and Intelligent Interaction (ACII), Geneva, Switzerland, 2–5 September 2013; pp. 600–605. [Google Scholar] [CrossRef]
- Sharma, N.; Gedeon, T. Hybrid Genetic Algorithms for Stress Recognition in Reading, Evolutionary Computation. In Proceedings of the 11th European conference on Evolutionary Computation, Machine Learning and Data Mining in Bioinformatics, Vienna, Austria, 3–5 April 2013. [Google Scholar] [CrossRef]
- Hernandez, J.; Morris, R.; Picard, R.W. Call Center Stress Recognition with Person-Specific Models. In ACII 2011, Part I, LNCS 6974; D´Mello, S., Ed.; Springer: Berlin/Heidelberg, Germany, 2011; pp. 125–134. [Google Scholar] [CrossRef] [Green Version]
- D’mello, S.K.; Kory, J. A Review and Meta-Analysis of Multimodal Affect Detection Systems. ACM Comput. Surv. 2015, 47, 43. [Google Scholar] [CrossRef]
- Chinazzo, G.; Wienold, J.; Andersen, M. Daylight affects human thermal perception. Sci. Rep. 2019, 9, 1–15. [Google Scholar] [CrossRef] [PubMed]
- Luck, S.J. An Introduction to the Event-Related Potential Technique; The MIT Press: Cambridge, MA, USA, 2005; ISBN 978-0-262-12277-1. [Google Scholar]
- Stone, J.L.; Hughes, J.R. Early History of Electroencephalography and Establishment of the American Clinical Neurophysiology Society. J. Clin. Neurophysiol. 2013, 30, 28–44. [Google Scholar] [CrossRef] [PubMed]
- Yao, Y.; Lian, Z.; Liu, W.; Jiang, C.; Liu, Y.; Lu, H. Heart rate variation and electroencephalograph—The potential physiological factors for thermal comfort study. Indoor Air 2009, 19, 93–101. [Google Scholar] [CrossRef] [PubMed]
- Abo-Zahhad, M.; Ahmed, S.; Abbas, S.N. A New EEG Acquisition Protocol for Biometric Identification Using Eye Blinking Signals. Int. J. Intell. Syst. Appl. 2015, 7, 48–54. [Google Scholar] [CrossRef] [Green Version]
- Cohen, M.X. Analyzing Neural Time Series Data: Theory and Practice; The MIT Press: Cambridge, MA, USA, 2014; ISBN 9780262019873. [Google Scholar]
- Thakor, N.V.; Tong, S. Advances in quantitative electroencephalogram analysis methods. Annu. Rev. Biomed. Eng. 2004, 6, 453–495. [Google Scholar] [CrossRef]
- Wang, X.; Nie, D.; Lu, B. Emotional state classification from EEG data using machine learning approach. Neurocomputing 2014, 129, 94–106. [Google Scholar] [CrossRef]
- Klimesch, W. EEG alpha and theta oscillations reflect cognitive and memory performance: A review and analysis. Brain Res. Rev. 1999, 29, 169–195. [Google Scholar] [CrossRef]
- Nyhus, E.; Curran, T. Functional role of gamma and theta oscillations in episodic memory. Neurosci. Biobehav. Rev. 2010, 34, 1023–1035. [Google Scholar] [CrossRef] [Green Version]
- Jensen, O.; Gips, B.; Bergmann, T.O.; Bonnefond, M. Temporal coding organized by coupled alpha and gamma oscillations prioritize visual processing. Trends Neurosci. 2014, 37, 357–369. [Google Scholar] [CrossRef] [PubMed]
- Doesburg, S.M.; Roggeveen, A.B.; Kitajo, K.; Ward, L.M. Large-scale gamma-band phase synchronization and selective attention. Cereb. Cortex 2008, 18, 386–396. [Google Scholar] [CrossRef] [PubMed] [Green Version]
- Hamid, N.H.A.; Sulaiman, N.; Murat, Z.H.; Taib, M.N. Brainwaves stress pattern based on perceived stress scale test. In Proceedings of the IEEE 6th Control and System Graduate Research Colloquium (ICSGRC), Shah Alam, Malaysia, 10–11 August 2015; pp. 135–140. [Google Scholar] [CrossRef]
- Davidson, R.J.; Ekman, P.; Saron, C.D.; Senulis, J.A.; Friesen, W.V. Approach-withdrawal and cerebral asymmetry: Emotional expression and brain physiology. J. Personal. Soc. Psychol. 1990, 58, 330–341. [Google Scholar] [CrossRef]
- Saeed, S.M.U.; Anwar, S.M.; Khalid, H.; Majid, M.; Bagci, U. EEG Based Classification of Long-Term Stress Using Psychological Labeling. Sensors 2020, 20, 1886. [Google Scholar] [CrossRef] [PubMed] [Green Version]
- Mulders, D.; De Bodt, C.; Lejeune, N.; Courtin, A.; Liberati, G.; Verleysen, M.; Mouraux, A. Dynamics of the perception and EEG signals triggered by tonic warm and cool stimulation. PLoS ONE 2020, 15. [Google Scholar] [CrossRef] [PubMed]
- Islam, M.K.; Rastegarnia, A.; Yang, Z. Methods for artifact detection and removal from scalp EEG: A review. Neurophysiol. Clin. Clin. Neurophysiol. 2016, 46, 287–305. [Google Scholar] [CrossRef]
- Singh, Y.N.; Singh, S.K.; Ray, A.K. Bioelectrical Signals as Emerging Biometrics: Issues and Challenges. ISRN Signal Process. 2012, 1–13. [Google Scholar] [CrossRef] [Green Version]
- Manriquez, A.; Zhang, Q.; Médigue, C.; Papelier, Y.; Sorine, M. Multi-lead T wave end detection based on statistical hypothesis testing. IFAC Proc. Vol. 2006, 39, 93–98. [Google Scholar] [CrossRef]
- Malik, M.; Camm, A.J. Heart Rate Variability. Clin. Cardiol. 1990, 13, 570–576. [Google Scholar] [CrossRef]
- McCraty, R.; Shaffer, F. Heart Rate Variability: New Perspectives on Physiological Mechanisms, Assessment of Self-regulatory Capacity, and Health risk. Glob. Adv. Health Med. 2015, 4, 46–61. [Google Scholar] [CrossRef] [Green Version]
- Acharya, U.R.; Joseph, K.P.; Kannathal, N.; Lim, C.; Suri, J. Heart rate variability: A review. Med Biol. Eng. Comput. 2006, 44, 1031–1051. [Google Scholar] [CrossRef] [PubMed]
- Shaffer, F.; Ginsberg, J.P. An Overview of Heart Rate Variability Metrics and Norms. Front. Public Health 2017, 5, 1–17. [Google Scholar] [CrossRef] [Green Version]
- Faurholt-Jepsen, M.; Kessing, L.V.; Munkholm, K. Heart rate variability in bipolar disorder: A systematic review and meta-analysis. Neurosci. Biobehav. Rev. 2017, 73, 68–80. [Google Scholar] [CrossRef] [PubMed]
- Zhu, H.; Wang, H.; Liu, Z.; Li, D.; Kou, G.; Li, C. Experimental study on the human thermal comfort based on the heart rate variability (HRV) analysis under different environments. Sci. Total Environ. 2018, 616–617, 1124–1133. [Google Scholar] [CrossRef] [PubMed]
- Liu, W.; Lian, Z.; Liu, Y. Heart rate variability at different thermal comfort levels. Eur. J. Appl. Physiol. 2008, 103, 361–366. [Google Scholar] [CrossRef] [PubMed]
- Hjortskov, N.; Rissén, D.; Blangsted, A.K.; Fallentin, N.; Lundberg, U.; Søgaard, K. The effect of mental stress on heart rate variability and blood pressure during computer work. Eur. J. Appl. Physiol. 2004, 92, 84–89. [Google Scholar] [CrossRef] [PubMed]
- Nkurikiyeyezu, K.N.; Suzuki, Y.; Lopez, G.F. Heart rate variability as a predictive biomarker of thermal comfort. J. Ambient Intell. Humaniz. Comput. 2018, 9, 1465–1477. [Google Scholar] [CrossRef]
- Fernandeza, S.; Lázaroa, I.; Arnaiza, A.; Calis, G. Application of heart rate variability for thermal comfort in office buildings in real-life conditions Santiago. In Proceedings of the Creative Construction Conference, Ljubljana, Slovenia, 30 June–3 July 2018; pp. 798–805. [Google Scholar] [CrossRef]
- Melillo, P.; Bracale, M.; Pecchia, L. Nonlinear Heart Rate Variability features for real-life stress detection. Case study: Students under stress due to university examination. Biomed. Eng. Online 2011, 10, 96. [Google Scholar] [CrossRef] [Green Version]
- Filingeri, D. Neurophysiology of Skin Thermal Sensations. Compr. Physiol. 2016, 6, 1429. [Google Scholar] [CrossRef] [Green Version]
- Cho, D.; Ham, J.; Oh, J.; Park, J.; Kim, S.; Lee, N.K.; Lee, B. Detection of stress levels from biosignals measured in virtual reality environments using a kernel-based extreme learning machine. Sensor 2017, 17, 2435. [Google Scholar] [CrossRef]
- Li, D.; Menassa, C.C.; Kamat, V.R. Non-intrusive interpretation of human thermal comfort through analysis of facial infrared thermography. Energy Build. 2018, 176, 246–261. [Google Scholar] [CrossRef]
- Yao, Y.; Lian, Z.; Liu, W.; Shen, Q. Experimental Study on Skin Temperature and Thermal Comfort of the Human Body in a Recumbent Posture under Uniform Thermal Environments. Indoor Built Environ. 2007, 16, 505–518. [Google Scholar] [CrossRef]
- Choi, J.; Loftness, V. Investigation of human body skin temperatures as a bio-signal to indicate overall thermal sensations. Build. Environ. 2012, 58, 258–269. [Google Scholar] [CrossRef]
- Sim, S.Y.; Koh, M.J.; Joo, K.M.; Noh, S.; Park, S.; Kim, Y.H.; Park, K.S. Estimation of Thermal Sensation Based on Wrist Skin Temperatures. Sensors 2016, 16, 420. [Google Scholar] [CrossRef] [PubMed] [Green Version]
- Zhai, J.; Barreto, A.; Chin, C.; Li, C. Realization of stress detection using psychophysiological signals for improvement of human-computer interactions. In Proceedings of the IEEE SoutheastCon, Ft. Lauderdale, FL, USA, 8–10 April 2005; pp. 415–420. [Google Scholar] [CrossRef]
- Angus, F.; Zhai, J.; Barreto, A. Front-end analog pre-processing for real-time psychophysiological stress measurements. In Proceedings of the 9th World Multi-Conference on Systemics, Cybernetics and Informatics (WMSCI 05), Orlando, FL, USA, 10–13 July 2005; pp. 218–221. [Google Scholar]
- Topoglu, Y.; Watson, J.; Suri, R.; Ayaz, H. Electrodermal activity in ambulatory settings: A narrative review of literature. Adv. Intell. Syst. Comput. 2020, 953, 91–102. [Google Scholar] [CrossRef]
- Jung, C.G. Studies in Word-association: Experiments in the Diagnosis of Psychopathological Conditions carried out at the Psychiatric Clinic of the University of Zurich; Moffat, Yard & Company: New York, NY, USA, 1906. [Google Scholar] [CrossRef]
- Bakker, J.; Pechenizkiy, M.; Sidorova, N. What’s your current stress level? Detection of stress patterns from GSR sensor data. In Proceedings of the 2011 IEEE 11th International Conference on Data Mining Workshops (ICDMW), Washington, DC, USA, 11–14 December 2011; pp. 573–580. [Google Scholar] [CrossRef]
- Johannes, S.; Rüdiger, P.; Marc, S.; Manfred, R. Towards Flexible Mobile Data Collection in Healthcare. In Proceedings of the 29th IEEE International Symposium on Computer-Based Medical Systems (CBMS), Dublin, Ireland, 20–24 June 2016; pp. 181–182. [Google Scholar] [CrossRef]
- Zangróniz, R.; Martínez-Rodrigo, A.; Pastor, J.M.; López, M.T.; Fernández-Caballero, A. Electrodermal activity sensor for classification of calm/distress condition. Sensors 2017, 17, 2324. [Google Scholar] [CrossRef] [PubMed] [Green Version]
- Stephens, M.A.; Wand, G. Stress and the HPA axis: Role of glucocorticoids in alcohol dependence. Alcohol Res. Curr. Rev. 2012, 34, 468–483, Corpus ID: 142581511. [Google Scholar]
- Smith, S.M.; Vale, W.W. The role of the hypothalamic-pituitary-adrenal axis in neuroendocrine responses to stress. Dialogues Clin. Neurosci. 2006, 8, 383–395. [Google Scholar] [CrossRef]
- Oswald, L.M.; Zandi, P.; Nestadt, G.; Potash, J.B.; Kalaydjian, A.E.; Wand, G.S. Relationship between cortisol responses to stress and personality. Neuropsychopharmacology 2006, 31, 1583–1591. [Google Scholar] [CrossRef] [Green Version]
- Lee, D.Y.; Kim, E.; Choi, M.H. Technical and clinical aspects of cortisol as a biochemical marker of chronic stress. BMB Rep. 2015, 48, 209–216. [Google Scholar] [CrossRef] [Green Version]
- Stalder, T.; Kirschbaum, C. Analysis of cortisol in hair—State of the art and future directions. Brainbehav. Immun. 2012, 26, 1019–1029. [Google Scholar] [CrossRef] [PubMed]
- Schweiker, M. Rethinking resilient comfort—Definitions of resilience and comfort and their consequences for design, operation, and energy use. In 11th Windsor Conference on Thermal Comfort 2020: Resilient Comfort; Roaf, S., Nicol, F., Finlayson, W., Eds.; Ecohouse Initiative Ltd.: Oxford, UK, 2020; pp. 34–46. [Google Scholar]
Publisher’s Note: MDPI stays neutral with regard to jurisdictional claims in published maps and institutional affiliations. |
© 2021 by the authors. Licensee MDPI, Basel, Switzerland. This article is an open access article distributed under the terms and conditions of the Creative Commons Attribution (CC BY) license (http://creativecommons.org/licenses/by/4.0/).
Share and Cite
Persiani, S.G.L.; Kobas, B.; Koth, S.C.; Auer, T. Biometric Data as Real-Time Measure of Physiological Reactions to Environmental Stimuli in the Built Environment. Energies 2021, 14, 232. https://doi.org/10.3390/en14010232
Persiani SGL, Kobas B, Koth SC, Auer T. Biometric Data as Real-Time Measure of Physiological Reactions to Environmental Stimuli in the Built Environment. Energies. 2021; 14(1):232. https://doi.org/10.3390/en14010232
Chicago/Turabian StylePersiani, Sandra G. L., Bilge Kobas, Sebastian Clark Koth, and Thomas Auer. 2021. "Biometric Data as Real-Time Measure of Physiological Reactions to Environmental Stimuli in the Built Environment" Energies 14, no. 1: 232. https://doi.org/10.3390/en14010232
APA StylePersiani, S. G. L., Kobas, B., Koth, S. C., & Auer, T. (2021). Biometric Data as Real-Time Measure of Physiological Reactions to Environmental Stimuli in the Built Environment. Energies, 14(1), 232. https://doi.org/10.3390/en14010232