Abstract
Sugar has the potential to create enough energy to power mobile electronics. Various sugar-powered fuel cells have been reported, however, most of them used pure glucose as substrate and enzymes/noble metals as catalysts. In this work, an alkaline fuel cell with cheap catalysts were constructed, and different sweet drinks were used as fuels for power generation. The influence of different substrates on the electrochemical performance was characterized under the controlled conditions. Our experimental results showed that the fuel cell fueled with carbonated soft drinks had the best performance under the conditions of 99.95 g/L chemical oxygen demand and 3M KOH. The power densities of the fuel cell fueled with different substrates decreased in the order of Pepsi (33.41 W/m2) > Sprite (28.38 W/m2) > apple juice (20.63 W/m2) > Coca (16.31 W/m2) > pear juice (15.31 W/m2) > orange juice (12.75 W/m2), which was consistent with linear sweep voltammetry (LSV) and electrochemical impedance spectroscopy (EIS) analysis. This is the first report on alkaline fuel cell (AFC) performance using different sweet drinks as substrate. These values are more than 10 times higher than those of reported microbial fuel cells. Our findings demonstrated that sweet drinks fueled alkaline fuel cells can be a promising energy source for low-power electronics.
1. Introduction
Low power electronics are progressing at an accelerated pace, however, powering those systems still poses a significant challenge. Among various power sources, fuel cell has proven to be a good choice [1,2]. In fuel cells, chemical energy of a fuel is converted into electricity via electrochemical reactions. The fuel cell uses catalysts to speed up these reactions in a similar way that our body uses enzymes to convert food into energy. As ubiquitous sustainable chemicals in nature, sugars have been applied as fuels for fuel cells and exhibited great potential to power portable devices [3,4,5]. For example, glucose can be oxidized into carbon dioxide, and one molecule can release 24 electrons after complete oxidation, in which 2.87 × 10⁶ J/mol of energy can be generated [6,7].
There are many advantages of using sugars as fuel. Firstly, sugars, such as glucose and sucrose, are readily available, inexpensive, non-toxic. Secondly, sugars are sustainable and can be easily produced under natural environment. Most fruits grow rapidly, have a high biomass, and contain large amounts of carbohydrates and fibers which can be further converted to glucose. Birkhed et al. [8] summarized the total concentration of fruit juices, and identified that fructose, glucose, and sucrose accounted 4.4%, 3.0% and 1.9%, respectively (Table 1). In industrial production, glucose can be produced by hydrolysis of starch or cellulose with hydrochloric acid or dilute sulfuric acid. Besides supermarket fruit juices, carbonated soft drinks can also be used as substrates for fuel cells. Carbonated drinks normally contain 10% sugar, which can replenish energy for the human body [9]. Birkhed et al. [8] summarized the total concentration of carbonated drinks, and identified that fructose, glucose, and sucrose accounted 1.1%, 1.0% and 7.4%, respectively (Table 1). Organic wastes generated from food industries and fruit processing plants are other sources of sugars. These wastes can provide large amounts of low-cost sugars [10]. Many papers reported that fruit juice wastewater could be used as a new alternative energy. Provera et al. [11] reported a sugar-air alkaline fuel cell for power extraction from raw juice of papaya or fruit waste, and the coulombic efficiency achieved 37%. Gonzalez et al. [12] found that fruit juice wastewater was useful for hydrogen production and the produced hydrogen gas could be used to generate electricity by using a high temperature proton exchange membrane fuel cell. Therefore, sugar-based electrochemical energy could be explored as a sustainable energy resource for remote or underdeveloped regions that need cheap electricity without complicated infrastructure. However, most of reported sugar-based fuel cell used pure glucose as substrate and enzymes or noble metals were generally used as catalysts [13,14]. The high cost of enzymes/catalysts and limited fuel sources limited the practical development of sugar-based fuel cell.

Table 1.
Sugar content of fruit juices, fruit drinks, carbonated beverages and sport drinks [8].
In this work, we focus on (1) exploring the possibilities of generating electricity from fruit juices and carbonated drinks by using an alkaline fuel cell (AFC); (2) comparing the performance of AFC fueled with different sweet drinks under the catalysis of low-cost transitional metal catalysts. To the best of our knowledge, this is the first study that use of sweet drinks as substrate for electricity generation by an AFC. Fuel cell with nonprecious catalysts will be a promising energy source for low-power electronics. Furthermore, the AFC technology studied in this work can convert chemical energy stored in food wastes into useful electricity directly, which can benefit the sustainable development of our society.
2. Materials and Methods
2.1. Materials
Fresh fruits and carbonated drinks were purchased from the local store (Tianjin, China, Figure 1). Fruits included pears, apples, and oranges with defective, and carbonated drinks included Coca-Cola, Pepsi and Sprite. Fresh fruits were cleaned, squeezed, and filtered without adding any other substances, then all the filtrates were transferred into glass bottles, and stored in a 4 °C refrigerator.
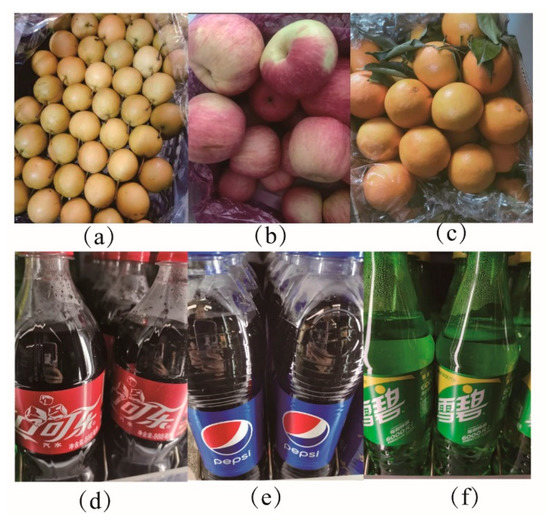
Figure 1.
The sweet drink materials tested in this work. (a) pears; (b) apple; (c) oranges; (d) Coca-Cola; (e) Pepsi; (f) Sprite.
2.2. Sample Preparation
The chemical oxygen demand (COD) of sweet drinks were determined by using a DR2000 spectrophotometer (Hach Company, Loveland, CO, USA) [15]. Moreover, to ensure the same amount of organics was added into the AFC, the sweet drinks were diluted with distilled water into substrate solutions with same COD value (99.95 g/L).
2.3. Characterization and Electrochemical Analysis
The single-chamber AFC (Figure 2) was fabricated of polymethyl methacrylate (PMMA). It consisted of a methyl viologen/activated carbon/Ni (MV/AC/Ni) anode [16], a Cu2O-Cu composite air-cathode and a cylindrical internal chamber (14 mL).
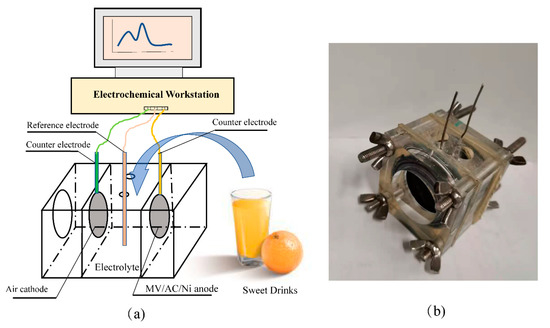
Figure 2.
Schematic diagram (a) and photograph (b) of the AFC used in this study.
2.3.1. Linear Sweep Voltammetry (LSV) Analysis
Electrochemical characterizations, including LSV and electrochemical impedance spectroscopy (EIS) were conducted on an electrochemical workstation (CHI 660E, Shanghai, China). Three electrode system was employed including a working electrode, a platinum plate as counter electrode, and an Hg/HgO electrode as reference electrode. All analyses were carried out in 3M KOH solution under ambient conditions [17]. Open circuit voltage (OCV) values were collected on a multichannel data collector (MPS-010601, MPS Electronics, Beijing, China) after the output voltages of the AFCs were stable, and then LSV and EIS were tested. For LSV, the initial scanning potential was set as OCV, and the termination potential and scanning rate was set as −0.2 V and 1 mV/s, respectively. For EIS, the potential was set as OCV, the frequency scanning range and disturbance current amplitude was set as 10 mHz to100 kHz and 10 mV, respectively. R(CR)(CR) model of the equivalent circuit was selected for fitting of the EIS data by using ZSimpWin software (Princeton Applied Research, Oak Ridge, TN, USA).
2.3.2. Polarization Curves and Power Density Tests
Polarization curves and power density tests were conducted to reflect the power generation capacity of the fuel cell and determine the performance difference between the different electrodes in the fuel cell. A resistance box, a Hg/HgO reference electrode and a multimeter were connected to the fuel cell and the voltage changes were recorded by changing the value of the external resistance from 9000 to 3 Ω.
3. Results and Discussion
3.1. The COD Values and Sugar Contents of Different Sweet Drinks
Table 2 shows the COD and sugar contents of different sweet drinks. Carbonate beverages had COD values with a small variation range from 141.15 g/L to 145.3 g/L. However, the fruit juice drinks have a great difference on that with 175.3 g/L for pear juice and 99.95 g/L for orange juice. The total sugar contents of the sweet drinks have a similar trend with 10.6–11.2 g/100 mL for carbonate beverages and 8.9–12.3 g/100 mL for juice drinks. To keep the performance result comparable, all the samples for the following tests were diluted to a same COD value of 99.95 g/L.
Table 2.
Characteristics of sweet drinks and carbonate beverages used in this study.
3.2. LSV Analysis
Table 3 and Figure 3 shows the LSV curves of the MV/AC/Ni anode in different sweet drinks. By comparing the current density of the same anode in three different juice drinks, it can be found that the MV/AC/Ni anode showed excellent electrochemical properties with juices as substrates in the potential range of −0.6 to −0.35 V (vs. Hg/HgO). Precisely, apple juice as substrate had the highest current density compared with others. At the potential of −0.35 V, the current density of the anode with apple juice as substrate reached 19.94 A cm−2, which was 1.25 times higher than that with pear juice (15.92 A cm−2) and 1.38 times higher than that with orange juice (14.41 A cm−2), respectively. Moreover, the open-circuit potentials were −0.76 V (apple), −0.71V (pear) and −0.65 V (orange), respectively. These results demonstrated the MV/AC/Ni anode had enhanced electrocatalytic capacities in apple juice. These results were supposed related to the compositions of the three fruits, such as sugar content and acidity. Karadeniz et al. [18] investigated 51 authentic apple juice samples from Amasya, and found that the average glucose, fructose, sucrose, and total sugar content was 18.81, 80.88, 29.61 and 129.3 g/L. Yao et al. [19] et al. did the identical survey on 98 pear cultivars, and stated that the average glucose and fructose was 18.16 and 51.17 mg/g, which accounted for 17.14% and 48.29% of total sugar. Obviously, compared the average content of reducing sugar between apple and pear, apple normally contains higher sugar than pear. Coincidentally, Li et al. [20] studied the variety of sugar in 12 fruits and demonstrated that the content of reducing sugar and soluble sugar in apple (7.64%; 10.22%) was much higher than that in orange (3.4%; 3.93%). Therefore, although all the samples were diluted to the same COD, sugar contents, especially reducing sugar, which is the major substrate to be oxidized in AFC, determine the performance.
Table 3.
Maximum current and open circuit potential of the AFC anode with different sweet drinks as substrate.
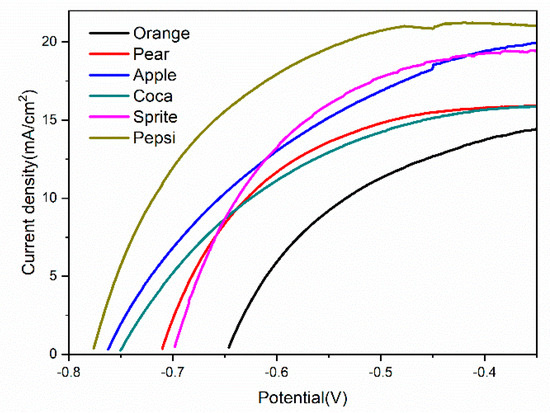
Figure 3.
LSV curves of the AFC anode with different sweet drinks as substrate.
Among three carbonated drinks, Pepsi had the highest current density comparing with others. At the potential of –0.35 V, the current density of Pepsi reached 21.03 A/cm2, followed by Sprite (19.43 A/cm2) and Coca Cola (15.90 A/cm2). Comparing the current density between juice and carbonated drinks, it’s obvious that carbonated drinks always had better performance. What’s more, the current density of Pepsi was higher than that of apple juice, and orange juice was still the lowest. According to a survey of 903 beverage samples, Deng et al. [21] drew the conclusion that carbonated drinks had a high sugar content, reached up to 13.6 g/100 mL and 60%. Hashem et al. [22] assessed the free sugars in carbonated sugar-sweetened beverages and highlighted the performance of Coca Cola with an average sugar content of 35 g/330 mL. Therefore, high content of sugar in carbonated drinks is one reason for their super performance.
3.3. EIS Analysis
EIS tests were employed to study the influence of different substates on the impedance of the ohmic resistance. Figure 4 shows the Nyquists plot for different samples. The total resistance in the equivalent circuit consists of ohmic resistance (Rs), layer capacitance (Cdl), charge transfer resistance (Rct), pore adsorption capacitance (Cad) and diffusion resistance (Rd). In particular, the total ohmic resistance (Rt) of the anode inside the fuel cell system is the sum of Rs, Rct, and Rd. Consequently, the calculated resistances of all the anodes were summarized in Table 4. By comparing with Rct, it could be seen that carbonate drinks had a value between 0.1–0.25 Ω, while the values of juice drinks were higher (0.2–0.52 Ω). Moreover, the average Rt values of the anode in different sweet drinks were different, which were about 1.58 Ω and 2.0 Ω for carbonated drinks and juice beverages, respectively. Figure 4a,b show the Nyquist plots of the AFC filled with fruit juices and carbonated drinks, respectively.
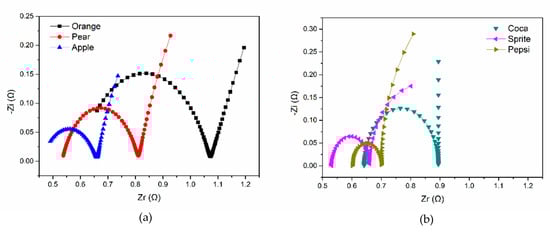
Figure 4.
EIS Nyquist plots of the AFC anode with different sweet drinks as substrate (a) juice drinks: orange, pear and apple; (b) carbonate beverages: Coca, Sprite and Pepsi.
Table 4.
EIS fitting results of the AFC anode with different sweet drinks as substrate based on the equivalent circuit.
Fuel cell resistance can be affected by many factors, for example, conductivity and surface area of electrodes, and electrolyte in the chamber. In the case of the same electrodes, electrolyte will play an important role. For example, to investigate the influence of different electrolyte concentration on electrical resistance, Schulte et al. [23] designed an experiment with different NaCl concentrations and demonstrated the choice of electrolyte solution influenced the resistance values of the samples. Eldarrat et al. [24] came to the same conclusion afterwards. Friebe et al. [25] also reported that the specific membrane resistances are strikingly affected by the electrolyte solution. In addition, Harker et al. [26] had successively measured the electrochemical changes during the ripening process in persimmon and nectarine fruit, and reported that the lower resistance was observed after five weeks. Coincidentally, Varlan et al. [27] analyzed the impedance of apples and tomatoes, and found the resistance is connected with sugar content. Compared with juice drinks, carbonate drinks generally have lower resistance. Generally, smaller electrochemical impedance in the fuel cell leads to a faster electron transfer on the electrode. Therefore, the fuel cell filled with carbonated drinks had a better electrochemical performance, which was consistent with the LSV analysis result.
3.4. Comparison of Power Densities
A series of power density measurements were performed in the AFC filled with different substrates. Figure 5 shows the polarization curves and power density plots of the same fuel cell fueled with different sweet drinks under the condition of 3 M KOH. The fuel cell performed excellently for all the six sweet drinks. The maximum power density of 33.41 W/m2 and 28.38 W/m2 were obtained when Pepsi and Sprite were filled, which is almost 1.6 and 1.4 times higher than the AFC filled with apple juice (20.63 W/m2), respectively. The next were those of Coca Cola and pear juice, which obtained the maximum power density of 16.31 W/m2 and 15.31 W/m2, the maximum current density of 67.37 W/m2 and 69.14 W/m2, and OCV of 0.72 V and 0.67 V, respectively. And the orange juice AFC produced the worst performance among all the AFC, which had the maximum power density of 12.75 W/m2. The power densities of the fuel cell filled with six sweet drinks were much higher than that of our previous test with pure glucose as substrate (9.590 W/m2) [28], implying that there were some other reducing substances, besides sugars, existed in the soft drinks. These reducing substances could also be oxidized and released electrons in the AFC [29].
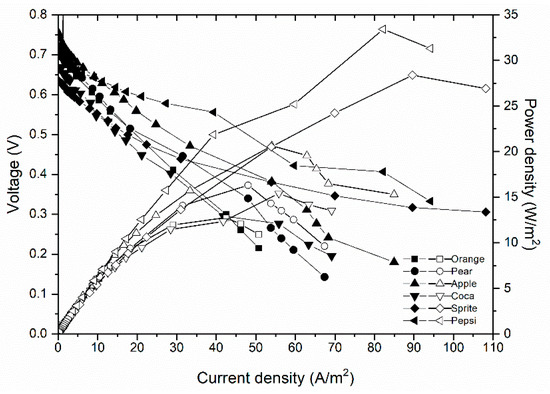
Figure 5.
Power density and cell voltage curves of the alkaline fuel cell filled with different sweet drinks.
Figure 6 shows the polarization curves of both the cathodes and the anodes of the AFC filled with different drinks. It can be seen that the AFC performance mainly depended on the anode potentials because the cathode potentials remained almost overlapped during the polarization process. This result demonstrated that the performance of the air cathode was not affected significantly by the different sweet drinks. On the contrary, the anode performance was considerably affected. The test results of the power density and polarization curve indicated that the all the six drinks can release their stored chemical energy into electrical energy. The reason for Pepsi and Sprite, representing carbonate beverages, performed better than other sweet drinks under the same COD concentration may be follows: the former two drinks contained more reducing chemicals, and are easy to be oxidized. Boulton et al. [30] studied the sugar content in three kinds of drinks and identified that juice drinks contained the lowest amount of sugar, with 5.6 g/100 mL. Boulton et al. [30] studied the sugar content in three kinds of drinks, and identified that juice drinks had the lowest content of sugar (5.6 g/100 mL). However, most of carbonate beverages contained an average amount of total sugars (fructose, glucose, and sucrose) of 9.5% [8]. It can be speculated that sugar concentration and composition are correlated with fuel cell performance. What’s more, the maximum power density of 33.41 W/m2 was over 10 times higher than traditional microbial fuel cell (MFC). For example, Luo et al. [31] studied the electricity generation in a microbial fuel cell using yogurt wastewater and showed the maximum power density reached 1.043 W/m2. Tian et al. [32] utilized the MFC electrogenesis to improve wastewater treatment, which had a maximum power density of 2.18 W/m3. Glucose is a kind of cheap and readily available fuel, which is ubiquitous in nature and our daily life. Especially, in the food processing industry, a large amount of wastewater with high sugar content is discharged every day, which can be utilized as a resource. Many reports have been conducted on the use of fruit juice, especially wastewater with high sugar content, as a fuel for fuel cell [11,12,33,34,35]. The results from this study can be used as a starting point to conduct in-depth studies on how to utilize these sugar-containing sweet drinks and sugar waste. Therefore, the sugar containing substances are feasible to be used to generate power and have great potentials to power portable devices. Figure 7 demonstrates the changes of power densities of the AFC fueled with different sweet drinks and their total sugar contents. As can be seen, there is no linear relationship between the performance and the total sugar content. These phenomena may be due to the different oxidation capacity of different sugars and various other reducing substances existed in the sweet drinks, beside sugars.
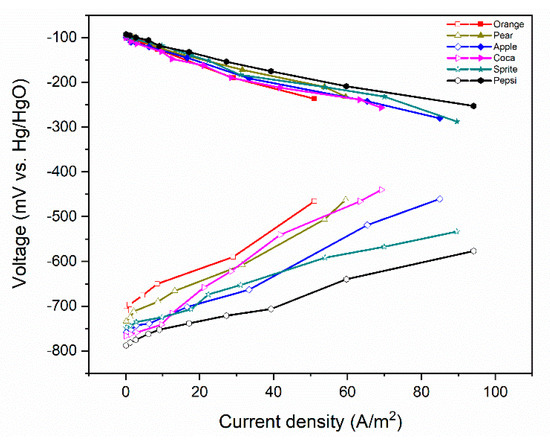
Figure 6.
Cathode and anode polarization curves of the alkaline fuel cell filled with different sweet drinks.
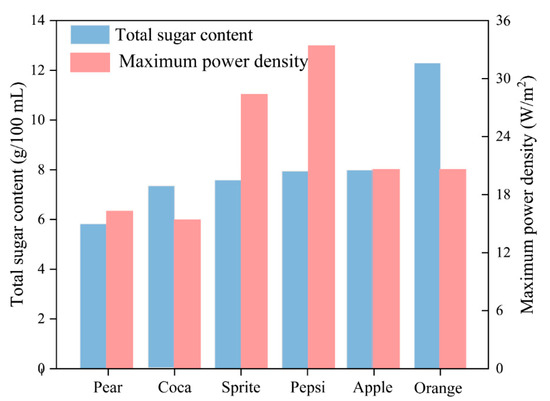
Figure 7.
Power densities of the AFC fueled with different sweet drinks and their total sugar contents.
It needs to be mentioned that the performance of the sweet drinks-fueled AFCs can be further improved by modifying the anode catalyst. Many approaches have been reported to improve anode catalytic ability. Au/MnO2-C anode catalyst has been used in a direct glucose AFC and a maximum power density of 1.1 mW cm2 was obtained, which is much higher than conventional catalyst [36]. Pasta et al. [37] also identified that gold deposited on carbon cloth can be a very promising catalyst for glucose electro-oxidation. Moreover, Vaze et al. [38] reported a stable and effective bioanode by covalently linking glucose oxidase to carbon nanotubes, which boosts electron transfer.
In this work, different kinds of sweet drinks were chosen as substrate instead of pure glucose. The performances of AFC fueled with different sweet drinks were compared by electrochemical characterizations. The performance data confirmed the feasibility of using sweet drinks as fuels for fuel cells. However, there are still many aspects need to be concerned in the future studies. Firstly, the stability and longevity of the fuel cell can be impacted by the complex components in the sweet drinks. Generally, there are many chemical components in the sweet drinks, and some of them are intentionally added for good taste and appearance, such as sweetening agents, antioxidants, and pigments. Secondly, precipitation of potassium carbonate can also reduce the longevity of the AFC. In the air cathode, precipitation of potassium carbonate will reduce concentration of OH- and retard the oxygen transport to the catalyst sites. For the practical application, the AFC needs a system that enables removal of CO2 from air or operates with other types of cathodes. In addition, long time operation may lead to increased polarization and internal resistance, which impair the AFC performance. Moreover, catalyst poisoning may occur by formation of large amount of intermediate oxidation products, which raises the occupied catalytic sites and leading to catalyst deactivation [39]. All these issues and the underlying mechanisms merit further study.
4. Conclusions
In this study, six sweet drinks were used as substrates for an AFC with a MV/AC/Ni anode and a Cu2O-Cu composite air-cathode. The performances of AFC fueled with different sweet drinks were compared by electrochemical characterizations. The LSV analysis showed that current density with Pepsi as substrate was the highest, reached 21.03 A/cm2, while orange juice had the lowest value of 14.41 A/cm2. Rct values for the carbonate drinks were between 0.1–0.25 Ω, while these for the juice drinks were higher (0.2–0.52 Ω). Moreover, power density analysis showed Pepsi (33.41 W/m2) > Sprite (28.38 W/m2) > apple juice (20.63 W/m2) > Coca Cola (16.31 W/m2) > pear juice (15.31 W/m2) > orange juice (12.75 W/m2). These values are considerable higher than previous reports, suggesting the feasibility of using sweet drinks as fuels for low power-consuming electronics.
Author Contributions
J.W.: Investigation, Data Curation, and Writen—Original draft. X.Z.: Resources, Investigation and Data Curation. Y.L.: Resources, Investigation and Data Curation. P.L.: Resources, Investigation and Data Curation. X.C.: Methodology and Data Curation. P.Z.: Methodology and Data Curation. Z.W.: Conceptualization and Writing—Review & Editing. X.L.: Conceptualization, Supervision and Writing—Review & Editing. All authors have read and agreed to the published version of the manuscript.
Funding
This research and the APC were partly funded by the National Key Research and Development Program of China (grant number 2017YFA0205102).
Acknowledgments
The authors would like to thank all the laboratory technicians.
Conflicts of Interest
There are no conflicts to declare.
References
- Liu, X.; Dong, F.; Liu, P.; Li, Z.; Tong, Y.D.; Feng, M.N.; Hao, M.Q.; Wang, Y.; Zhang, P.P. Direct Electricity Generation from Dissolved Cellulosic Biomass in an Alkaline Fuel Cell. Fuel Cells 2018, 18, 219–226. [Google Scholar] [CrossRef]
- Trygve, B.; Pascal, G.; Emilio, S.C.; Zia, K.; James, H.M. Alkaline fuel cells contemporary advancement and limitations. Fuel 2002, 81, 2151–2155. [Google Scholar]
- Chen, J.; Zhao, C.X.; Zhi, M.M.; Wang, K.; Deng, L.; Xu, G. Alkaline direct oxidation glucose fuel cell system using silver/nickel foams as electrodes. Electrochim. Acta 2012, 66, 133–138. [Google Scholar] [CrossRef]
- Zhou, D.-L.; Feng, J.-J.; Cai, L.-Y.; Fang, Q.-X.; Chen, J.-R.; Wang, A.-J. Facile synthesis of monodisperse porous Cu2O nanospheres on reduced graphene oxide for non-enzymatic amperometric glucose sensing. Electrochim. Acta 2014, 115, 103–108. [Google Scholar] [CrossRef]
- Priya, S.; Berchmans, S. CuO Microspheres Modified Glassy Carbon Electrodes as Sensor Materials and Fuel Cell Catalysts. J. Electrochem. Soc. 2012, 159, F73–F80. [Google Scholar] [CrossRef]
- Basu, D.; Basu, S. A study on direct glucose and fructose alkaline fuel cell. Electrochim. Acta 2010, 55, 5775–5779. [Google Scholar] [CrossRef]
- Zhao, Y.; Liu, X.; Wang, X.; Zhang, P.; Shi, J. Peony petal-like 3D graphene-nickel oxide nanocomposite decorated nickel foam as high-performance electrocatalyst for direct glucose alkaline fuel cell. Int. J. Hydrogen Energy 2017, 42, 29863–29873. [Google Scholar] [CrossRef]
- Birkhed, D. Sugar Content, Acidity and Effect on Plaque pH of Fruit Juices, Fruit Drinks, Carbonated Beverages and Sport Drinks. Caries Res. 1984, 18, 120–127. [Google Scholar] [CrossRef]
- Azeredo, D.R.; Alvarenga, V.; Sant’Ana, A.S.; Srur, A.U.S. An overview of microorganisms and factors contributing for the microbial stability of carbonated soft drinks. Food Res. Int. 2016, 82, 136–144. [Google Scholar] [CrossRef]
- Cercado-Quezada, B.; Delia, M.-L.; Bergel, A. Testing various food-industry wastes for electricity production in microbial fuel cell. Bioresour. Technol. 2010, 101, 2748–2754. [Google Scholar] [CrossRef]
- Provera, M.; Han, Z.; Liaw, B.; Su, W.W. Communication—Electrochemical Power Generation from Culled Papaya Fruits. J. Electrochem. Soc. 2016, 163, A1457–A1459. [Google Scholar] [CrossRef]
- Del Campo, A.G.; Canizares, P.; Lobato, J.; Rodrigo, M.; Fernandez-Morales, F.J. Electricity production by integration of acidogenic fermentation of fruit juice wastewater and fuel cells. Int. J. Hydrogen Energy 2012, 37, 9028–9037. [Google Scholar] [CrossRef]
- Irfan, M.; Liu, X.; Li, S.; Khan, I.U.; Li, Y.; Wang, J.; Wang, X.; Du, X.; Wang, G.; Zhang, P. High-performance glucose fuel cell with bimetallic Ni–Co composite anchored on reduced graphene oxide as anode catalyst. Renew. Energy 2020, 155, 1118–1126. [Google Scholar] [CrossRef]
- Irfan, M.; Khan, I.U.; Wang, J.; Li, Y.; Liu, X. 3D porous nanostructured Ni3 NeCo3N as a robust electrode material for glucose fuel cell. RSC Adv. 2020, 10, 6444–6451. [Google Scholar] [CrossRef]
- Okan, T.K.; Melis, M.; Münire, S.A.; Celal, F.G. Micropollutants Removal in MBR Reactors: A comperative study. Presented at the 2nd International Conference on Sustainable Solid Waste Management, Athens, Greece, 12 June 2014. [Google Scholar]
- Liu, X.; Li, Z.; Yang, Y.; Liu, P.; Zhang, P. Electricity generation from a refuelable glucose alkaline fuel cell with a methyl viologen-immobilized activated carbon anode. Electrochim. Acta 2016, 222, 1430–1437. [Google Scholar] [CrossRef]
- Sugano, Y.; Latonen, R.-M.; Akieh-Pirkanniemi, M.; Bobacka, J.; Ivaska, A. Electrocatalytic Oxidation of Cellulose at a Gold Electrode. ChemSusChem 2014, 7, 2240–2247. [Google Scholar] [CrossRef]
- Karadeniz, F.; Ekşi, A. Sugar composition of apple juices. Eur. Food Res. Technol. 2002, 215, 145–148. [Google Scholar] [CrossRef]
- Yao, G.; Zhang, S.; Cao, Y.; Liu, J.; Jun, W.U.; Yuan, J.; Zhang, H.; Xiao, C. Characteristics of Components and Contents of Soluble Sugars in Pear Fruits from Different Species. Sci. Agric. Sin. 2010, 43, 4229–4237. [Google Scholar]
- Li, W.S.; Yang, Y.; Lei, S.; Feng, X.Y.; Zhang, C.C.; Yuan, J.J. Study on the Correlation Relationship Between Sweetness and Sucrose, Reducing Sugars, Soluble Sugars in Fruits. North Hortic. 2012, 36, 58–60. [Google Scholar]
- Deng, T.T.; Liang, D.; Li, H.Z.; Qu, P.F.; Han, J.H. Sugar Content in Commercially Available Beverages in China. Food Nutr. China. 2018, 24, 5–8. [Google Scholar]
- Hashem, K.M.; He, F.J.; Jenner, K.H.; MacGregor, G.A. Cross-sectional survey of the amount of free sugars and calories in carbonated sugar-sweetened beverages on sale in the UK. BMJ Open 2016, 6, e010874. [Google Scholar] [CrossRef] [PubMed]
- Schulte, A.G.; Gente, M.; Pieper, K.; Arends, J. The electrical resistance of enamel—Dentine cylinders. Influence of NaCl content in storage solutions. J. Dent. 1998, 26, 113–118. [Google Scholar] [CrossRef]
- Eldarrat, A.H.; High, A.; Kale, G. Influence of sodium chloride content in electrolyte solution on electrochemical impedance measurements of human dentin. Dent. Res. J. 2017, 14, 25–31. [Google Scholar] [CrossRef] [PubMed]
- Friebe, A.; Moritz, W. Influence of electrolyte on electrical properties of thin cellulose acetate membranes. J. Appl. Polym. Sci. 1994, 51, 625–634. [Google Scholar] [CrossRef]
- Harker, F.R.; Forbes, S.K. Ripening and development of chilling injury in persimmon fruit: An electrical impedance study. N. Z. J. Crop. Hortic. Sci. 1997, 25, 149–157. [Google Scholar] [CrossRef]
- Varlan, A.R.; Sansen, W. Nondestructive Electrical Impedance Analysis in Fruit: Normal Ripening and Injuries Characterization. Electro Magnetobiol. 1996, 15, 213–227. [Google Scholar] [CrossRef]
- Liu, P.; Liu, X.; Dong, F.; Lin, Q.; Tong, Y.; Li, Y.; Zhang, P. Electricity generation from banana peels in an alkaline fuel cell with a Cu2O-Cu modified activated carbon cathode. Sci. Total Environ. 2018, 849–856. [Google Scholar] [CrossRef] [PubMed]
- Liu, S.; Liu, X.; Wang, Y.; Zhang, P. Electricity generation from macroalgae Enteromorpha prolifera hydrolysates using an alkaline fuel cell. Bioresour. Technol. 2016, 222, 226–231. [Google Scholar] [CrossRef]
- Boulton, J.; Hashem, K.; Jenner, K.; Bromley, H.; Lloyd-Williams, F.; Capewell, S. OP52 How much sugar is hidden in drinks marketed to children? J. Epidemiol. Community Health 2015, 69, A31–A32. [Google Scholar] [CrossRef]
- Luo, H.; Xu, G.; Lu, Y.; Liu, G.; Zhang, R.; Li, X.; Zheng, X.; Yu, M. Electricity generation in a microbial fuel cell using yogurt wastewater under alkaline conditions. RSC Adv. 2017, 7, 32826–32832. [Google Scholar] [CrossRef]
- Tian, Y.; Li, H.; Li, L.; Su, X.; Lu, Y.; Zuo, W.; Zhang, J. In-situ integration of microbial fuel cell with hollow-fiber membrane bioreactor for wastewater treatment and membrane fouling mitigation. Biosens. Bioelectron. 2015, 64, 189–195. [Google Scholar] [CrossRef] [PubMed]
- Jaime, H.R.; David, O.D.; Diana, M.; Juvenal, R.R.; Juan, M.; Andres, D.; Diana, D.; Rosario, G. and Hilda, E. A paper-based microfluidic fuel cell using soft drinks as a renewable energy source. Energies 2020, 13, 2443. [Google Scholar]
- Liu, W.; Gong, Y.; Wu, W.; Yang, W.; Liu, C.; Deng, Y.; Chao, Z.-S. Efficient Biomass Fuel Cell Powered by Sugar with Photo- and Thermal-Catalysis by Solar Irradiation. ChemSusChem 2018, 11, 2229–2238. [Google Scholar] [CrossRef] [PubMed]
- Wen, D.; Xu, X.; Dong, S. A single-walled carbon nanohorn-based miniature glucose/air biofuel cell for harvesting energy from soft drinks. Energy Environ. Sci. 2011, 4, 1358–1363. [Google Scholar] [CrossRef]
- Li, L.; Scott, K.; Yu, E.H. A direct glucose alkaline fuel cell using MnO2–carbon nanocomposite supported gold catalyst for anode glucose oxidation. J. Power Source 2013, 221, 1–5. [Google Scholar] [CrossRef]
- Pasta, M.; La Mantia, F.; Ruffo, R.; Peri, F.; Della Pina, C.; Mari, C. Optimizing operating conditions and electrochemical characterization of glucose–gluconate alkaline fuel cells. J. Power Source 2011, 196, 1273–1278. [Google Scholar] [CrossRef]
- Vaze, A.; Hussain, N.; Tang, C.; Leech, D.; Rusling, J. Biocatalytic anode for glucose oxidation utilizing carbon nanotubes for direct electron transfer with glucose oxidase. Electrochem. Commun. 2009, 11, 2004–2007. [Google Scholar] [CrossRef]
- Ross, P.N. Deactivation and poisoning of fuel cell catalysts, revision. In Proceedings of the International Symposium on Catalyst Deactivation and Poisoning, Berkeley, CA, USA, 19 June 1985. [Google Scholar]
Publisher’s Note: MDPI stays neutral with regard to jurisdictional claims in published maps and institutional affiliations. |
© 2021 by the authors. Licensee MDPI, Basel, Switzerland. This article is an open access article distributed under the terms and conditions of the Creative Commons Attribution (CC BY) license (http://creativecommons.org/licenses/by/4.0/).