The Analysis of the Factors Determining the Choice of Park and Ride Facility Using a Multinomial Logit Model


Abstract
1. Introduction
2. Review of the Scientific Literature in the Field of P&R Facility User Behavior Modeling Techniques and the Factors Influencing the Choice of P&R Facility during the Journey
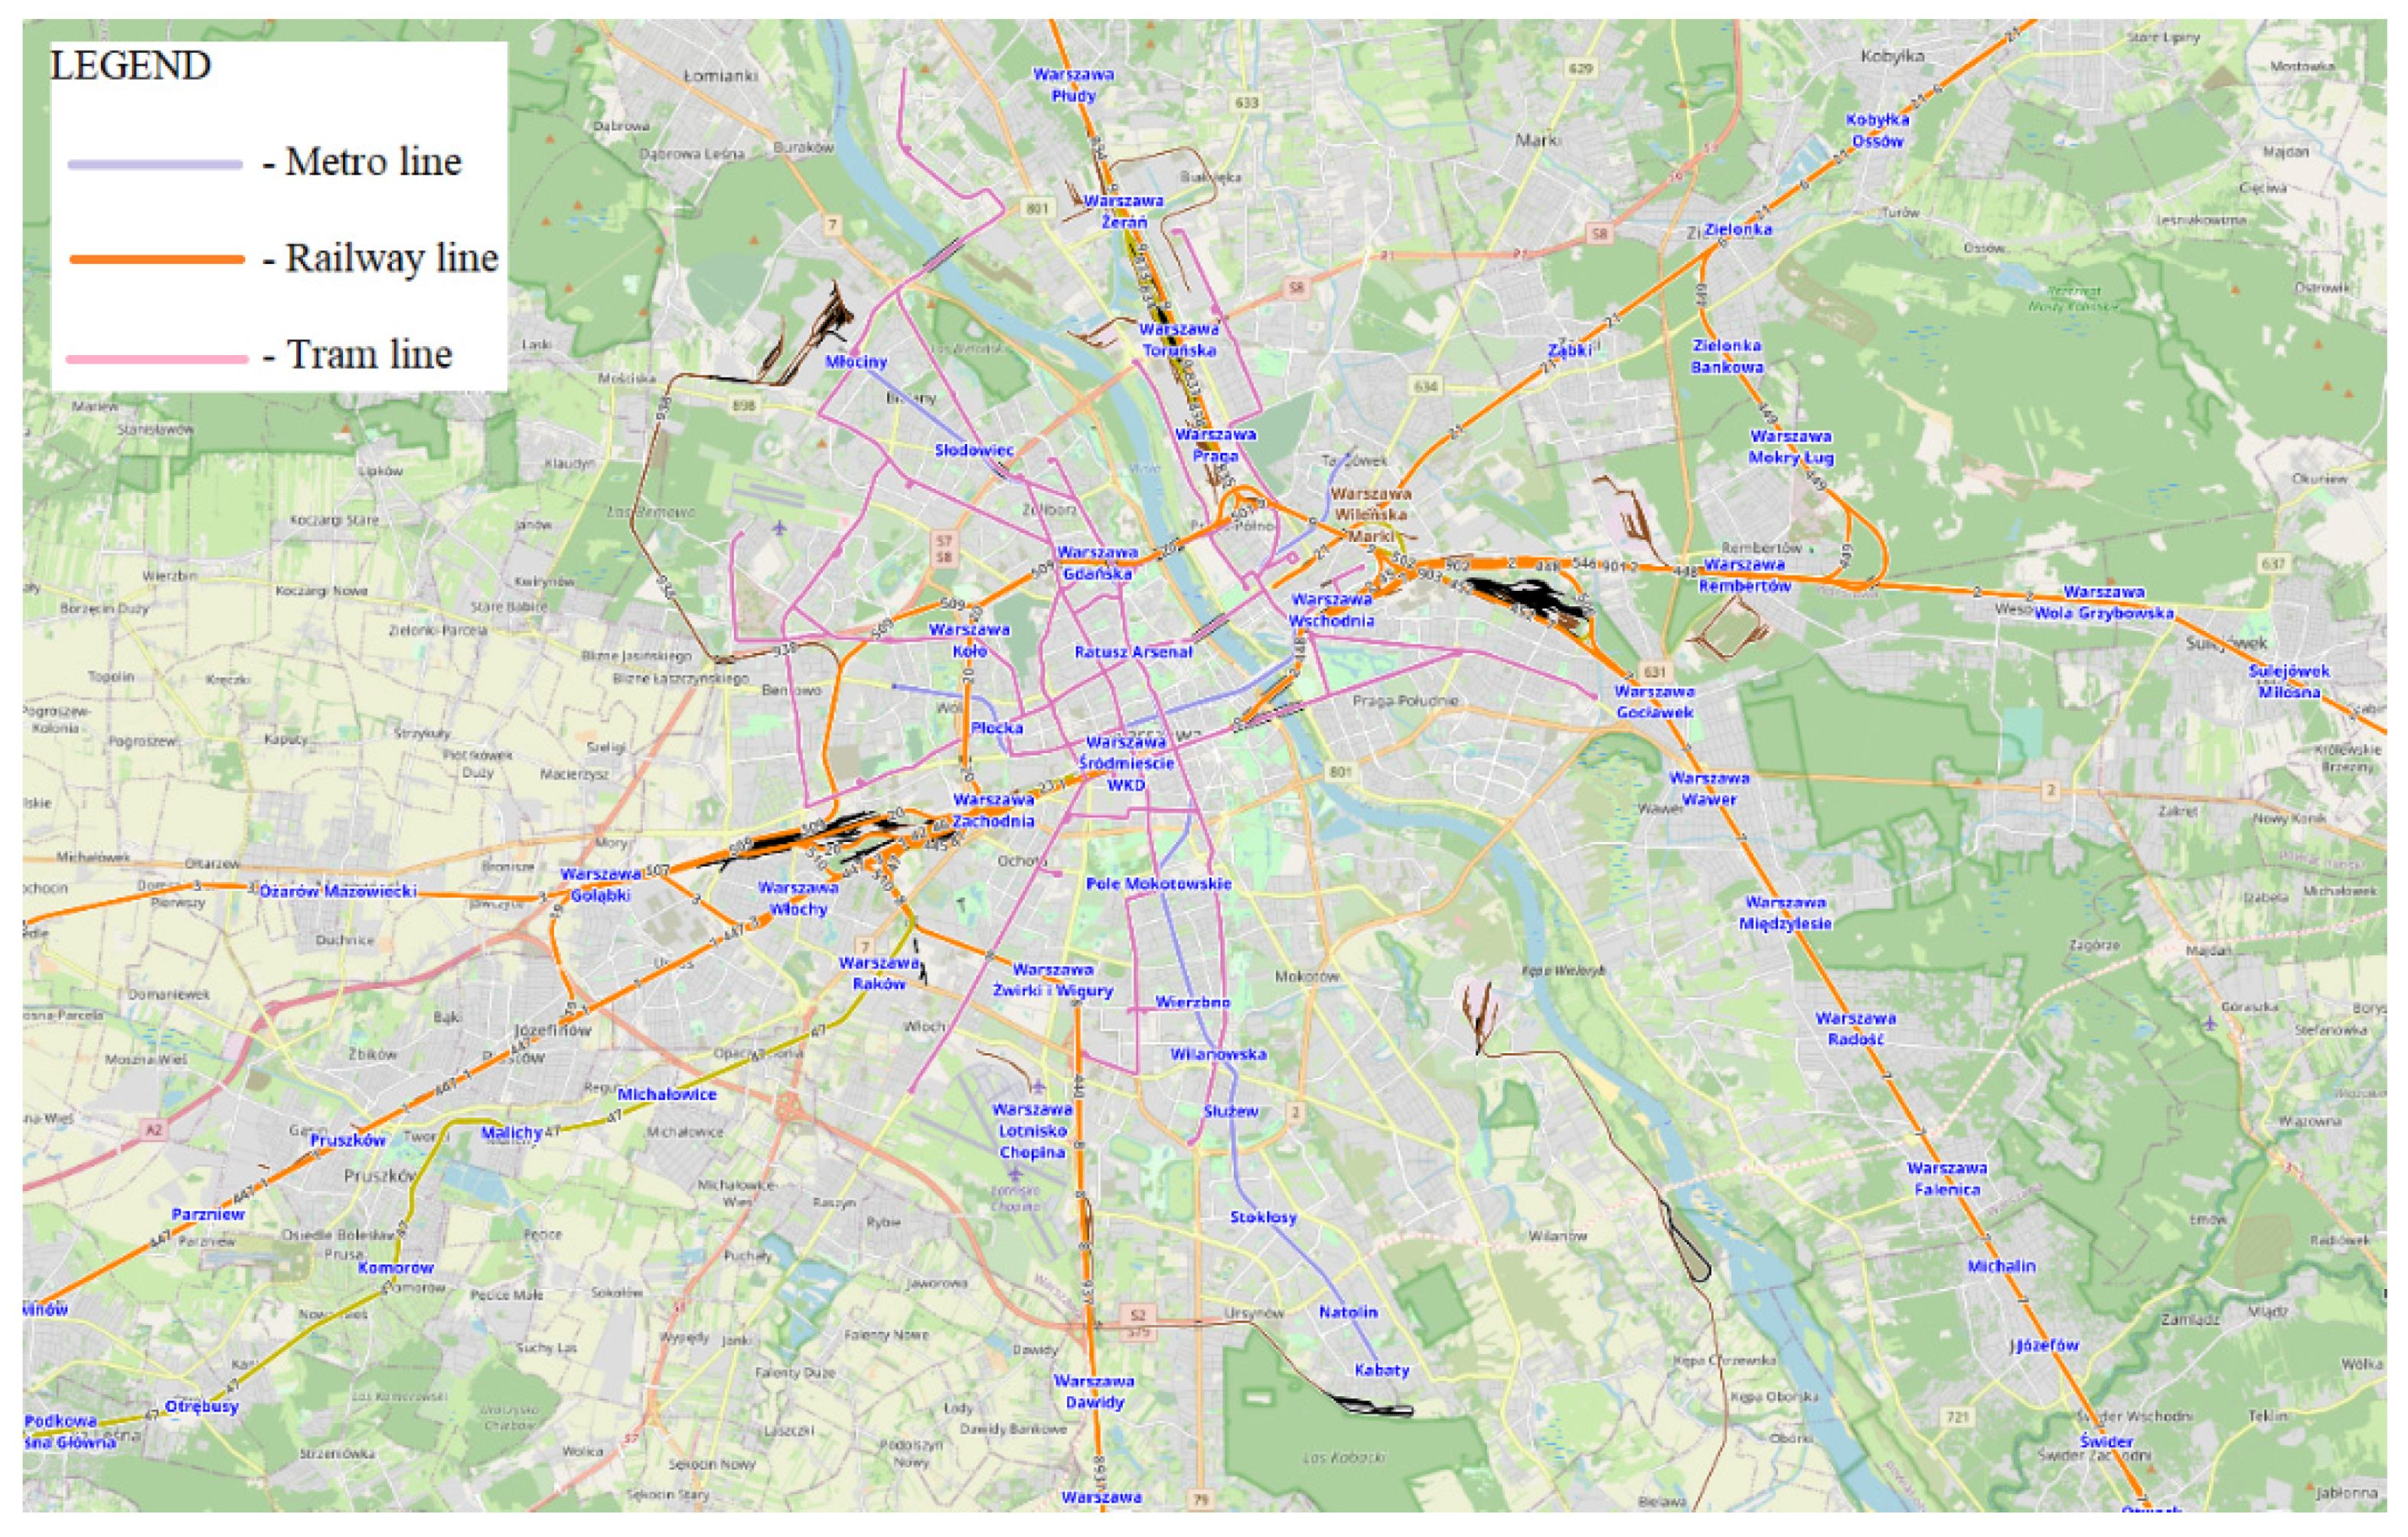
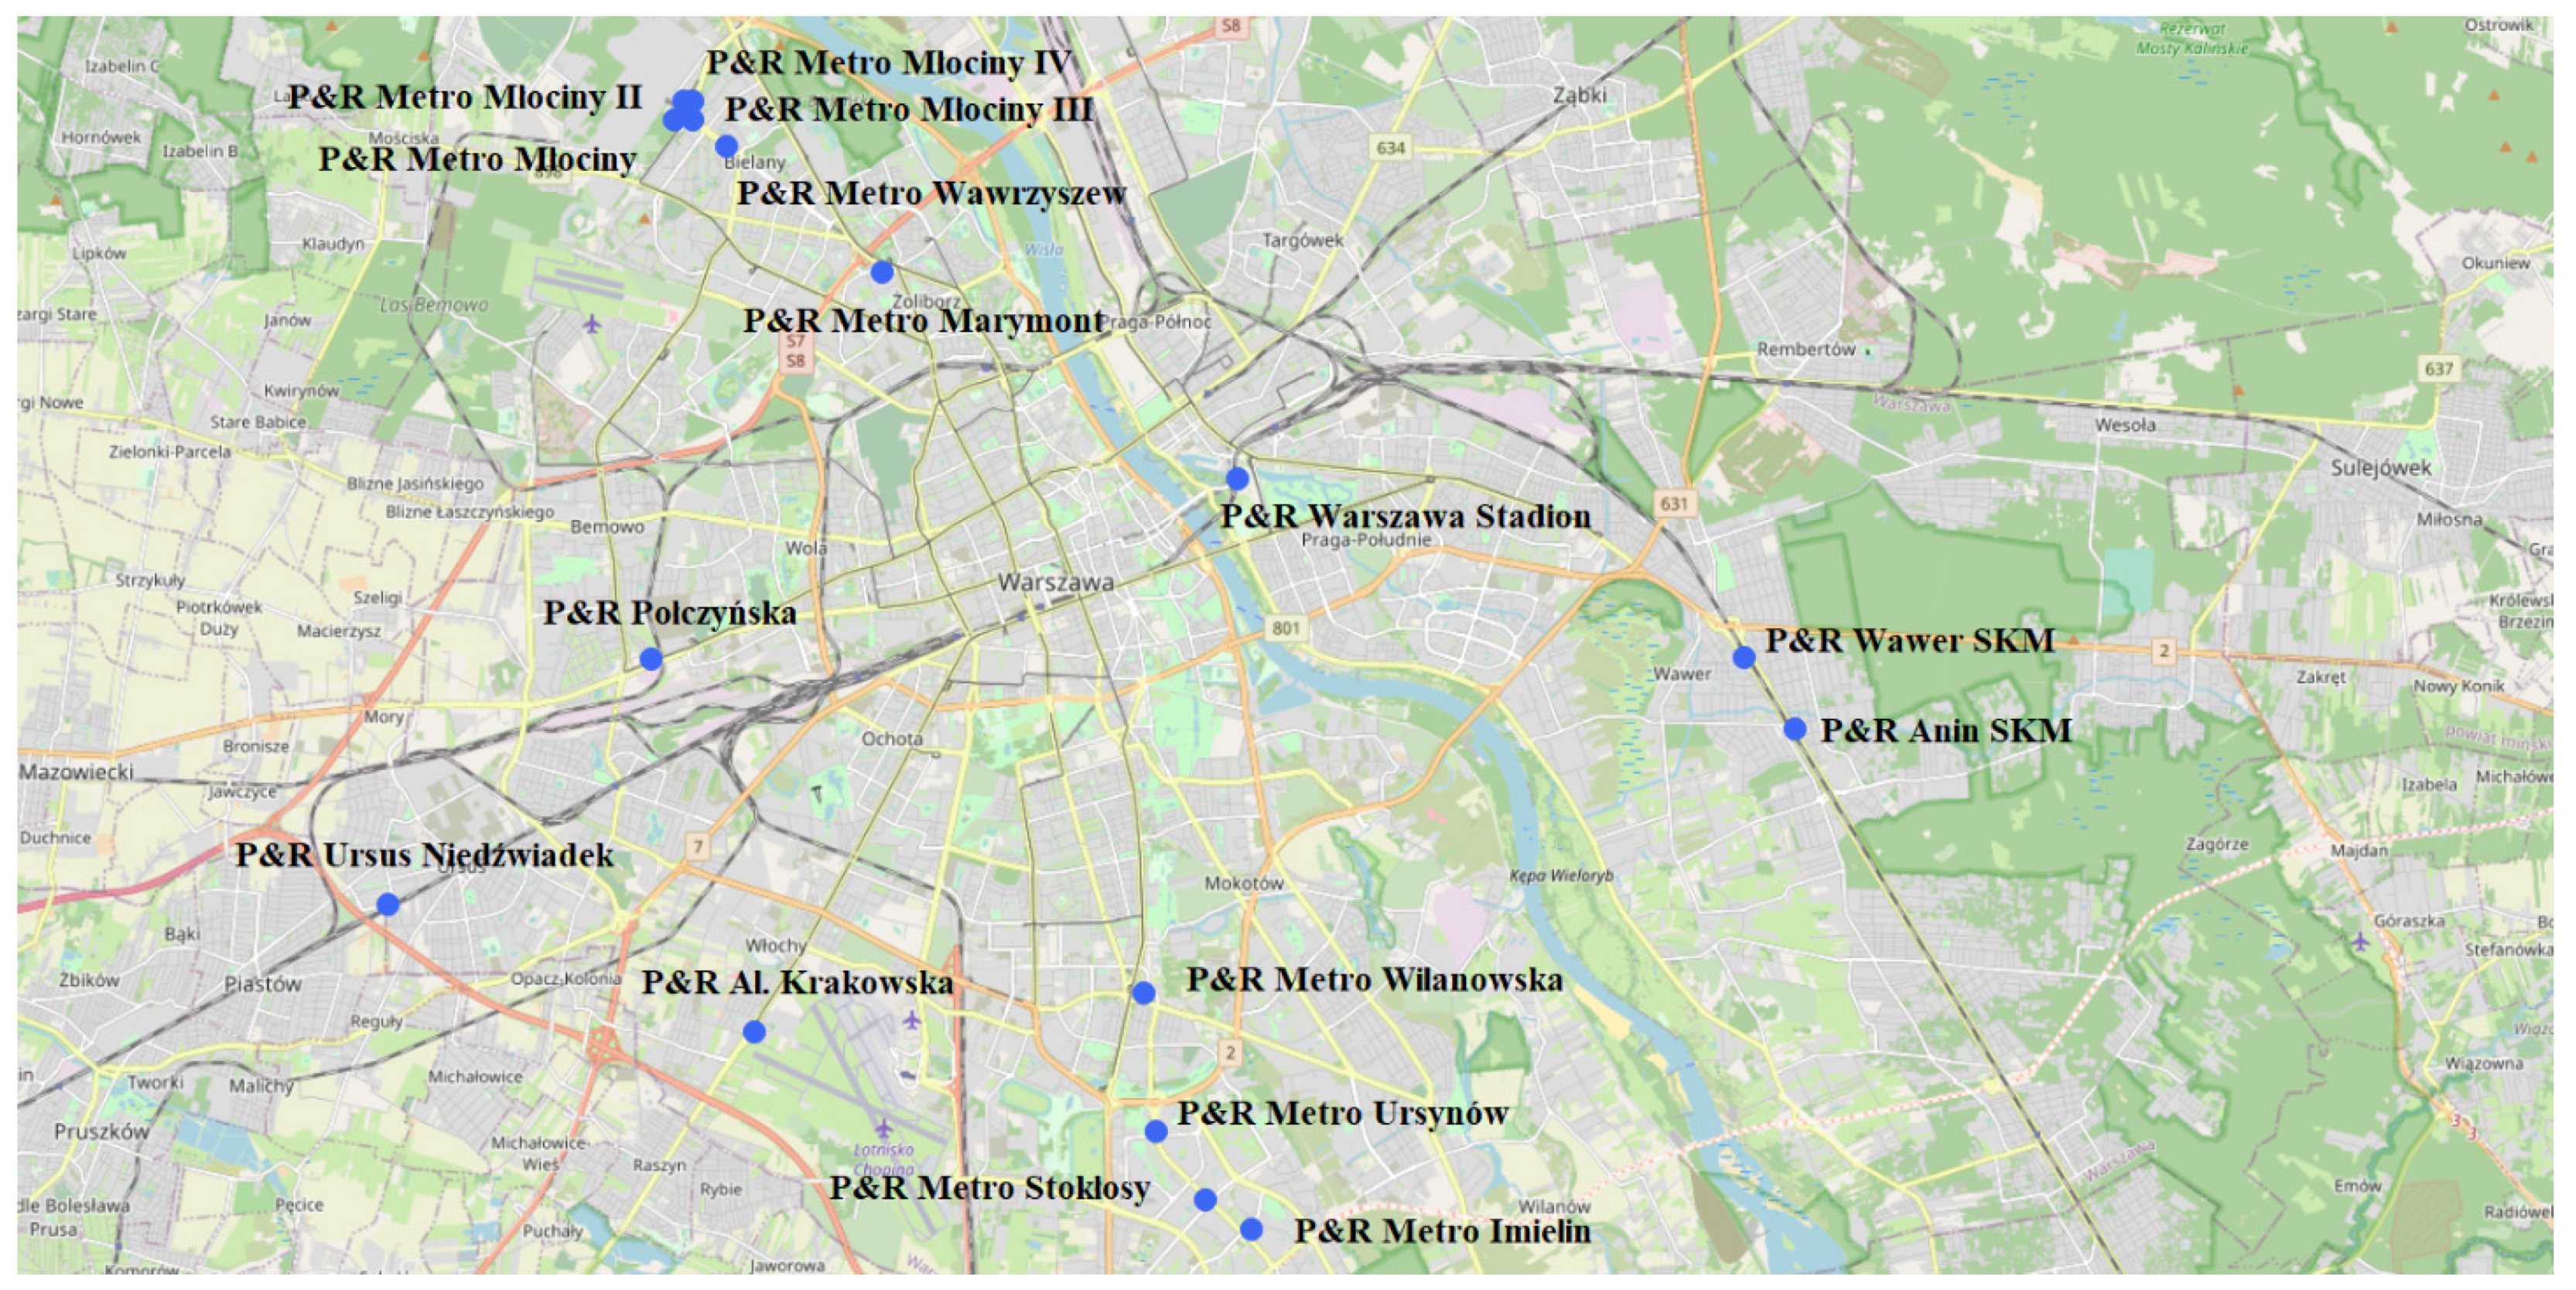
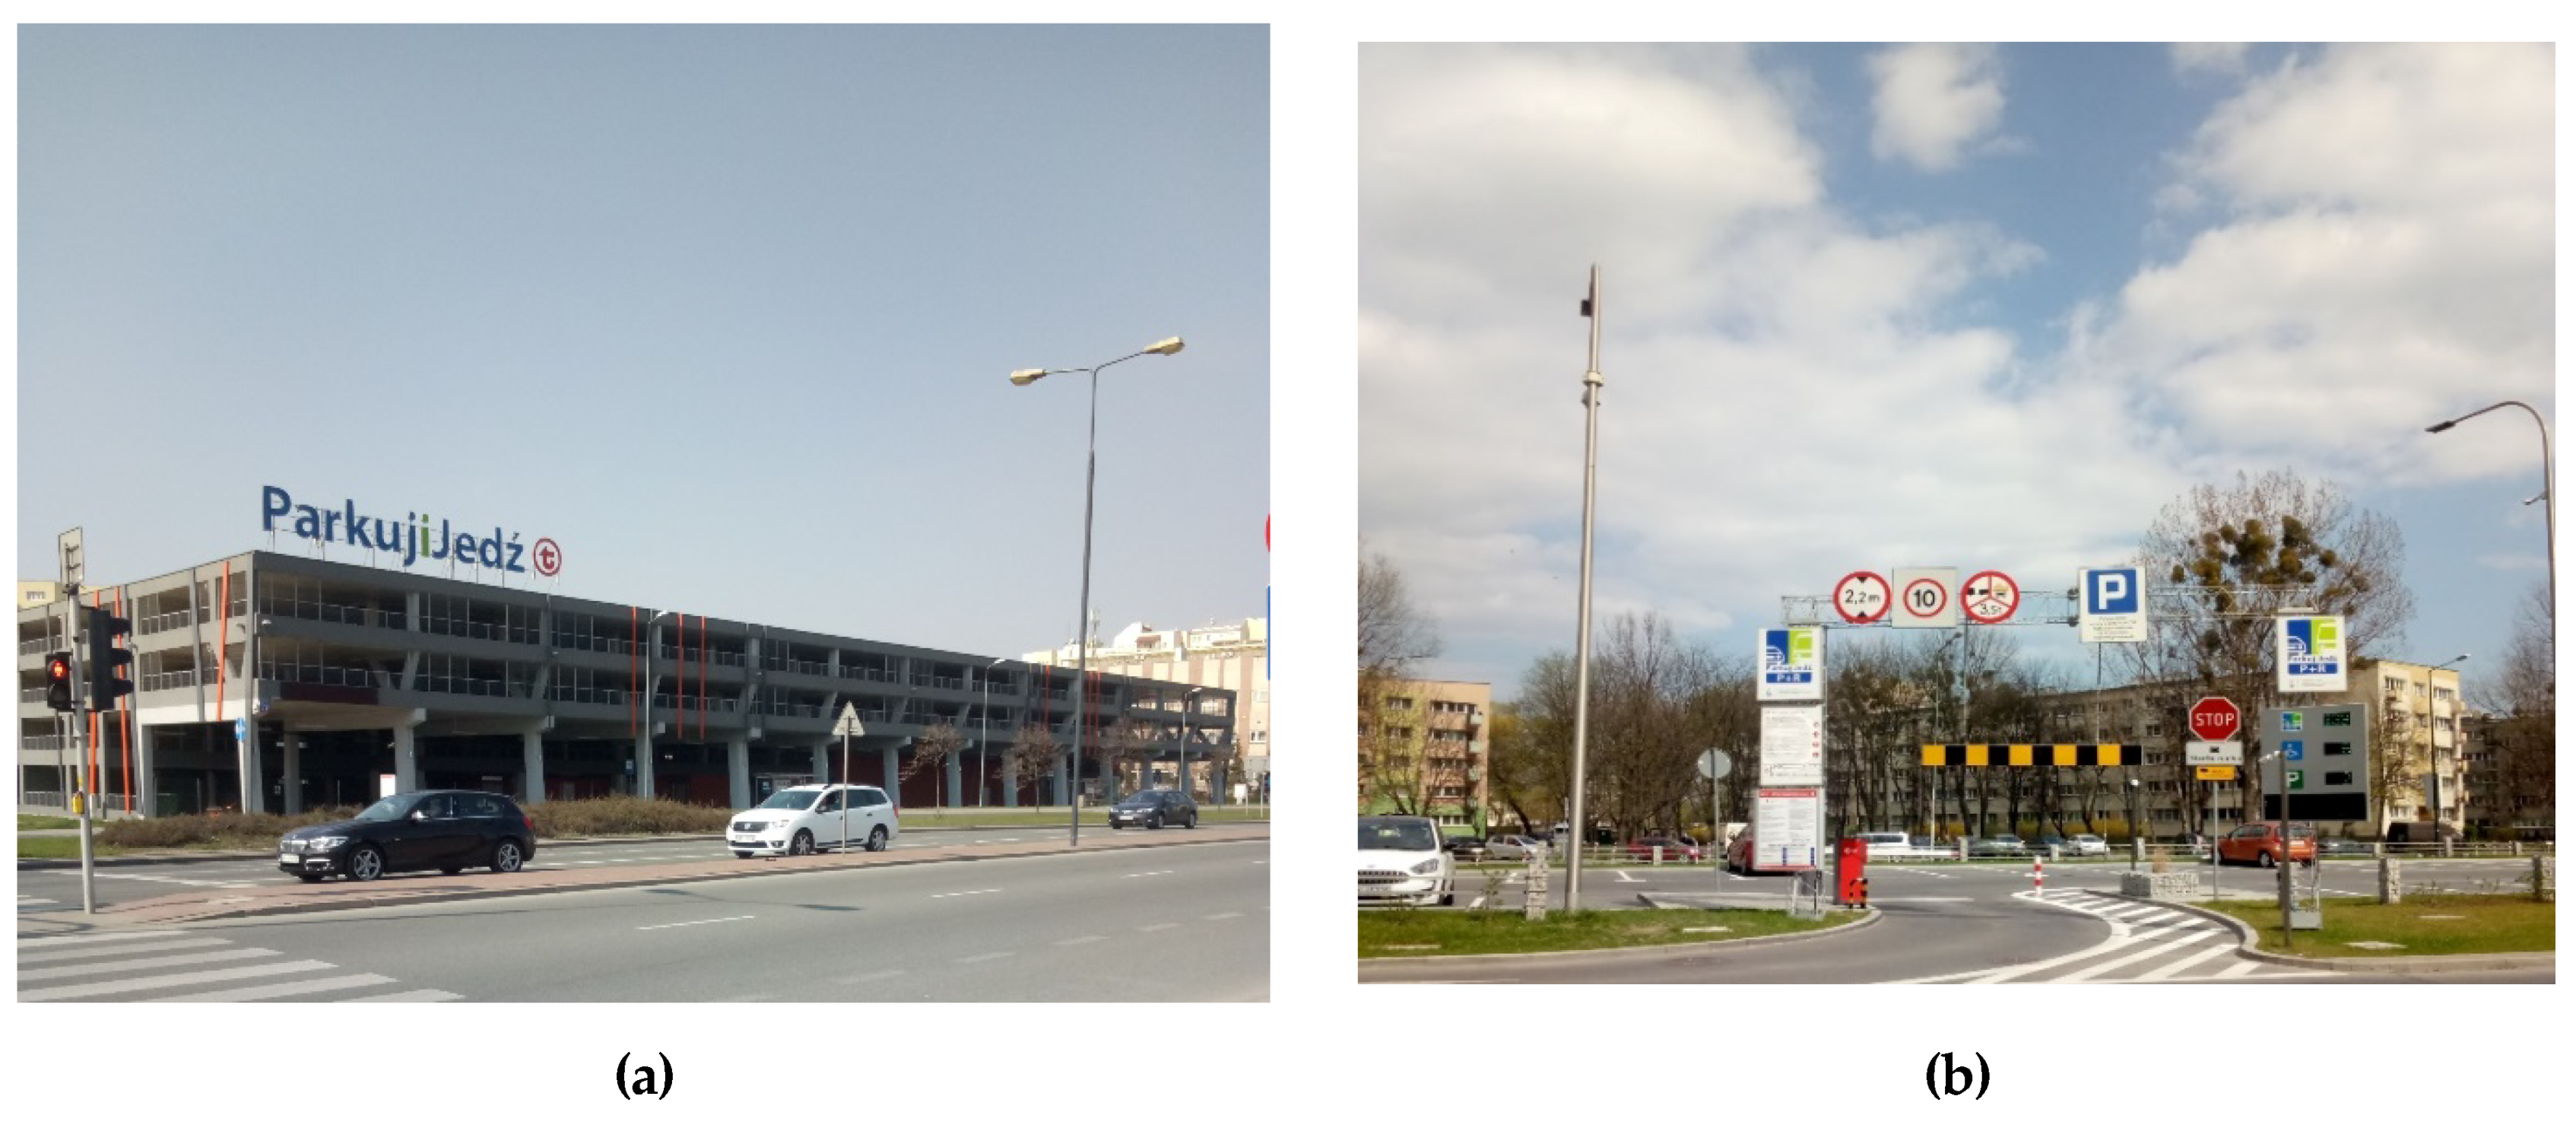
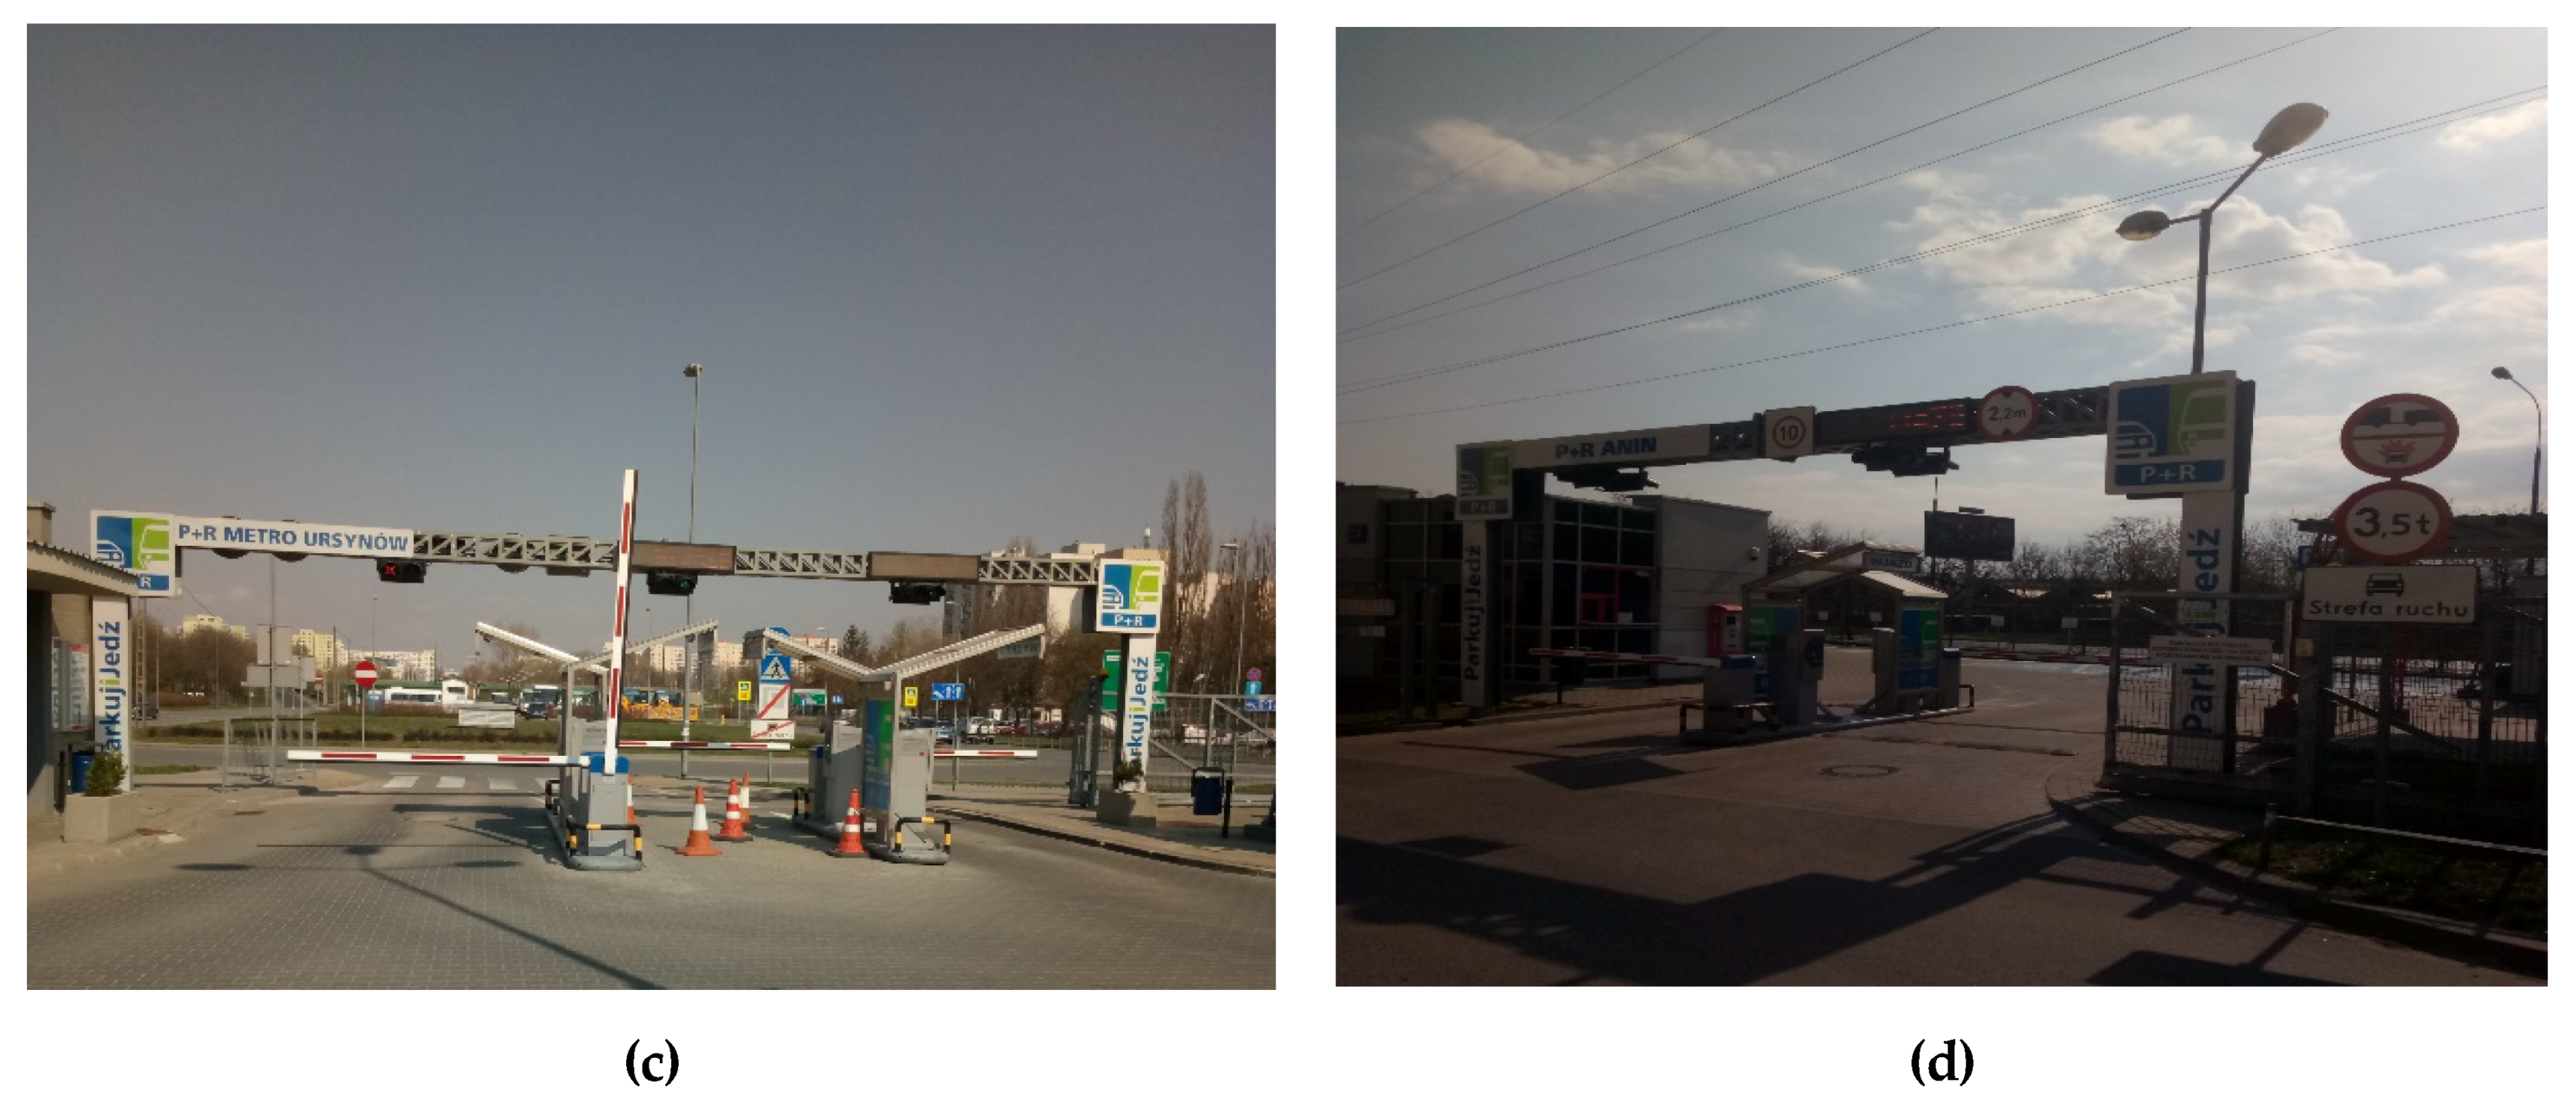
3. Characteristics of the Research Area
4. Research Methodology
- To analyze the selected factors related to the functioning of the P&R facility,
- to research the preferences of the P&R facility users, and
- to analyze the features determining the choice of P&R facility during the journey.
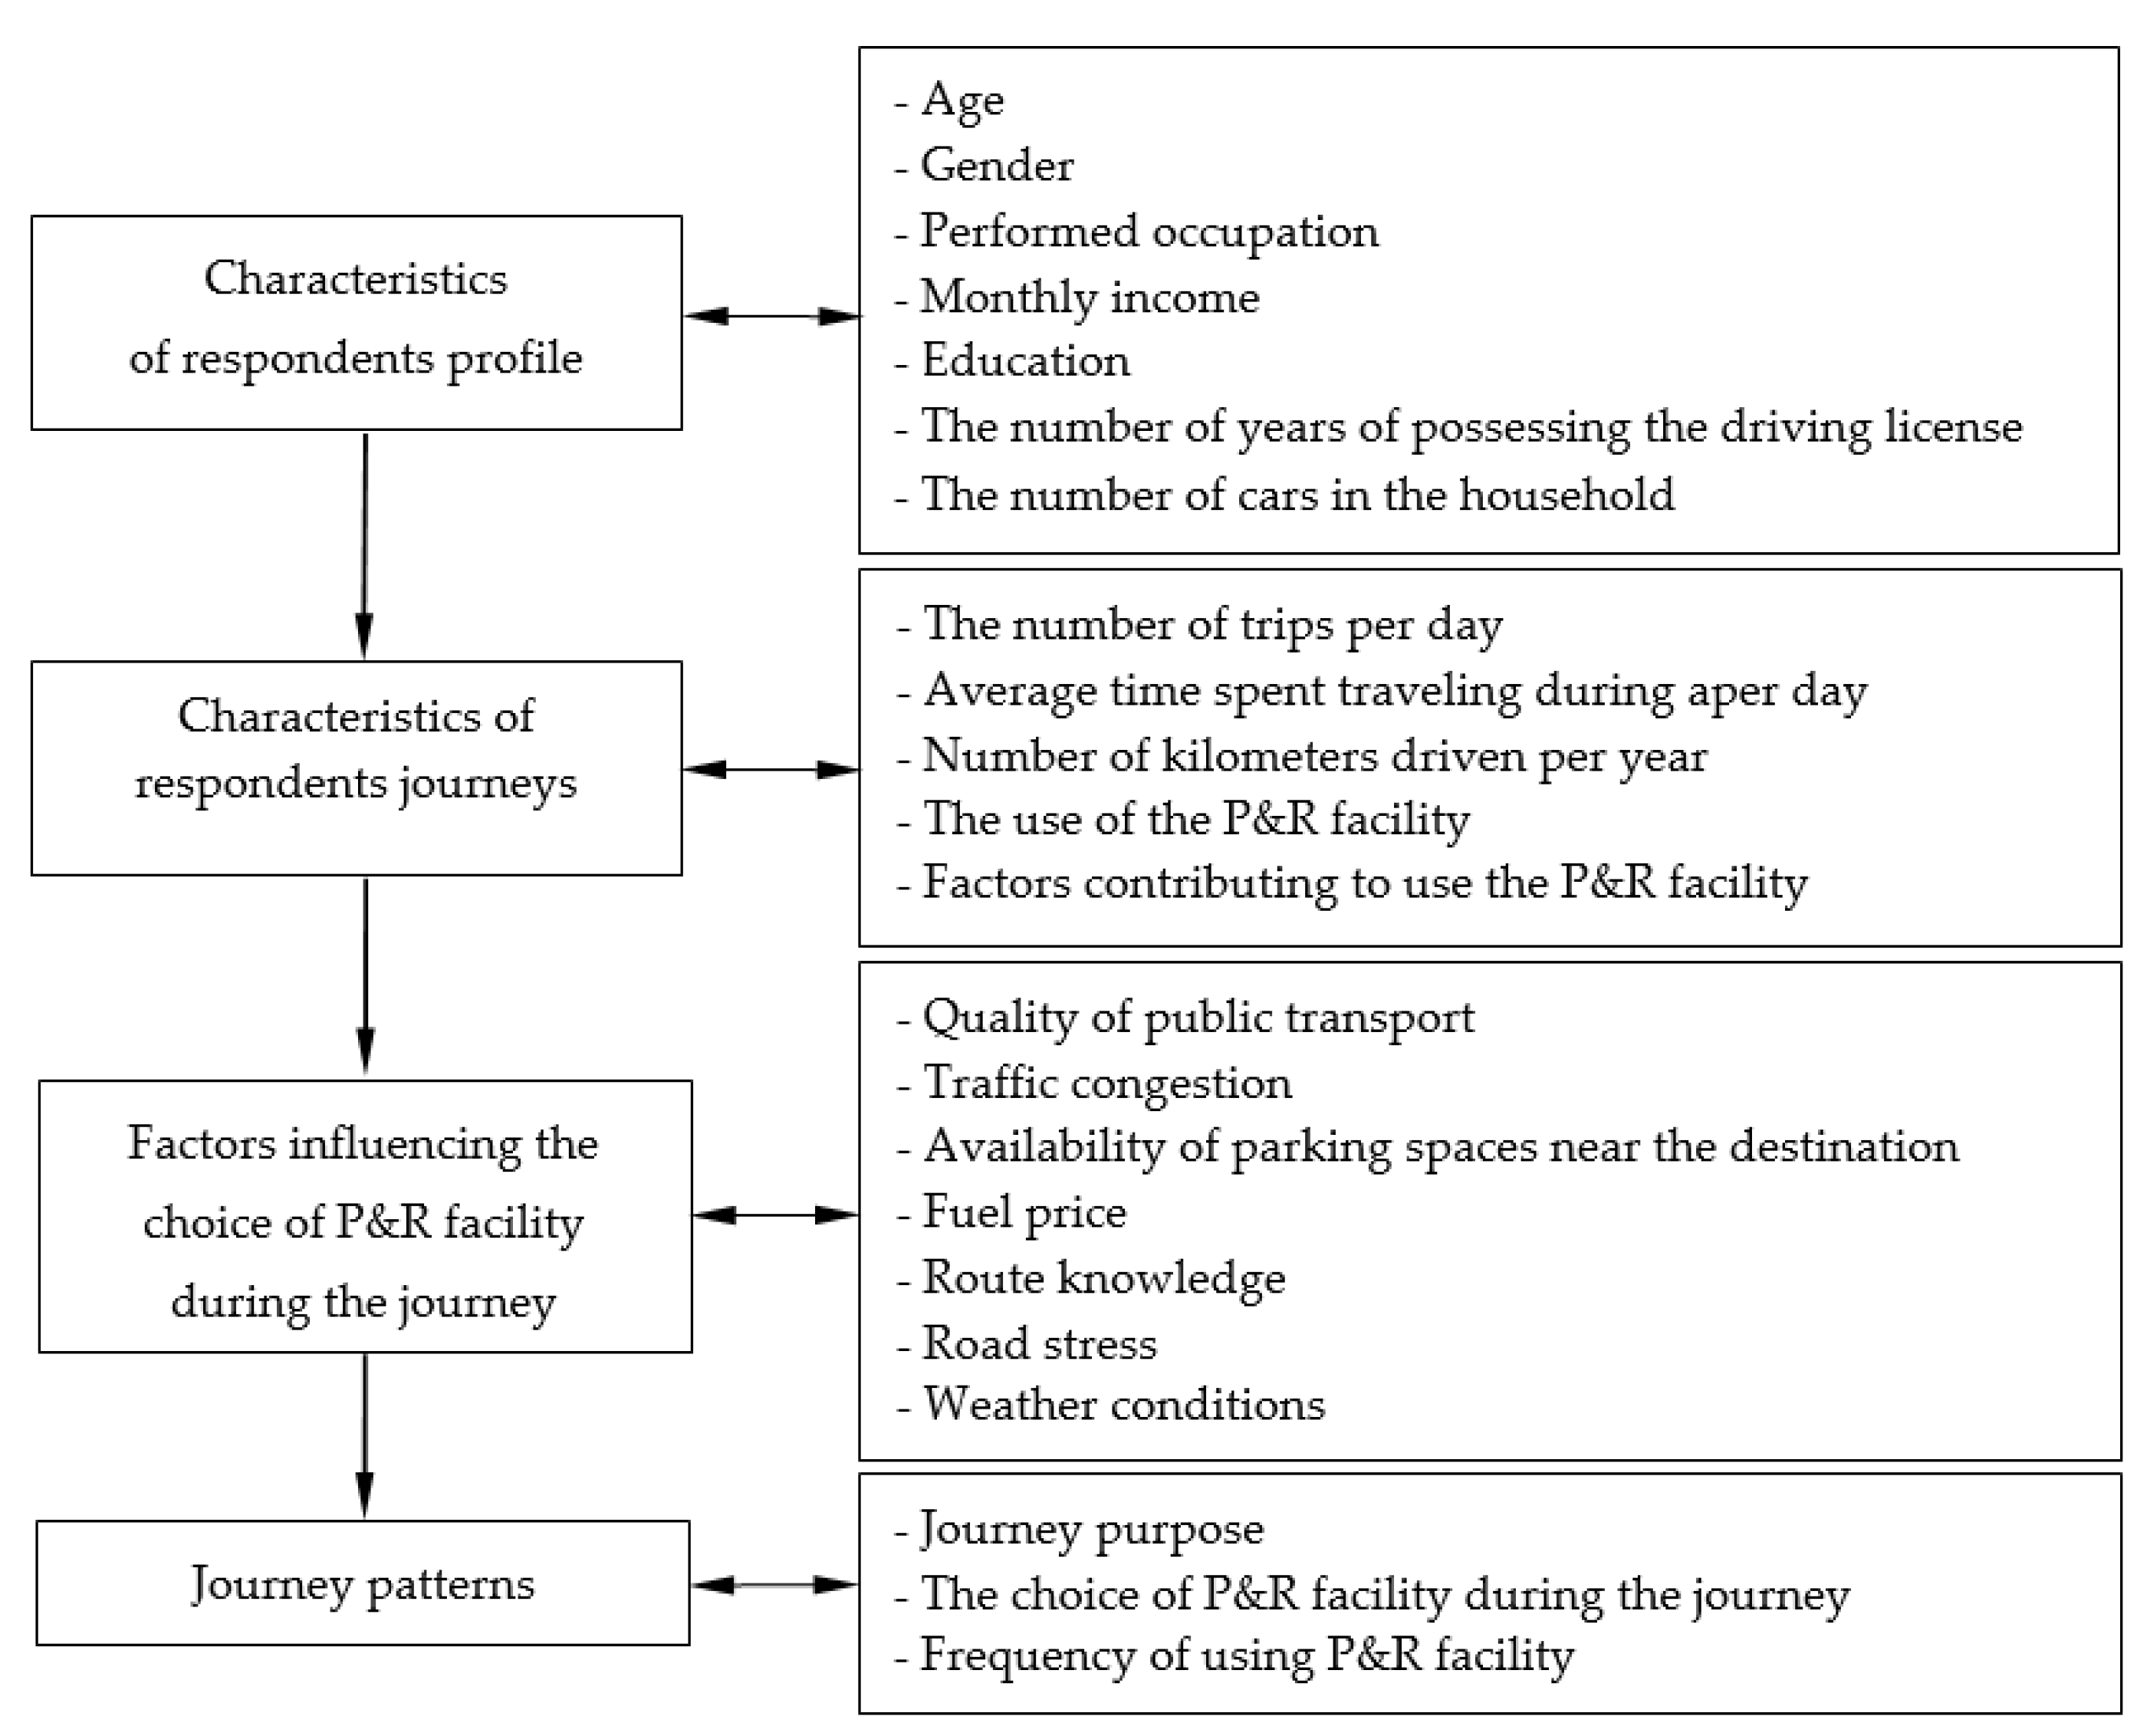
- Characteristics of the respondent’s profile,
- characteristics of the respondents’ journeys,
- factors affecting the choice of the P&R facility in the journey,
- journey patterns, and
- solutions and P&R facility factors that could encourage respondents to choose the P&R facility during the journey.
5. The Analysis of the Selected Factors Related to the Functioning of P&R Facilities in Warsaw
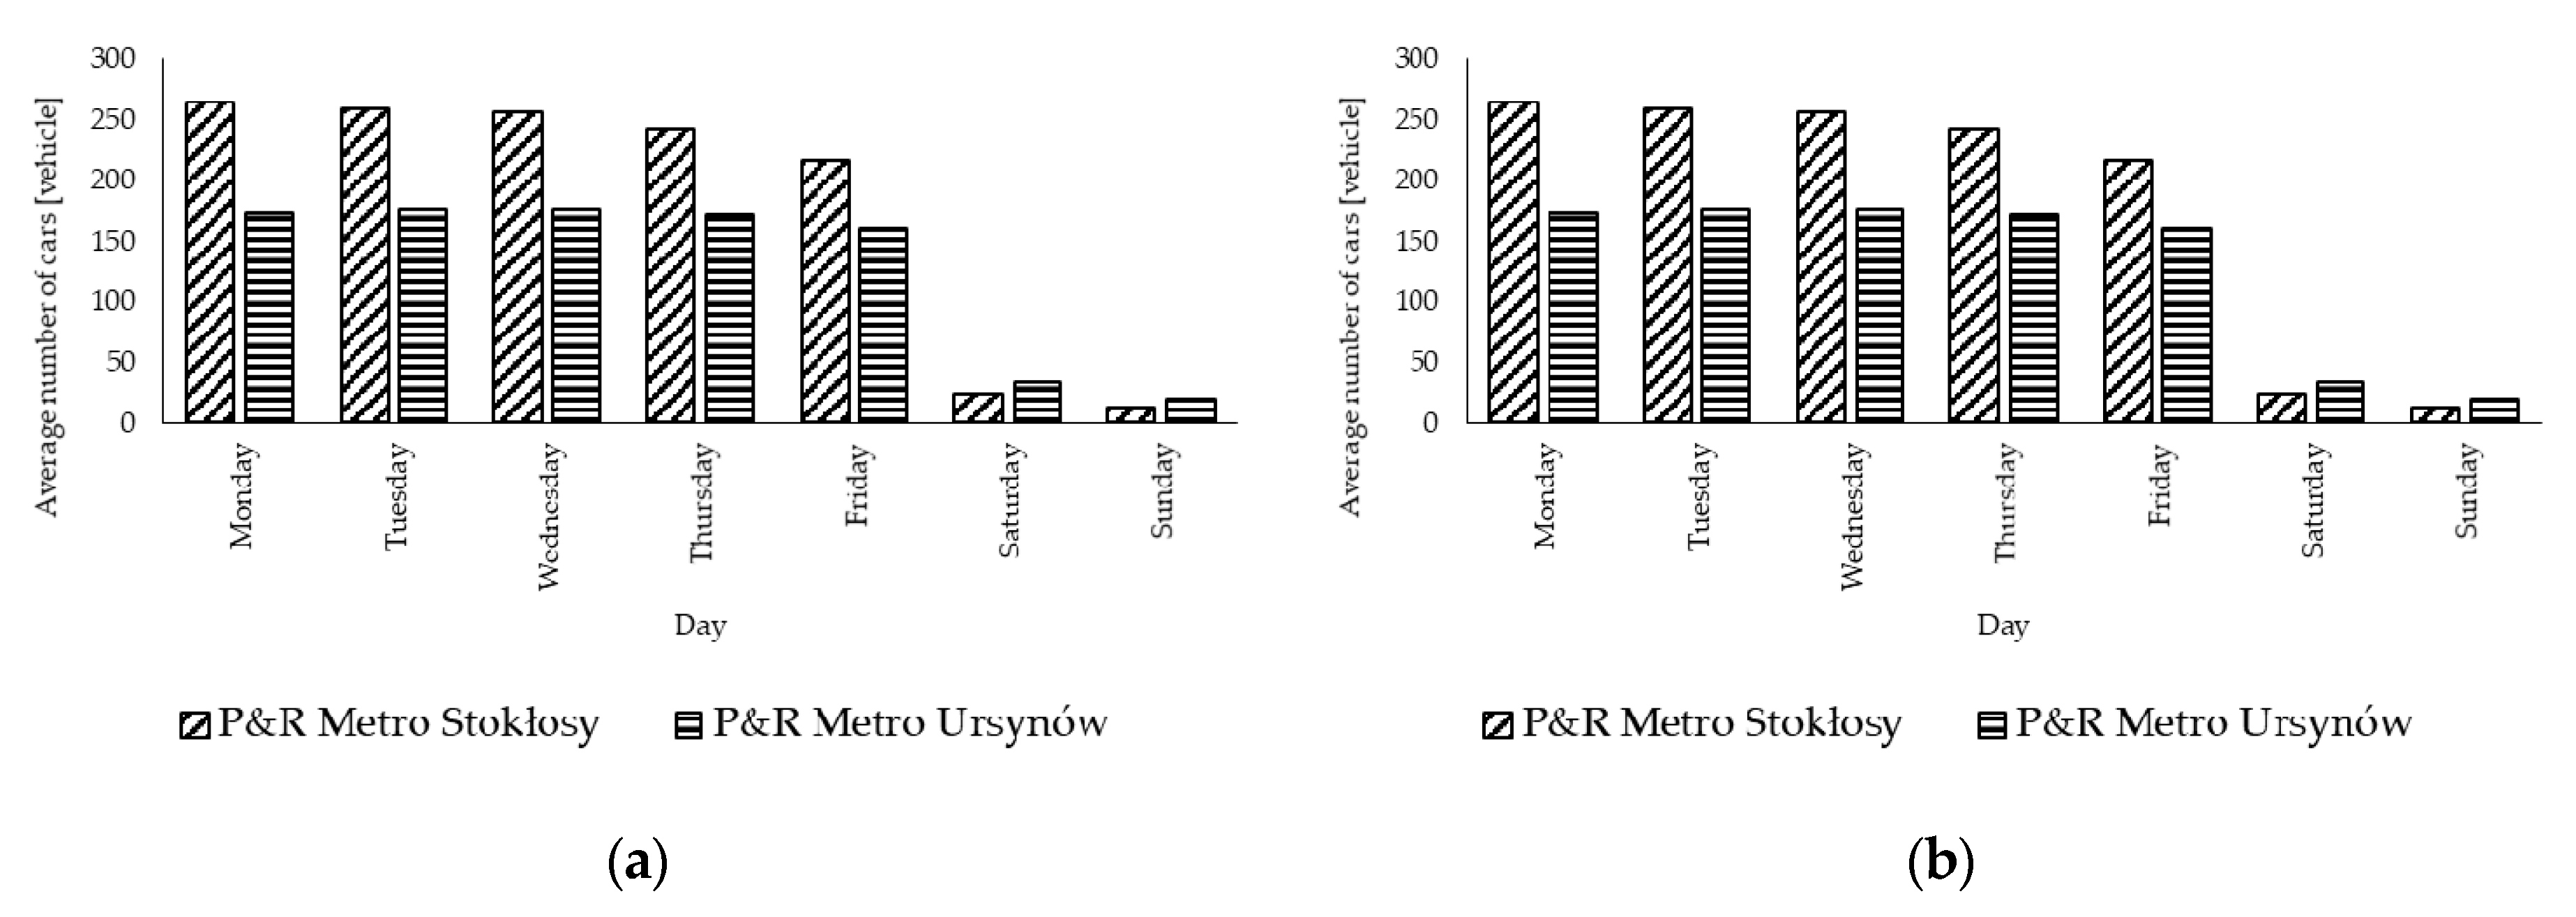
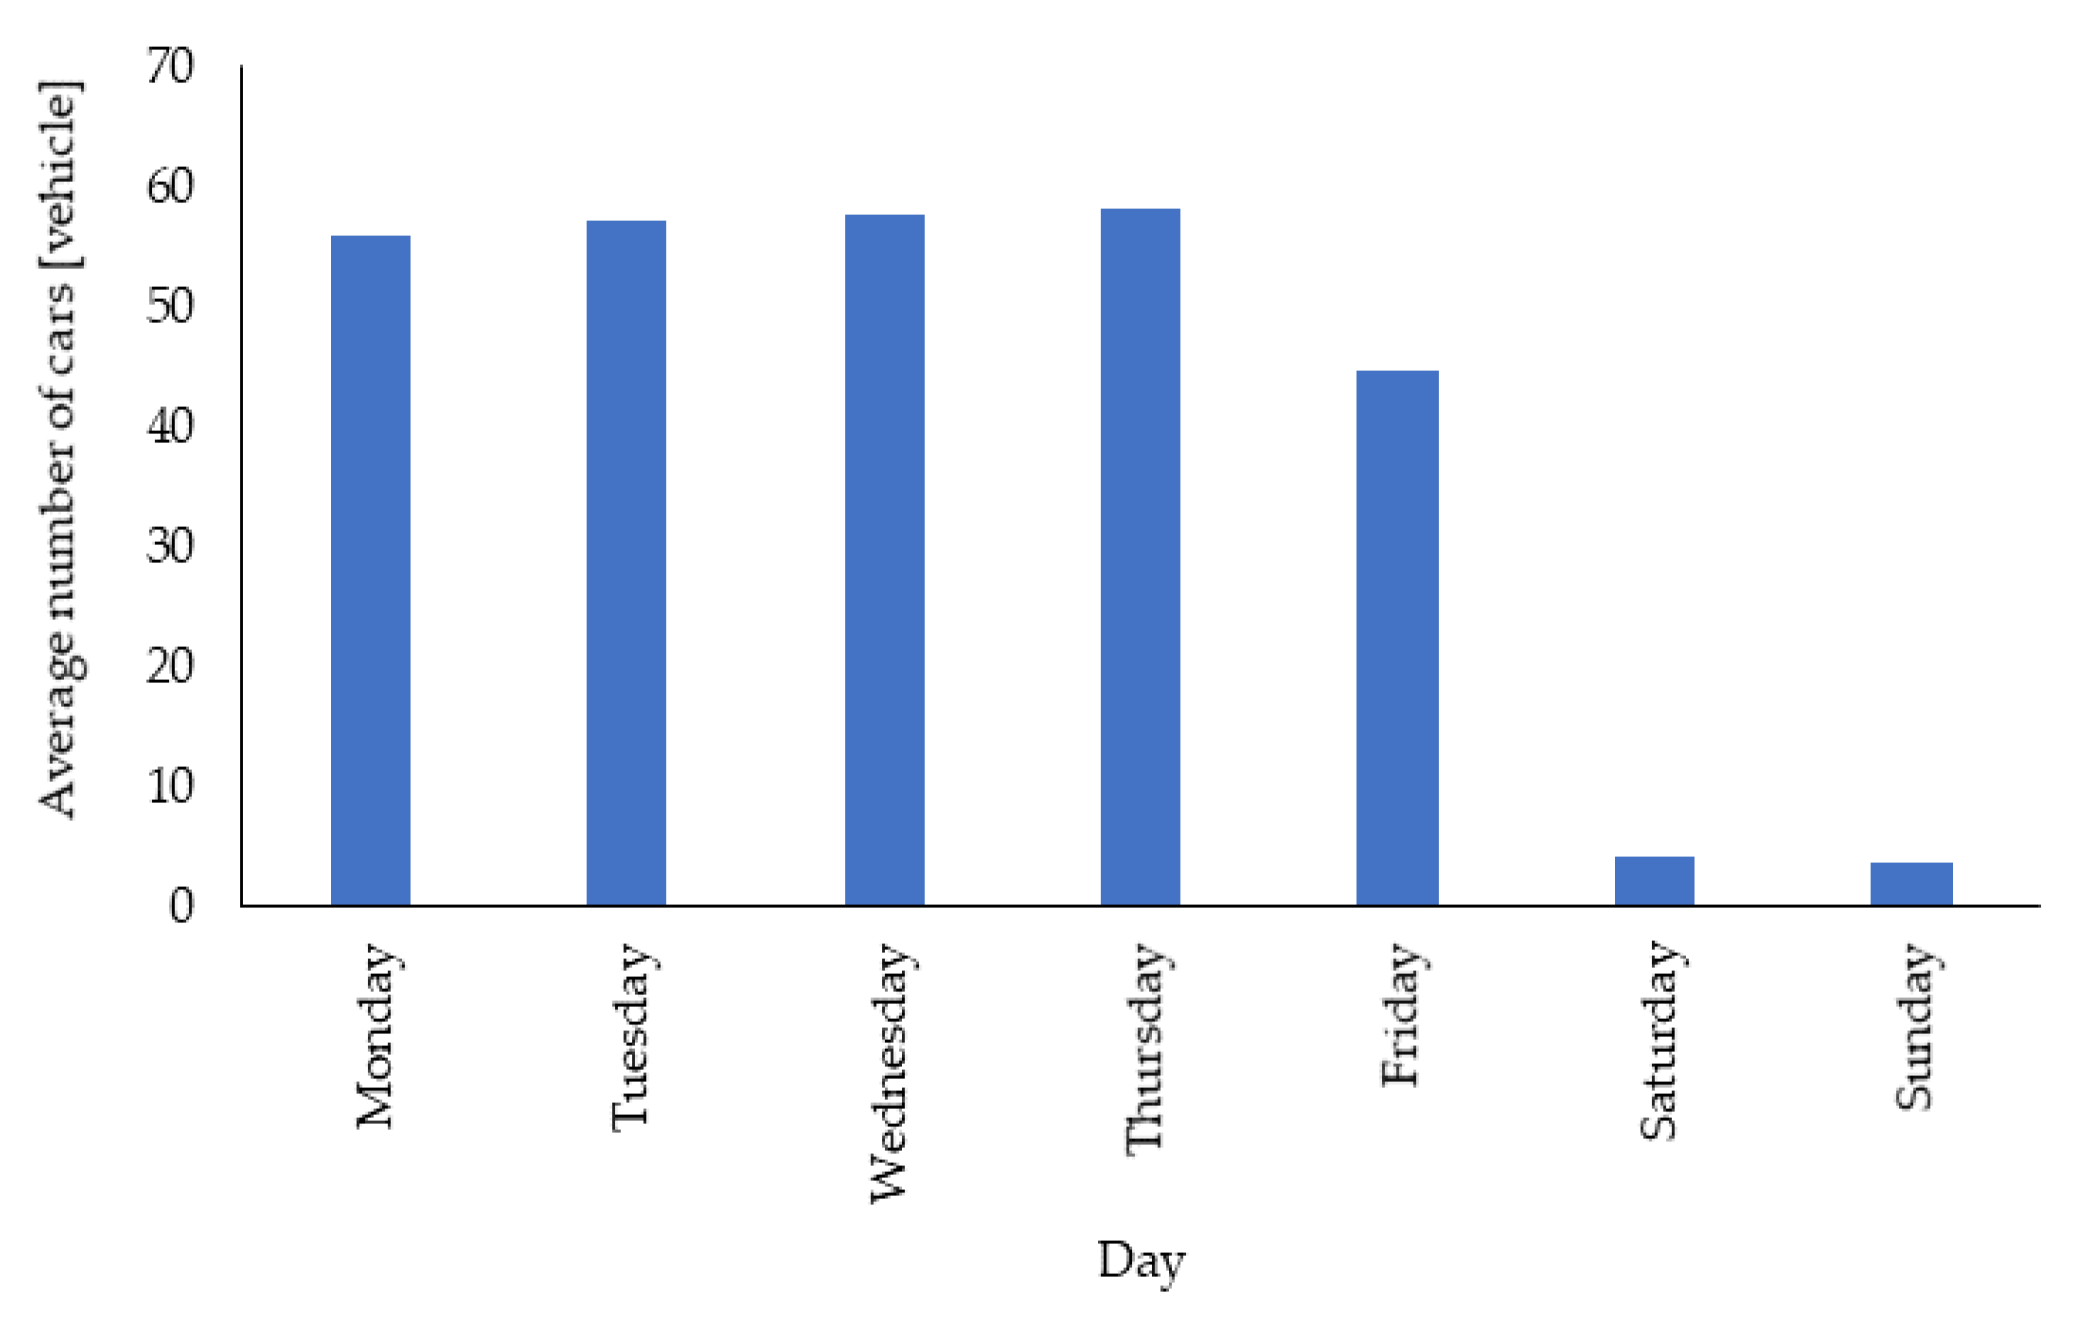
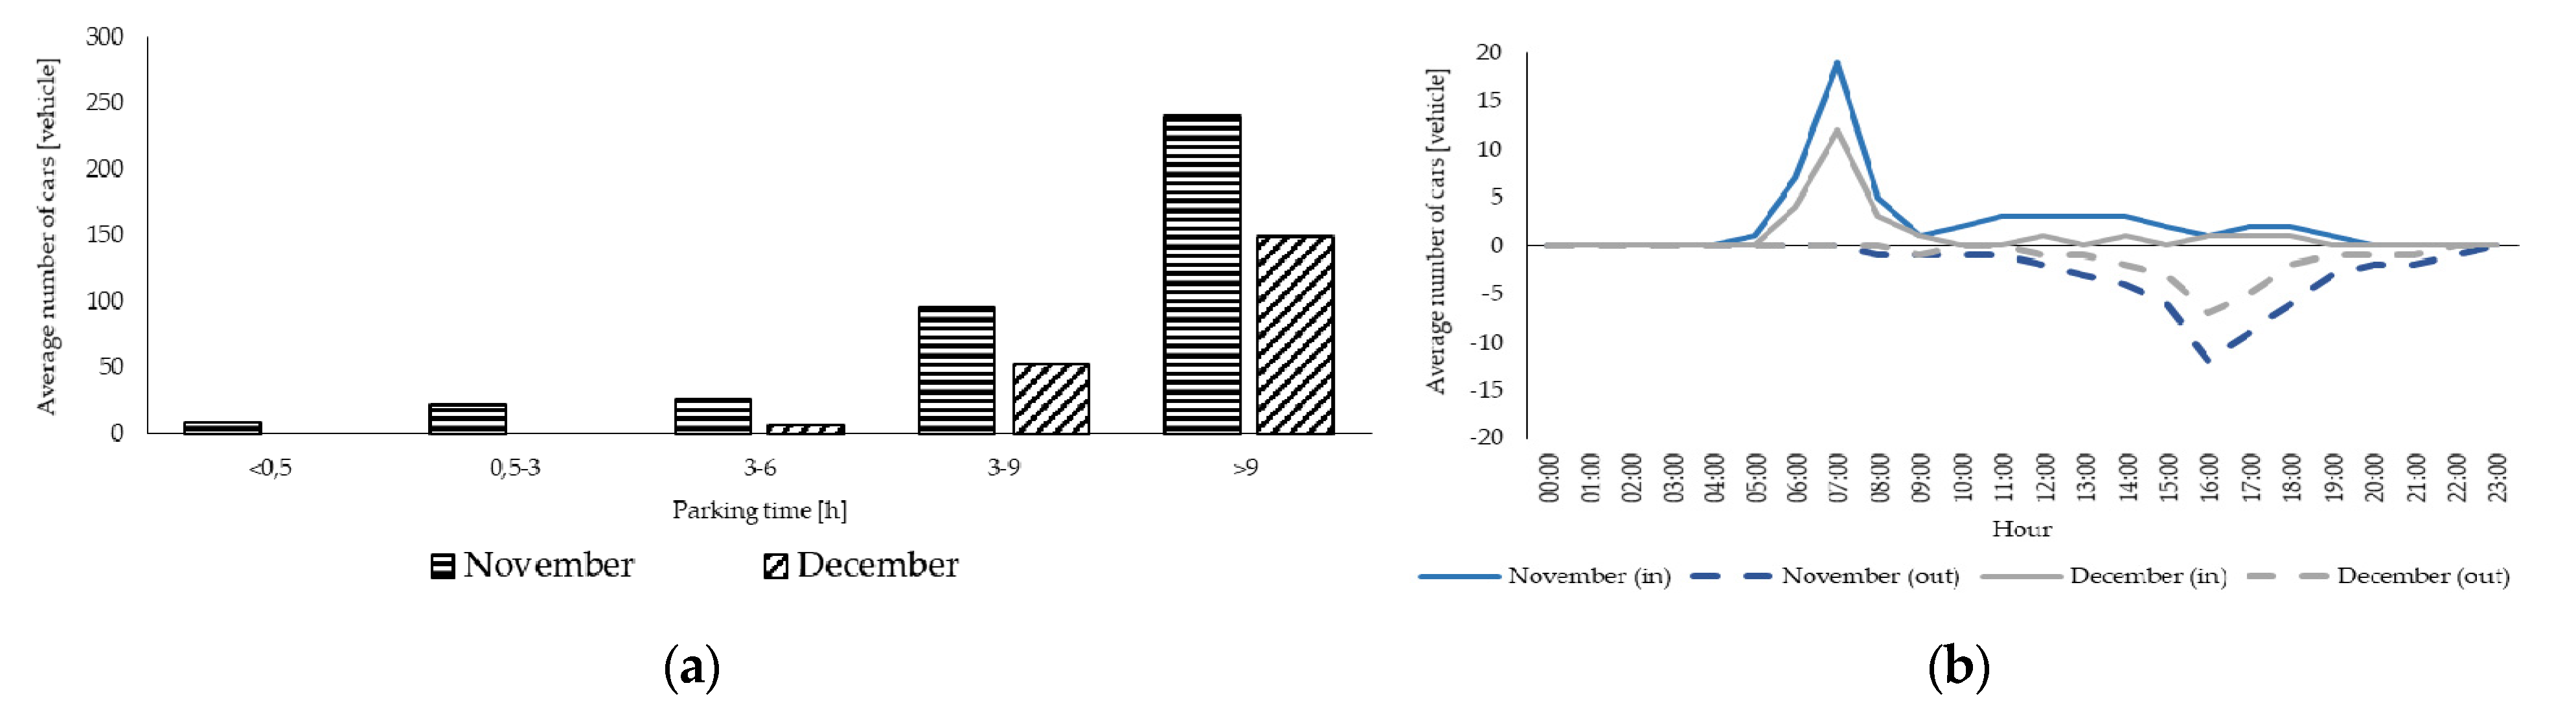
- The average number of vehicle entries to the parking on particular days of the week and in particular months of the year,
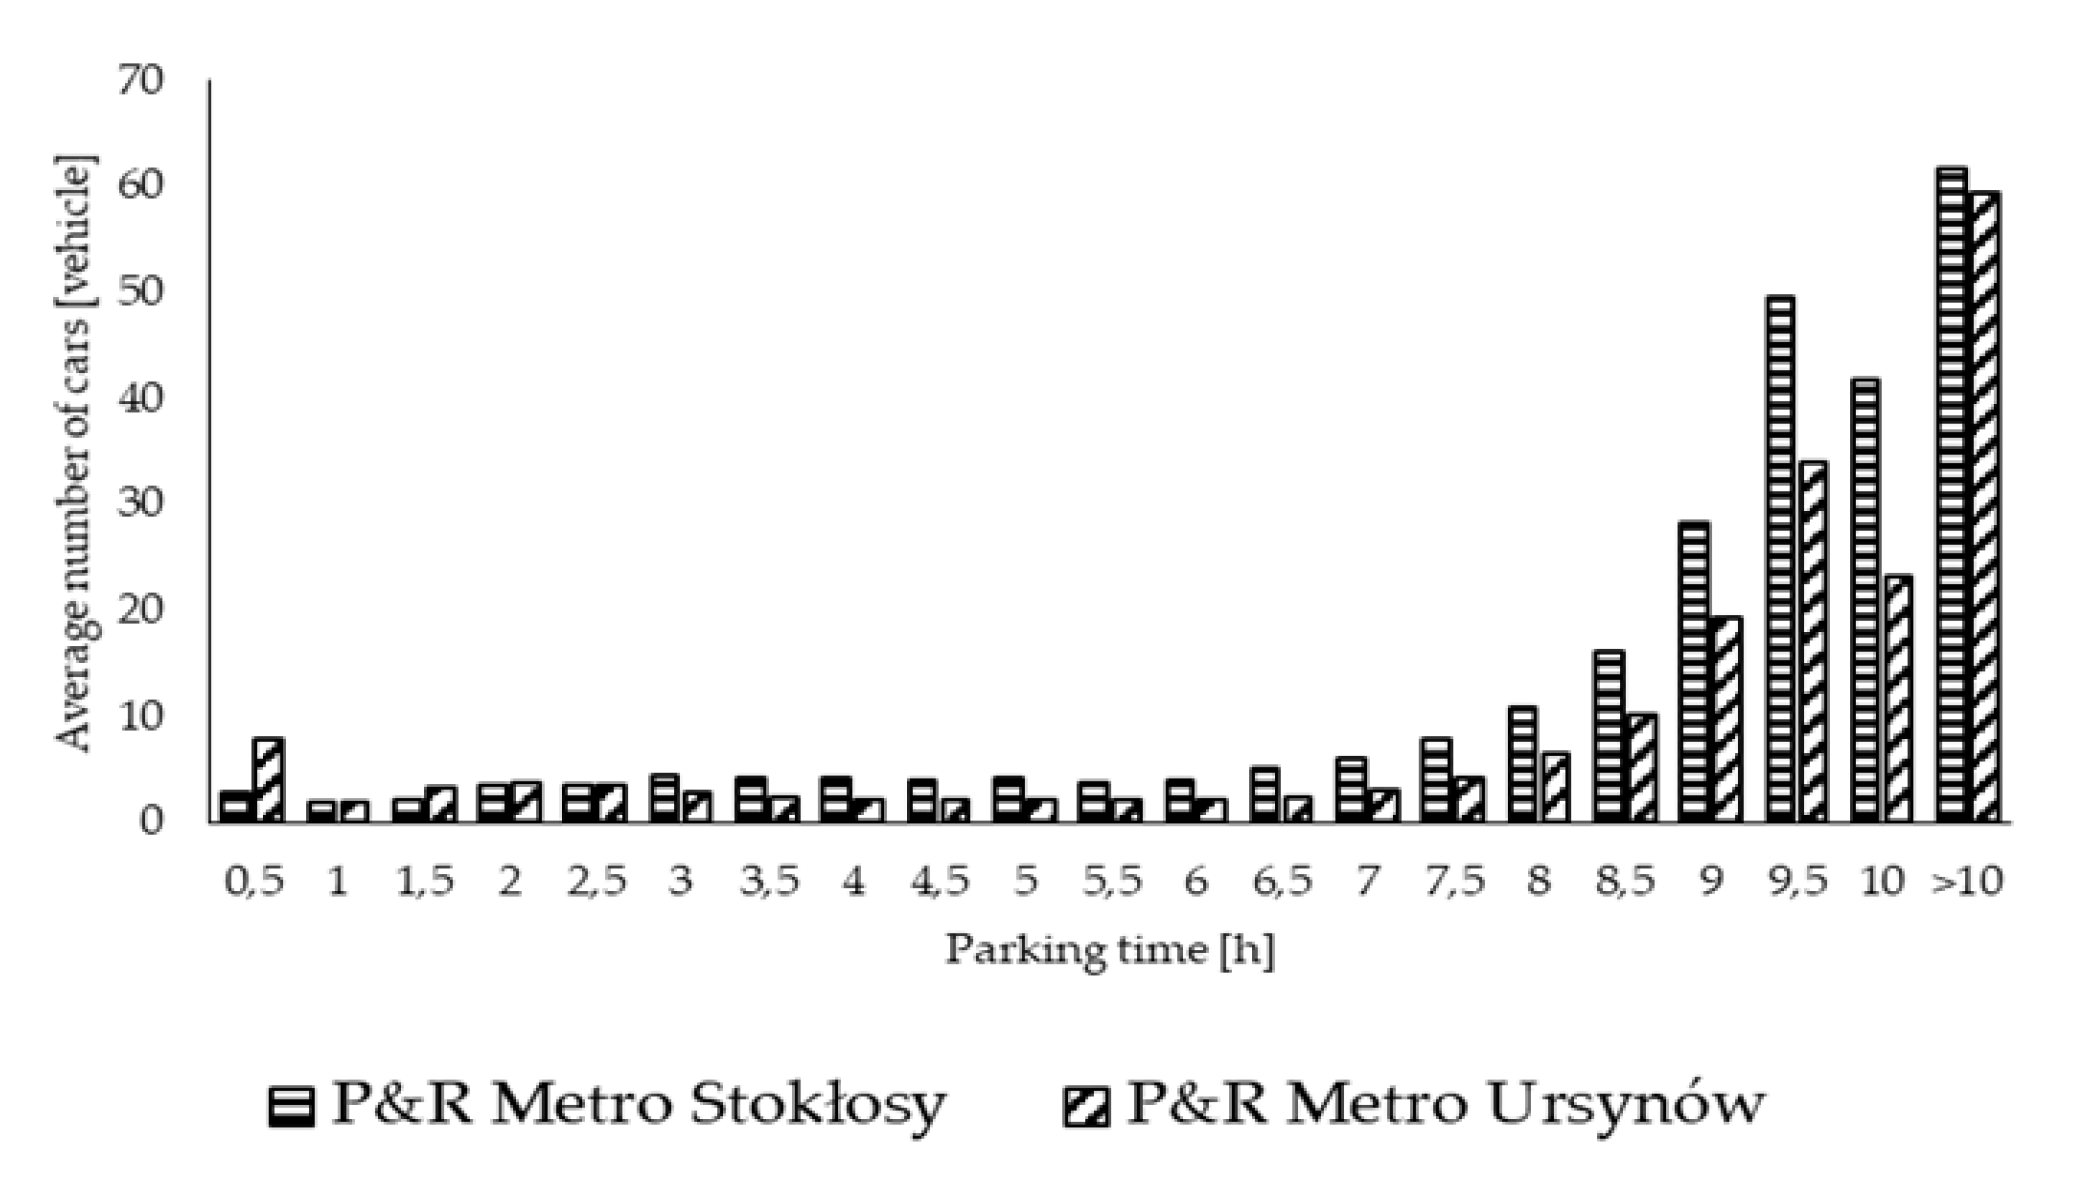
- the distribution of vehicle parking in the P&R facility on working days, and
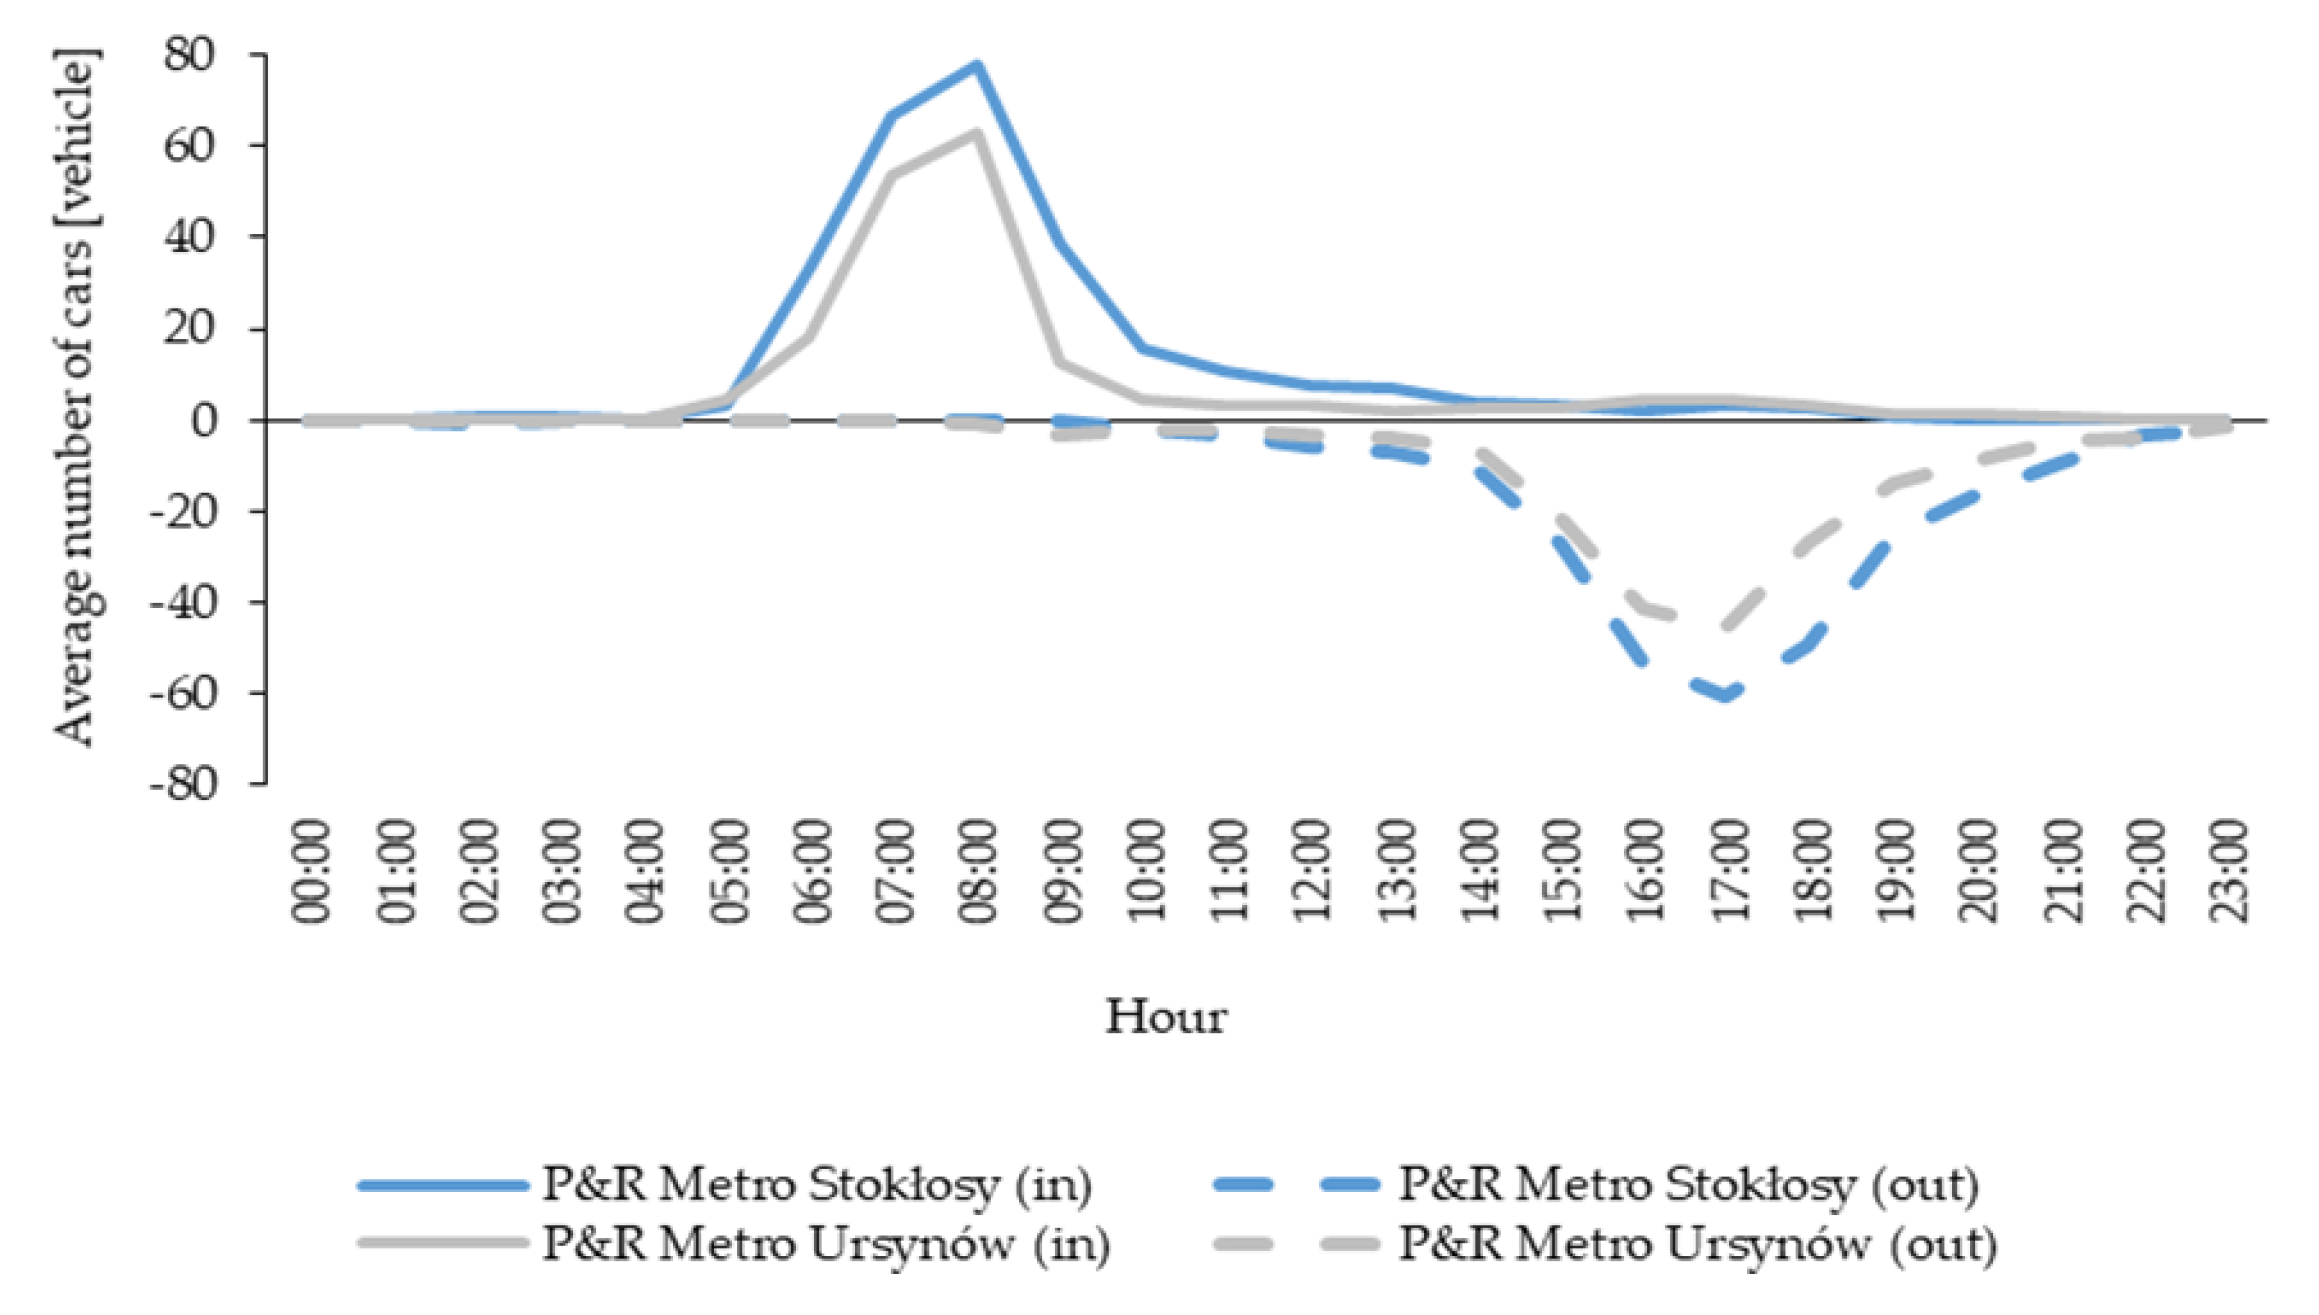
- the average number of vehicles entering and exiting parking in particular hours of the day.
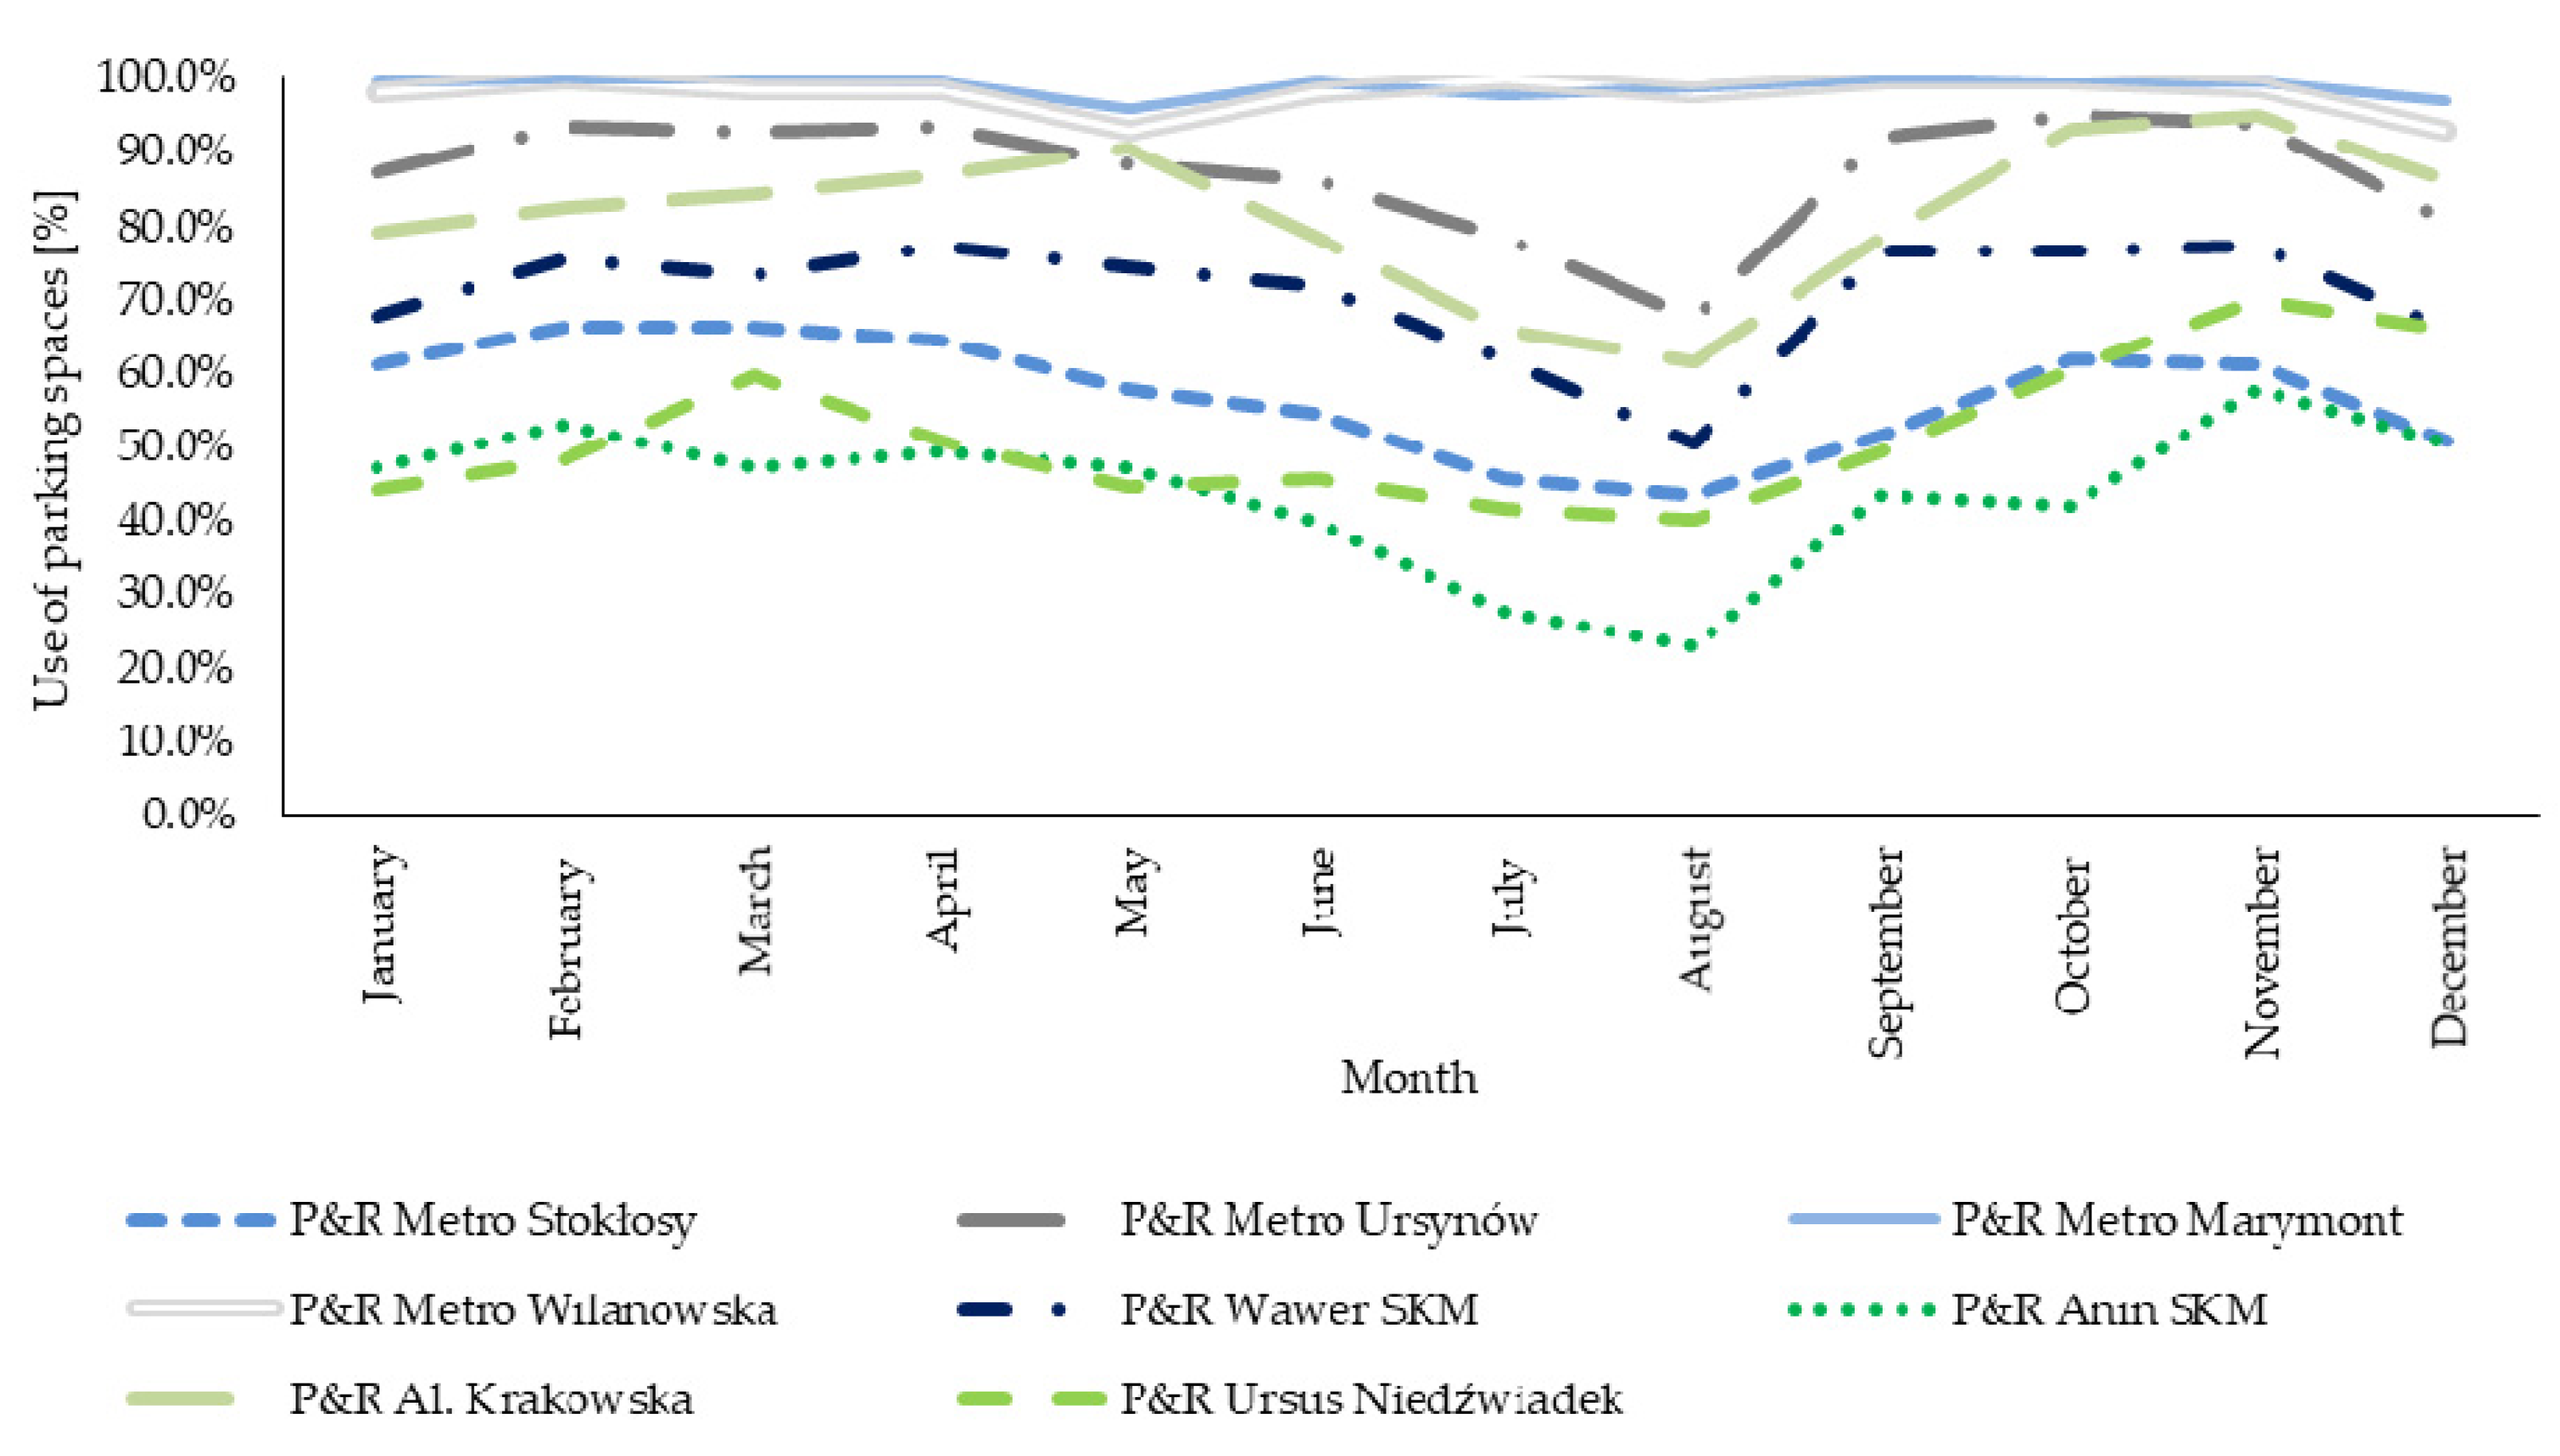
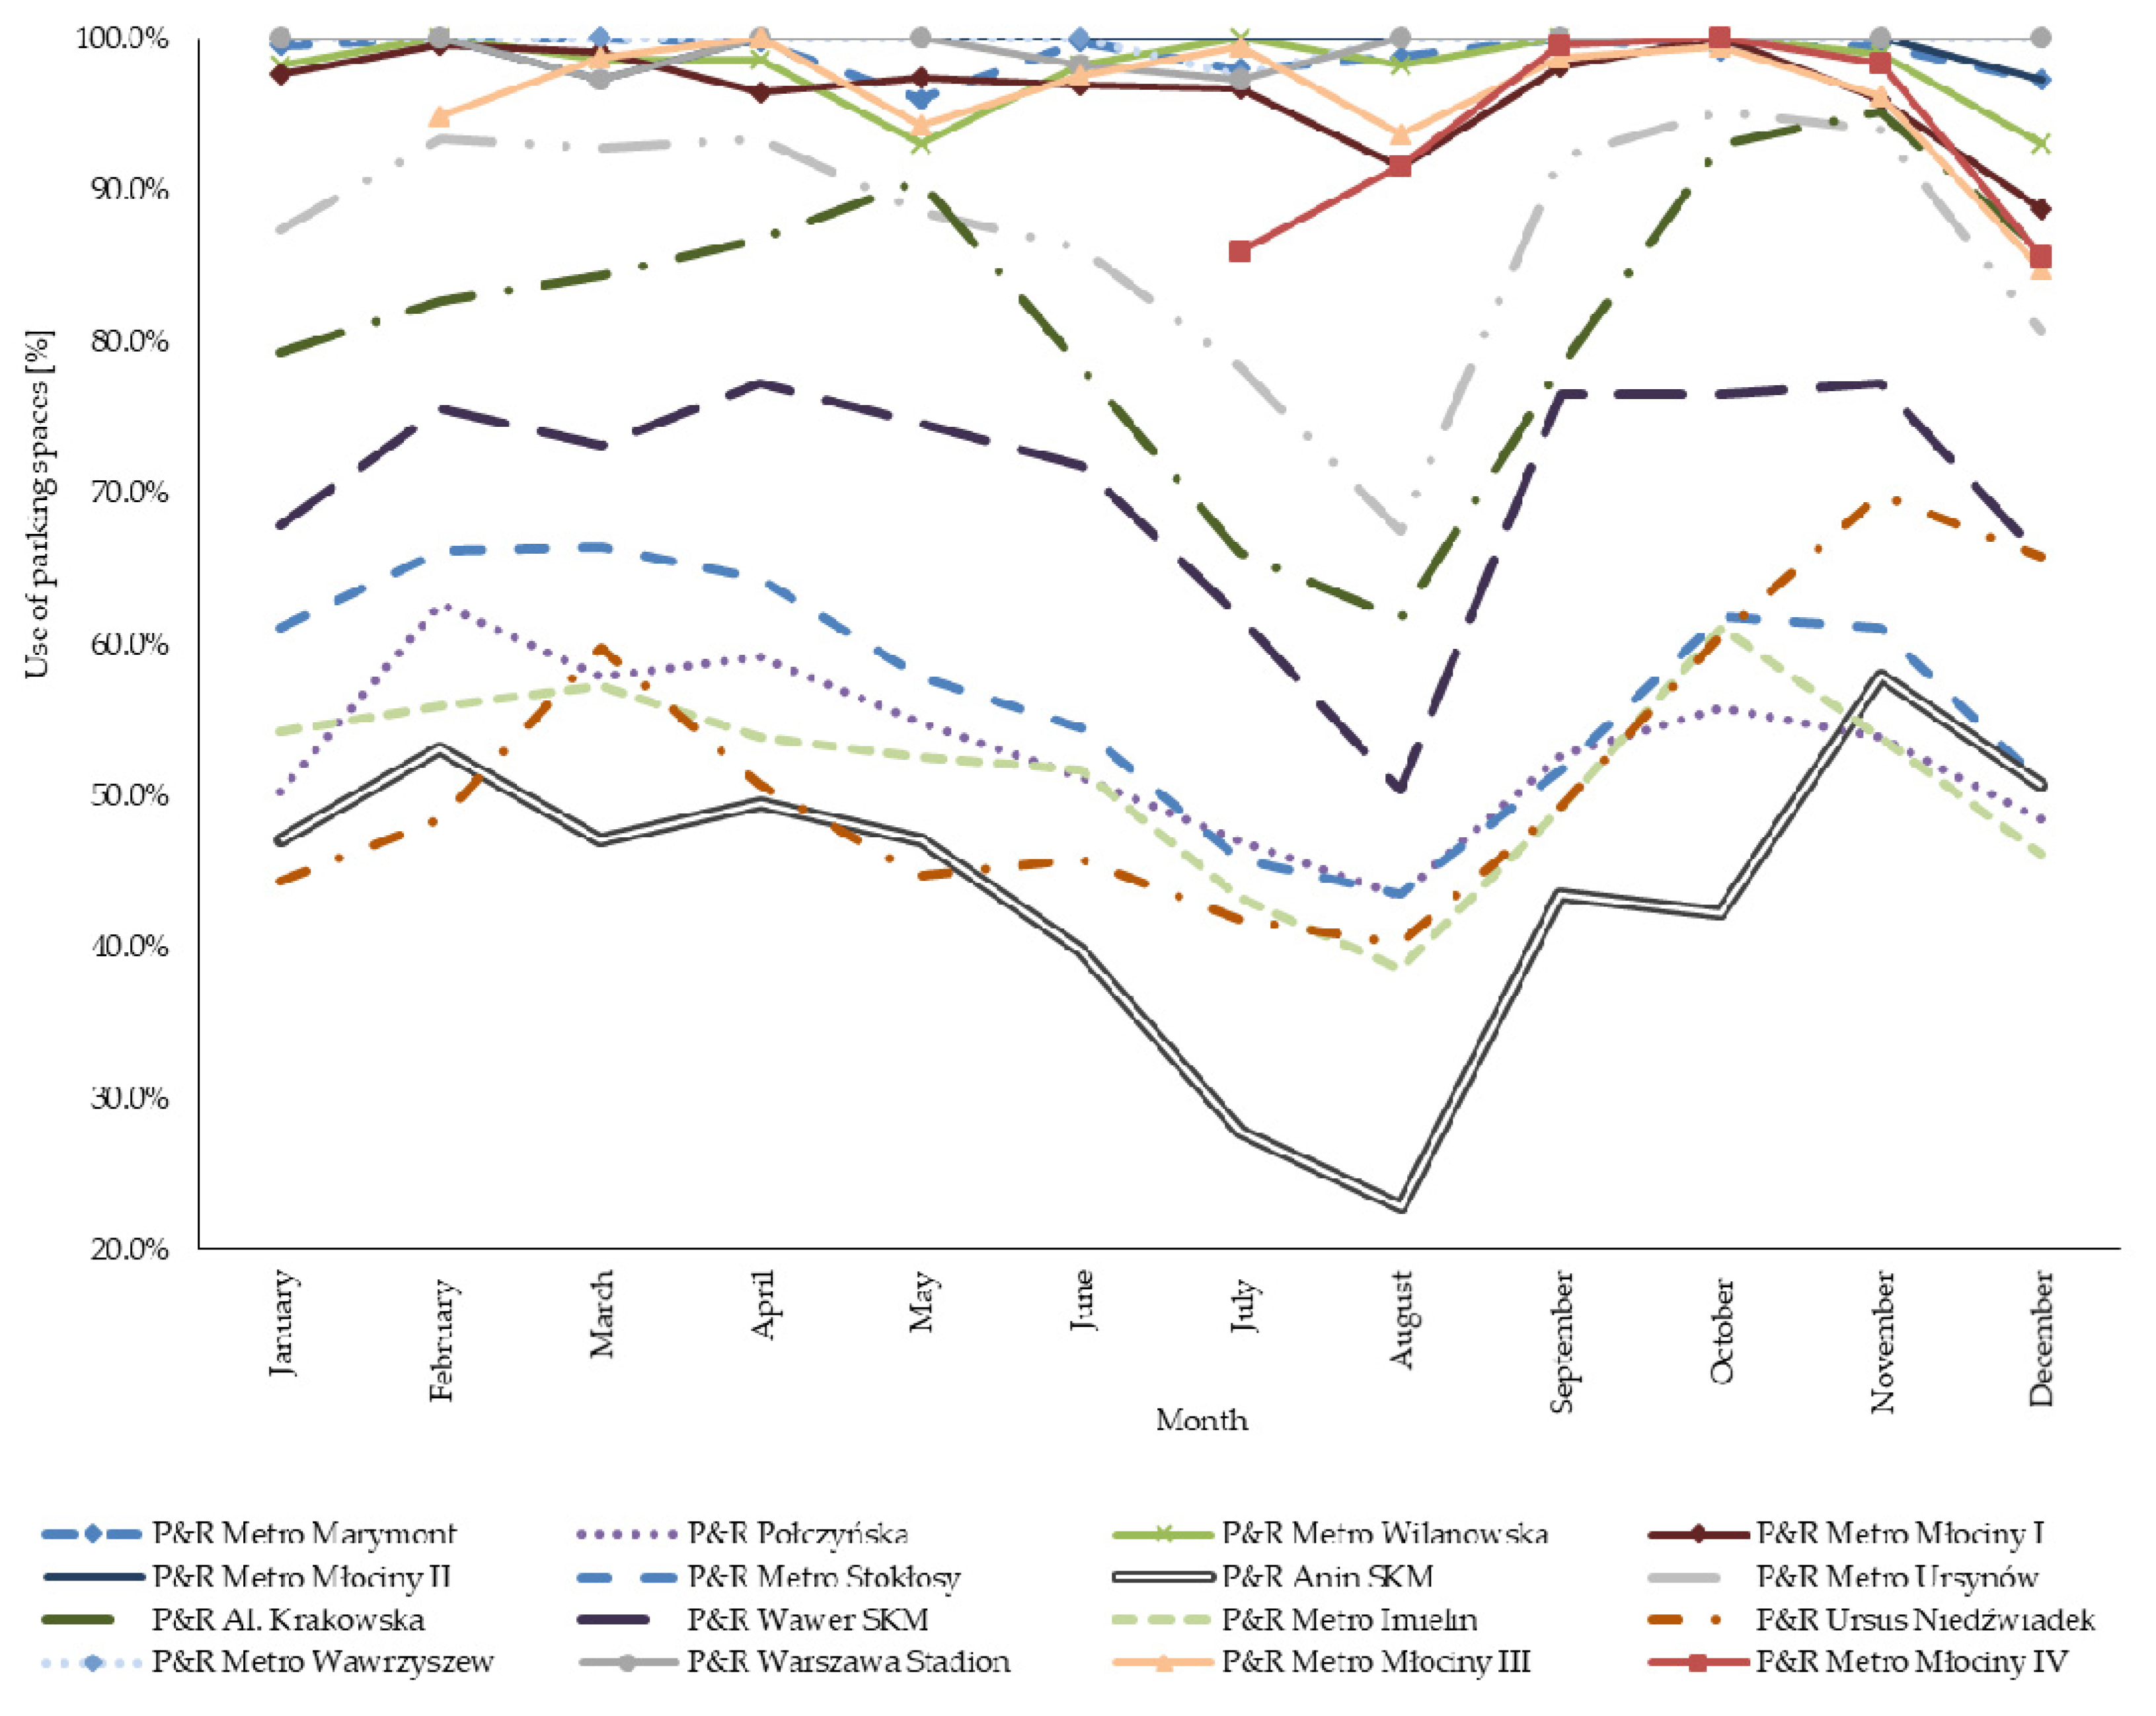
5.1. The Distribution of Selected Factors of Analyzed P&R Facility in Time
5.2. Pedestrian Accessibility of the P&R Facilities to Metro and RUR Stops
6. The Analysis of the Factors Determining the Choice of Park and Ride Facility—A Case Study Based on Warsaw (Poland)
6.1. Characteristics of Respondents, Respondents Travel and Use of P&R Facility
6.2. Multinomial Logit Model Characteristics
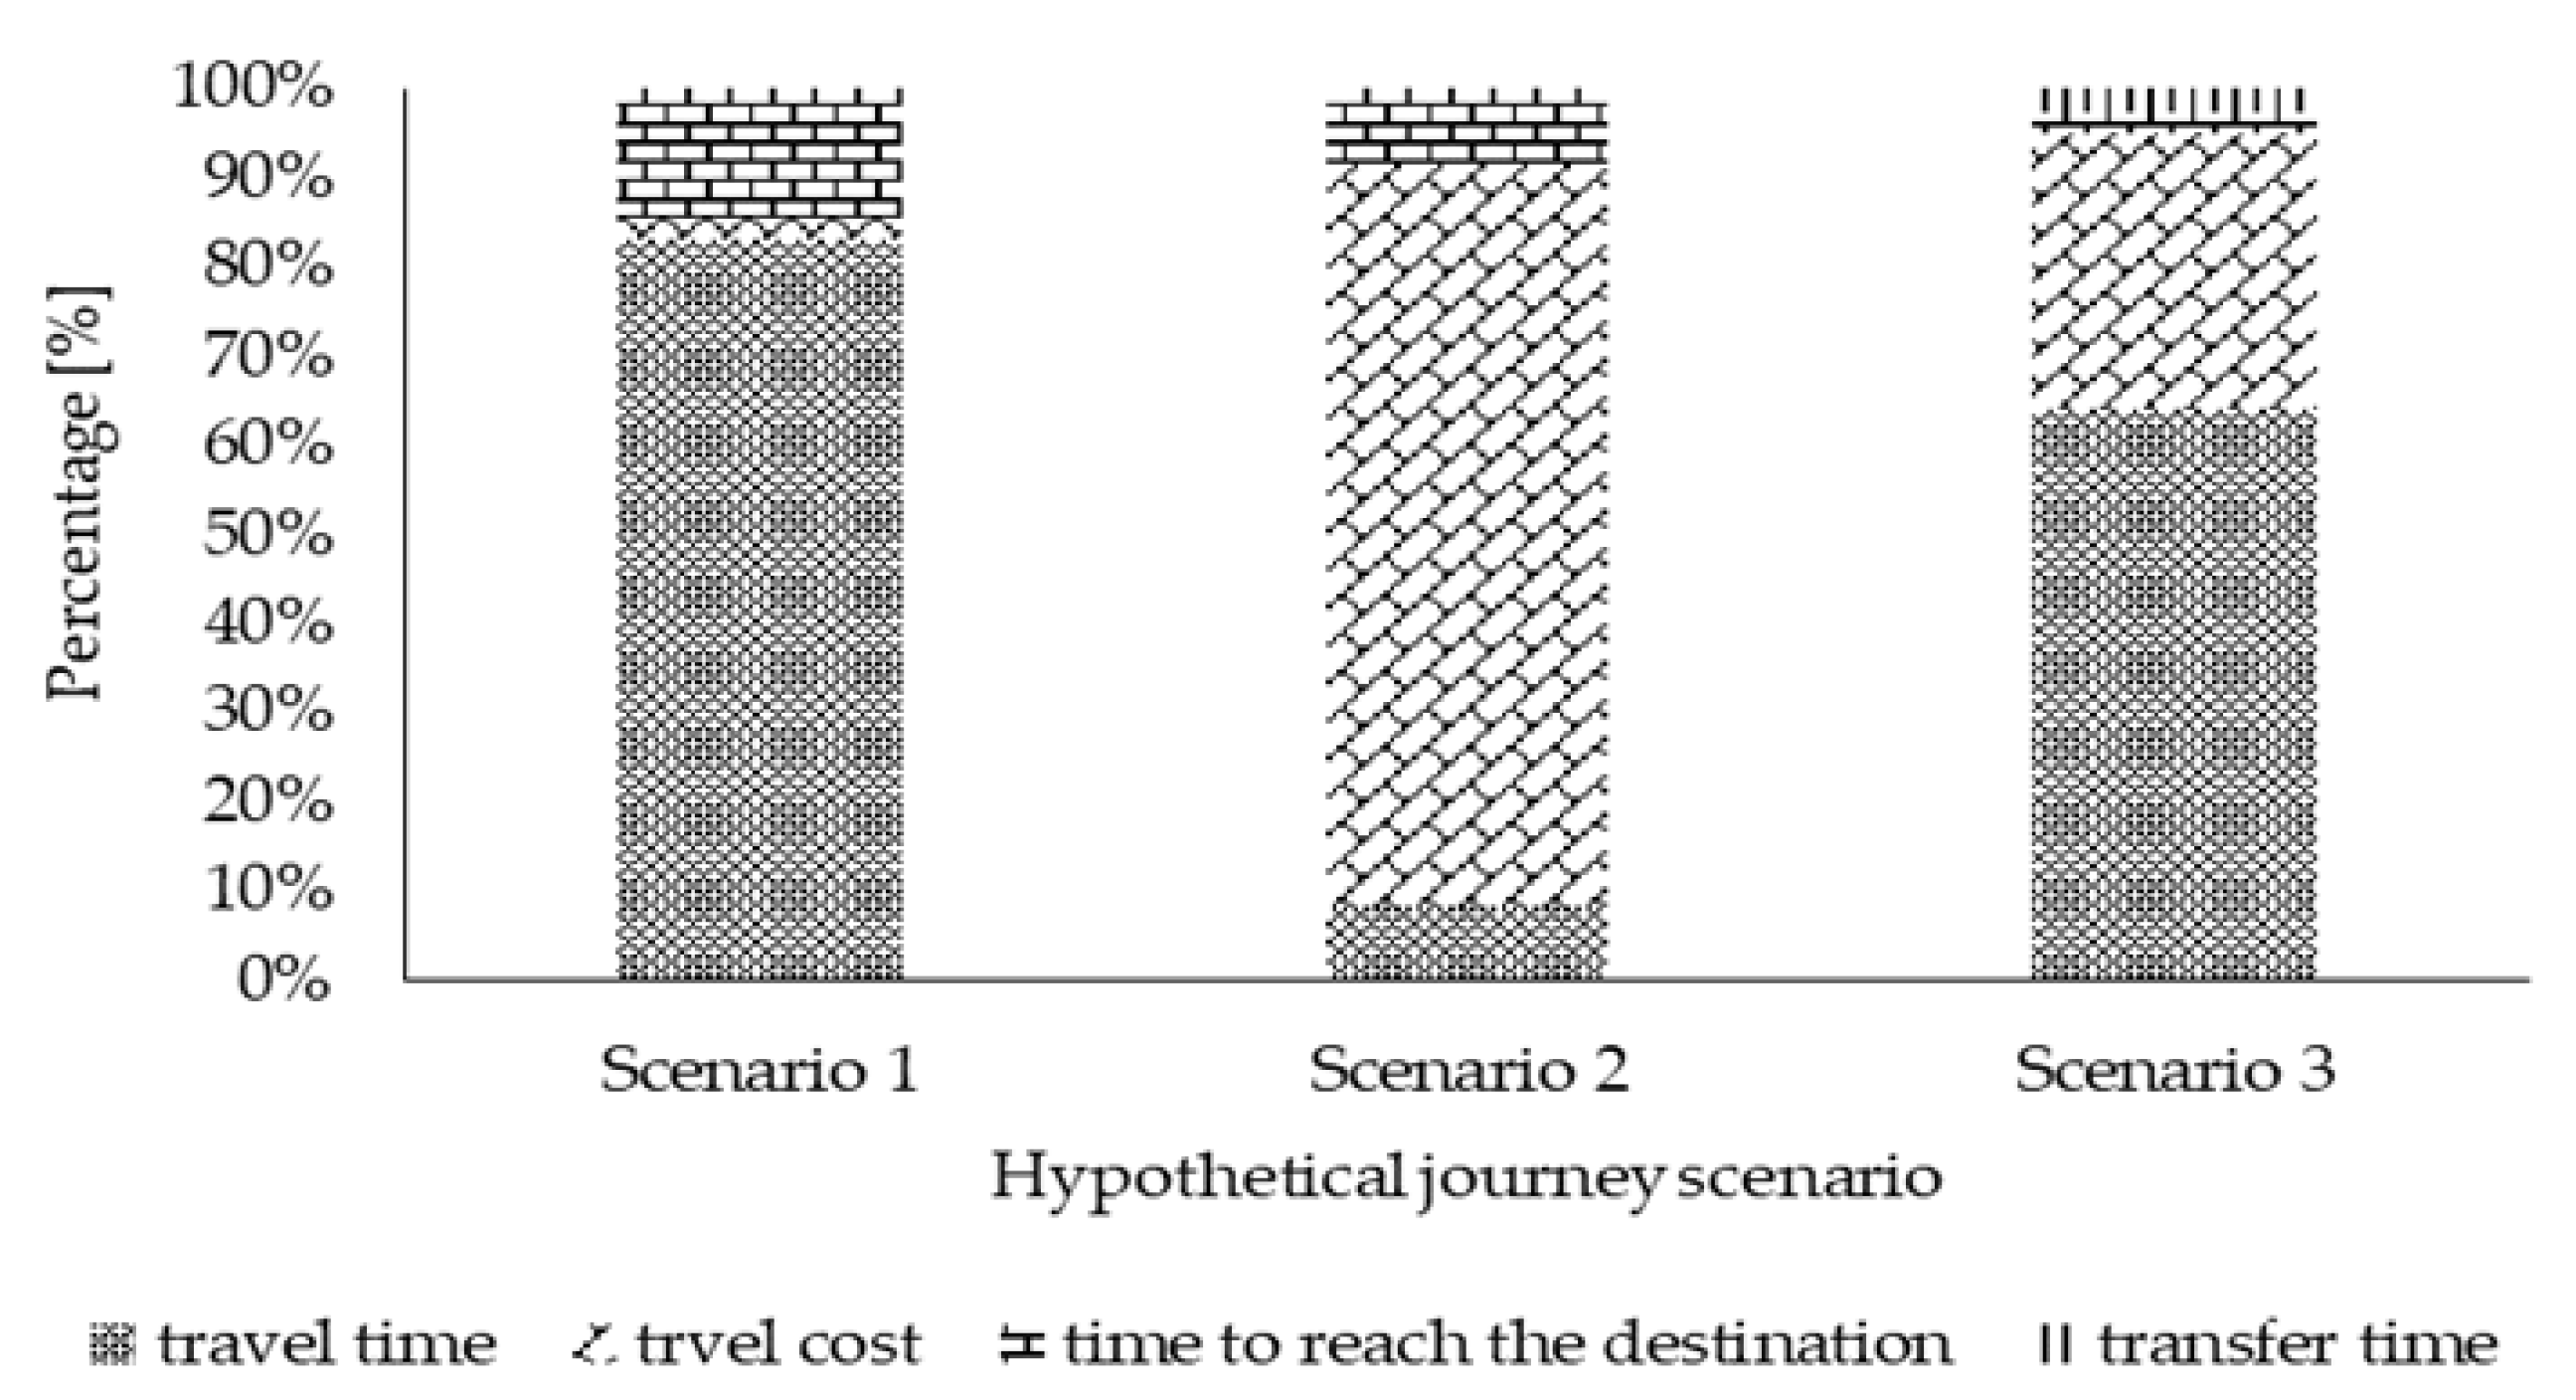
- Y1—the probability that the respondent chooses hypothetical journey scenario no. (1), i.e., traveling to the city center using only car,
- Y2—the probability that the respondent chooses hypothetical journey scenario no. (2), i.e., traveling to the city center using only means of public transport,
- Y3—the probability that the respondent chooses hypothetical journey scenario no. (3), i.e., traveling to the city center using a mixed journey, i.e., driving to the P&R facility by a car and then changing the means of transport to public transport.
6.3. Specification of the Model Selection Hypothetical Journey Scenario-Multinomial Logit Model Results
- PL—gender,
- WI—age,
- WY—education,
- WZ—performed activity,
- DO—income (PLN),
- LPJ—the number of years having a driving license,
- LSGD—the number of cars in the household,
- LP—the average number of journeys made by day,
- LMD—the average time spent traveling during the day,
- LKMR—the number of kilometers driven during a year,
- CP—trip purpose.
- A person older than another person (not different in terms of other characteristics) has about 14% less chance of choosing a trip using only car,
- a person with a lower level of education than other people has about 15% less chance of choosing a trip using only car, and a person who makes more trips during the day has about 4% greater chance of choosing a trip using only car. The nonworking (by 13%) are also less likely to choose this hypothetical travel scenario.
- A person older than another person is about 19% less likely to choose a trip using only means of public transport,
- a person with a lower level of education than others has about 36% less chance of choosing a trip using only means of public transport, and a person who makes more trips during the day has a 7% greater chance of choosing a trip using only means of public transport.
- A person older than another person has about 19% less chance of choosing a mixed journey,
- a person with a lower level of education than others has about 12% less chance of choosing a mixed journey, and a person who makes more journeys during the day has a 7% greater chance of choosing a mixed journey. People who are not working are also less likely to choose this hypothetical travel scenario (by 4%).
- A person with a lower level of education than other people has about 33% less chance of traveling using only car, and
- a person who carries out more the number of kilometers driven during a year has about 7% less chance of traveling using only car.
- A person with a lower level of education than others has about 82% less chance of choosing a trip using only means of public transport,
- a person having a driving license for a year longer has about 41% less chance of choosing a trip using only means of public transport, and
- a person who carries out more the number of kilometers driven during a year has about 46% less chance of choosing a trip using only means of public transport. Also, those not working (by 115%) are more likely to choose this hypothetical travel scenario.
- A person with a lower level of education than other people (not different from them in terms of other characteristics) has about 46% less chance of choosing a mixed journey,
- a person having a driving license for a year longer has about 29% less chance of choosing a mixed journey, and
- a person who performs more the number of kilometers driven during a year has about 46% less chance of choosing a mixed journey.
- A person older than another person (not different from him in terms of other characteristics) has about 42% less chance to choose a trip using only car,
- a person with a lower level of education than other people has about 40% less chance of choosing a trip using only car,
- a person having a driving license for a year longer has about 28% less chance of choosing a trip using only car, and
- a person who carries out more the number of kilometers driven during a year has about 20% less chance of choosing a trip using only car. The nonworking people are also less likely to choose this hypothetical travel scenario (by 12%).
- A person older than another person is about 11% less likely to choose a trip using only means of public transport,
- a person with a lower level of education than others has about 83% more chance of choosing a trip using only means of public transport,
- a person having a driver’s license for a year longer has about 37% less chance of choosing a trip using only means of public transport, and
- a person who carries out more the number of kilometers driven during a year has about 43% less chance of choosing a trip using only means of public transport. Also, those not working (by 142%) are more likely to choose this hypothetical travel scenario.
- A person older than another person has approximately 21% less chance of choosing a mixed journey,
- a person with a lower level of education than other people has about 48% less chance of choosing a mixed journey,
- a person having a driving license for a year longer has about 25% less chance of choosing a mixed journey, and
- a person who performs more the number of kilometers driven during a year has about 14% less chance of choosing a mixed journey. The nonworking (by 71%) are also less likely to choose this hypothetical travel scenario.
7. Discussion and Conclusions
Author Contributions
Funding
Institutional Review Board Statement
Informed Consent Statement
Data Availability Statement
Acknowledgments
Conflicts of Interest
References
- Guerra, E.; Cervero, R.; Tischler, D. Half-mile circle: Does it best represent transit station catchments? Transp. Res. Rec. 2012, 2276, 101–109. [Google Scholar] [CrossRef]
- Kuby, M.; Barranda, A.; Upchurch, C. Factors influencing light-rail station boardings in the United States. Transp. Res. Part A Policy Pract. 2004, 38, 223–247. [Google Scholar] [CrossRef]
- Macioszek, E. Electric Vehicles-Problems and Issues. In Smart and Green Solutions for Transport Systems. Advances in Intelligent Systems and Computing; Sierpiński, G., Ed.; Springer: Cham, Switzerland, 2020; Volume 1091, pp. 169–183. [Google Scholar]
- Norlida, A.H.; Jamilah, M.; Karim, M.R. Parking duration of fringe Park-and-ride users and delineation of stations Catchment Area: Case of the Kuala Lumpur conurbation. J. East. Asia Soc. Transp. Stud. 2007, 7, 1296–1310. [Google Scholar]
- Hendricks, S.; Outwater, M. Demand forecasting model for park-and-ride lots in King County, Washington. Transp. Res. Rec. 1998, 1623, 80–87. [Google Scholar] [CrossRef]
- Kimpton, A.; Pojani, D.; Sipe, N.; Corcoran, J. Parking Behaviour: Park ‘n’ Ride (PnR) to encourage multimodalism in Brisbane. Land Use Policy 2020, 91, 1–16. [Google Scholar] [CrossRef]
- Turnbull, K.F. Effective use of park-and-ride facilities. National Cooperative Research Program Synthesis. Transp. Res. Board 1995, 213, 1–51. [Google Scholar]
- Mather, J. Guidelines and standards for the planning, design, and operation of bus park-and-ride facilities. Transp. Res. Rec. 1983, 908, 1–6. [Google Scholar]
- Maricopa Association of Governments. MAG Park-and-Ride Site Selection Study. Phoenix, Arizona. 2001. Available online: https://www.azmag.gov/Portals/0/Documents/TC_2011-04-14_AGD.pdf?ver=2017-04-06-111814-837 (accessed on 15 January 2019).
- Farhan, B.; Murray, A.T. Siting park-and-ride facilities using a multi-objective spatial optimization model. Comput. Oper. Res. 2008, 35, 445–456. [Google Scholar] [CrossRef]
- Wang, H.; Meng, Q.; Zhang, X.N. Park-and-ride network equilibrium with heterogeneouscommuters and parking space constraint. Transp. Res. Rec. 2014, 2466, 87–97. [Google Scholar] [CrossRef]
- Fan, W.; Khan, M.B.; Ma, J.; Jiang, X. Bilevel programming model for locating park-and-ride facilities. J. Urban Plan. Dev. 2014, 140, 04014007. [Google Scholar] [CrossRef]
- Chen, X.Y.; Yang, X.K.; Xu, Z. Location Configuration Design of New Park-and-Ride Facilities in Beijing, China. In CICTP 2012: Multimodal Transportation Systems-Convenient, Safe, Cost-Effective, Efficient; Twelfth COTA International Conference of Transportation Professionals; ASCE: Beijing, China, 2012; pp. 11–22. [Google Scholar]
- Song, Z.; He, Y.; Zhang, L. Integrated planning of park and ride facilities and transit service. Transp. Res. Part C Emerg. Technol. 2017, 74, 182–195. [Google Scholar] [CrossRef]
- Khakbaz, A.; Nookabadi, A.S.; Shetab-Bushehri, S.N. A model for locating park-and-ride facilities on urban networks based on maximizing flow capture: A case study of Isfahan, Iran. Netw. Spat. Econ. 2013, 13, 43–66. [Google Scholar] [CrossRef]
- Chen, X.; Liu, Z.; Currie, G. Optimizing location and capacity of rail-based Park-and-Ride sites to increase public transport usage. Transp. Plan. Technol. 2016, 39, 507–526. [Google Scholar] [CrossRef]
- Webb, A.; Khani, A. Park-and-Ride Choice Behavior in a Multimodal Network with Overlapping Routes. Transp. Res. Rec. 2020, 2674, 150–160. [Google Scholar] [CrossRef]
- Bos, I.; Molin, E. Is there a “Stick” Bonus? A Stated Choice Model for P&R Patronage incorporating cross Effects. Eur. J. Transp. Infrastruct. Res. 2006, 6, 275–290. [Google Scholar] [CrossRef]
- He, B.; He, W.; He, M. The attitude and preference of traveler to the Park & Ride facilities: A case study in Nanjing, China. Procedia Soc. Behav. Sci. 2012, 43, 294–301. [Google Scholar]
- Du, Y.C.; Wang, J.; Liu, L.; Sun, L. How to Improve the Efficiency of Park-and-Ride: A Case Study in Shanghai, China. In Proceedings of the 15 th COTA International Conference of Transportation Professionals, Beijing, China, 25–27 July 2015; pp. 1238–1249. [Google Scholar]
- Clayton, W.; Ben-Elia, E.; Parkhurst, G.; Ricci, M. Where to park? A behavioural comparison of bus Park and Ride and city centre car park usage in Bath, UK. J. Transp. Geogr. 2014, 36, 124–133. [Google Scholar] [CrossRef]
- Liu, X.; Yun, M.; Chen, Z.; Yang, X. Investigation, analysis, and modeling of choice behavior of park and ride. In CICTP 2012: Multimodal Transportation Systems-Convenient, Safe, Cost-Effective, Efficien; ASCE: Reston, VA, USA, 2012; pp. 1643–1651. [Google Scholar]
- Zhao, X.; Li, Y.; Xia, H. Behavior decision model for park-and-ride facilities utilization. Adv. Mech. Eng. 2017, 9, 1–9. [Google Scholar] [CrossRef]
- Huang, K.; Zhu, T.; An, K.; Liu, Z.; Kim, I. Analysis of the acceptance of park-and-ride by users. J. Transp. Land Use 2019, 12, 637–647. [Google Scholar] [CrossRef]
- Kono, Y.; Uchida, K.; Andrade, K. Economical welfare maximisation analysis: Assessing the use of existing Park-and-Ride services. Transportation 2014, 41, 839–854. [Google Scholar] [CrossRef]
- Qin, H.; Guan, H.; Wu, Y.J. Analysis of park-and-ride decision behavior based on Decision Field Theory. Transp. Res. Part F Traffic Psychol. Behav. 2013, 18, 199–212. [Google Scholar] [CrossRef]
- Macioszek, E.; Kurek, A. The use of a Park and Ride system—A case study based on Cracow city (Poland). Energies 2020, 13, 3473. [Google Scholar] [CrossRef]
- Macioszek, E. First and last mile delivery-problems and issues. In Advanced Solutions of Transport Systems for Growing Mobility. Advances in Intelligent Systems and Computing; Sierpiński, G., Ed.; Springer: Cham, Switzerland, 2018; Volume 631, pp. 147–154. [Google Scholar]
- Szarata, A. Wpływ parkingów Park and Ride na czas przejazdu odcinka w sieci ulicznej-porównanie metody analitycznej i symulacyjnej. Zesz. Nauk. Bud./Politech. Śląska 2004, 102, 511–518. [Google Scholar]
- Szarata, A. Prognozowanie podróży park and ride metodą modelowania. Zesz. Nauk. Tech. Stow. Inżynierów I Tech. Komun. W Krakowie Ser. Mater. Konf. 2007, 80, 157–174. [Google Scholar]
- Szarata, A. Defining shape of membership function for Mamdani’s Fuzzy Inference System within park & ride share modelling. Aip Conf. Proc. 2015, 1648, 600004-1–600004-5. [Google Scholar]
- Brzeziński, A.; Jesionkiewicz-Niedzińska, K.; Rogala, A. Wady i zalety systemu Parkuj i jedź na przykładzie aglomeracji warszawskiej. Transp. Miej. I Reg. 2013, 8, 4–9. [Google Scholar]
- Kowalski, M.; Górecka, A. Problemy wykorzystania parkingów systemu P + R w Warszawie. Logistyka 2014, 4, 3598–3606. [Google Scholar]
- Kurek, A. Analysis of transport availability of Warsaw city. Master’s Thesis, Transport Systems and Traffic Engineering Department, Faculty of Transport and Aviation Engineering, Silesian University of Technology, Katowice, Poland, 2019. [Google Scholar]
- Fierek, S.; Bieńczak, M.; Zmuda-Trzebiatowski, P. Multiple criteria evaluation of P&R lots location. Transp. Res. Procedia 2020, 47, 489–496. [Google Scholar]
- Lower, A.; Lower, M.; Masztalski, R.; Szumilas, A. The Location of Park and Ride Facilities Using the Fuzzy Inference Model. World Acad. Sci. Eng. Technol. Int. J. Civ. Environ. Eng. 2015, 10, 1367–1374. [Google Scholar]
- Parkitny, W. Model matematyczny wyboru lokalizacji miejsc przesiadkowych i parkingów dla systemu P & R. Zesz. Nauk. -Tech. Stow. Inżynierów I Tech. Komun. W Krakowie. Ser. Mater. Konf 2007, 80, 137–146. [Google Scholar]
- Public Transport Authority in Warsaw Website. Available online: https://www.ztm.waw.pl/ (accessed on 8 January 2019).
- Szarata, A. with the Team; Jacyna, M. with the Team. WBR 2005, Warsaw Traffic Study along with the Development of a Traffic Model: Synthesis. BPRW S.A. Available online: http://transport.um.warszawa.pl/wbr-2015 (accessed on 1 March 2020).
- Central Statistical Office in Poland. Available online: www.stat.gov.pl/ (accessed on 12 March 2019).
- Jacyna, M.; Wasiak, M. Multicriteria decision support in designing transport systems. Commun. Comput. Inf. Sci. 2015, 531, 11–23. [Google Scholar]
- Jacyna, M.; Wasiak, M.; Lewczuk, K.; Kłodawski, M. Simuation model of transport system of Poland as a tool for developing sustainable transport. Arch. Transp. 2014, 31, 23–35. [Google Scholar] [CrossRef]
- Jacyna, M.; Kłodawski, M. Model of transportation network development in aspect of transport comodality. In Proceedings of the ICSEng 2011: International Conference on Systems Engineering, LAs Vegas, NV, USA, 16–18 August 2011; pp. 341–345. [Google Scholar]
- Jacyna, M. The urban logistics service in the aspect of the domestic logistic system. Wit Trans. Built Environ. 2011, 116, 117–128. [Google Scholar]
- Jacyna, M.; Lewczuk, K.; Szczepański, E.; Gołębiowski, P.; Jachimowski, R.; Kłodawski, M.; Pyza, D.; Sivets, O.; Wasiak, M.; Żak, J.; et al. Effectiveness of national transport system according to costs of emission of pollutants. Safety and Reliability: Methodology and Applications. In Proceedings of the European Safety and Reliability Conference, Wroclaw, Poland, 14–18 September 2014; pp. 559–567. [Google Scholar]
- Macioszek, E. Changes in Values of Traffic Volume—Case Study Based on General Traffic Measurements in Opolskie Voivodeship (Poland). In Directions of Development of Transport Networks and Traffic Engineering. Lecture Notes in Networks and Systems; Macioszek, E., Sierpiński, G., Eds.; Springer: Cham, Switzerland, 2019; Volume 51, pp. 66–76. [Google Scholar]
- Open Street Map. Available online: https://www.openstreetmap.org/#map=11/52.1792/20.9722 (accessed on 12 May 2019).
- The Website of Warsaw Subway. Available online: www.metro.waw.pl (accessed on 24 March 2019).
- Warsaw Public Transport Website. Available online: https://www.wtp.waw.pl/parkingi/ (accessed on 1 January 2019).
- Olszewski, P. Dostępność piesza jako element jakości komunikacji miejskiej. Transp. Miej. I Reg. 2008, 1, 19–33. [Google Scholar]
- Cronbach, L.J. Coefficient alpha and the internal structure of tests. Psychometrica 1951, 16, 297–334. [Google Scholar] [CrossRef]
- Tavakol, M.; Dennick, R. Making sense of Cronbach’s alpha. Int. J. Med Educ. 2011, 2, 53–55. [Google Scholar] [CrossRef]
- Carmines, E.G.; Zeller, R.A. Reliability and Validity Assessment; Sage Publications: New York, NY, USA, 1982. [Google Scholar]
- Macioszek, E.; Świerk, P.; Kurek, A. The Bike-Sharing System as an Element of Enhancing Sustainable Mobility—A Case Study based on a City in Poland. Sustainability 2020, 12, 3285. [Google Scholar] [CrossRef]
- Yurdugul, H. Minimum sample size for Cronbach’s coefficient alpha: A Monte-Carlo study. Hacet. Univ. J. Educ. 2008, 35, 397–405. [Google Scholar]
- Streiner, D. Starting at the beginning: An introduction to coefficient alpha and internal consistency. J. Personal. Assess. 2003, 80, 99–103. [Google Scholar] [CrossRef]
- Cortina, J.M. What is Coefficient Alpha? An Examination of Theory and Applications. J. Appl. Psychol. 1993, 78, 98–104. [Google Scholar] [CrossRef]
- Macioszek, E. The comparison of models for follow-up headway at roundabouts. In Recent Advances in Traffic Engineering for Transport Networks and Systems. Lecture Notes in Networks and Systems; Macioszek, E., Sierpiński, G., Eds.; Springer: Cham, Switzerland, 2018; Volume 21, pp. 16–26. [Google Scholar]
- Boone, H.N.; Boone, D.A. Analyzing Likert Data. J. Ext. 2012, 50, 1–5. [Google Scholar]
- Allen, E.; Seaman, C.A. Likert Scales and Data Analyses. Qual. Prog. 2007. Available online: http://rube.asq.org/quality-progress/2007/07/statistics/likert-scales-and-data-analyses.html (accessed on 3 April 2019).
- Jamieson, S. Likert scales: How to (ab) use them. Med Educ. 2004, 38, 1212–1218. [Google Scholar] [CrossRef] [PubMed]
- Survey Online. Available online: https://www.survio.com/pl/ (accessed on 3 January 2017).
- Google Maps. Available online: https://www.google.pl/maps (accessed on 10 April 2019).
- Bąk, A. Modele kategorii nieuporządkowanych w badaniach preferencji. Pr. Nauk. Uniw. Ekon. We Wrocławiu 2012, 242, 86–95. [Google Scholar]
- Dziechciarz-Duda, M. Analiza zasobności materialnej gospodarstw domowych w świetle wybranych potrzeb. Pr. Nauk. Uniw. Ekon. We Wrocławiu 2018, 508, 38–47. [Google Scholar] [CrossRef]
- Zeliaś, A. Metody Statystyczne. Zadania i Sprawdziany; PWE: Warsaw, Poland, 2002. [Google Scholar]


| Research Work by Author | Characteristics of the Respondents | Travel Characteristics | Factors Related to the Use of P&R Facility | ||||||||||||||||||||||||||||||||||||||
|---|---|---|---|---|---|---|---|---|---|---|---|---|---|---|---|---|---|---|---|---|---|---|---|---|---|---|---|---|---|---|---|---|---|---|---|---|---|---|---|---|---|
| Gender | Age | Income | Education | Place of Employment | Car Ownership | Having Children | The Number of Years Having a Driving License | Place of Residence | Travel Frequency | Frequency of the Using a Car | The Number of kilometers Driven during a Year by a Car | Destination | Travel Mode | Distance to Destination | Distance between the Destination and the Public Transport Stop | Travel Time | Driving Time | Travel Time by Means of Public Transport | Parking Time in the P&R Facility | Transfer Time from the Parking to the Public Transport Stop | Waiting Time for a Transfer | Transfer Mode | Travel Cost | Number of People Traveling Together | Use of the P&R Facility | Information on P&R Facility | Connection to Public Transport Near the Destination | The Quality of Public Transport | Traffic Volume | The Availability of Parking Spaces Near the Destination | Parking Fee | Fuel Cost | Cost of the Ticket for Travel by Means of Public Transport | Transfer Time | Transfer Convenience | Road Stress | Knowing the Road | Safety on the Parking | Environmental Friendliness | Factors Limiting the Use of the P&R Facility | |
| B. He et al. [19] | x | x | x | x | x | x | x | x | x | x | x | x | x | x | x | x | |||||||||||||||||||||||||
| Y. Du et al. [20] | x | x | x | x | x | x | x | x | x | x | x | x | |||||||||||||||||||||||||||||
| W. Clayton et al. [21] | x | x | x | x | x | ||||||||||||||||||||||||||||||||||||
| X. Liu et al. [22] | x | x | x | x | x | x | x | x | x | ||||||||||||||||||||||||||||||||
| X. Zhao et al. [23] | x | x | x | x | x | x | x | x | x | x | x | x | x | x | x | x | x | x | x | x | |||||||||||||||||||||
| S. Islam et al. [19] | x | x | x | x | x | x | x | x | x | x | x | ||||||||||||||||||||||||||||||
| K. Huang et al. [24] | x | x | x | x | x | x | x | x | x | x | x | x | x | x | |||||||||||||||||||||||||||
| Y. Kono et al. [25] | x | x | x | x | x | x | x | x | x | x | x | x | x | x | |||||||||||||||||||||||||||
| H. Qin et al. [26] | x | x | x | x | x | x | x | x | x | x | x | x | x | x | x | x | x | x | |||||||||||||||||||||||
| P&R Facility Name | Date of Opening | Total Number of Parking Spaces | Number of Parking Spaces for People with Disabilities | Number of Parking Spaces for Bike |
|---|---|---|---|---|
| Metro Stokłosy | 05. 01. 2009 | 393 | 6 | 20 |
| Metro Młociny III | 19. 02. 2018 | 157 | 6 | 24 |
| Metro Ursynów | 11. 12. 2009 | 166 | 7 | 100 |
| Anin SKM | 16. 11. 2009 | 83 | 3 | 100 |
| Facility | P&R Metro Stokłosy | P&R Metro Młociny III | P&R Metro Ursynów | P&R Anin SKM | |
|---|---|---|---|---|---|
| Stop/Station | |||||
| Bus [m] | 103.2 | 364.0 | 223.6 | 545.8 | |
| Tram [m] | 3182.4 | 624.6 | 1545.2 | 10,269.2 | |
| Metro [m] | 581.6 | 502.0 | 564.0 | 12,103.2 | |
| Railway [m] | 8258.4 | 9134.8 | 5196.8 | 159.6 | |
| Bike-sharing [m] | 1023.6 | 728.0 | 199.6 | 2464.8 | |
| Hypothetical Journey Scenario | Travel Mode to Destination | Driving Time [min] | Transfer Time [min] | Walking Time to the Destination [min] | Travel Cost [PLN] ([€]) | Components of Travel Costs |
|---|---|---|---|---|---|---|
| 1. | Only car | 35 | 0 | 3 | 17.40 (3.88) and fuel price (depend on traveling distance) | Parking fee, fuel price |
| 2. | Only means of public transport | 61 | 12 | 2 | 4.00 (0.89) | Ticket for travel by means of public transport |
| 3. | A mixed journey, i.e., driving to the P&R facility by car and then changing the means of transport to public transport | 45 | 6 | 2 | 4.00 (0.89) and fuel price (depend on traveling distance) | Ticket for travel by means of public transport, fuel price |
| Month | Nonworking Days | Days before and after Nonworking Days |
|---|---|---|
| January | 01. 01. 2018—New Year 06. 01. 2018—Feast of the Three Kings | 02. 01. 2018—the impact of New Year |
| February | - | - |
| March | - | 30. 03. 2018 and 31. 03. 2018—the impact of Easter |
| April | 01. 04. 2018—Easter 02. 04. 2018—Easter Monday | 30. 04. 2018—the impact of the May holidays |
| May | 01. 05. 2018—Labor Day 03. 05. 2018—Constitution Day 10. 05. 2018—Whit Sunday 31. 05. 2018—Corpus Christi | 02. 05. 2018 and 04. 05. 2018—the impact of the May holidays |
| June | - | - |
| July | - | - |
| August | 15. 08. 2018—Armed Forces Day | - |
| September | - | - |
| October | - | - |
| November | 01. 11. 2018—All Saints’ Day 11. 11. 2018—Independence Day 12.11.2018—after Independence Day | 02. 11. 2018—the impact of All Saints’ Day |
| December | 25. 12. 2018—Christmas Day 26. 12. 2018—Second Day of Christmas | 24. 12. 2018—Christmas Eve 27. 12. 2018 and 28. 12. 2018—the impact of the Christmas 31. 12. 2018—New Year’s Eve |
| P&R Facility | Metro Stokłosy | Metro Młociny III | Metro Ursynów | Anin SKM |
|---|---|---|---|---|
| Bus stop name | Ursynów Południowy, Metro Stokłosy | Metro Młociny | Koncertowa, Metro Ursynów | PKP Anin |
| Tram stop name | Wyścigi | Metro Młociny | Wyścigi | - |
| Metro station name | Stokłosy | Młociny | Ursynów | - |
| Railway station name | - | - | - | Warszawa Anin |
| Bike-sharing station name | Metro Stokłosy | Metro Młociny | Metro Ursynów I, Metro Ursynów II | - |
| Nearby public utility buildings (traffic generators) | Shopping center KEN CENTER, House of Culture Stokłosy, Primary schools, High school | ZUS, Huta | Park Romana Kozłowskiego, Furniture store Komfort, Primary school | Primary school, center of sport and recreation, district police headquarters |
| Independent Variables (Quantitative) | Min Value | Max Value | Average Value | Standard Deviation |
|---|---|---|---|---|
| Age | 18 | 63 | 31 | 11.98 |
| Income [PLN] | 0 | 7500 | 3035.15 | 2148.46 |
| The number of years having a driving license | 1 | 42 | 10 | 7.76 |
| The average number of journeys made by day | 1 | 4 | 2.72 | 1.82 |
| The number of cars in the household | 1 | 4 | 2.45 | 1.60 |
| The average time spent traveling during the day | 15 | 200 | 71 | 47.98 |
| The number of kilometers driven during a year | 600 | 50,000 | 16,115.76 | 13,480.57 |
| Independent Variables (Quantitative) | H0 | H1 | Test Statistics p |
|---|---|---|---|
| Age | The average age of respondents who use the P&R facility is the same as the average age of respondents who do not use the P&R facility | The average age of respondents who use the P&R facility differs from the average age of respondents who do not use the P&R facility | 0.016 |
| Income [PLN] | The average income of respondents who use the P&R facility is the same as the average income of respondents who do not use the P&R facility | The average income of respondents who use the P&R facility differs from the average income of respondents who do not use the P&R facility | 0.024 |
| The number of years having a driving license | The average number of years of driving license for respondents who use the P&R facility is the same as the average number of years of driving license for respondents who do not use the P&R facility | The average number of years of driving license for respondents who use P&R facility differs from the average number of years of driving license for respondents who do not use P&R facility | 0.023 |
| The average number of journeys made by day | The average number of journeys made per day by respondents who use the P&R facility is the same as the average number of journeys made per day by respondents who do not use the P&R facility | The average number of journeys made per day by respondents who use the P&R facility differs from the average number of journeys made per day by respondents who do not use the P&R facility | 0.025 |
| The number of cars in the household | The average number of cars in a household of respondents who use the P&R facility is the same as the average number of cars in a household of respondents who do not use the P&R facility | The average number of cars in a household of respondents who use the P&R facility differs from the average number of cars in a household of respondents who do not use the P&R facility | 0.025 |
| The average time spent traveling during the day | The average time spent traveling during the day by respondents who use the P&R facility is the same as the average time spent traveling during the day by respondents who do not use the P&R facility | The average time spent traveling during the day by respondents who use the P&R facility differs from the average time spent traveling during the day by respondents who do not use the P&R facility | 0.022 |
| The number of kilometers driven during a year | The average number of kilometers traveled by car per year by respondents who use the P&R facility is the same as the average number of kilometers traveled by car per year by respondents who do not use the P&R facility | The average number of kilometers traveled by car per year by respondents who use the P&R facility differs from the average number of kilometers traveled by car per year by respondents who do not use the P&R facility | 0.027 |
| No. | Independent Variables (Xi) | Correlation Coefficient |
|---|---|---|
| 1. | PL | 0.72 |
| 2. | WI | 0.41 |
| 3. | WY | 0.67 |
| 4. | WZ | 0.35 |
| 5. | LPJ | 0.44 |
| 6. | LSGD | 0.64 |
| 7. | LP | 0.53 |
| 8. | LKMR | 0.48 |
| No. | Variables | Characteristics | Symbol |
|---|---|---|---|
| 1. | PL | Male | 0 |
| Female | 1 | ||
| 2. | WI [years] | 18–24 | 0 |
| 25–34 | 1 | ||
| 35–44 | 2 | ||
| 45–54 | 3 | ||
| 55 and more | 4 | ||
| 3. | WY | Higher | 0 |
| Secondary | 1 | ||
| Vocational | 2 | ||
| Primary | 3 | ||
| 4. | WZ | Working | 0 |
| Student | 1 | ||
| Pensioner | 2 | ||
| Non employed | 3 | ||
| 5. | LPJ [years] | 1 | 0 |
| 2 | 1 | ||
| 3 | 2 | ||
| 4 | 3 | ||
| 5 | 4 | ||
| 6 | 5 | ||
| 7 | 6 | ||
| 8 | 7 | ||
| 9 | 8 | ||
| 10 and more | 9 | ||
| 6. | LSGD | 1 | 0 |
| 2 | 1 | ||
| 3 | 2 | ||
| 4 and more | 3 | ||
| 7. | LP [trip] | 1 | 0 |
| 2 | 1 | ||
| 3 | 2 | ||
| 4 | 3 | ||
| 5 | 4 | ||
| 6 and more | 5 | ||
| 8. | LKMR [km] | 0–999 | 0 |
| 1000–4999 | 1 | ||
| 5000–9999 | 2 | ||
| 10,000–14,999 | 3 | ||
| 15,000–19,999 | 4 | ||
| 20,000 and more | 5 |
| Variable | Model A | Model B | Model C | ||||
|---|---|---|---|---|---|---|---|
| α | p-Value | α | p-Value | α | p-Value | ||
| Y1 (First hypothetical travel scenario) | |||||||
| PL | 0.116 | 0.250 | −0.105 | 0.502 | - | - | |
| WI | −0.154 | 0.012 | −0.148 | 0.016 | - | - | |
| WY | −0.165 | 0.103 | −0.159 | 0.115 | - | - | |
| WZ | −0.116 | 0.351 | −0.109 | 0.377 | - | - | |
| LPJ | 0.009 | 0.745 | 0.011 | 0.704 | - | - | |
| LSGD | 0.048 | 0.491 | 0.217 | 0.595 | - | - | |
| LP | 0.245 | 0.281 | - | - | 0.054 | 0.537 | |
| LKMR | 0.008 | 0.853 | - | - | 0.013 | 0.754 | |
| 0.321 | 0.078 | −0.775 | 0.063 | 0.035 | 0.909 | ||
| Y2 (Second hypothetical travel scenario) | |||||||
| PL | 0.274 | 0.057 | −0.703 | 0.395 | - | - | |
| WI | −0.149 | 0.760 | −0.321 | 0.488 | - | - | |
| WY | −0.442 | 0.029 | −0.159 | 0.115 | - | - | |
| WZ | 0.972 | 0.199 | 0.624 | 0.381 | - | - | |
| LPJ | −0.449 | 0.035 | −0.461 | 0.026 | - | - | |
| LSGD | −0.019 | 0.962 | −0.035 | 0.564 | - | - | |
| LP | 0.049 | 0.431 | - | - | 0.001 | 0.390 | |
| LKMR | −0.643 | 0.029 | - | - | −0.018 | 0.089 | |
| −0.800 | 0.052 | 0.775 | 0.056 | 0.306 | 0.637 | ||
| Y3 (Third hypothetical travel scenario) | |||||||
| PL | −0.608 | 0.346 | 0.555 | 0.377 | - | - | |
| WI | −0.267 | 0.316 | −0.286 | 0.255 | - | - | |
| WY | −0.729 | 0.123 | −0.608 | 0.162 | - | - | |
| WZ | 0.561 | 0.313 | 0.513 | 0.349 | - | - | |
| LPJ | −0.275 | 0.116 | −0.265 | 0.122 | - | - | |
| LSGD | 0.005 | 0.993 | 0.082 | 0.763 | - | - | |
| LP | 0.058 | 0.764 | - | - | 0.027 | 0.986 | |
| LKMR | −0.168 | 0.382 | - | - | 0.026 | 0.575 | |
| −0.094 | 0.762 | −0.226 | 0.451 | −0.317 | 0.049 | ||
| Ch-square | 29.090 | 26.274 | 1.578 | ||||
| Log-likelhood | −1331.48 | −813.623 | −169.105 | ||||
| Log-likelhood 0 | −1346.03 | −826.76 | −169.894 | ||||
| R2 Nagelkerke | 0.026 | 0.023 | 0.001 | ||||
| R2 McFadden | 0.009 | 0.008 | 0 * | ||||
| R2 Cox and Snell | 0.024 | 0.021 | 0.001 | ||||
| Variable | Model D | Model E | Model F | ||||
|---|---|---|---|---|---|---|---|
| α | p-Value | α | p-Value | α | p-Value | ||
| Y1 (First hypothetical travel scenario) | |||||||
| PL | - | - | - | - | −0.679 | 0.003 | |
| WI | −0.148 | 0.012 | - | - | −0.551 | 0.255 | |
| WY | −0.127 | 0.098 | −0.613 | 0.278 | −0.505 | 0.036 | |
| WZ | −0.120 | 0.322 | 0.072 | 0.896 | −0.129 | 0.196 | |
| LPJ | - | - | −0.426 | 0.007 | −0.324 | 0.837 | |
| LSGD | - | - | - | - | - | - | |
| LP | 0.069 | 0.297 | - | - | - | - | |
| LKMR | - | - | −0.238 | 0.128 | −0.217 | 0.055 | |
| 0.382 | 0.010 | 4.424 | 0.003 | 4.621 | 0.187 | ||
| Y2 (Second hypothetical travel scenario) | |||||||
| PL | - | - | - | - | 0.273 | 0.751 | |
| WI | −0.208 | 0.029 | - | - | −0.107 | 0.827 | |
| WY | −0.167 | 0.009 | −0.405 | 0.040 | 1.775 | 0.039 | |
| WZ | −0.113 | 0.544 | 0.764 | 0.278 | 0.884 | 0.235 | |
| LPJ | - | - | −0.534 | 0.006 | −0.466 | 0.028 | |
| LSGD | - | - | - | - | - | - | |
| LP | 0.024 | 0.254 | - | - | - | - | |
| LKMR | - | - | −0.622 | 0.009 | −0.568 | 0.029 | |
| −0.074 | 0.001 | 4.424 | 0.006 | 4.135 | 0.025 | ||
| Y3 (Third hypothetical travel scenario) | |||||||
| PL | - | - | - | - | −0.611 | 0.341 | |
| WI | −0.208 | 0.002 | - | - | −0.236 | 0.350 | |
| WY | −0.440 | 0.243 | −0.702 | 0.151 | −0.661 | 0.133 | |
| WZ | −0.038 | 0.772 | 0.550 | 0.283 | 0.537 | 0.329 | |
| LPJ | - | - | −0.345 | 0.032 | −0.284 | 0.103 | |
| LSGD | - | - | - | - | - | - | |
| LP | 0.044 | 0.599 | - | - | - | - | |
| LKMR | - | - | −0.159 | 0.348 | −0.156 | 0.383 | |
| −0.723 | 0.651 | 3.155 | 0.034 | 3.241 | 0.037 | ||
| Ch-square | 23.077 | 21.943 | 23.925 | ||||
| Log-likelhood | −370.034 | −308.597 | −151.505 | ||||
| Log-likelhood 0 | −381.573 | −319.569 | −163.468 | ||||
| R2 Nagelkerke | 0.020 | 0.019 | 0.021 | ||||
| R2 McFadden | 0.007 | 0.007 | 0.008 | ||||
| R2 Cox and Snell | 0.019 | 0.018 | 0.019 | ||||
| Variable | Model D | Model E | Model F | |||
|---|---|---|---|---|---|---|
| Wald Statistics | Wald Statistics | Wald Statistics | ||||
| Y1 (First hypothetical travel scenario) | ||||||
| PL | - | - | - | - | 1.29 | 0.51 |
| WI | 6.27 | 0.86 | - | - | 4.41 | 0.58 |
| WY | 2.73 | 0.85 | 1.78 | 0.67 | 1.67 | 0.60 |
| WZ | 0.98 | 0.87 | 0.02 | 1.07 | 0.04 | 0.88 |
| LPJ | - | - | 7.21 | 0.65 | 3.69 | 0.72 |
| LSGD | - | - | - | - | - | - |
| LP | 1.09 | 1.04 | - | - | - | - |
| LKMR | - | - | 2.31 | 0.79 | 1.74 | 0.80 |
| Y2 (Second hypothetical travel scenario) | ||||||
| PL | - | - | - | - | 0.10 | 1.31 |
| WI | 4.73 | 0.81 | - | - | 0.05 | 0.89 |
| WY | 6.68 | 0.64 | 4.21 | 0.18 | 4.22 | 0.17 |
| WZ | 0.37 | 0.89 | 1.17 | 2.15 | 1.41 | 2.42 |
| LPJ | - | - | 7.52 | 0.59 | 4.85 | 0.63 |
| LSGD | - | - | - | - | - | - |
| LP | 1.30 | 1.07 | - | - | - | - |
| LKMR | - | - | 6.70 | 0.54 | 1.74 | 0.57 |
| Y3 (Third hypothetical travel scenario) | ||||||
| PL | - | - | - | - | 4.35 | 0.54 |
| WI | 9.79 | 0.81 | - | - | 0.91 | 0.79 |
| WY | 1.36 | 0.88 | 2.06 | 0.54 | 0.87 | 0.52 |
| WZ | 0.08 | 0.96 | 1.15 | 1.73 | 2.26 | 1.71 |
| LPJ | - | - | 4.61 | 0.71 | 0.95 | 0.75 |
| LSGD | - | - | - | - | 2.66 | - |
| LP | 0.28 | 1.02 | - | - | - | - |
| LKMR | - | - | 0.88 | 0.71 | 0.76 | 0.86 |
Publisher’s Note: MDPI stays neutral with regard to jurisdictional claims in published maps and institutional affiliations. |
© 2021 by the authors. Licensee MDPI, Basel, Switzerland. This article is an open access article distributed under the terms and conditions of the Creative Commons Attribution (CC BY) license (http://creativecommons.org/licenses/by/4.0/).
Share and Cite
Macioszek, E.; Kurek, A. The Analysis of the Factors Determining the Choice of Park and Ride Facility Using a Multinomial Logit Model. Energies 2021, 14, 203. https://doi.org/10.3390/en14010203
Macioszek E, Kurek A. The Analysis of the Factors Determining the Choice of Park and Ride Facility Using a Multinomial Logit Model. Energies. 2021; 14(1):203. https://doi.org/10.3390/en14010203
Chicago/Turabian StyleMacioszek, Elżbieta, and Agata Kurek. 2021. "The Analysis of the Factors Determining the Choice of Park and Ride Facility Using a Multinomial Logit Model" Energies 14, no. 1: 203. https://doi.org/10.3390/en14010203
APA StyleMacioszek, E., & Kurek, A. (2021). The Analysis of the Factors Determining the Choice of Park and Ride Facility Using a Multinomial Logit Model. Energies, 14(1), 203. https://doi.org/10.3390/en14010203