Article

Numerical Study on Sectional Loads and Structural Optimization of an Elastic Semi-Submersible Floating Platform

1
Changjiang Institute of Survey, Planning, Design and Research, No.1863 Jiefang Avenue, Wuhan 430010, China
2
Department of Civil Engineering, School of Engineering, The University of Tokyo, 7-3-1 Hongo, Bunkyo, Tokyo 113-8656, Japan
*
Author to whom correspondence should be addressed.
Energies 2021, 14(1), 182; https://doi.org/10.3390/en14010182
Submission received: 26 November 2020 / Revised: 22 December 2020 / Accepted: 29 December 2020 / Published: 31 December 2020
(This article belongs to the Special Issue Floating Offshore Wind Turbines)

Abstract

:
This study investigates the sectional loads on an elastic semi-submersible platform for a 2 MW FOWT (floating offshore wind turbine) used in the Fukushima demonstration project. A water tank test is firstly carried out with an elastic model to study the dynamic responses and sectional loads of the platform in regular and irregular waves. Numerical simulations are then performed using multiple hydrodynamic bodies connected by elastic beams. The dynamic responses of the elastic model are compared to those of a rigid model to clarify the influence of the structural stiffness on the platform motion and mooring tension. The predicted sectional loads on the deck, brace and pontoon by the proposed nonlinear hydrodynamic models show good agreement with the experimental data obtained from the water tank test and a simplified formula is proposed to evaluate the distribution of the moments on the platform. Finally, the structural optimization of the elastic semi-submersible platform is conducted. The sectional moments and fatigue loadings on the pontoons are significantly reduced using the strut between the pontoons since the horizontal wave loads on the side column are dominant and the vertical wave loads acting on the platform are relatively small due to the deep draft.

1. Introduction

Floating offshore wind turbines (FOWTs) have been considered the best way to harvest wind energy in deep water regions. Compared to a bottom-fixed foundation, a floating platform has fewer constraints regarding water depth and soil conditions. For FOWTs, however, the high costs associated with the design, construction, installation and maintenance are problems that need to be solved. One of the strategies to reduce the levelized cost of energy is increasing power generation [1] and decreasing the amount of steel used for the platform [2], which implies that a larger wind turbine and flexible platform are designed. Thereafore, structure analysis and optimization for the platform are critical for cost reduction and safe design.
Some aero-hydro-servo-elastic tools have been developed for the prediction of the dynamic responses of platform and mooring lines [3,4]. The linear hydrodynamic force coefficients of the platform have been obtained by a potential theory and presented as the matrices of integrated hydrodynamic force coefficients for a rigid platform with six degrees of freedom, which have been used in research. However, since the elastic responses of the platform cannot be captured by a rigid body, the distributed loads and the elastic models were proposed for structural analysis of the platform. Borg et al. [5,6] investigated the hydro-elastic interactions between the flexible floating platform and fluid by using structural modal analysis and boundary element method (BEM). However, this study was not validated by experiments. Silva de Souza and Bachynski [7] concluded that the hydroelasticity had negligible consequences for motion and load responses for a TLP FOWT. The sectional loads of the element of the platform can be easily assessed, as shown in Ishihara et al. [8] and Suzuki [9,10,11] when the Morison’s equation was used to estimate the hydrodynamic load on each element. Campos et al. [12] utilized Morison’s equation to study the interaction between the wind turbine and the platform for a spar FOWT. Morison’s equation performs well when the elements of the platform are slender, while it has a limitation on the evaluation of diffraction force when the diameter of a cylinder is five times larger than the wavelength, as mentioned by Faltinsen [13]. It is inapplicable for some structures with large volumes where the diffraction loads are notable, such as Ideol’s FOWT [14] and an advanced spar FOWT used in the Fukushima demonstration project [15].
The elastic response is critical for the design of floating wind turbines and platforms, especially when the wave frequencies are close to the eigenfrequencies, as pointed out by Lamei and Hayatdavoodi [16]. Zhang and Ishihara [17] found that the natural frequencies of a floating wind turbine with rigid and elastic platforms were different and the elasticity of the platform should be considered in the design of a wind turbine tower. To consider more accurate and efficient responses of the elastic platform, the distributed hydrodynamic loads obtained from BEM were widely used without consideration of hydroelasticity [18,19,20,21,22,23,24]. In this approach, the platform was separated into multiple bodies connected by elastic beam elements. The hydrostatic and hydrodynamic loading of each body is integrated from pressure on the body surface by BEM and applied to the reference point of each body. Guignier et al. [18] compared the dynamic motion of a single body model and a multibody model based on the platform and observed little difference between the motions of the two models. Kvittem and Moan [19] investigated the fatigue damage of the braces considering time history of structural response where Morison’s equation was used to simulate loads on braces and BEM was applied for load prediction of columns. Luan et al. [20,21,22] systematically studied the motion and sectional loads on a concept semi-submersible FOWT with the rectangular cylinders used as pontoons. They concluded that the motion and sectional loads by the multibody model showed good agreement with experiments in the combined wave and wind conditions. However, the distribution of sectional load on the platform was not examined for the pontoon designed with variable cross sections of elements as shown in the Fukushima demonstration project [25]. Moreover, the nonlinear hydrodynamic coefficient models considering the effect of Reynolds and Keulegan–Carpenter (KC) numbers for the multibody have not been proposed yet.
The semi-submersible FOWT usually uses side columns to provide sufficient stability. In the early stage of development for the semi-submersible platform, braces and decks were widely used. In the Fukushima demonstration project [25], the 2 MW wind turbine “Fukushima Mirai” was a four-column semi-submersible FOWT and included three side columns and a center column. The side columns are connected to the center column by the pontoon, brace and deck to form an integrated structure. WindFloat [26] is another well-known floating platform using braces and decks for connecting columns. Recently, a semi-submersible platform without braces and decks, in which columns are connected by the pontoon only, was proposed to reduce costs and simplify the manufacturing process, such as the 7 MW FOWT “Fukushima Shimpuu” [27], which is a semi-submersible platform with three square side columns connected by rectangular pontoons. However, cracks were found on the pontoons during demonstration due to fatigue. This indicates that the elastic response prediction and structural analysis on the element of the platform is significant for cost reduction and safe design.
This study investigates the sectional load on a semi-submersible platform used in the Fukushima demonstration project. In Section 2, the geometry and structural information of the platform are described. The hydrodynamic coefficients for the multiple hydrodynamic bodies and the numerical model considering the elastic beams are developed. In Section 3, a water tank test is carried out with the elastic pontoon, brace and deck. The dynamic response of platform motion and sectional loads on the pontoon, brace and deck are analyzed and validated by the water tank test in regular and irregular waves. A formula is proposed to estimate the distribution of sectional loads on the elements. The sectional loads on the pontoons are analyzed based on the four platforms, with and without struts connecting the pontoons, for the structural optimization of the platform and fatigue load reduction of the pontoon. Finally, the conclusions obtained from this study are presented in Section 4.

2. Models

The dimension and mass properties of a 1:60 scale elastic semi-submersible platform, which is used in the water tank tests and numerical simulations to investigate the dynamic responses and the sectional loadings of the platform, are described in Section 2.1. Section 2.2 proposes the formulae to evaluate the integrated nonlinear hydrodynamic coefficients for the multibody. Finally, the numerical model for the dynamic analysis of the platform and the hydrodynamic force models used in this study are summarized in Section 2.3.

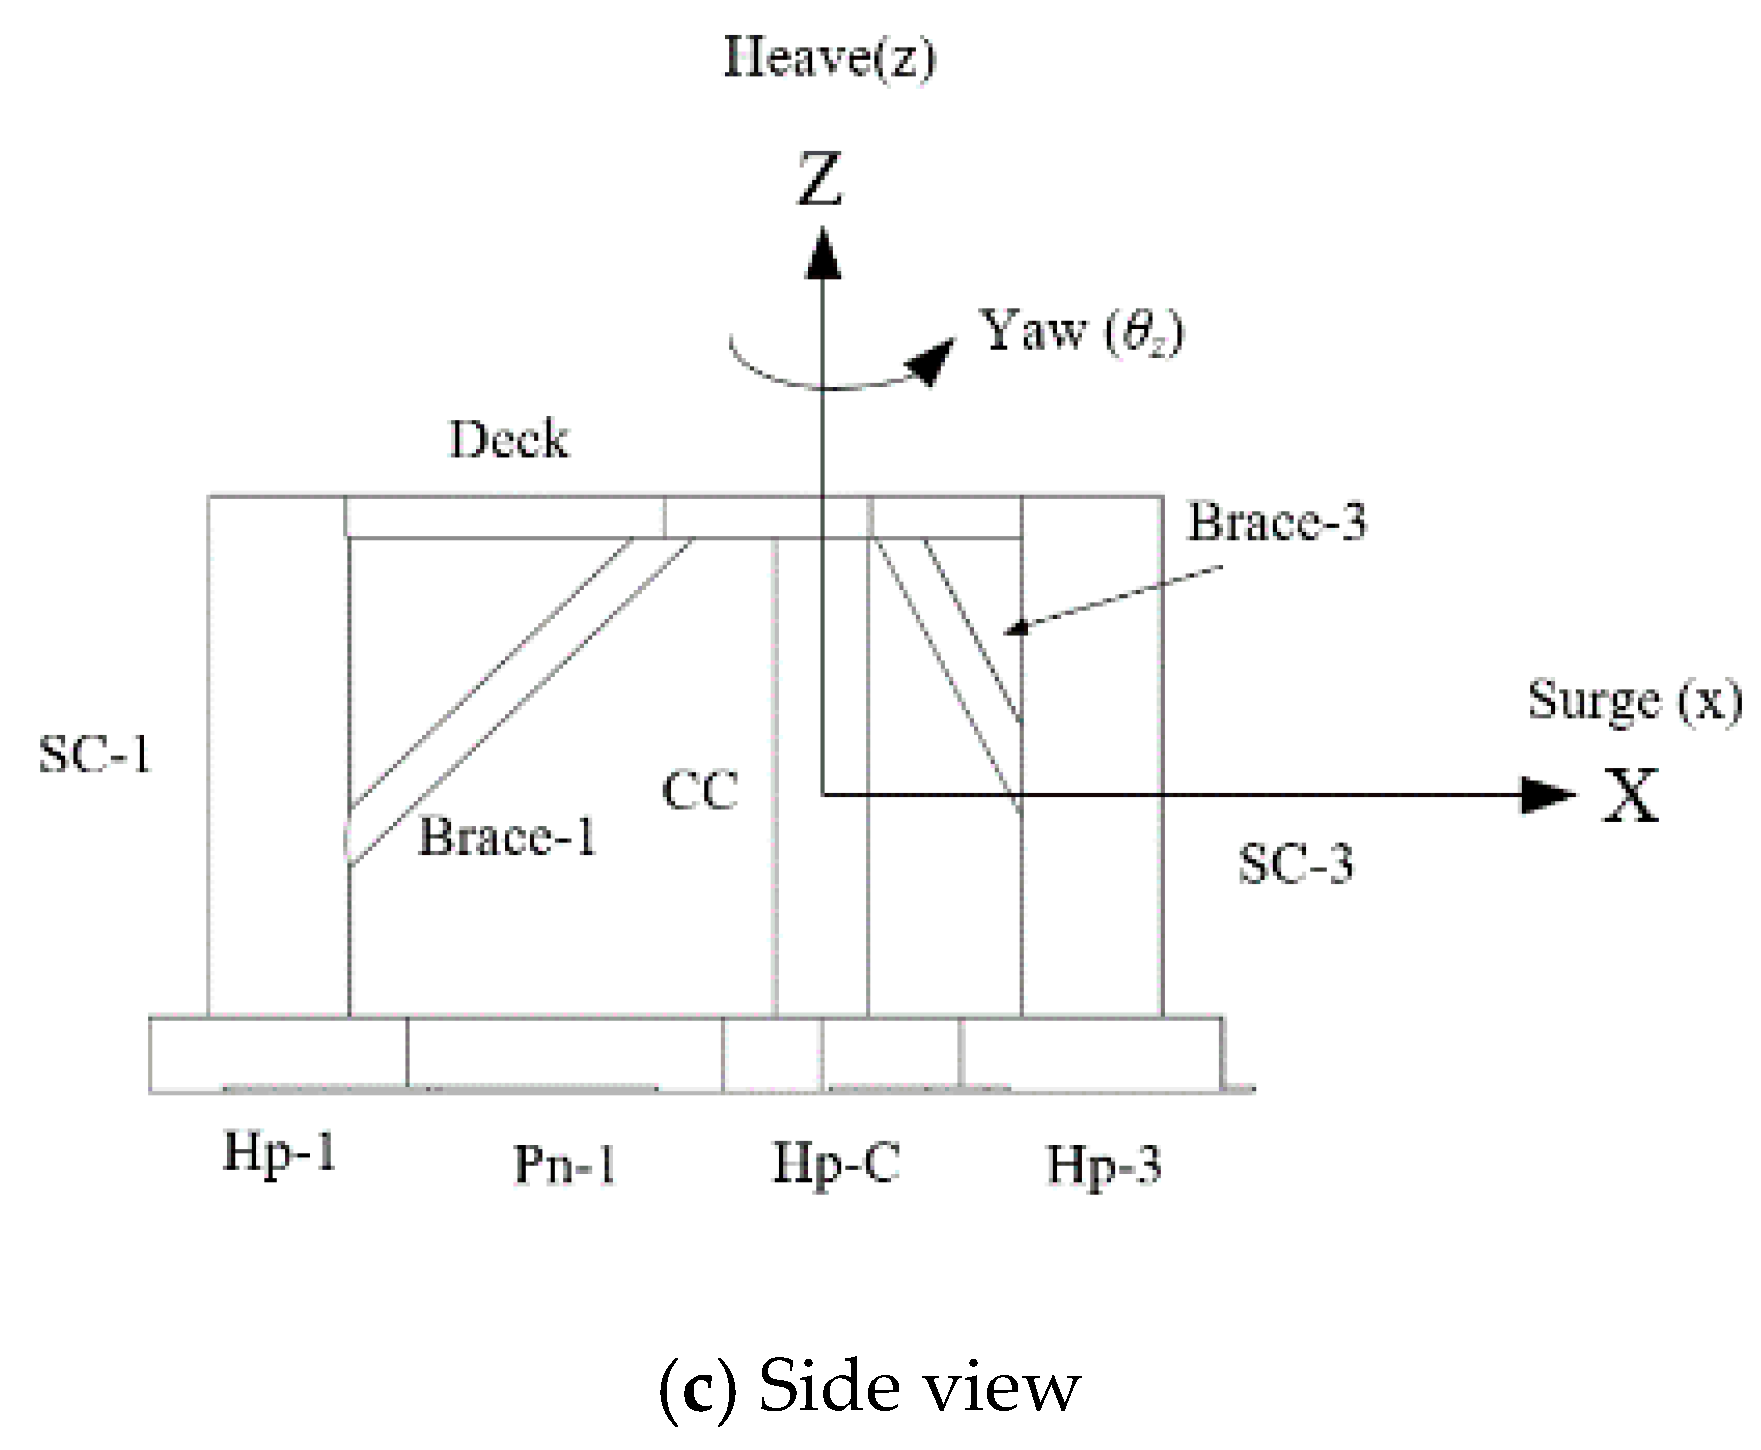
2.1. Description of a 1:60 Scale Elastic Platform Model

To investigate the dynamic response of the floating platform and the sectional loadings on the elements, a water tank test was carried out based on an elastic platform model. This floating platform corresponds to the 2 MW semi-submersible FOWT used in the Fukushima demonstration project. The model is scaled down by Froude scaling law. For the stiffness, it is calculated by K m o d e l = K p r o t o t y p e / λ 5 , in which K m o d e l and K p r o t o t y p e are the stiffness of model and prototype, and λ is the scaling factor and equals 60. The platform comprises a center column and three side columns connected to the central column by pontoons, braces and decks. The pontoons are rectangular cylinders with variable width. Braces and decks are circular cylinders. The skirts are installed on the pontoons and heave plates to reduce the heave motion as shown in Figure 1. The origin of the right-handed coordinate system is defined at the center of the center column on the water plane with a positive X in the direction of wave propagation and Z upward. The local x and y axes on the pontoon, brace and deck are presented in Figure 2. The local z axis is in the axial direction of the element. Table 1 lists a summary of the dimensions of the laboratory scale platform.
Two different numerical models are adopted for the platform in Orcaflex [28]. One of them assumes the hull of the platform is a fully rigid structure and hydrodynamic loads are given to a reference point. This model is hereafter named the rigid model and is analyzed for the motion and mooring tension of the platform. The other model, based on the multiple hydrodynamic bodies, assumes the pontoon (Pn-2), brace (Br-2) and deck (Deck-2) as elastic beams, modeled with finite elements. This model will be referred to as an elastic model and is used to predict the sectional loads on the given sections and dynamic responses. The structural elements in the elastic model, except for Pn-2, Br-2 and Deck-2, are considered as rigid bodies. Although the stiffness of the platform has an effect on the natural frequency of the tower as mentioned by Zhang and Ishihara [17] and has an impact on the bending moment at the tower base as pointed out by Yamaguchi et al. [29], the elasticity of tower is neglected due to the high stiffness of the platform. In this study, the structural responses of the pontoon (Pn-2), brace (Br-2) and deck (Deck-2) are focused on, since the stiffness of central and side columns are much higher than those of connecting elements.
Figure 3 displays the elastic beams and multiple hydrodynamic bodies used in the water tank test and the numerical simulation. The Pn-2, Br-2 and Deck-2 connected to the central column (CC) and side column (SC-2) are built as the elastic elements by the square steel beams, while the other parts of the platform are modeled as the rigid structures shown as Figure 3a in the water tank test. In the numerical simulation, the elastic model of the platform is separated into five bodies, which are connected by three elastic beams as shown by the dashed lines in Figure 3b. Body 1 includes CC, SC-1, SC-3 and respective braces, decks and pontoons. Body-2 consists of SC-2 and Hp-2. The points in Figure 3b represent the reference point of each body. For each elastic beam, the bending moments at the three sections as defined in Figure 3a are measured in the water tank test and are predicted in the numerical simulation. Table 2 shows the stiffness properties of each elastic beam. Table 3 lists the structural properties of each body, such as mass, the center of gravity and moment of inertia. The origin of the local coordinate system is located at the center of gravity of each body. The similarities for the mass and moment of inertia are achieved by scaling dimensions of columns, pontoons, braces and decks and adjusting weight distribution. The wind turbines and nacelle are simplified as a rigid pole to consider their mass and moment of inertia as shown in Section 3.1.

2.2. Hydrodynamic Coefficient Models for the Multibody

The linear hydrodynamic force, such as diffraction force and radiation damping force, for the multiple hydrodynamic bodies are estimated by the software AQWA [30] as 6 × 6 matrices with respect to the reference points, while the integrated added mass matrices for each body from the added mass of each component are necessary, considering the effect of K C number, Reynolds number and interaction as shown in Liu and Ishihara [31].
The hydrodynamic inertia and drag forces on the cylinder depend on the interaction between cylinders, K C number and Reynolds number. The hydrodynamic coefficient models were proposed by Liu and Ishihara [31] and Ishihara and Liu [32] to take into account the influence of these factors on the added mass and drag coefficients for each cylinder and are expressed as
C a k i ( β 0 k , K C 0 k , η k ) = C a k r ( β 0 k , K C 0 k ) × γ a k r × η a k i
C d k i ( β 0 k , K C 0 k , η k ) = C d k r ( β 0 k , K C 0 k ) × γ d k r × η d k i
where subscript i and r are the structure component i and referenced component r , superscript k represents the direction for the hydrodynamic coefficients, which can be expressed as the normal direction by n or the axial direction by t. C a k i ( β 0 k , K C 0 k , η k ) and C d k i ( β 0 k , K C 0 k , η k ) represent the added mass and drag coefficients of the component i at β k and K C k in the k direction including the contribution of the interaction effect. C a k r ( β 0 k , K C 0 k ) and C d k r ( β 0 k , K C 0 k ) mean the representative C a and C d for the referenced component r at β 0 k and K C 0 k in the k direction. Correction factors η a k i and η d k i are introduced to account for the interaction between components. Correction factors γ a k r and γ d k r are functions of K C and Reynolds numbers.
The global added mass for a rigid body can be obtained by integrating the distributed hydrodynamic coefficients in the global coordinate system. In this study, the platform is discretized to 79 elements and C a of each element in the local coordinate system can be computed according to Equation (1). The drag force by Morison’s equation is utilized to account for the distributed viscous damping force induced by flow separation. The integrated added mass coefficients for each body are expressed as 6 × 6 matrices [ C a ] and the components in the global matrices of [ C a ] are presented as
[ C a ] = [ C a 11 C a 11 C a 11 C a 11 C a 15 C a 11 C a 11 C a 22 C a 11 C a 24 C a 11 C a 11 C a 11 C a 11 C a 33 C a 11 C a 11 C a 11 C a 11 C a 42 C a 11 C a 44 C a 11 C a 11 C a 51 C a 11 C a 11 C a 11 C a 55 C a 11 C a 11 C a 11 C a 11 C a 11 C a 11 C a 66 ]
The simplified formulas to integrate distributed added mass were derived from Ishihara and Zhang [33]. The off-diagonal components in the matrix are neglected except for the components C a 24 ,   C a 42 ,   C a 15 and C a 51 due to the symmetry of the platform. However, the geometry of the multibody is not symmetrical and all terms in the added mass matrix are necessary. The general formulas to integrate the distributed added mass are derived in this study, which are applicable for any shape of the platform. Figure 4 presents the local coordinate system x y z located on an element in the global coordinate system XYZ . x and y are normal to z axis of the element and z corresponds to the axial direction.
The added mass matrix of the element in the local coordinate system can be expressed as
C a i = [ C a x x i C a x y i C a x z i C a y x i C a y y i C a y z i C a z x i C a z y i C a z z i ]
where the diagonal components C a x x i , C a y y i and C a z z i represent added mass coefficients in the x, y and z directions, respectively. The off-diagonal components in the added mass matrix account for the coupling between the motions in the two degrees of freedom. The off-diagonal components of the C a i are 0 since the element of the platform is comprised of the cylinders. In the global coordinate system, the matrix of added mass coefficients for an element is calculated as
C a X Y Z i = R × C a i × R 1 , [ C a 11 i C a 12 i C a 13 i C a 21 i C a 22 i C a 23 1 C a 31 i C a 32 i C a 33 i ] = R × [ C a x x i C a x y i C a x z i C a y x i C a y y i C a y z i C a z x i C a z y i C a z z i ] × R 1
where R is the rotation matrix of three Euler angles between the local and global coordinates and R 1 is the inverse rotation matrix. Each component in the [ C a ] can be expressed as
C a m n = i = 1 k C a m n i m , n = 1 , 2 , 3 C a m n = 1 R 2 i = 1 k [ C a ( m 1 ) n i y i     C a ( m 2 ) n i z i ] m = 4   n = 4 , 5 , 6 C a m n = 1 R i = 1 k [ C a m ( n 1 ) i y i     C a m ( n 2 ) i z i ] m = 1 , 2 , 3   n = 4 C a m n = 1 R i = 1 k [ C a ( m 4 ) n i z i     C a ( m 2 ) n i x i ] m = 5   n = 1 , 2 , 3 C a m n = 1 R i = 1 k [ C a m ( n 4 ) i z i     C a m ( n 2 ) i x i ] m = 1 , 2 , 3   n = 5 C a m n = 1 R 2 i = 1 k [ C a ( m 4 ) n i z i     C a ( m 2 ) n i x i ] m = 5   n = 4 , 5 , 6 C a m n = 1 R i = 1 k [ C a m ( n 4 ) i x i     C a m ( n 5 ) i y i ] m = 1 , 2 , 3   n = 6 C a m n = 1 R i = 1 k [ C a ( m 4 ) n i x i     C a ( m 5 ) n i y i ] m = 6   n = 1 , 2 , 3 C a m n = 1 R i = 1 k [ C a ( m 1 ) n i y i     C a ( m 2 ) n i z i ] m = 4   n = 1 , 2 , 3 C a m n = 1 R 2 i = 1 k [ C a ( m 4 ) n i x i     C a ( m 5 ) n i y i ] m = 6   n = 4 , 5 , 6
where x i , y i and z i indicate the location of the element in the global coordinate system. k is the number of elements. R is the characteristic length of the platform.

2.3. Numerical Model for the Dynamic Analysis

The dynamic analysis for a floating platform is performed by solving the equation of motion in the time domain as shown below.
M { x ¨ } + C { x ˙ } + K { x } = { F B } + { F R } + { F G } + { F M } + { F H } + { F W }
where vector { x ¨ } , { x ˙ } and { x } denote the acceleration, velocity and displacement in the six degrees of freedom, respectively. M represents the mass matrix. C is the damping matrix and K is the stiffness matrix. The hydrostatic loads on the platform refer to the displaced water by the submerged body and its motion. This can be divided into a constant integrated buoyancy force and a restoring force caused by the motion of the platform. On the right side of Equation (7), { F B } presents the buoyancy force and { F G } indicates the gravitational force; { F R } , { F H } and { F M } denote the restoring force., hydrodynamic force and mooring tension, respectively. The last term { F W } is the aerodynamic load, which is neglected since the wind turbine is simplified in the water tank test. As mentioned by Ishihara and Zhang [33], the dynamic model for mooring lines performs better than the quasi-static model for accurate prediction of mooring tension. The dynamic model using lumped mass method is implemented, where the hydrodynamic loads of the mooring line are computed by Morison’s equation, including hydrodynamic inertia force and drag force.
The buoyancy force is a vertical force and equals the gravity force of the displaced water. It is calculated as
{ F B } = { 0 , 0 , ρ w g } T
where ρ w is density of water and is the volume of the submerged part of the platform. The force that equilibrates the buoyancy force is the gravity force of the platform and is obtained as shown in Equation (9), where m is the mass of the platform.
{ F G } = { 0 , 0 , m g } T
The restoring force is calculated as the product of hydrostatic stiffness and displacement vector. The hydrostatic stiffness represents the static movement properties of the platform when it is brought out of an equilibrium position by the external force or moment. The translations in the surge and sway directions and the rotation in the yaw direction lead to no resultant hydrostatic force. So, there are no hydrostatic terms in the surge, sway and yaw directions. The vertical movement of the platform causes a change of buoyancy force, which tends to return the structure back to the balance position. The restoring moments arise with the pitch and roll motions since the center of gravity and center of buoyancy are not situated on the same vertical line. The restoring force is calculated as Equation (10) and hydrostatic stiffness is described as Equation (11).
{ F R } = K R { x }
K R = [ 0 0 0 0 0 0 0 0 0 0 0 0 0 0 ρ w g A w 0 0 0 0 0 0 F G × G M X 0 0 0 0 0 0 F G × G M Y 0 0 0 0 0 0 0 ]
where G M X and G M Y are the meta-centric heights of the platform about the x and y axes, respectively.
The hydrodynamic force, which refers to the dynamic forces and moments due to the fluid on an oscillating platform in wave, can be written as
{ F H } = { F m , a } + { F m , d } + { F w , F - K } + { F w , d } + { F d }
where { F m , a } and { F d } represent hydrodynamic inertia force and drag force, respectively, { F m , d } is the radiation damping force. { F w , F - K } and { F w , d } are the Froude–Krylov (F-K) force and diffraction force caused by the wave excitation, respectively. { F m , a } is computed as
{ F m , a } = ρ w [ C a ] { x ¨ }
where ρ w is density of water and is the volume of displaced water.
The distributed drag force on each element is expressed as Equation (14).
F d i = 1 2 ρ ω C d i A i ( u i x ˙ i ) | u i x ˙ i |
where C d i is the drag coefficient of the element in the corresponding direction, u i x ˙ i means the relative velocity of the element to water particle, A i is the characteristic area of the element. In the combined wave and current condition, the drag force can be estimated by an advanced hydrodynamic model proposed by Ishihara and Liu [32].
The elastic platform can be divided into several rigid bodies connected by elastic beams. In the dynamic analysis of the platform, the wave-induced loads and radiation damping force obtained by the potential theory are used for the multiple hydrodynamic bodies and hydrodynamic interactions between each body are included in the hydrodynamic force matrices. In the dynamic analysis, hydrodynamic forces obtained from the potential theory are attached to the reference points as shown in Figure 3b. Similar to the single body model, the global added mass matrix of each body is integrated from the elemental added mass matrix C a i as shown in Equation (6). The drag force on each element is computed as the distributed loads on the elements. Since Deck-2 is located above the water surface, it does not experience any hydrodynamic load and only inertia load is considered. The structural response of the elastic beams is obtained by a finite element model in the time domain. The elastic beam is divided into a series of segments, which are then modeled by straight massless elements with a node at each end. The element only considers the stiffness of the beam in the axial and normal directions. The mass, weight and buoyancy are lumped to the nodes. The shear forces and moments of the beam are applied at the nodes at the end of elements. No hydrodynamic loads act on the elastic beams.

3. Results and Discussion

The structural response of a semi-submersible platform is analyzed using the experimental and numerical elastic model. Section 3.1 describes the water tank test and environment conditions. In Section 3.2, the dynamic responses of the platform are predicted by the rigid and elastic models and are compared with the experiments. The predicted sectional loads on the pontoon, brace and deck by the elastic model are presented and are validated by the water tank test in Section 3.3. A simplified method is also proposed to predict the load distribution. Finally, the local stress on the pontoon of the original platform is investigated and the structural optimization is performed by connecting pontoons by a short strut in Section 3.4.

3.1. Water Tank Test with an Elastic Platform

Figure 5a shows an overview of the elastic model with elastic beams and Figure 5b presents the water tank test. Three connection components are developed as the elastic structure using steel beams as described in detail in Section 2.1. The pontoon, brace and deck are segmented as illustrated in Figure 5c. The beams are connected with the hull of the platform by the flanges and bolts as shown in Figure 5d. The strain on the four surfaces of the beam is monitored by the strain gauges. The sectional loads are then calculated by M = Δ σ I / y , where Δ σ is the different stress between the upper and lower surfaces, I is the moment of inertia of the section about the neutral axis, y is the perpendicular distance from the neutral axis to a point on the section. I / y   is obtained by the experiments. The sectional loads at the ends and middle locations of the beams are measured for the validation.
Figure 6 illustrates the configuration of the platform and mooring lines in the water tank test. The platform is stationed by four catenary mooring lines, where the mooring lines ML1 and ML2 connect the platform by the same fairlead. The length of the mooring lines is 10.5 m. The arrangement of the mooring lines is different from the actual platform due to the limitation of the water tank. The motion of the platform, mooring tension and sectional loads on the elastic beams are measured to capture the dynamic response of the platform. The sectional loads, such as the bending moments, are calculated using the measured strain obtained by the strain gauges pasted on the beams.
Table 4 lists the environmental conditions used in the experiments. Free decay tests identify the natural periods of the platform in the three degrees of freedom (DOFs). In the regular wave cases, the response amplitude operators (RAOs) are measured at two wave heights and several wave periods. In irregular wave cases, the waves are generated based on the Pierson–Moskowitz spectrum (PM spectrum) with two significant wave heights of 0.05 m and 0.195 m and a peak wave period of 2.16 s. The wave elevations are measured at a location 7.29 m away from the center of the platform in the upstream. All waves propagate in the positive surge direction.

3.2. Dynamic Response of the Platform and Mooring Lines

The natural periods for both rigid and elastic models are evaluated by means of decay simulation and are compared to the experimental data in the surge, heave and pitch directions. In the still water condition, the initial offset in each direction is imposed and the platform is then released to decay freely. The responses in the first five periods are used to evaluate the natural periods. Figure 7 shows the natural periods of the surge, heave and pitch motions. Both elastic and rigid models show the same natural periods and agree well with those by the water tank test since the stiffness of platform is determined by the restoring force and mooring lines which are the same for the elastic and rigid models. The masses of elastic and rigid models in the numerical simulations are kept the same, and thus the natural periods of elastic and rigid platforms are the same.
The dynamic responses of the platform in the regular waves are characterized by RAOs, in which the amplitudes of platform motion and mooring tension are normalized by the wave amplitudes as
RAO s = A H / 2
where A is the amplitude of dynamic response for the platform motion, mooring tension and sectional loads, and H refers to the incident regular wave height.
The normalized time history of dynamic response of the platform is also expressed as
x * ( t ) = x ( t ) H s / 2
where x ( t ) is the time history of displacement, rotation, mooring tension, moment and stress. H s denotes the significant wave height in the irregular wave and the wave height of the regular wave, and x * ( t ) is used to calculate the PSD (power spectral density) of the dynamic response in irregular wave cases.
The wave heights and wave periods of the regular waves are obtained from the measurements in the water tank tests. The simulations in the time-domain are performed for 100 s to obtain the desired steady-state responses. Figure 8 shows the RAOs of the surge, heave and pitch of the platform in the regular wave conditions, and the tension of the mooring line ML4 at the fairlead. The numerical results show good agreement with the experimental data. They indicate that the proposed nonlinear hydrodynamic model works well for the multibody model. The predicted responses by the rigid and elastic models show little difference, as mentioned by Guignier et al. [18], which implies that the elasticity of the model has no effect on the platform motion and mooring tension.
The dynamic responses of the rigid and elastic models in the irregular waves are also predicted. The measured wave elevations are used as the inputs of the numerical simulations. The simulation time is 99 s, which is the same as the experiment. The predicted power spectral density (PSD) of the normalized platform motion and mooring tension are shown in Figure 9. Similar to the regular wave cases, the rigid and elastic models give the same results for the platform motion and mooring tension. The lower frequency peak of 0.134 Hz is observed in the PSD of surge motion, which corresponds to the natural frequency of the surge motion. The peaks at 0.464 Hz observed in the PSD of platform motion are excited by the wave. Similarly, the first peak in the PSD of mooring tension corresponds to the low frequency of surge motion and the second peak is excited by the wave, respectively. The predicted responses show favorable agreement with the experimental data.

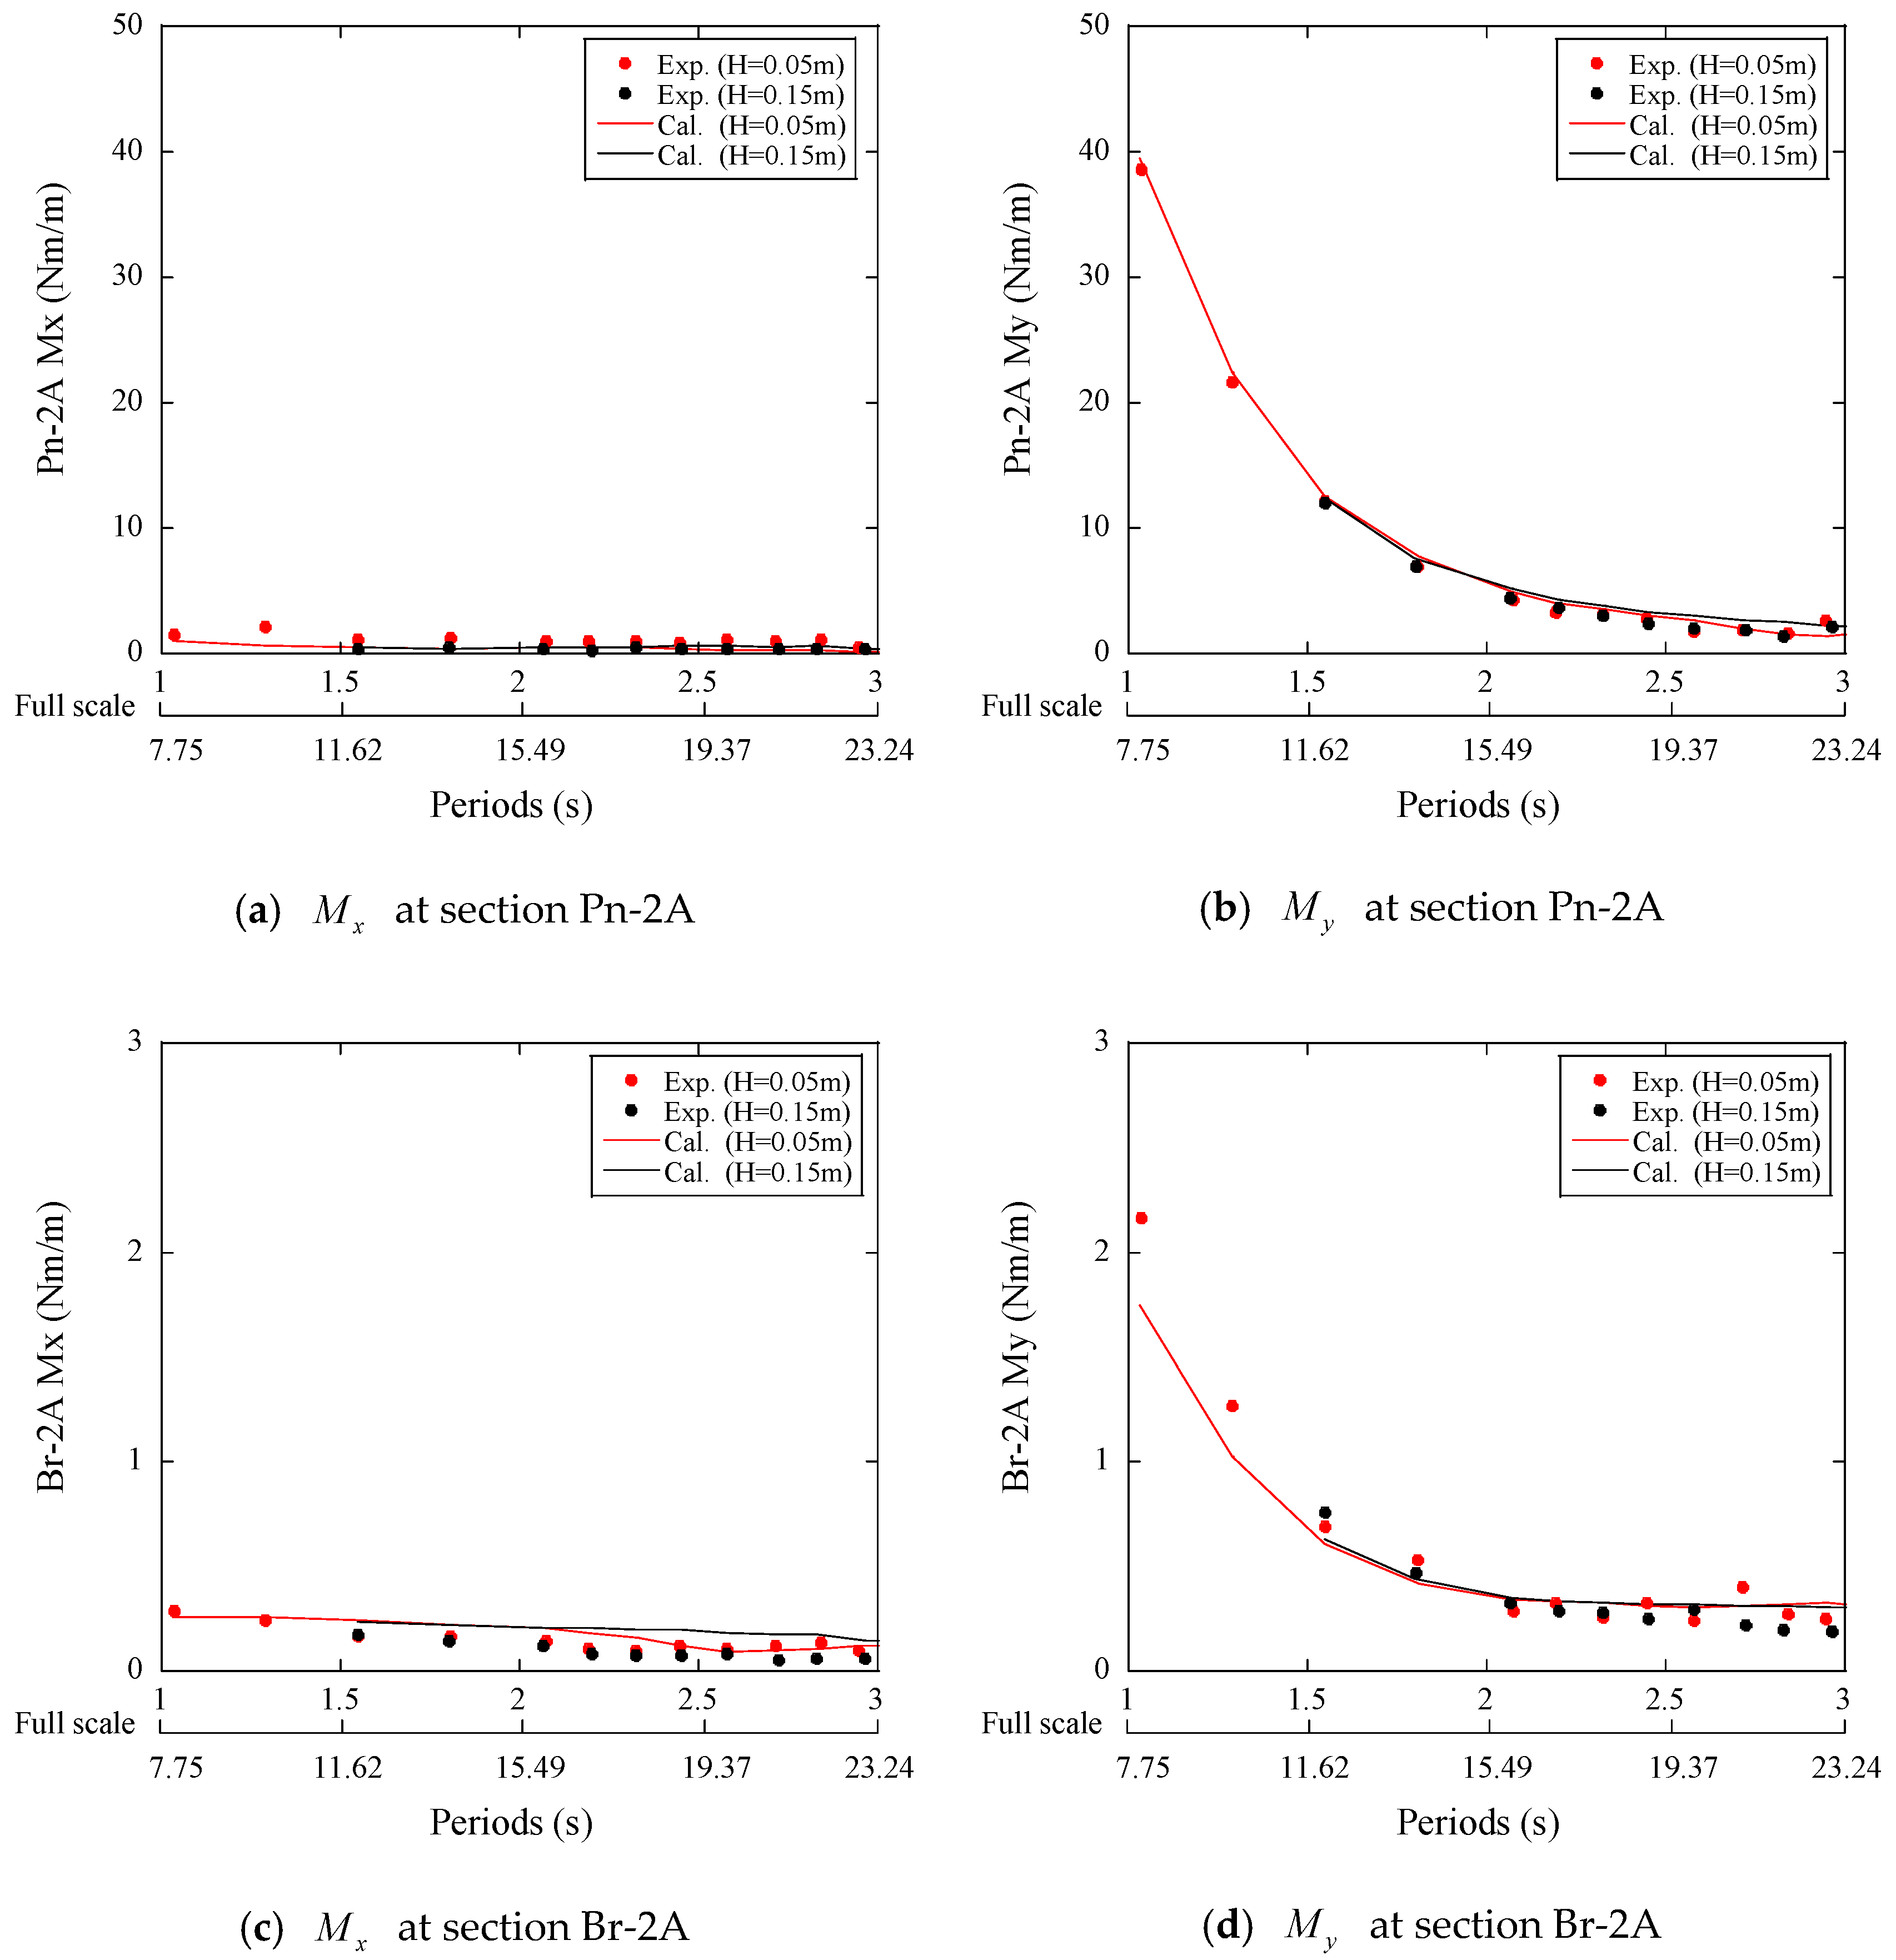
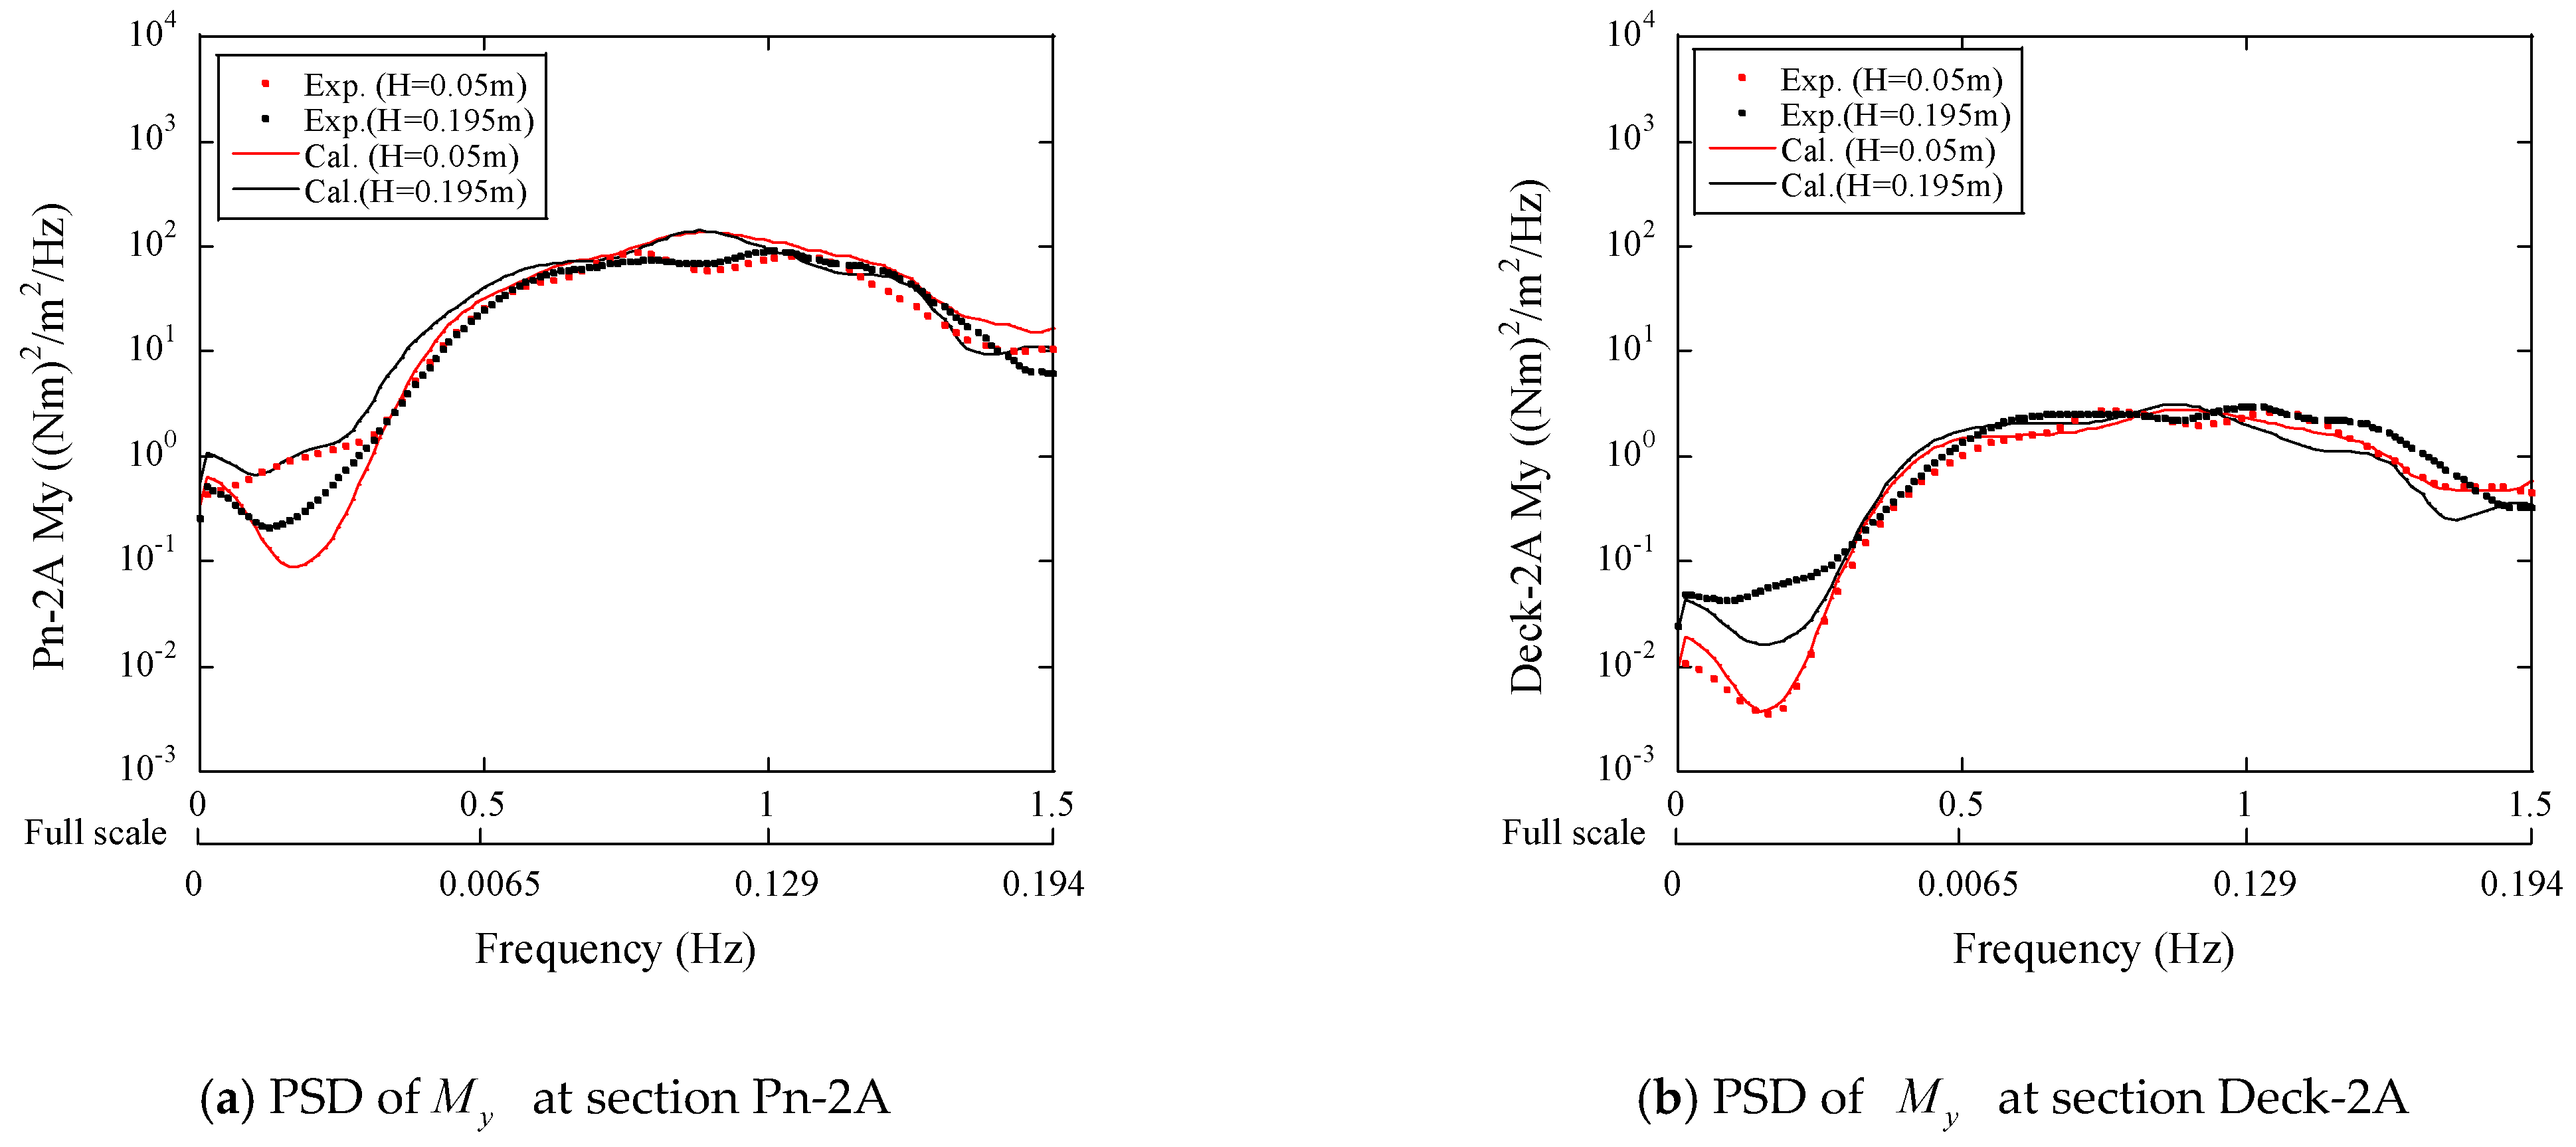
3.3. Sectional Loads on the Platform

The sectional loads on the elastic beams at the specified sections are computed by the finite element analysis. The comparison between the RAOs from experiments and the numerical model is presented in Figure 10. The bending moment M y is induced by the horizontal loads acting on the side column and pontoon, while the bending moment M x is caused by the vertical loads acting on the heave plates and pontoons. The normalized bending moments M x and M y of the beam are consistent for different wave heights since the pontoon, brace and deck response linearly. The sectional loads on the pontoon are much larger than those on the brace and deck, which indicates that the pontoon is the critical structure to transfer loads between columns in the horizontal plane. The cracks on the pontoons of the 7 MW FOWT used in the Fukushima demonstration project were mainly caused by the bending moment M y . The bending moment M x for all the elastic elements of the platform is smaller compared to the bending moment M y , which is attributed to the side columns subject to the wave loads as shown in Figure 3. On the other hand, the wave loads acting on the platform in the vertical direction are relatively small due to the deep draft. It implies that the horizontal loads on the slender element of the platform caused by the side column should be paid attention to. The influence of stiffness of the element on the sectional loads is neglected since they are only amplified near the resonant frequencies as mentioned by Ishihara et al. [8]. The resonant responses of the elements are not observed in the field measurements and the water tank tests since the stiffness of the platform used in the demonstration is high and the resonant frequency is far away from the frequency range of the wave energy.
Figure 11 presents the PSD of the normalized M y at the sections Pn-2A and Deck-2A. The predicted bending moments show favorable agreement with the measured moments. The underestimation of M y at the section Pn-2A by the numerical model is observed in the low frequency range. This may be due to the second-order hydrodynamic loads, which is not considered in the numerical model.
The sectional load at the specified sections can be evaluated by the multibody model. It is possible to increase the number of bodies to calculate the sectional load at any section. However, the increase of bodies may lead to the convergent problem of the numerical model. To estimate the distribution of sectional loads on a beam, the bending moment M y on the beam is assumed as a function of z and is expressed as
M y ( z ) = M y 0 + z M y 1 M y 0 L
where z means the distance between the section for moment prediction and the end of the beam close to center column, M y 0 and M y 1 are the bending moment M y at the end sections of the beam close to the center column and the side column, respectively, and L is the length of the beam.
Figure 12 shows the bending moments on Pn-2, Br-2 and Deck-2. The horizontal axes in Figure 12 denote the distance from the end of the beams close to the center column and are normalized by the length of the beams. It is found that the distributions of M y on Pn-2, Br-2 and Deck-2 are almost linear and the predicted bending moments agree well with those obtained from the water tank test.

3.4. Structural Optimization

The pontoon is the most important structure for connecting the center column and the side column as discussed in Section 3.3. Recently, concepts of a platform without decks and braces have been proposed, as shown in the 7 MW FOWT used in the Fukushima demonstration project. The deck and brace provide the stiffness of the platform, but they also increase the complexity of manufacturing, especially for the welding of the diagonal brace. To optimize the platform, the sectional loads on the pontoon are investigated based on the four models as shown in Table 5. The baseline model removes all decks and braces in the original model used in the Fukushima demonstration project. The struts connecting pontoons are installed in the optimized model, but the braces and decks are removed from the original model. The full model is equipped with the decks, braces, and struts as shown in Figure 13. To keep the mass and external load for these four models the same, the mass and hydrodynamic loads on the struts are neglected. In the numerical models, the decks and braces are disconnected from the central column to simulate the baseline model, but the mass and hydrodynamic load are included. This means that the end nodes of the elastic deck and brace at the cross sections Deck-2A are Br-2A are disconnected at the central column.
Figure 14 shows the predicted PSD of normalized platform motions and mooring tensions of four models in the irregular wave with the wave height of 0.15 m. It is noticed that the predicted dynamic responses and mooring tensions by the numerical models are almost the same. This implies that the change of stiffness does not influence the platform motions and mooring tensions.
Figure 15 illustrates the RAOs of bending moment M x and M y at the section Pn-2A for the three models in regular waves with a wave height of 0.15 m. It is found that the bending moments M x of the baseline and optimized models, as shown in Figure 15a, are larger than those of the original and full models, which is due to the removal of the brace and deck. In the original and full models, the deck, brace and pontoon constitute a frame structure and provide stiffness to resist the vertical loads. The bending moments M y of the optimized and full models, as shown in Figure 15b, are much smaller than those of the baseline and original models due to the installed strut. This implies that the strut connecting the pontoons has a slight influence on the bending moment M x , but significantly reduces the bending moment M y at the section Pn-2A. Oppositely, the brace and deck decrease the bending moment M x .
Figure 16 presents the PSD of the moment at the section Pn-2A in the irregular wave with a wave height of 0.15 m. The conclusions are similar to those for the regular waves, that is, the bending moment M x decreases by the brace and deck, while the bending moment M y is primarily reduced by the strut.
For a given location on the cross section, axial stress can be calculated as
σ = F z A + M x y I x + M y x I y
where F z is the axial force, A is the area of cross section, M x and M y denote the bending moments around x and y axes, I x and I y are the inertial moments of the cross section, and x and y indicate the coordinate in the local coordinate system. The stress at the points A, B and C in the section Pn-2A as shown in Figure 17 are calculated based on Equation (18).
Figure 18 presents the standard deviation of the normalized stress, which represents the fatigue load at the points A, B and C in the irregular wave with a wave height of 0.15 m. The stress in the cross section is caused by the axial force and moments. The stress at the point A is obtained from F z and M x , while the stress at the point C is obtained from F z and M y . Point B is located on the corner of the upper and side edge, where F z , M x and M y contribute to the stress. The largest standard deviation of the stress occurs in the baseline model, since the platform is designed without the brace, deck and strut. In the original model, the value of stress at point C is almost the same as stress at point B. This implies the fatigue loads in the section are dominated by the horizontal loads. The stresses in the optimized and full models show the small value, which indicates that adding the strut is more effective than adding the deck and brace to decrease the fatigue loads on the pontoon. The steel material of the optimized model can be reduced by 10% compared to the original model since the braces and decks are removed.

4. Conclusions

The dynamic responses of an elastic semi-submersible platform were investigated, such as the platform motion, mooring tension and sectional loads on the element. The conclusions are obtained as follows:
  • The nonlinear hydrodynamic coefficient models for the multibody are proposed considering the effects of Reynolds and KC numbers on the added mass and drag coefficients. The predicted dynamic response and mooring tension of the elastic platform by the proposed model show good agreement with the experimental data obtained from the water tank test. The influence of structural stiffness on the dynamic response of the platform is negligible since the stiffness of the platform used in the demonstration is quite high.
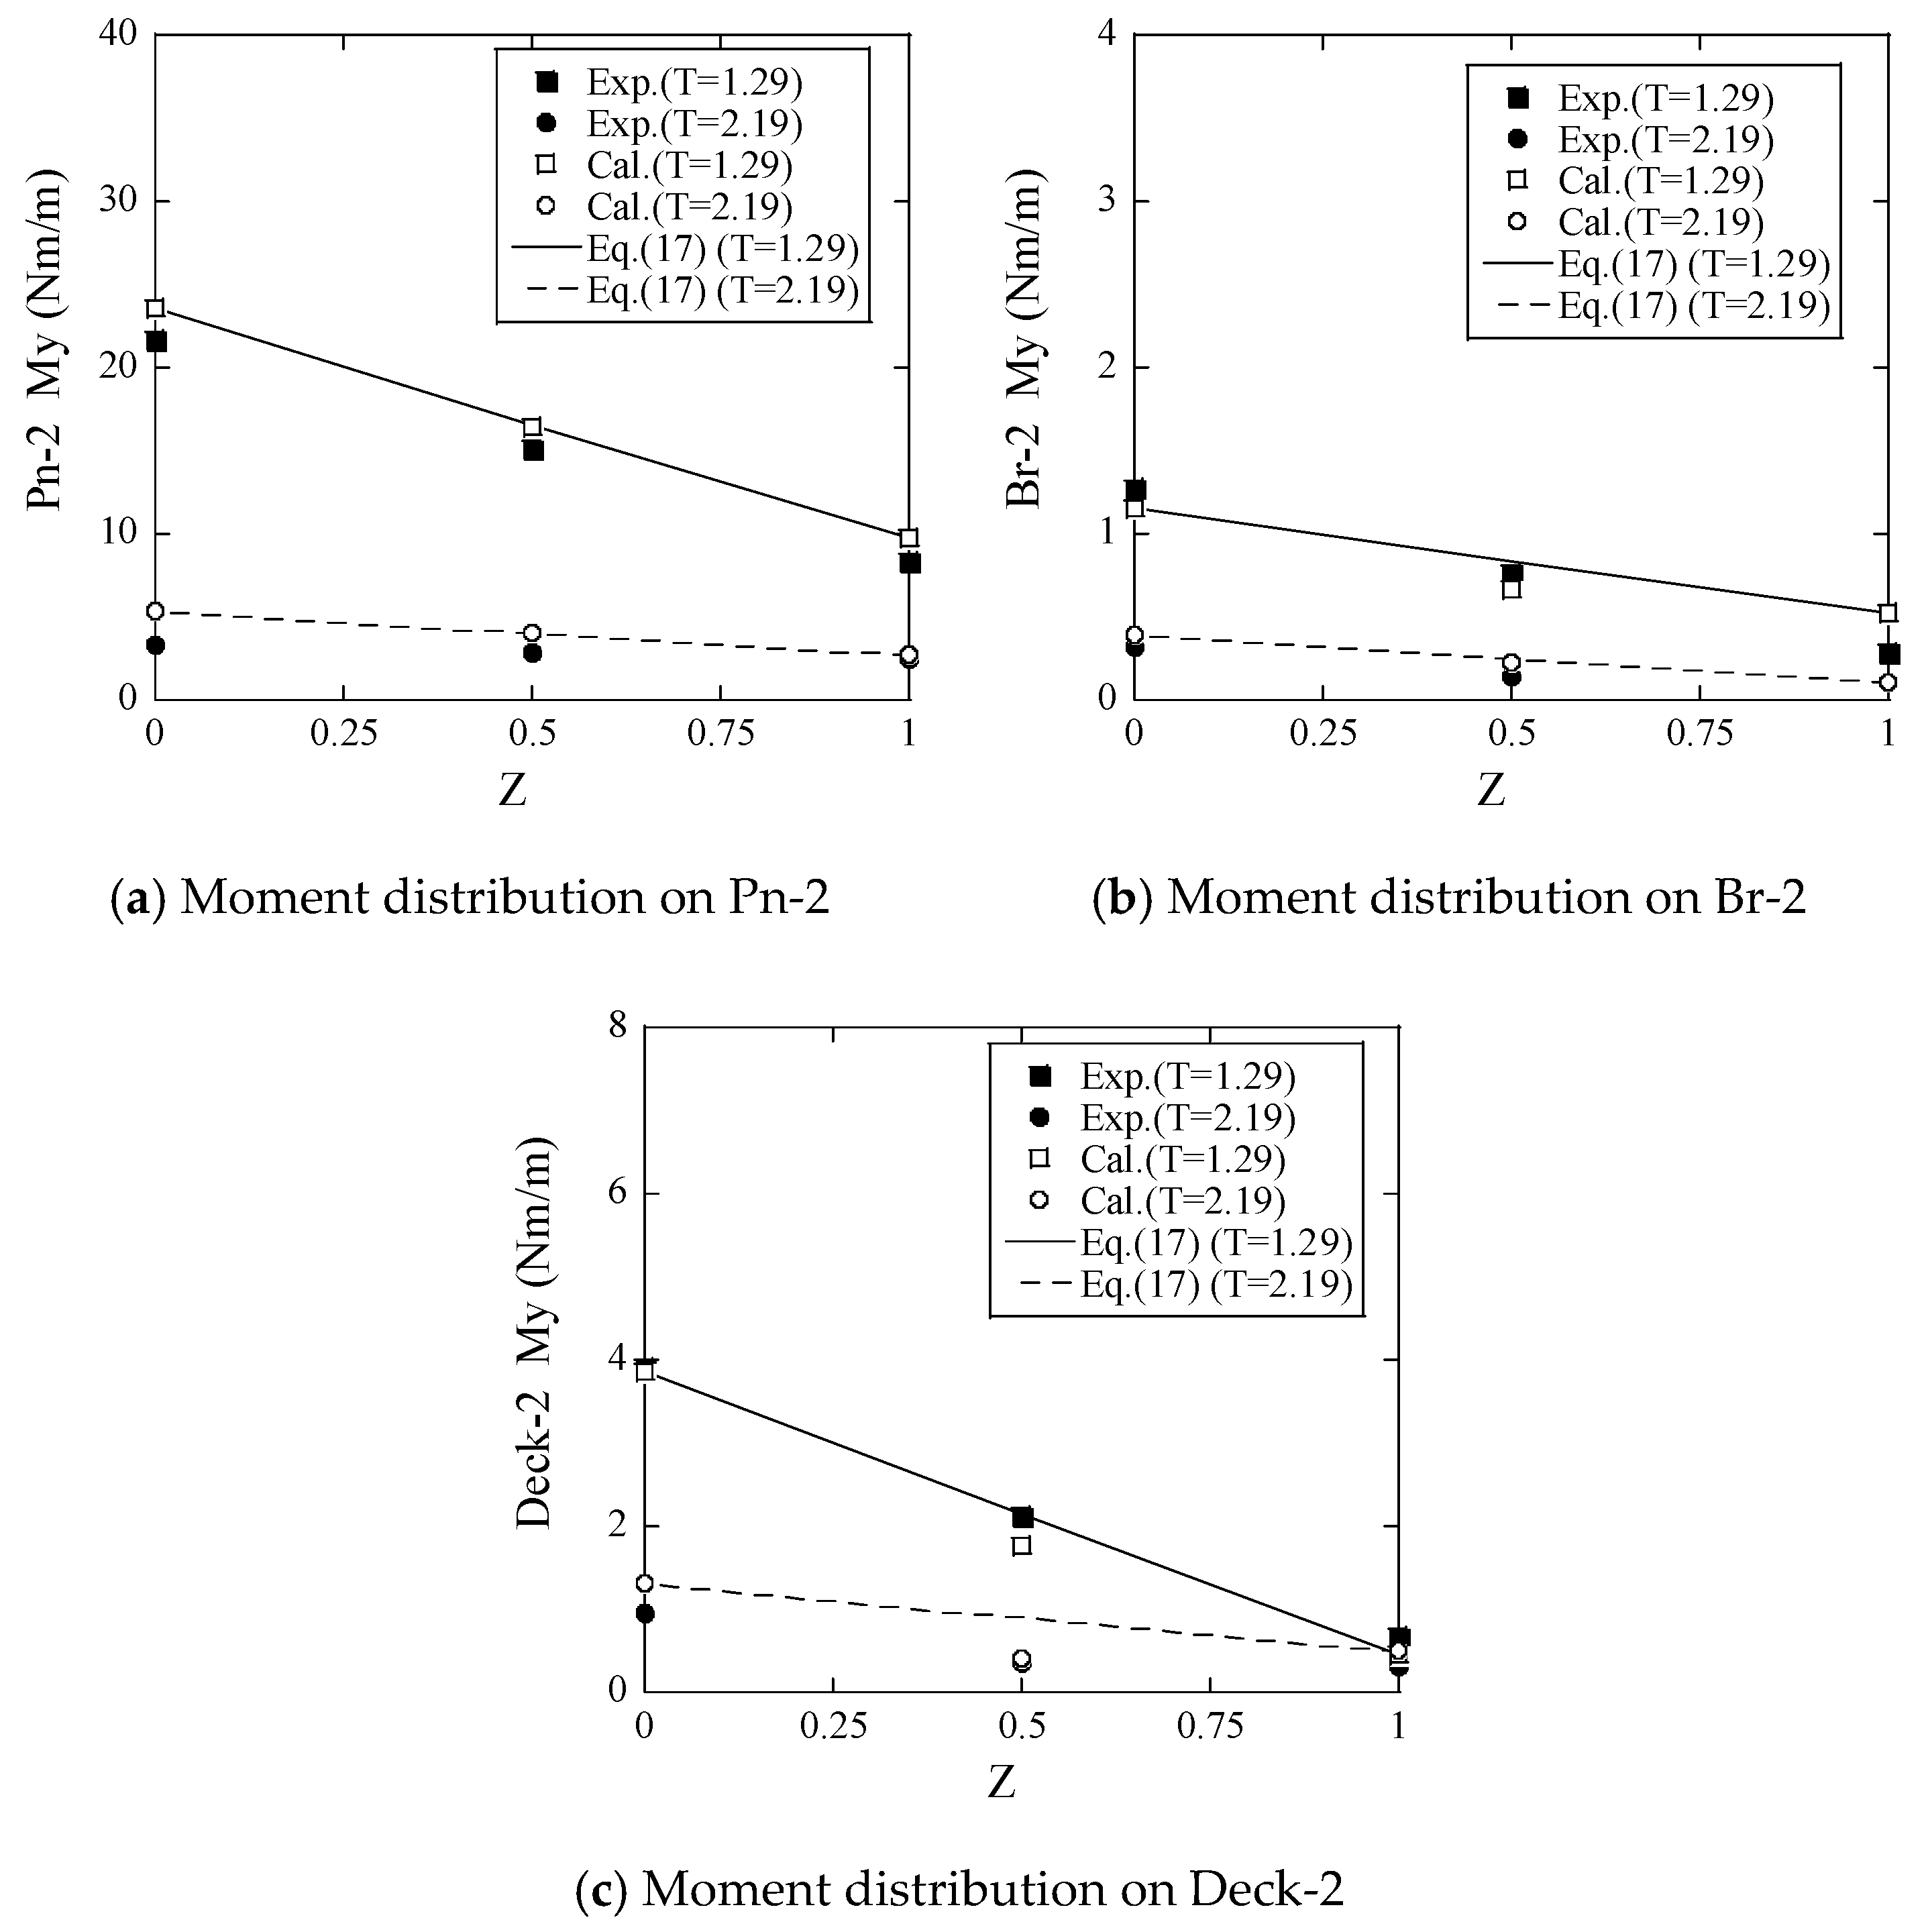
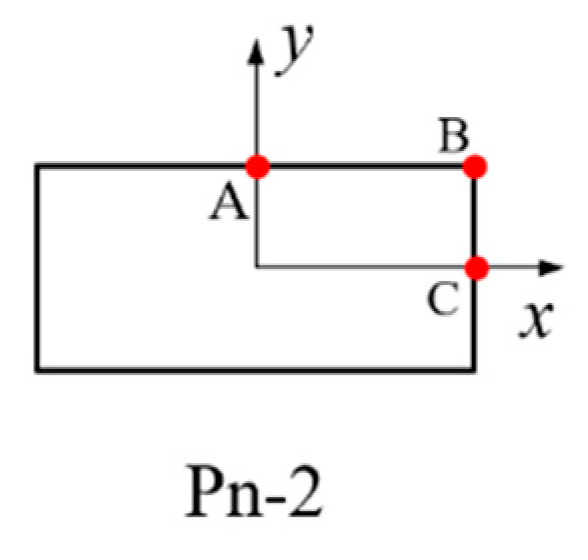
  • The sectional loads on the deck, brace and pontoon were investigated using multiple hydrodynamic bodies. The bending moments due to horizontal hydrodynamic loads are much larger than those caused by the vertical hydrodynamic loads. A linear formula is proposed to predict the distribution of the sectional loads on the connection element.
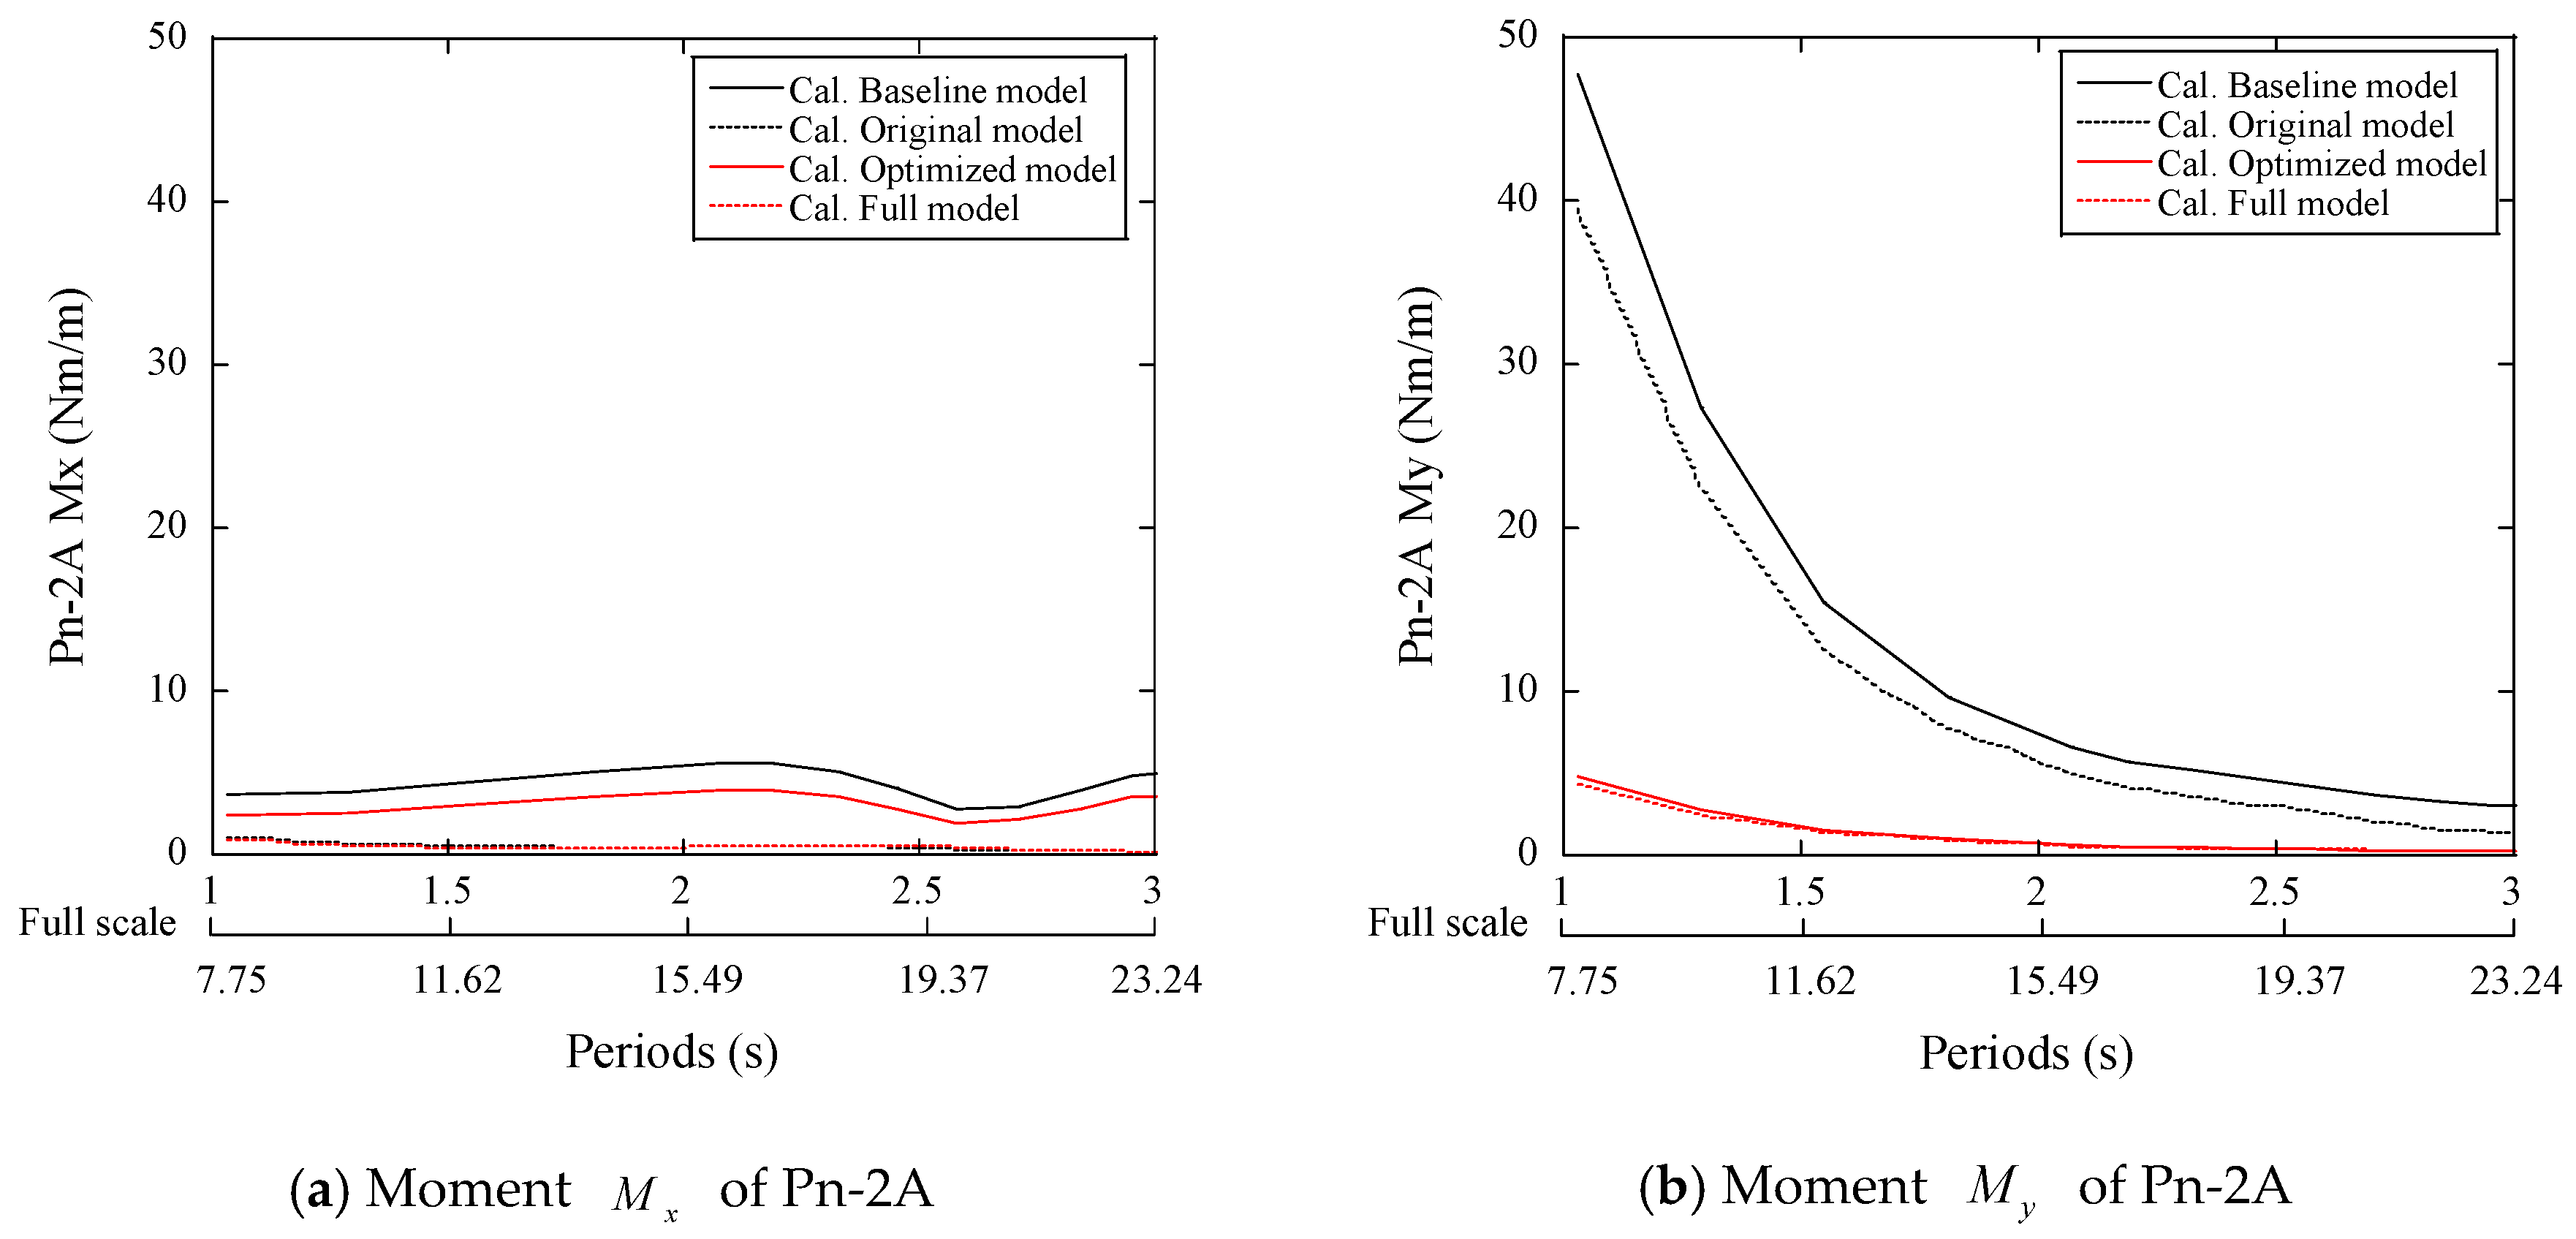
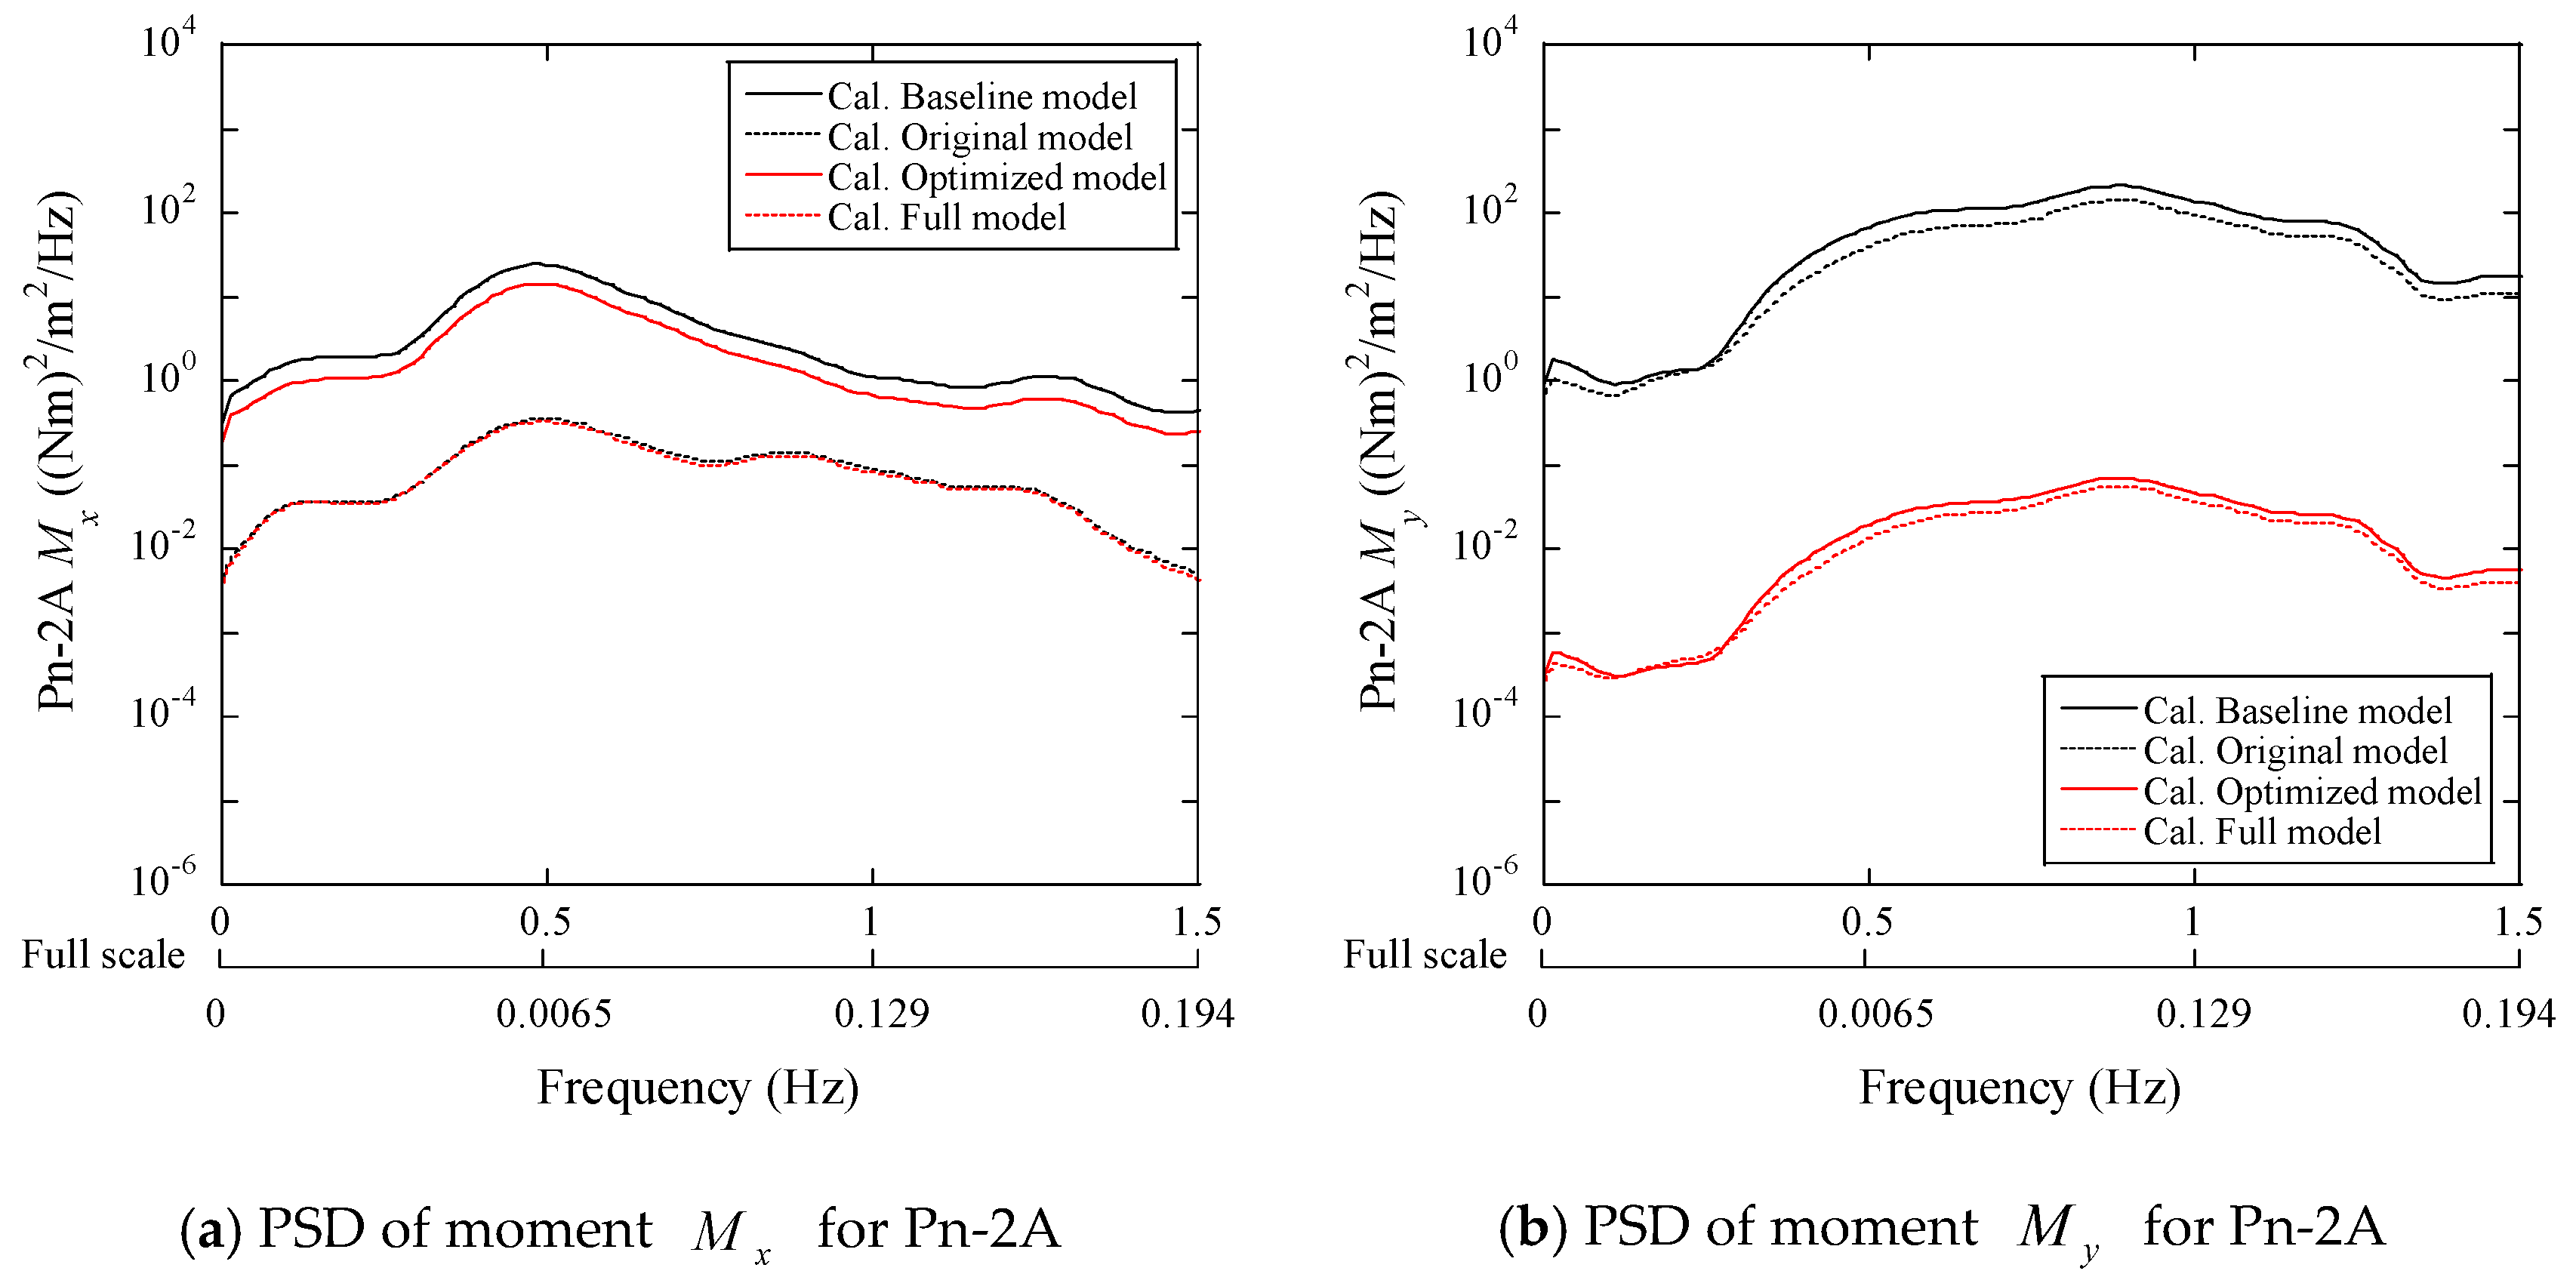
  • The sectional load on the pontoon was analyzed by the four platforms with and without the braces, decks and struts. The largest contribution to the fatigue load of the pontoon comes from the horizontal loads and the struts significantly reduce the stress on the pontoon, while the contributions from the decks and braces are limited.

Author Contributions

Conceptualization, T.I.; formal analysis, Y.L.; investigation, Y.L.; visualization, Y.L.; writing—original draft preparation, T.I.; writing—review and editing, T.I.; project administration, T.I.; All authors have read and agreed to the published version of the manuscript.

Funding

This research received no external funding.

Institutional Review Board Statement

Not applicable.

Informed Consent Statement

Not applicable.

Data Availability Statement

The data are not publicly available.

Acknowledgments

This research is carried out as a part of the Fukushima floating offshore wind farm demonstration project funded by the Ministry of Economy, Trade and Industry. The authors wish to express their deepest gratitude to the concerned parties for their assistance during this study.

Conflicts of Interest

The authors declare no conflict of interest.

References

  1. Kikuchi, Y.; Ishihara, T. Upscaling and levelized cost of energy for offshore wind turbines supported by semi-submersible floating platforms, Comparison of dynamic response and levelized cost of energy on three platform concepts of floating offshore wind turbine systems. J. Phys. Conf. Ser. 2019, 1356, 012033. [Google Scholar] [CrossRef] [Green Version]
  2. Kikuchi, Y.; Ishihara, T. Comparison of dynamic response and levelized cost of energy on three platform concepts of floating offshore wind turbine systems. J. Phys. Conf. Ser. 2020, 1452, 012035. [Google Scholar] [CrossRef]
  3. Robertson, A.; Jonkman, J.; Vorpahl, F.; Popko, W.; Qvist, J.; Frøyd, L.; Chen, X.; Azcona, J.; Uzunoglu, E.; Soares, C.G.; et al. Offshore code comparison collaboration continuation within IEA wind task 30: Phase II results regarding a floating semisubmersible wind system. In Proceedings of the International Conference on Offshore Mechanics and Arctic Engineering—OMAE, San Francisco, CA, USA, 8–13 June 2014. [Google Scholar] [CrossRef]
  4. Robertson, A.N.; Wendt, F.; Jonkman, J.M.; Popko, W.; Dagher, H.; Gueydon, S.; Qvist, J.; Vittori, F.; Azcona, J.; Uzunoglu, E.; et al. OC5 Project Phase II: Validation of Global Loads of the DeepCwind Floating Semisubmersible Wind Turbine. Energy Procedia 2017, 137, 38–57. [Google Scholar] [CrossRef]
  5. Borg, M.; Hansen, A.M.; Bredmose, H. Floating substructure flexibility of large-volume 10MW offshore wind turbine platforms in dynamic calculations. J. Phys. Conf. Ser. 2016. [Google Scholar] [CrossRef] [Green Version]
  6. Borg, M.; Bredmose, H.; Hansen, A.M. Elastic deformations of floaters for offshore wind turbines: Dynamic modelling and sectional load calculations. In Proceedings of the International Conference on Offshore Mechanics and Arctic Engineering—OMAE, Trondheim, Norway, 25–30 June 2017. [Google Scholar] [CrossRef]
  7. Silva de Souza, C.E.; Bachynski, E.E. Effects of hull flexibility on the structural dynamics of a tension leg platform floating wind turbine. J. Offshore Mech. Arct. Eng. 2020, 142, 011903. [Google Scholar] [CrossRef]
  8. Ishihara, T.; Van Phuc, P.; Sukegawa, H. A numerical study on the dynamic response of a floating offshore wind turbine system due to resonance and nonlinear wave. In Proceedings of the European Offshore Wind Conference (EOW2007), Berlin, Germany, 4–6 December 2007; pp. 1–9. [Google Scholar]
  9. Suzuki, H.; Xiong, J.; do Carmo, L.H.S.; Vieira, D.P.; de Mello, P.C.; Malta, E.B.; Simos, A.N.; Hirabayashi, S.; Gonçalves, R.T. Elastic response of a light-weight floating support structure of FOWT with guywire supported tower. J. Mar. Sci. Technol. 2018, 24, 1015–1028. [Google Scholar] [CrossRef] [Green Version]
  10. Suzuki, H.; Shiohara, H.; Schnepf, A.; Houtani, H.; Carmo, L.H.S.; Hirabayashi, S.; Haneda, K.; Chujo, T.; Nihei, Y.; Malta, E.B.; et al. Wave and wind responses of a very-light fowt with guy-wired-supported tower: Numerical and experimental studies. J. Mar. Sci. Eng. 2020, 8, 841. [Google Scholar] [CrossRef]
  11. Xiong, J.; Do Carmo, L.H.S.; Vieira, D.P.; De Mello, P.C.; Malta, E.B.; Simos, A.N.; Suzuki, H.; Gonçalves, R.T. Experimental and numerical comparison of the wave dynamics and guy wire forces of a very light FOWT considering hydroelastic behavior. In Proceedings of the ASME 2018 1st International Offshore Wind Technical Conference, IOWTC 2018, San Francisco, CA, USA, 4–7 November 2018. [Google Scholar]
  12. Campos, A.; Molins, C.; Trubat, P.; Alarcón, D. A 3D FEM model for floating wind turbines support structures. Energy Procedia 2017, 137, 177–185. [Google Scholar] [CrossRef]
  13. Faltinsen, O.M.M. Sea Loads on Ships and Offshore Structures; Cambridge University Press: Cambridge, UK, 1993; ISBN 0-521-45870-6. [Google Scholar]
  14. Beyer, F.; Choisnet, T.; Kretschmer, M.; Cheng, P.W. Coupled MBS-CFD simulation of the IDEOL floating offshore wind turbine foundation compared to wave tank model test data. In Proceedings of the International Offshore and Polar Engineering Conference, Big Island, HI, USA, 21–26 June 2015; pp. 367–374, ISBN 978-1-880653-89-0. [Google Scholar]
  15. Yoshimoto, H.; Kamizawa, K. Validation of the motion analysis method of floating offshore wind turbines using observation data acquired by full scale demonstration project. In Proceedings of the International Conference on Offshore Mechanics and Arctic Engineering—OMAE, Glasgow, Scotland, 9–14 June 2019. [Google Scholar] [CrossRef]
  16. Lamei, A.; Hayatdavoodi, M. On motion analysis and elastic response of floating offshore wind turbines. J. Ocean Eng. Mar. Energy 2020, 6, 71–90. [Google Scholar] [CrossRef] [Green Version]
  17. Zhang, S.; Ishihara, T. Effects of multidirectional sea states and flexible foundation on dynamic response of floating offshore wind turbine system. In Proceedings of the First International Symposium on Flutter and its Application, Tokyo, Japan, 15–17 May 2016; pp. 729–738. [Google Scholar]
  18. Guignier, L.; Courbois, A.; Mariani, R.; Choisnet, T. Multibody modelling of floating offshore wind turbine foundation for global loads analysis. In Proceedings of the 26th International Ocean and Polar Engineering Conference, Rhodes, Greece, 26 June–2 July 2016; pp. 333–339, ISBN 978-1-880653-88-3. [Google Scholar]
  19. Kvittem, M.I.; Moan, T. Time domain analysis procedures for fatigue assessment of a semi-submersible wind turbine. Mar. Struct. 2015, 40, 38–59. [Google Scholar] [CrossRef] [Green Version]
  20. Luan, C.; Gao, Z.; Moan, T. Development and verification of a time-domain approach for determining forces and moments in structural components of floaters with an application to floating wind turbines. Mar. Struct. 2017, 51, 87–109. [Google Scholar] [CrossRef]
  21. Luan, C.; Chabaud, V.; Bachynski, E.E.; Gao, Z.; Moan, T. Experimental validation of a time-domain approach for determining sectional loads in a floating wind turbine hull subjected to moderate waves. Energy Procedia 2017, 137, 366–381. [Google Scholar] [CrossRef]
  22. Luan, C.; Gao, Z.; Moan, T. Comparative analysis of numerically simulated and experimentally measured motions and sectional forces and moments in a floating wind turbine hull structure subjected to combined wind and wave loads. Eng. Struct. 2018, 177, 210–233. [Google Scholar] [CrossRef]
  23. Urbano, R.B.; Alexandre, A.; Urbano, R.B.; Roadnight, J.; Harries, R. Methodology for calculating floating offshore wind foundation internal loads using bladed and a finite element analysis software. In Proceedings of the International Conference on Offshore Mechanics and Arctic Engineering—OMAE, Madrid, Spain, 17–22 June 2018; pp. 1–10. [Google Scholar] [CrossRef]
  24. Oh, S.; Ishii, K.; Iijima, K.; Suzuki, H. Implementation of potential flow hydrodynamics to time-domain analysis of flexible platforms of floating offshore wind turbines. J. Phys. Conf. Ser. 2019. [Google Scholar] [CrossRef] [Green Version]
  25. Fukushima FORWARD. Available online: http://www.fukushima-forward.jp/english/index.html (accessed on 1 November 2020).
  26. Roddier, D.; Cermelli, C.; Aubault, A.; Weinstein, A. WindFloat: A floating foundation for offshore wind turbines. J. Renew. Sustain. Energy 2010, 2, 033104. [Google Scholar] [CrossRef]
  27. Ohta, M.; Komatsu, M.; Ito, H.; Kumamoto, H. Development of a V-shaped Semi-submersible Floating Structure for 7MW Offshore Wind Turbine. In Proceedings of the International Symposium on Marine and Offshore Renewable Energy, Tokyo, Japan, 28–30 October 2013; pp. 1–5. [Google Scholar]
  28. OrcaFlex—Dynamic Analysis Software for Offshore Marine Systems. Available online: https://www.orcina.com/orcaflex/ (accessed on 20 December 2020).
  29. Yamaguchi, A.; Danupon, S.; Ishihara, T. Load estimation and wind measurement considering full scale floater motion. In Proceedings of the EERA DeepWind 2020, Trondheim, Norway, 15–17 January 2020. [Google Scholar]
  30. ANSYS Inc. Ansys Aqwa: Hydrodynamics Simulation & Diffraction Analysis|Ansys. Available online: https://www.ansys.com/products/structures/ansys-aqwa (accessed on 17 December 2019).
  31. Liu, Y.; Ishihara, T. Prediction of dynamic response of semi-submersible floating offshore wind turbines by a novel hydrodynamic coefficient model. J. Phys. Conf. Ser. 2019, 1356, 012035. [Google Scholar] [CrossRef]
  32. Ishihara, T.; Liu, Y. Dynamic Response Analysis of a Semi-Submersible Floating Wind Turbine in Combined Wave and Current Conditions Using Advanced Hydrodynamic. Models. Energies 2020, 13, 5820. [Google Scholar] [CrossRef]
  33. Ishihara, T.; Zhang, S. Prediction of dynamic response of semi-submersible floating offshore wind turbine using augmented Morison’s equation with frequency dependent hydrodynamic coefficients. Renew. Energy 2019, 131, 1186–1207. [Google Scholar] [CrossRef]
Figure 1. Schematic of the semi-submersible platform and global coordinate system.
Energies 14 00182 g001aEnergies 14 00182 g001b
Figure 2. Local coordinate system for the components of (a) pontoon, (b) brace and (c) deck.
Energies 14 00182 g002
Figure 3. Elastic models of the platform used in the water tank test and the numerical simulation.
Energies 14 00182 g003
Figure 4. Local and global coordinate system for an element.
Energies 14 00182 g004
Figure 5. Overview of the elastic model and the water tank test.
Energies 14 00182 g005
Figure 6. Configuration of the platform and mooring lines in the water tank test.
Energies 14 00182 g006
Figure 7. Natural periods of motion.
Energies 14 00182 g007
Figure 8. The predicted and measured RAOs (response amplitude operators) of the dynamic responses in the regular waves.
Energies 14 00182 g008
Figure 9. Normalized dynamic response of the platform in the irregular waves.
Energies 14 00182 g009
Figure 10. RAOs of moments about the local coordinate axis at specified sections.
Energies 14 00182 g010aEnergies 14 00182 g010b
Figure 11. Normalized moments of the pontoon at section Pn-2A and Deck-2A.
Energies 14 00182 g011
Figure 12. Distribution of bending moments along the beams of Pn-2, Br-2 and Deck-2 (H = 0.05 m).
Energies 14 00182 g012
Figure 13. Overview of the platform with brace, deck and strut.
Energies 14 00182 g013
Figure 14. Comparison of the normalized dynamic responses of three platforms in the irregular waves (H = 0.195 m, T = 2.16 s).
Energies 14 00182 g014aEnergies 14 00182 g014b
Figure 15. RAOs of bending moments around x and y axes at the section Pn-2A in the regular waves (H = 0.15 m).
Energies 14 00182 g015
Figure 16. Comparison of normalized moments acting on three platform models in the irregular waves (H = 0.195 m, T = 2.16 s).
Energies 14 00182 g016
Figure 17. Local coordinate system of the connection components in the sections Pn-2.
Energies 14 00182 g017
Figure 18. Standard deviation of normalized stress at the points A, B, C for the baseline, original, optimized and full models in the irregular wave (H = 0.195 m, T = 2.16 s).
Energies 14 00182 g018
Table 1. Dimension and hydrostatic properties of the semi-submersible platform.
ElementsDimension (m)
Draft of the platform0.2667
Height of central column (Hcc) and side columns (Hsc)0.4667
Diameter of central column (Dcc)0.0823
Diameter of side columns (Dsc) 0.1250
Height of heave plate (HHp) and pontoon (HHp) 0.0667
Diameter of heave plate (DHp)0.2333
Width of pontoon 0.05~0.10
Length of pontoon (LPn) 0.2827
Diameter of brace (Dbrace)0.0375
Length of brace (Lbrace)0.3887
Height of deck0.0375
Width of deck0.0375~0.0608
Center of gravity below still water level−0.0687
Radius of gyration Kxx0.370
Radius of gyration Kyy0.374
Table 2. Stiffness properties of the elastic beam in the laboratory-scale model.
EIxx (Nm2)EIyy (Nm2)EA (N)GJ (Nm2/rad)
Pontoon193.00277.922.32 × 107213.08
Brace20.8020.846.95 × 10613.52
Deck31.1033.108.11 × 10624.78
Table 3. Structural properties of each body.
Mass (kg)Center of Gravity (m)Moment of Inertia (kg m2)
XYZIxxIyyIzzIxyIyzIzx
Body114.972−0.074−0.147−0.0451.4522.1961.9170.671−0.040−0.108
Body24.2390.2370.411−0.0980.1880.1860.019−0.0020.0000.000
Body3 (Pn-2)1.7320.1020.177−0.2330.0070.0020.009−0.0040.0000.000
Body4 (Br-2)0.2710.1280.2210.0690.0040.0020.002−0.0010.0010.002
Body4 (Deck-2)0.4200.1530.2650.2480.0020.0010.002−0.0010.0000.000
Table 4. Environmental conditions of the tests.
No.CaseWave Height (m)Wave Periods (s)Note
1Free decay--Stillwater
2Regular waves0.05, 0.151.03~3.10
3Irregular waves0.05, 0.1952.16PM spectrum
Table 5. Description of four models used for the structural optimization of the platform.
ModelDeck and BraceStrutDescription of Model
Baseline modelPlatform without deck, brace and strut
Original modelPlatform with deck and brace, but without strut
Optimized modelPlatform with strut, but without deck and brace
Full modelPlatform with deck, brace and strut
Publisher’s Note: MDPI stays neutral with regard to jurisdictional claims in published maps and institutional affiliations.

