Abstract
In this study, advanced hydrodynamic models are proposed to predict dynamic response of a floating offshore wind turbine (FOWT) in combined wave and current conditions and validated by laboratory and full-scale semi-submersible platforms. Firstly, hydrodynamic coefficient models are introduced to evaluate the added mass and drag coefficients in a wide range of Reynolds numbers. An advanced hydrodynamic model is then proposed to calculate the drag force of cylinder in combined wave and current conditions. The proposed model is validated by the water tank tests in the current-only, wave-only and current-wave conditions and is used to investigate the effect of current on the dynamic response of FOWT. Finally, the full-scale semi-submersible platform used in the Fukushima demonstration project is investigated. It is found that the predicted dynamic responses of platform by the proposed hydrodynamic models are improved by the directional spreading function of the sea wave spectrum and show favorable agreement with the field measurement.
1. Introduction
Hydrodynamic forces due to wave and current, such as inertia force and viscous force, play an important role in the design of floating offshore wind turbines (FWOTs), and the dynamic response analyses are required for the specific design load cases according to design standards and guidelines [1,2,3,4] to ensure FOWTs have adequate stability and structural strength.
The added mass and drag coefficients significantly affect the motion of FOWT and associate with the Keulegan-Carpenter number, , Reynolds number, , and surface roughness [5]. Sarpkaya [6,7] conducted a series of experiments and investigated the hydrodynamic coefficients of the two-dimensional cylinders in the oscillatory and steady flows with a wide range of Reynolds numbers. It was found that added mass and drag coefficients of the cylinders approached a constant value as Reynolds number increased. Zhang and Ishihara [8] examined the effects of number, thickness and diameter of heave plate on the hydrodynamic coefficients by the numerically forced oscillation tests. Tanaka et al. [9] displayed the variation of the coefficients of rectangular cylinders with ratios of width to height and circular corners at low numbers. Liu and Ishihara [10] proposed a hydrodynamic coefficient model to estimate the hydrodynamic coefficients for different components in a semi-submersible FOWT to take the influences of Reynolds and numbers into account. The proposed hydrodynamic coefficients were based on the relevant experiments and simulations at low Reynolds numbers for laboratory-scale models and presented as functions of and numbers. The laboratory-scale model for a floating structure is generally based on Froude number to ensure similarity between the laboratory-scale model and prototype. However, the equality in Reynolds number cannot be achieved by Froude scaling law. Thus, new hydrodynamic coefficient models are necessary to cover a wide range of Reynolds numbers and consider the effects of number for the dynamic response analyses of the laboratory- and full-scale platforms.
Accurate prediction of the current load on the platform is critical for the safety of mooring lines. Chen and Basu [11] investigated the effects of current load and wave–current interactions on the fatigue load of a spar-type FOWT. It was found that the current had a notable influence on tower responses and mean tensions of mooring lines due to the static offset. The fatigue life of mooring line was overestimated if the wave–current interaction was neglected. Soeb et al. [12] observed that the current loads compressed the oscillation of surge, heave and pitch for a spar-type platform. However, the predicted dynamic responses of the platform and mooring line in these researches were not validated by the experiments and the same drag coefficient was used to predicted current- and wave-induced drag forces. However, Sarpkaya [13] indicated that the drag coefficient of a circular cylinder in a oscillatory flow is different from that in a steady flow. It implies that the drag forces from the steady and oscillating flows should be considered at the same time in combined wave-current conditions.
The predicted dynamic responses have been compared with numerous laboratory experiments. However, validations by the full-scale FOWTs are limited. The predicted dynamic response was compared partly with the measured data from the spar-type floating wind turbine in the Hywind demo project [14,15]. Some disagreements in the prediction of dynamic response occurred due to the strong nonlinear phenomenon, which was not included in the hydrodynamic model. The low-frequency motion of a spar-type substation was analyzed recently based on the measurement data [16] in the Fukushima demonstration project. However, the semi-submersible platform in the Fukushima demonstration project, which is much more complex than the spar-type platform, has not been studied yet. In addition, ocean waves cannot be adequately described by the frequency spectrum alone due to the existence of wave propagating in various directions. Driscoll et al. [14] examined the numerical model through the field measurement and observed that the roll motion in the low-frequency range was underestimated. The possible reason was supposed that the directional spreading of the wave spectrum was neglected in the numerical model, while it exists in the ocean wave. Zhang and Ishihara [17] pointed out that the spreading function with the exponent of 2 in the wind wave condition has a significant effect on the dynamic response of motion on a 2 MW FOWT used in the Fukushima demonstration project. However, the exponent in the spreading function should be identified based on the measurement data since the wind wave and swell exist at the Fukushima site facing the Pacific Ocean [18]. The effect of the spreading function on the motion of semi-submersible platform in different wave conditions has not been validated by the field measurement.
The aim of this study is to propose advanced hydrodynamic models and predict dynamic response of a floating wind turbine in the combined wave-current conditions for laboratory and full-scale semi-submersible platforms. In Section 2, global hydrodynamic coefficient models considering the effect of Reynolds and numbers are firstly proposed for laboratory- and full-scale semi-submersible platforms. Advanced hydrodynamic models are then proposed to evaluate the drag force in the combined wave-current condition. Finally, the wave model considering the directional spreading function is introduced. In Section 3, the proposed global hydrodynamic coefficient models are validated firstly by the added mass and drag coefficients from the forced oscillation tests. The effects of the combined wave and current on the platform motion and mooring tension are then examined by the numerical model and validated by the water tank tests. Finally, the effect of the directional spreading of wave spectrum on the dynamic responses of the 2 MW semi-submersible FOWT used in the Fukushima demonstration project is investigated and compared with those obtained from the field measurements in parked conditions. Conclusions from this study are summarized in Section 4.
2. Numerical Models
Two laboratory-scale semi-submersible platforms are presented in Section 2.1. One is a 1:50 scale model and is used in the experiments with the wave and current conditions. The other is a 1:60 scale model and is used in the forced oscillation tests by Computational Fluid Dynamics (CFD). Section 2.2 shows the models to evaluate the hydrodynamic coefficients for each component of the platform, in which and are modelled as functions of Reynolds and numbers based on the experimental data obtained from the laboratory- and full-scale platforms in the oscillating and steady flows. The formulas to calculate the global hydrodynamic coefficients are described. A model to calculate the drag force in the combined wave-current condition is then proposed for the dynamic responses analysis in Section 2.3, which combines the drag forces obtained from the oscillatory and steady flows. Finally, the wave model is summarized in Section 2.4.
2.1. Description of Platform Models
The two scale models are developed according to the 2 MW semi-submersible FOWT used in the Fukushima demonstration project. The platform consists of a center column and three side columns, which are connected to the center column by pontoons, braces and decks. The pontoons are designed as rectangular cylinders with tapered sections. The skirts are attached to the bottom of the heave plates and pontoons for suppression of the platform motion and shift of the natural period in the heave direction, which are used for the 2 MW FOWT and 1:60 scale model, but not attached for the 1:50 scale model.
Figure 1 shows the schematic of the 1:60 scale platform and the right-handed coordinate, where the origin locates at the geometrical center on the water plane area, with positive x-axis in the direction of wave propagation and z-axis upward. The geometry of the 1:50 scale platform is similar to that of the 1:60 scale model except that the skirts are not attached. The detailed geometry and hydrostatic properties of the 1:50 scale model are described in Liu and Ishihara [10]. Table 1 lists the summary of geometry and hydrostatic properties of the 1:60 scale platform.
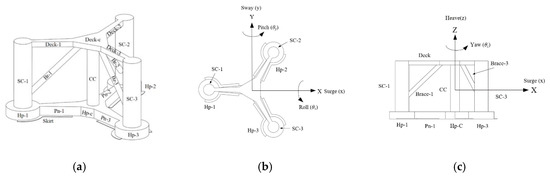
Figure 1.
Schematic of the semi-submersible platform. (a) Bird view, (b) top view and (c) side view.

Table 1.
Dimension and hydrostatic properties of the 1:60 scale semi-submersible platform.
2.2. Global Hydrodynamic Coefficient Models Considering the Effects of Reynolds and KC Numbers
Numerical simulations using the large eddy simulation as described by Pan and Ishihara [19] are conducted to calculate the hydrodynamic coefficients of the 1:60 scale platform at various Reynolds and numbers. The numerically forced oscillation tests are carried out and the movement of the model is simulated by dynamic mesh with the layering mesh update method [19].
The number, Reynolds number and frequency parameter, , for the oscillating platform model are defined as:
where is the characteristic length of the model, and and T indicate the amplitude of velocity and period of oscillation, respectively. The product of and T can be replaced by in the sinusoidal oscillation, where is the amplitude of the movement. and denote the dynamic and kinematic viscosities of fluid. Diameters of side column and heave plate are used as the characteristic length, , for the platform in the horizontal and vertical directions, respectively.
In the forced oscillation tests in still water, the displacement of the model is described as:
where is the frequency of oscillation and is the amplitude of oscillation. The hydrodynamic force acted on the platform can be expressed as:
where total force, , is integrated from pressure on the surface of the model, is constant buoyancy force of the platform at the equilibrium position in still water and indicates variation of buoyancy force due to movement of the platform.
According to Morison’s equation, the hydrodynamic force can be expressed as:
where and represent mass of displaced water and characteristic area of the model in corresponding movement direction respectively, and indicates the water density. In this study, the characteristic area is defined as projected area in the YZ plane in the horizontal direction and sum area of heave plates without skirts in the vertical direction. They are expressed as:
where , , , and are the number of heave plates, pontoons, center columns, side columns and braces, and indicate the diameter and height of heave plates without the skirts, and are the length and height of pontoons without the skirts and , and are the diameters of center column, side column and brace. and are the heights of center column and side column, is the length of brace and represents the angle between the axial direction of element and the global X coordinate, as described in Ishihara and Zhang [20].
Fourier averaged added mass and drag coefficients can be calculated as:
The hydrodynamic coefficients of the cylinders are influenced by several factors, including geometry, interaction between cylinders, and Reynolds numbers. The hydrodynamic coefficient models proposed by Liu and Ishihara [10] focus on the added mass and drag coefficients for each component of the FOWT, with consideration of these factors as:
where subscripts and denote the component and the referenced component , and superscript k indicates the direction of hydrodynamic coefficients, which can be expressed as the normal direction by n and the axial direction by t. and represent the added mass and drag coefficients of the component at the frequency parameter and number in the direction, including the contribution of the interaction effect . and mean the representative and for the referenced component at the typical frequency parameter and number in the direction. Correction factors and are introduced to account for the interaction phenomenon between components. Correction factors and represent the hydrodynamic coefficients of the cylinder as functions of and Reynolds numbers.
The original correction factors and were proposed based on the experimental data at the low Reynolds numbers in the oscillating flow in Liu and Ishihara [10] and were presented as the functions of KC and Reynolds numbers. Since the correction factors are not available for the full-scale model at the high Reynolds numbers, the model is extended to a wide range of Reynolds numbers based on both laboratory- and full-scale models in this study.
For circular cylinders, the hydrodynamic coefficients are mainly dependent on Reynolds numbers. The correction factors and for circular cylinders are extended to the high Reynolds number to evaluate the and for full-scale models. The formulas for and are obtained by the curve fitting based on the coefficients from the numerical simulations of cylinders [19] at the low and forced oscillation tests of cylinders at the high . Figure 2 and Figure 3 illustrate and for SC-2 as shown in Figure 1 as well as data obtained from the numerical simulations and experiments. The predicted coefficients are consistent with the experimental data from to at and . The added mass and drag coefficients approach constant values as the Reynolds number increases. The added mass and drag coefficients are also assumed to approach constant values in the range of .
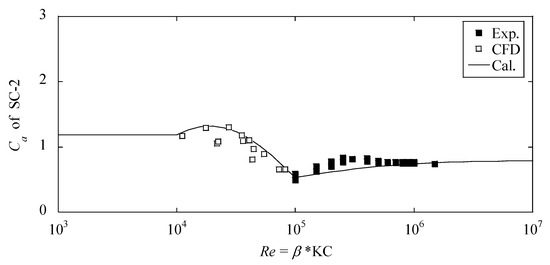
Figure 2.
Variation of for SC-2 with Reynolds (Re) number in the oscillatory flow.
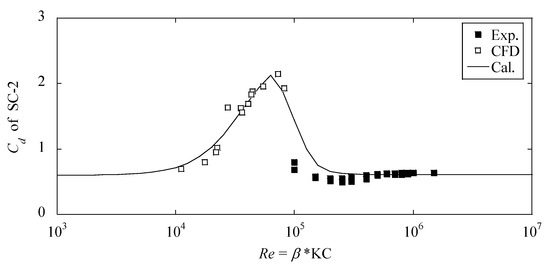
Figure 3.
Variation of of SC-2 with Reynolds number in the oscillatory flow.
Table 2 summarizes the correction factors of circular cylinders, which change with Reynolds number. Since pontoons, heave plates and skirts have the sharp edges, the hydrodynamic coefficients of them do not depend on the oscillation frequency. The hydrodynamic coefficients are dependent on number, which have the same values for the laboratory- and full-scale models. It should be noted that the hydrodynamic coefficients of the heave plates will be largely affected by the oscillation frequency if the free surface effect is significant, as mentioned by Wadhwa and Thiagarajan [21], such as the plates close to the water surface. This phenomenon does not occur in this study since the draft of the platform is large enough.
Table 2.
List of correction factors for each component.
Figure 4 illustrates variation of hydrodynamic coefficients of a square cylinder with number. The coefficients predicted by the proposed model are consistent with those obtained from the forced oscillation tests [9].
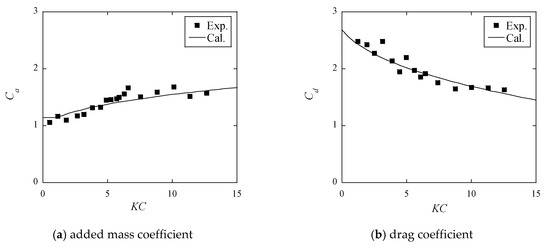
Figure 4.
Variation of (a) added mass and (b) drag coefficients of a square cylinder with number in the oscillatory flow.
The of a studless chain at various amplitudes and frequencies is investigated in the experiment by Yang [22] and is shown in Figure 5. The is dependent on not only Reynolds number but also frequency parameter, , from the figure. In the range of and , the is a nearly constant value of 2.4. In the range of , the frequency parameter, , significantly influences the drag coefficient, . The formula for the studless chain with different frequency parameter, , in the range of is expressed as shown in Equation (12) and linear interpolation is used to predict in the range of and . The added mass coefficient of the chain is considered to be consistent with the theoretical value of 1.0 for cylinders, as provided by DNV-PR-C205 [5] at any Reynolds number.
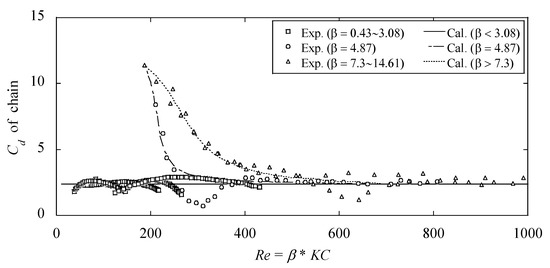
Figure 5.
Variation of of studless chain with Reynolds number in the oscillatory flow.
Regarding the of the stud chain, it is estimated to be 1.08 times that of for the studless chain based on DNVGL-OS-E301 [23] for the mooring chain, which recommends 2.4 for the studless chain and 2.6 for the stud chain at high Reynolds numbers.
Figure 6 shows the variation of drag coefficients of circular and square cylinders with Reynolds numbers in steady flow, which are obtained from the experiments [9,13]. The drag coefficient of the circular cylinder increases as Reynolds numbers increases, reaches a maximum, and then gradually decreases and approaches a constant value. The drag coefficient of the square cylinder has a constant value of 2.0. The formulas for in the steady flow are summarized in Table 3.
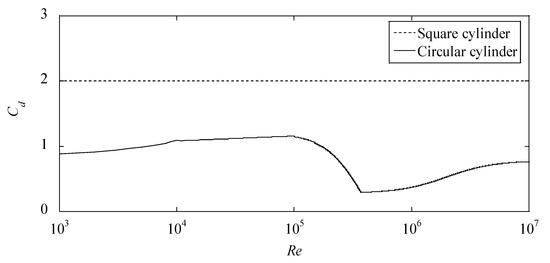
Figure 6.
Variation of of square and circular cylinders with Reynolds number in the steady flow.
Table 3.
Drag coefficients of circular and square cylinders as functions of Re in steady flow.
The distributed hydrodynamic coefficients need be integrated to obtain the global coefficients for the dynamic response analysis of the whole platform in the global coordinate (X, Y, Z). The platform in this study is divided into 79 elements, and and of each element in the local coordinate (x, y, z) can be computed by Equations (10) and (11). and of the platform in the surge and heave directions are integrated from the hydrodynamic coefficients of each element based on the formulas proposed by Ishihara and Zhang [20]. The integrated added mass coefficient and drag coefficient for the platform can be expressed by matrices. The components in the global matrices of and are presented as:
The non-zero components of global added mass coefficients are calculated by:
where is the number of element in water, is the number of plates including heave plates and pontoons, and represent the displaced volume of element i in the surge and heave directions, , and are the local coordinates for the element i and is the z-coordinate of gravity center for the whole platform.
The non-zero components of global drag coefficients are calculated by:
where and are the characteristic area of the floater in the surge and heave directions, and and represent the characteristic area of element i in the surge and heave directions, respectively. The detailed information about the derivation of formulas was shown in Ishihara and Zhang [20].
2.3. Advanced Hydrodynamic Force Models Considering the Combined Wave-Current Condition
The equation of motion for the floating wind turbine system including the wind turbine platform and mooring lines can be expressed as:
where , and are mass, damping and stiffness matrices, respectively. , and stand for displacement, velocity and acceleration vector of the platform. , , , and indicate the gravitational, buoyancy, hydrodynamic, mooring line and restoring forces, respectively. The restoring force is calculated as the product of hydrostatic stiffness and displacement vector.
The hydrodynamic force including the radiation, diffraction loads and drag forces are expressed as:
where , and are the hydrodynamic inertia force, linear radiation damping force and viscose drag force due to movement of the platform, and and indicate the Froude-Krylov (F-K) force and diffraction force due to wave excitation. is calculated by:
where is density of water and is volume of displaced water. The sum of and , named as wave load, is commonly predicted by the potential theory. The wave load is given by:
where superscript denotes the six degrees of freedom in the global coordinate, indicates the force and moment in each direction, and are the amplitude and phase of wave loads, and represent the wave amplitude and frequency and is time. All terms in Equation (17) are computed as the integrated force and moment based on the global coordinate, except drag force, , which is calculated as the distributed force based on the local coordinate of each element by:
where is the drag coefficients of the structure in the normal direction, represents the relative velocity of the structure to water particle and denotes the characteristic area of the element in the normal direction. The drag force in the axial direction for the heave plates is calculated by the equation similar to Equation (21).
The drag force acted on the platform is widely calculated by the Equation (21) in the combined wave-current condition. However, obtained from the oscillating and steady flow is inapplicable for the combined wave-current condition since they have different values, as mentioned by Sarpkaya [13]. In addition, for the combined wave-current condition is difficult to be measured by the experiments.
In this study, an advanced drag force model is proposed to calculate the drag force contributed from the wave and current as:
where is the drag coefficient of cylinder obtained from the forced oscillation test, means the drag coefficient of cylinder measured in the steady flow and both and are the functions of Reynolds number. and denote the relative velocity and current velocity, respectively. In the wave-only and current-only conditions, the drag forces by the proposed formula are the same as those calculated by Equation (21). In the combined wave-current condition, the current-induced drag forces are calculated using from the steady flow, while the wave- and motion-induced drag forces are predicted using from the forced oscillation test.
2.4. Wave Model Considering the Directional Spreading Function
Ocean waves have multidirectional components. The directional spreading function can provide the directional distribution of wave energy. The directional spectrum of the sea surface is commonly presented as the frequency spectrum times a function of angular spreading, expressed as:
where is the frequency spectrum of the wave and is described by the JONSWAP spectrum. is the directional spreading function. , and represent the significant wave height, peak frequency of wave and wave frequency. implies peak enhancement factor, is the Gamma function and and are the direction of elementary wave trains and the main wave direction, respectively.
The wave frequency spectrum is discretized with the number of frequencies, N, and the transient wave elevation, , on a location can be calculated by a sum of sinusoidal components, presented as:
where is the amplitude of wave component, , and and indicate wave number, wave frequency and random phase, respectively. The detailed information can be found in Ishihara and Zhang [20].
3. Results and Discussion
The proposed hydrodynamic coefficient models are validated by the integrated added mass and drag coefficients obtained from the forced oscillation test of a 1:60 scale model in Section 3.1. The effect of current on the dynamic response of the platform is then investigated by the proposed hydrodynamic model and validated by the water tank tests of a 1:50 scale model in Section 3.2. Finally, the effect of directional spreading of wave on the dynamic responses of a full-scale platform is examined and validated by the field measurements in Section 3.3.
3.1. Validation of the Proposed Global Hydrodynamic Coefficient Models Considering the Effects of Reynolds and KC Numbers
The global added mass and drag coefficients predicted by the proposed model is compared to those obtained from the numerical forced oscillation test by Pan and Ishihara [19], which showed good agreement with the experimental data from the water tank tests. The numerical simulations were conducted at four Reynolds numbers in the surge direction and three numbers in the heave direction. The global added mass and drag coefficients in the surge and heave directions from CFD are calculated according to Equations (8) and (9). The global hydrodynamic coefficients from the proposed formulas are calculated by Equations (14) and (15).
Figure 7a,b display variation of global added mass and drag coefficients with in the surge direction, and Figure 7c,d show variation of those with in the heave direction. It is found that the global drag coefficient in Figure 7b shows a peak near , since the drag coefficient of circular cylinder has maximum value near this Reynolds number. In Figure 7c,d, the variation of global added mass and drag coefficients in the heave direction shows different trends with . The global added mass coefficient, , increases as increases, while the global drag coefficient, , decreases as increases.
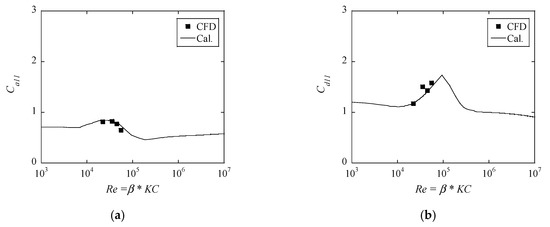
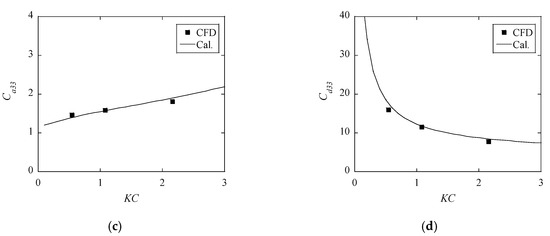
Figure 7.
Global hydrodynamic coefficients in the surge and heave directions. (a) Added mass coefficient in the surge direction, (b) drag coefficient in the surge direction, (c) added mass coefficient in the heave direction and (d) drag coefficient in the heave direction.
3.2. Validation of the Advanved Hydrodynamic Models by the Water Tank Tests in the Combined Wave and Current Conditions
The proposed hydrodynamic model with in steady and oscillatory flow is validated by the water tank tests in the current-only, wave-only and combined wave-current conditions. The influence of the current on the dynamic responses of platform motion and mooring tension is also investigated.
The dynamic responses of the platform for the 1:50 scale model [10] in the wave and current conditions are studied. Figure 8 shows an overview of the water tank and platform. Figure 9 presents the arrangement of the experiment and layout of the mooring lines. The platform motion and the mooring tension are measured in the experiments. The wave elevation is measured by two wave height meters, which are installed upstream and beside the platform. A current meter, which locates downstream, records the current velocity. Table 4 provides the environmental states in the experiments. In the free decay tests (Case 1), the natural periods of six degrees of the motion are measured first. The responses of the platform in the current-only (Case 2) and wave-only conditions (Case 3 with regular waves and Case 4 with irregular waves) are then investigated. Finally, the dynamic responses of the platform in the combined wave-current conditions (Case 5 with regular waves and Case 6 with irregular waves) are examined.
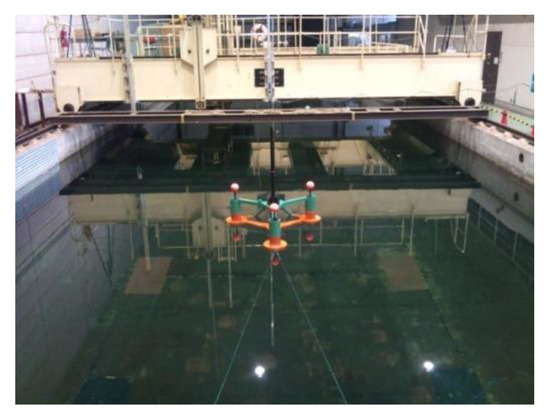
Figure 8.
Overview of the water tank and platform.
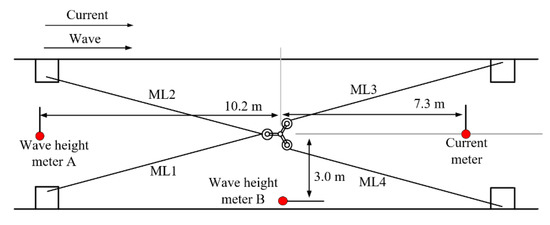
Figure 9.
Arrangement of the experiment and layout of the mooring lines in the wave and current conditions.
Table 4.
Wave and current conditions in the experiments.
The calculated dynamic responses of the platform in different wave and current conditions are compared with the experimental data to validate the proposed model. Two numerical models are built. The first model is developed according to the proposed model, which utilizes the drag coefficients of the cylinder in the oscillatory and steady flows, as shown in Equation (22), and applied to 112 positions on the platform. Another model only uses the drag coefficients in the oscillatory flow. The added mass coefficients obtained from the potential theory and the recommended drag coefficients from DNV standards are used as the initial values. The and Reynolds numbers dependent hydrodynamic coefficients are then acquired based on the predicted responses. These updated coefficients are used, and the simulation is carried out again. The simulations are performed using Orcaflex [24].
Figure 10 presents comparison of the predicted and measured mean value of the surge in the current-only condition. It is found that the conventional model using obtained from the oscillatory flow overestimates the surge, while the proposed model matches well with the experimental data. It is attributed that the proposed model calculates the current loading according to obtained from the steady flow, which is smaller than obtained from the oscillatory flow at the Reynolds number in the experiment.
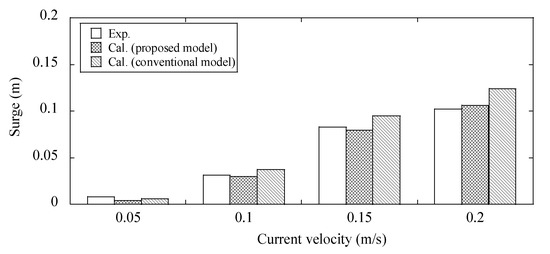
Figure 10.
Comparison of predicted and measured surge displacement in the current-only condition.
Figure 11 shows a comparison of the predicted and measured mean values of surge, pitch and tensions of mooring lines ML2 and ML3 in the regular wave with the current. The mean values are normalized by the experimental data in Figure 11. The value of surge predicted by from the oscillatory flow is overestimated, which is consistent with the conclusion from Figure 10. The mean value of pitch is also overestimated due to the overestimation of the mean value of surge.
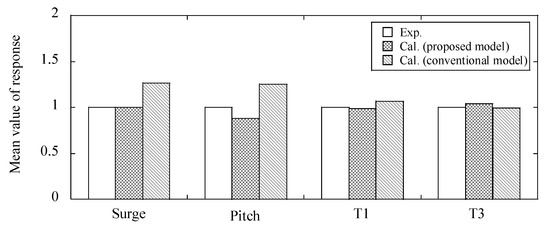
Figure 11.
Comparison of predicted and measured mean values of the displacement, rotation and mooring tension in the combined wave-current condition (regular wave with T = 2.5 s).
Figure 12 shows a comparison of the predicted and measured response amplitude operators (RAOs). The RAOs of the surge, heave and pitch motions as well as the mooring tension in the wave-only and combined wave-current conditions are calculated. In the water tank tests, the responses at 9 wave periods in the wave-only condition and at 3 wave periods in the combined wave-current condition are examined and used for validation of the proposed model. Since the proposed model is the same as the conventional model in the wave-only condition, only the predicted dynamic responses by the proposed model are shown in the figures. In the combined wave-current condition, the predicted dynamic responses by both models are plotted in the figures for comparison.
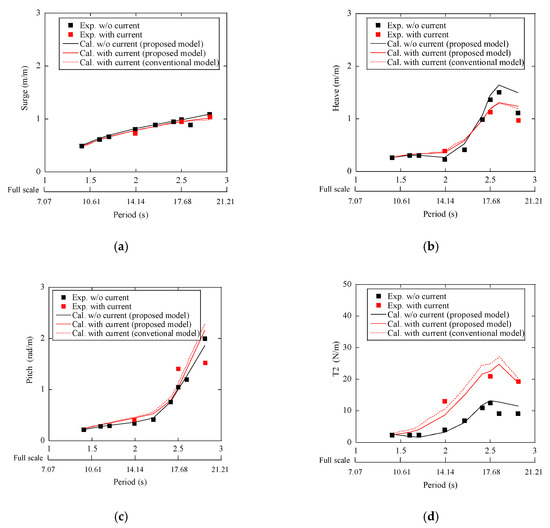
Figure 12.
Comparison of predicted and measured response amplitude operators (RAOs) of the platform in the wave-only and combined wave-current conditions. (a) RAO of surge motion, (b) RAO of heave motion, (c) RAO of pitch motion and (d) RAO of mooing tension for ML2.
The dynamic response of surge motion illustrated in Figure 12a shows similar values for the cases with and without the current since the experiments near the natural period of the surge motion are not conducted due to the limitation of the water tank. The dynamic responses of heave and pitch motions in the case with the current as shown in Figure 12b,c are smaller than those in the case without the current, while the dynamic responses of mooring tension as illustrated in Figure 12d increases in the case with the current. The current increases the velocity of water particles passing through the pontoon, which leads to the increment of damping in the vertical direction. The current also moves the equilibrium position of the platform to the downstream and results in the increase of the tension of upstream mooring line and affects the pitch response. It is suspected that this is caused by the change of mean tension of the mooring line and the equilibrium position of pitch. It is noticed that the conventional model using obtained from the oscillatory flow slightly overestimates the response of the mooring tension due to the overestimation of mean values of surge and pitch motions, as shown in Figure 11, while the proposed model shows favorable agreement with the experimental data.
In the irregular wave condition, the power spectral density (PSD) of wave elevation without and with the current is shown in Figure 13 and the dynamic responses of platform and mooring line are given in Figure 14. It can be found that the wave height of the combined wave-current condition is slightly lower than that of the wave-only condition. To minimize the effect of the wave height on the motions of platform and tension of mooring, the PSD of the responses are normalized by the squared significant wave heights, as shown in Figure 14. Similarity to dynamic responses in the regular wave conditions, the current has a limited effect on the dynamic response of the motions of platform, as illustrated in Figure 14a–c, while it significantly increases the dynamic response of the tension of the upstream mooring line due to the movement of the mean position of surge, as shown in Figure 14d. At the natural period of surge motion, the predicted dynamic responses with the current decrease due to the increase of damping in the surge direction. It is the same as what was mentioned by Soeb et al. [12]. On the other hand, the dynamic response of the tension of the upstream mooring line significantly increases due to the existence of the current. It implies that the fatigue life of the mooring line is overestimated if the effect of current is neglected for the semi-submersible FOWT, which is consistent with the conclusion by Chen and Basu [11] for the spar-type FOWT.
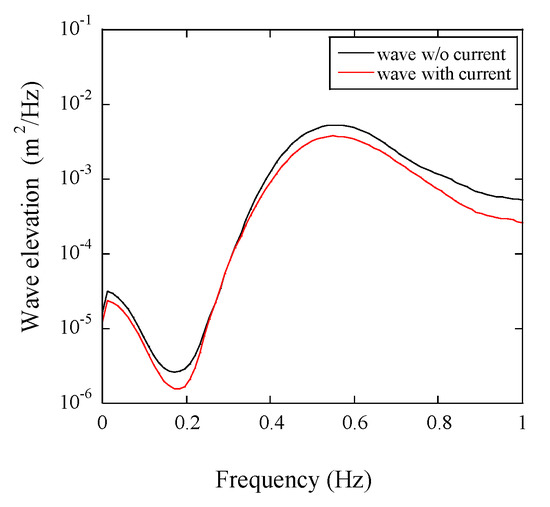
Figure 13.
PSD of measured wave elevation.
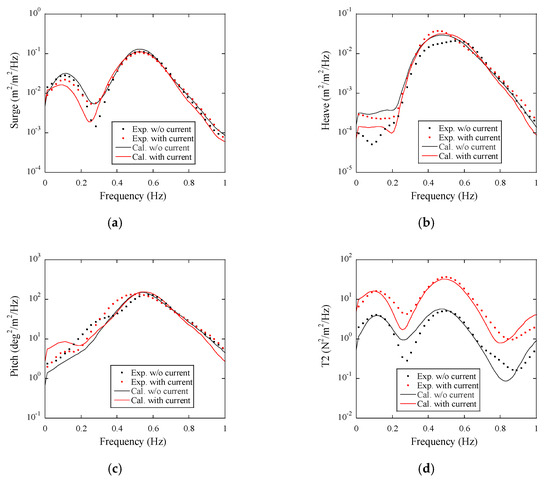
Figure 14.
Comparison of predicted and measured PSD of motions and mooring tension in wave-only and combined wave-current conditions. (a) PSD of surge motion, (b) PSD of heave motion, (c) PSD of pitch motion and (d) PSD of mooring tension.
3.3. Validation of the Proposed Hydrodynamic Models and the Directional Spreading Function by the Full-Scale Platform
To validate the proposed hydrodynamic models for the full-scale platform, the 2 MW semi-submersible FOWT used in the Fukushima demonstration project is selected. The effect of directional spreading function on the dynamic responses of FOWT in parked condition is also investigated.
The Fukushima Floating Offshore Wind Farm Demonstration Project (Fukushima FORWARD) has been conducted since 2011. The 2 MW semi-submersible FOWT was installed in 2013 in 120 m water depth. The platform is moored by six catenary mooring lines using stud chains, which are different from the laboratory-scale model using studless chains. The overview of the 2 MW semi-submersible FOWT and configuration of the mooring lines are shown in Figure 15.
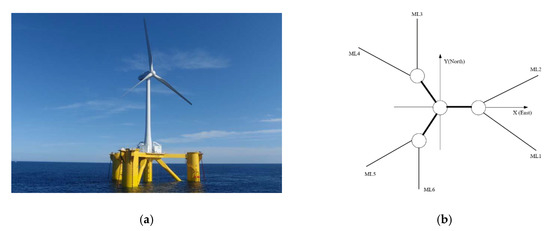
Figure 15.
2 MW semi-submersible FOWT used in the Fukushima demonstration project. (a) Overview of full-scale platform and (b) configuration of mooring lines.
The simulations for the 2 MW semi-submersible FOWT are performed using the coupled Orcaflex [24] and FAST [25]. The aerodynamic loads on the wind turbine and tower in air are simulated by FAST and the hydrodynamic loads on the platform and mooring lines in water are computed by Orcaflex. The added mass and drag coefficients in the numerical model are evaluated using the proposed hydrodynamic coefficient models.
The numerical model involves the wind turbine, including three blades, hub, nacelle, generator, tower, platform and mooring lines. The variation of current velocity with depth is expressed by a power law with an exponent of 1/7. Three blades are fixed at the pitch angle of 90 degrees in the parked condition.
In the Fukushima FORWORD, the platform motions in six degrees of freedom at the gravity center are recorded by a GPS, a 3-axis gyro and a 3-axis accelerometer. Tower moments are measured by using the strain gauges at two different elevations. A floating substation near the 2 MW wind turbine is equipped with anemometers, wave and current measurement devices. The wave elevation is measured by the wave meter. The unexpected low-frequency component in the measured spectrum of waves, which is generated by the motion of the substation [26] and is not observed by the buoy measurement, is removed in this study. The motion of the substation has a significant effect on the turbulence intensity in the vertical direction, but the effect on the horizontal velocity component is limited, as mentioned by Yamaguchi and Ishihara [27,28]. The steady wind and current models are used in the simulations and the validation of the proposed hydrodynamic model in parked condition is focused on in this study. GPS occasionally fails to record data and leads to missing data. To compensate for the missing data, the data by GPS and accelerometer are combined to obtain the continuous time history of platform motion when GPS data is missing, as described by Yamaguchi et al. [29].
Two 20-min datasets in parked condition are selected for the low and high wave height conditions. The information on wind, wave and current conditions are shown in Table 5, where the direction in the measurement is defined from the north in the clockwise direction. The in the JONSWAP spectrum and exponent in the spreading function are identified by the least square method based on the measured wave spectrum. The exponent at the Fukushima site is slightly larger than 2, as shown in Table 5, which is consistent with the typical value of the exponent as recommended in DNVGL-CG-0130 [30].
Table 5.
Description on the wind, wave and current conditions at the Fukushima site used in this study.
Figure 16 presents the comparison between the simulated JONSWAP wave spectrum and spreading function and the measurement data for low and high wave height cases. The JONSWAP spectrum and the spreading function match well with the measurement.
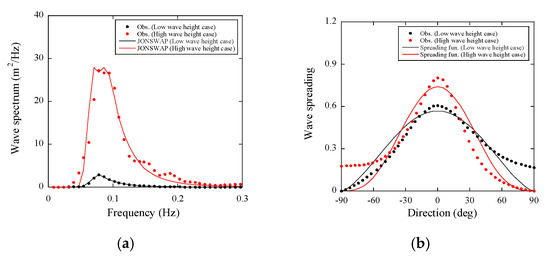
Figure 16.
Comparison of the (a) frequency spectrum and (b) directional spreading between the observed and simulated wave at low and high wave height cases.
The free decay test is performed for the full-scale model. The simulated natural period of roll motion is 22.4 s, which is consistent with the measured natural period of roll motion for the 2 MW FOWT through an emergency stop in the Fukushima demonstration project [31].
Two numerical simulations without and with the spreading function are then conducted. The PSDs of the platform motions for the low wave height case are given in Figure 17. The dynamic responses are normalized by the squared significant wave height. In this case, the wave direction is close to the surge direction and the spreading function strongly affects the motions in the sway, roll and yaw directions. Without consideration of directional spreading of the wave spectrum, the sway, roll and yaw motions are significantly underestimated. The PSDs of platform motions for the high wave height case are shown in Figure 18. The effect of the spreading function on the dynamic responses of platform motions is relatively small in this case, since the primary wave direction is located between the surge and sway directions, while the improvement for the yaw motion by the spreading function is significant, as shown in Figure 18f. The low-frequency peaks observed in the PSDs of platform motions in the surge and sway directions, as illustrated in Figure 18a,b, correspond to the natural frequencies in these two directions. The low-frequency peaks are not obvious in the PSDs of platform motions in the heave, roll and pitch directions, as shown in Figure 18c–e, since the natural frequencies in these directions are close to the peak frequency of the wave. The dynamic responses of 2 MW FOWT in the six degrees of freedom are well predicted by the proposed hydrodynamic models.
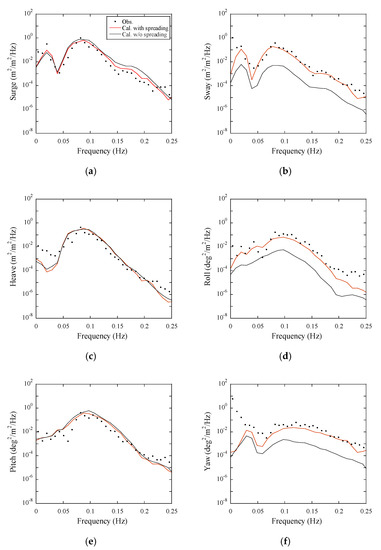
Figure 17.
Normalized PSD of observed and simulated motions in the six degrees of freedom at the low wave height case. (a) PSD of surge motion, (b) PSD of sway motion, (c) PSD of heave motion, (d) PSD of roll motion, (e) PSD of pitch motion and (f) PSD of yaw motion.
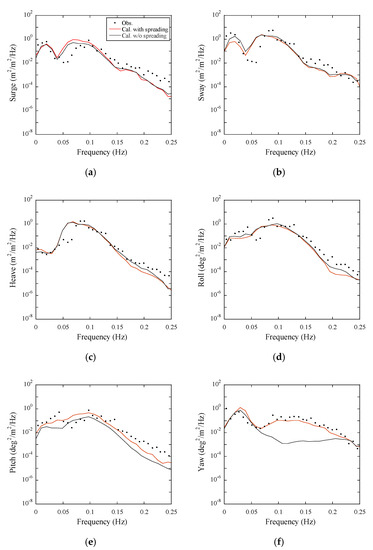
Figure 18.
PSD of observed and simulated motions in the six degrees of freedom at the high wave height case. (a) PSD of surge, (b) PSD of sway motion, (c) PSD of heave motion, (d) PSD of roll motion, (e) PSD of pitch motion and (f) PSD of yaw motion.
4. Conclusions
The advanced hydrodynamic models were proposed to predict dynamic responses of floating wind turbines in combined wave-current conditions and validated by laboratory- and full-scale semi-submersible platforms. The conclusions are obtained as follows:
- The global hydrodynamic coefficient models considering the effects of Reynolds and numbers were proposed for the first time to evaluate the added mass and drag coefficients for the laboratory- and full-scale platforms. The predicted global hydrodynamic coefficients by the proposed models show good agreement with those obtained from the forced oscillation tests.
- An advanced hydrodynamic model was proposed to calculate the drag force in the combined wave-current condition. The predicted platform motions and mooring tensions by the proposed model showed favorable agreement with the experimental data obtained from the water tank tests, while the conventional Morison’s equation overestimated them.
- The predicted dynamic responses of platform were improved with consideration of the directional spreading of the sea wave spectrum, while those by the wave model without the directional spreading function were significantly underestimated in the sway, roll and yaw directions. The predicted dynamic responses by the proposed model showed good agreement with the field measurements on the 2 MW FOWT used in the Fukushima demonstration project.
Author Contributions
Conceptualization, T.I.; formal analysis, Y.L.; investigation, Y.L.; visualization, Y.L; writing—original draft preparation, T.I.; writing—review and editing, T.I.; project administration, T.I. All authors have read and agreed to the published version of the manuscript.
Funding
This research received no external funding.
Acknowledgments
This research was carried out as a part of the Fukushima floating offshore wind farm demonstration project funded by the Ministry of Economy, Trade and Industry. The authors wish to express their deepest gratitude to the concerned parties for their assistance during this study.
Conflicts of Interest
The authors declare no conflict of interest.
References
- IEC 61400-3-1. Wind Energy Generation Systems-Part 3-1: Design Requirements For Fixed Offshore Wind Turbines, 1st ed.; International Electrotechnical Commission: Geneva, Switzerland, 2019. [Google Scholar]
- DNV-OSJ101. Design of Offshore Wind Turbine Structures; Det Norske Veritas: Høvik, Norway, 2013. [Google Scholar]
- DNV-OSJ103. Design of Floating Wind Turbine Structures; Det Norske Veritas: Høvik, Norway, 2013. [Google Scholar]
- API RP 2SK. Design and Analysis of Stationkeeping Systems for Floating Structures, 3rd ed.; American Petroleum Institute: Washington, DC, USA, 2005. [Google Scholar]
- DNV-RP-C205. Environmental Conditions and Environmental Loads; Det Norske Veritas: Høvik, Norway, 2014. [Google Scholar]
- Sarpkaya, T. In-Line and Transverse Forces, on Cylinders in Oscillatory Flow at High Reynolds Numbers. In Proceedings of the Offshore Technology Conference, Houston, TX, USA, 3–6 May 1976. [Google Scholar]
- Sarpkaya, T. Wave Forces on Offshore Structures; Cambridge University Press: Cambridge, UK, 2012; ISBN 9781139195898. [Google Scholar]
- Zhang, S.; Ishihara, T. Numerical study of hydrodynamic coefficients of multiple heave plates by large eddy simulations with volume of fluid method. Ocean Eng. 2018, 163, 583–598. [Google Scholar] [CrossRef]
- Tanaka, N.; Ikeda, Y.; Himeno, Y.; Fukutomi, Y. Experimental Study on Hydrodynamic Viscous Force Acting on Oscillating Bluff Body. J. Jpn. Soc. Naval Archit. Ocean Eng. 1980, 175, 35–43. (In Japanese) [Google Scholar]
- Liu, Y.; Ishihara, T. Prediction of dynamic response of semi-submersible floating offshore wind turbines by a novel hydrodynamic coefficient model. J. Phys. Conf. Ser. 2019, 1356, 012035. [Google Scholar] [CrossRef]
- Chen, L.; Basu, B. Fatigue load estimation of a spar-type floating offshore wind turbine considering wave-current interactions. Int. J. Fatigue 2018, 116, 421–428. [Google Scholar] [CrossRef]
- Soeb, M.R.; Islam, A.B.M.S.; Jumaat, M.Z.; Huda, N.; Arzu, F. Response of nonlinear offshore spar platform under wave and current. Ocean Eng. 2017, 144, 296–304. [Google Scholar] [CrossRef]
- Sarpkaya, T. Vortex Shedding and Resistance in Harmonic Flow about Smooth and Rough Circular Cylinders at High Reynolds Numbers; Naval Postgraduate School: Monterey, CA, USA, 1976. [Google Scholar]
- Driscoll, F.; Jonkman, J.; Robertson, A.; Sirnivas, S.; Skaare, B.; Nielsen, F.G. Validation of a FAST Model of the Statoil-hywind Demo Floating Wind Turbine. Energy Procedia 2016, 94, 3–19. [Google Scholar] [CrossRef]
- Skaare, B.; Nielsen, F.G.; Hanson, T.D.; Yttervik, R.; Havmøller, O.; Rekdal, A. Analysis of measurements and simulations from the Hywind Demo floating wind turbine. Wind Energy 2015. [Google Scholar] [CrossRef]
- Kamizawa, K.; Yoshimoto, H.; Yoshida, H.; Kamizawa, K. Validation of applicability of low frequency motion analysis theory using observation data of floating offshore substation. In Proceedings of the Proceedings of the International Conference on Offshore Mechanics and Arctic Engineering—OMAE, Madrid, Spain, 17–22 June 2018; American Society of Mechanical Engineers (ASME): New York, NY, USA, 2018; Volume 6, pp. 1–9. [Google Scholar]
- Zhang, S.; Ishihara, T. Effects of multidirectional sea states and flexible foundation on dynamic response of floating offshore wind turbine system. In Proceedings of the First International Symposium on Flutter and its Application, Tokyo, Japan, 15–17 May 2016; pp. 729–738. [Google Scholar]
- Tanemoto, J.; Ishihara, T. A numerical study of wind wave and swell by using wave prediction models and combined wind fields. J. Wind Energy 2014, 38, 124–131. (In Japanese) [Google Scholar]
- Pan, J.; Ishihara, T. Numerical prediction of hydrodynamic coefficients for a semi-sub platform by using large eddy simulation with volume of fluid method and Richardson extrapolation. J. Phys. Conf. Ser. 2019, 1356, 012034. [Google Scholar] [CrossRef]
- Ishihara, T.; Zhang, S. Prediction of dynamic response of semi-submersible floating offshore wind turbine using augmented Morison’s equation with frequency dependent hydrodynamic coefficients. Renew. Energy 2019, 131, 1186–1207. [Google Scholar] [CrossRef]
- Wadhwa, H.; Thiagarajan, K.P. Experimental Assessment of Hydrodynamic Coefficients of Disks Oscillating Near a Free Surface. In Proceedings of the International Conference on Ocean, Offshore and Arctic Engineering, Honolulu, HI, USA, 31 May–5 June 2009; pp. 435–441. [Google Scholar]
- Yang, W.S. Hydrodynamic Analyis of Mooring Lines Based on Optical Tracking Experiments. Ph.D. Thesis, Texas A&M University, College Station, TX, USA, 2007. [Google Scholar]
- DNVGL-OS-E301. Position Mooring; Det Norske Veritas and Germanischer Lloyd: Høvik, Norway, 2015. [Google Scholar]
- OrcaFlex. Available online: https://www.orcina.com/SoftwareProducts/OrcaFlex/ (accessed on 6 November 2020).
- FAST User’s Guide, NREL/TP-500-38230; National Renewable Energy Laboratory: Golden, CO, USA, 2005.
- Yamaguchi, A.; Taki, S.; Ishihara, T. Metocean measurement at Fukushima offshore site. In Proceedings of the Grand Renewable Energy 2018, Yokohama, Japan, 17–22 June 2018; P-We-31. Volume 1. [Google Scholar] [CrossRef]
- Yamaguchi, A.; Ishihara, T. Floating offshore wind measurement system by using LIDAR and its verification. In Proceedings of the Europe’s Premier Wind Energy Event 2015, Paris, France, 17–20 November 2015. [Google Scholar]
- Yamaguchi, A.; Ishihara, T. A new motion compensation algorithm of floating lidar system for the assessment of turbulence intensity. J. Phys. Conf. Ser. 2016, 1037, 042022. [Google Scholar] [CrossRef]
- Yamaguchi, A.; Danupon, S.; Ishihara, T. Load estimation and wind measurement considering full scale floater motion. In Proceedings of the EERA DeepWind 2020, Trondheim, Norway, 15–17 January 2020. [Google Scholar]
- DNVGL-CG-0130. Wave Loads; Det Norske Veritas and Germanischer Lloyd: Høvik, Norway, 2018. [Google Scholar]
- Yamaguchi, H.; Imakita, A. Learning from field test regading damping of a floater motion—2 MW FOWT “Fukushima Mirai”. In Proceedings of the Grand Renewable Energy 2018, Yokohama, Japan, 17–22 June 2018; P-We-5. Volume 1. [Google Scholar] [CrossRef]


Publisher’s Note: MDPI stays neutral with regard to jurisdictional claims in published maps and institutional affiliations. |
© 2020 by the authors. Licensee MDPI, Basel, Switzerland. This article is an open access article distributed under the terms and conditions of the Creative Commons Attribution (CC BY) license (http://creativecommons.org/licenses/by/4.0/).