Abstract
In this study, a numerical and empirical scheme for increasing cooling tower performance is developed by combining the particle swarm optimization (PSO) algorithm with a neural network and considering the packing’s compaction as an effective factor for higher accuracies. An experimental setup is used to analyze the effects of packing compaction on the performance. The neural network is optimized by the PSO algorithm in order to predict the precise temperature difference, efficiency, and outlet temperature, which are functions of air flow rate, water flow rate, inlet water temperature, inlet air temperature, inlet air relative humidity, and packing compaction. The effects of water flow rate, air flow rate, inlet water temperature, and packing compaction on the performance are examined. A new empirical model for the cooling tower performance and efficiency is also developed. Finally, the optimized performance conditions of the cooling tower are obtained by the presented correlations. The results reveal that cooling tower efficiency is increased by increasing the air flow rate, water flow rate, and packing compaction.
1. Introduction
Cooling towers have important roles in air conditioning systems and power plants. A cooling tower is a device that facilitates evaporation by making a larger contact surface between water and air, therefore leading to more immediate water cooling. Cooling occurs by losing latent heat of vaporization while a small amount of water vaporizes and results in water cooling. It should be noted that the heat loss in water occurs in three ways: Radiation, conduction, and convection. Moreover, the remaining heat is removed by evaporation. Most cooling systems have a closed circuit. Water plays a role in the absorption, removal, and heat transfer, meaning that water dissipates the generated heat by the device. This causes the system to operate steadily and uniformly.
Numerous researchers have investigated the cooling tower performance theoretically and empirically. Goshayshi and Missenden [1] experimentally studied the heat transfer coefficient of different packings. The heat transfer coefficient was shown to be the function of pitch and distance of packings. Hasan and Siren [2] inspected the cooling tower performance theoretically and computationally. They optimized the tower flow and number of pipes to obtain the best performance coefficient. Kloppers and Kroger [3] investigated the influence of the Lewis number on wet cooling tower performance. They demonstrated that increasing the Lewis number led to a decrease in the outlet water temperature and evaporation rate. Lemouari et al. [4,5] experimentally studied the contact heat transfer between water and air in the cooling towers. They analyzed the influence of water flow rates and air on the heat transfer coefficient. Yoo et al. [6] presented high-accuracy correlations for heat transfer based on experimental data. Furthermore, they analyzed the influences of different parameters on cooling capacity and tower efficiency. Heyns and Kroger [7] analyzed different parameters of cooling towers and developed correlations for heat transfer and pressure drop. Their experimental outcomes revealed that the cooling tower heat transfer coefficient is dependent on the air velocity, water velocity, and splashed water temperature. Braun et al. [8] provided an effective procedure to model the cooling tower performance. They compared their results with the numerical simulations. They claimed that their model accuracy was higher than the standard procedures and needed less computational time. Fisenko et al. [9] introduced a new mathematical approach for cooling towers. They showed that the model predicted the experimental values with 3% accuracy. Naphon [10] suggested a mathematical model to measure the performance of the cooling tower. The model was introduced to compute the cooling tower heat transfer based on the conservation of mass and momentum equations and solved the equations using the iterative method. Their results were in good agreement with other models. The measured data were in good agreement with the predicted results. Some researchers [11,12,13,14] have modelled energy systems by neural network. Hosoz et al. [15] estimated the wet cooling tower performance by neural network. Their results indicated the high accuracy prediction for cooling tower performance. Huang et al. [16] modelled the wet cooling tower temperature under the condition of wind using a neural network and limited inputs and outputs. Gao et al. [17] modeled the cooling tower performance under wind conditions using a neural network and limited inputs and outputs. They [18] obtained a comprehensive model by increasing the input and output parameters. Recently, Singh et al. [19] studied the cooling tower performance using different packings. Some correlations were suggested based on empirical data for parameters involved in cooling tower performance by considering water and flow rate as design parameters. Packings were used to intensify heat transfer between the water and air flow inside the cooling tower. Zheng et al. [20] empirically investigated the thermal performance of the oval tube (CWCT). They presented a mathematical model to estimate the thermal performance of cooling. Lavasani et al. [21] investigated the cooling tower performance with forced flow due to rotating packings empirically. They compared the cooling tower parameters of rotating packings to nonrotating packings. The results indicated that the packing with high rotational velocity has a better performance. Shahali et al. [22] empirically studied the cooling tower performance affected by water flow rate, air flow rate, inlet water temperature, and type of packing. They presented some correlations to estimate the cooling tower performance. Lu et al. [23] empirically investigated the side wind effects on the dry cooling tower performance. They compared their results with other researchers’ results. The obtained results and other numerical results were in good agreement. They showed that the overall heat transfer rate of dry cooling tower includes a combination of forced and natural convective heat transfer. Zhao et al. [24] created a 3D model to analyze the coolant parameters of cooling tower. They combined their model with validated results for ordinary natural draft wet cooling towers, and these results were compared to the usual natural draft wet cooling towers (UNDWCT). Finally, the coolant parameters of high-level water-collecting natural draft wet cooling towers (HNDWCT) were specified. Singla et al. [25] numerically investigated the counter flow forced draft cooling tower with expanded wire meshed filled as a packing material. They analyzed the parameters involved in controlling the water and air flow rate on parameters that are of high importance in cooling tower performance. Then, they presented a correlation for the Merkel number as a function of water and air flow rate. Finally, they optimized the control parameters of water and air flow rate for a specific Merkel number. Furthermore, some studies were directed toward the design of a wind tower [26,27,28]. One of the advantage of wind towers is that they no energy for operation. Also, wind towers decrease environmental pollution and save electrical energy consumption. Mofrad et al. [29] presented an experimental study with different nanofluids. The nanofluids included Zinc Silica/Water, Oxide/Water, Graphene/Water, and Alumina/Water for the wet cooling tower. They used a novel procedure to compare the performance conditions. Gilani et al. [30] studied an experimental investigation for improving the wet cooling tower. They showed that the water temperature decreased by increasing the cooling tower height, but increasing the height had a greater effect than the other parameter. Chen et al. [31] introduced a new method for modifying the cooling performance of wet cooling towers. They obtained the effective mechanism of the air ducts on cooling towers, which was investigated under both windless and crosswind conditions.
These packings have effective roles on water cooling through increasing the contact surface between the water and air flow and decreasing the water flow velocity. In this study, the cooling tower performance was investigated using the combination of a particle swarm optimization (PSO) algorithm and neural network to obtain higher accuracies. An experimental setup was prepared to study the effects of compaction on the performance. A wide range of experiments were performed, and the optimum conditions were determined using an artificial neural network (ANN)-PSO.
2. Experimental Setup and Test Conditions
Figure 1 illustrates the schematic diagram of the cooling tower. The setup included 1—a cooling tower, 2—packing, 3—a radial fan, 4—an air chamber, 5—a water tank, 6—an electric heater, 7—a water pump, 8—a drain valve for the supply tank, 9—a supply tank, 10—a flow meter, 11— a moisture eliminator, and 12—a spray nozzle.
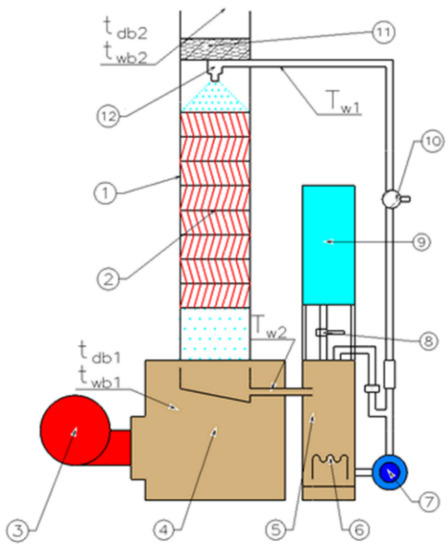
Figure 1.
Schematic diagram of wet cooling tower.
Electrical heaters (6) heated the water in the tank (5). The hot water was circulated in the closed circuit by the pump (7). The water was transferred to the top column (1) of the cooling tower and then sprayed (12) uniformly over the packings (2). The blown air by the compressor (3) flowed among the packings, and the interaction between air and water led to water cooling. The air blown by the compressor was evaluated by measuring the pressure drop in the compressor inlet and outlet. The cooling tower was made of Plexiglas and its dimensions were 210 mm × 210 mm × 630 mm (L × W × H). The vertical grid apparatus (VGA) packings filled the WCT. The cross-section of the test area was 150 mm × 150 mm and the applied packings included 3 types which were made of PVC. There was an electric heater inside the water tank (5) which generated the heating load. The capacities of this electric heater were 0.5 kW, 1 kW, and 1.5 kW. The water was supplied by a circulation pump to flow from the top of the cooling tower to the bottom part through the packings. Figure 2 shows the packing compaction. The packing compaction was defined as the L and D parameters and was equal to L/D. L was the distance between the first and last rib and D was the distance between two adjacent ribs. Moreover, L/D for the first, second, and third packing types were 6, 8, and 17, respectively. The mass flow rate of air was generated by the radial fan. A psychrometer, copper-constantan thermocouple, and thermo hygrometer were used to measure the dry- and wet-bulb temperatures of air, water temperature, and air humidity, respectively. The digital monitors were used to control the measured data carefully. The water and air mass flow rate were controlled by 2 adjusting valves that were mounted on the water inlet into the cooling tower and outlet air in the compressor. The measured values could be easily controlled through digital monitoring. The applied measurement devices data are used in Table 1.
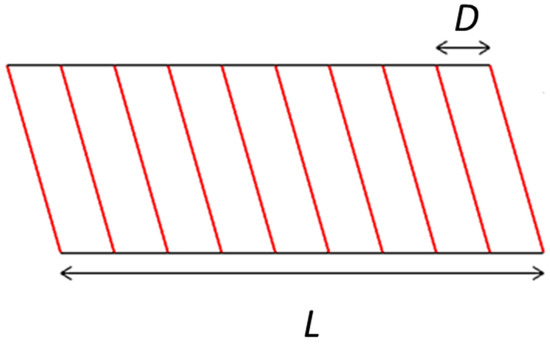
Figure 2.
Schematic packing dimension.

Table 1.
The instruments for measuring the experimental data.
The present research involves three studies. In all three studies, the volume flow rate of air had values between 0.02 kg/s and 0.055 kg/s. Concurrently, the evaluation of the wet cooling tower (WCT) performance was done based on variations in the inlet water temperature, packing types, and mass flow rate of air, respectively. Inlet water temperature was considered to have three temperatures, 35 °C, 42.5 °C, and 50 °C. Also, 3 L/D various packing compaction types, including 6, 8, and 17, were studied as shown in Figure 2. The mass flow rate of water varied between 60 L/h, 80 L/h, and 100 (L/h).
In the first study, the mass flow rate of water and L/D of packing were fixed at 100 L/h and 6 L/h, respectively. In the second study, the inlet water temperature and L/D of packing were adjusted to be 35 °C and 6 L/h, respectively. Finally, the mass flow rate of water and inlet water temperature were kept as 100 L/h and 35 °C in the third study.
3. ANN-PSO Modeling
The science and engineering fields take advantage of neural networks to estimate the complex behavior of systems. A trustable model is provided by these algorithms for nonlinear and complex systems through collecting, training, detecting, and developing using the collection, which includes inputs and outputs. The training process is done to obtain an accurate mesh by changing the weighting coefficients. These coefficients cause the mesh output to reach the actual values. First, a collection of data is preprocessed. Then, these data are split in two parts: Training and experimental data. The training data are used to train the Mesh and also to compute the model accuracy and stability. The applied five-layer neural network is shown in Figure 3.
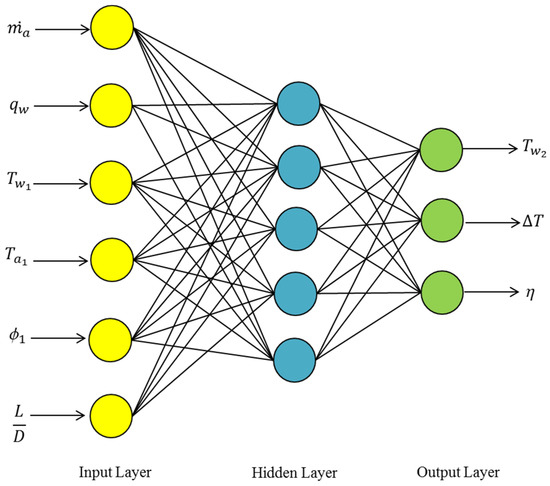
Figure 3.
Five-layer neural network.
The PSO approach was presented by Kendi and Abrahat [32] as an optimization process. This algorithm aims to optimize the nonlinear systems using a genetic algorithm. The particles are randomly distributed with optimized values to meet the convergence goal. The personal best and global best are defined by Kendi and Abrahat [33] as pbest and gbest, respectively. The finest solution obtained by the particles is pbest and the best solution for overall optimization in PSO algorithm is called gbest.
The PSO algorithm includes m particles. The m’th position particle is shown as = {, ,…, }, where is the value of the j’th coordinate in the n dimensional coordinate system. = {, ,…, } is the best observed position for m’th particle, and G = {G1,G2, …, GN} is the best training among all particles in the algorithm.= {, , …, } is the particle velocity, which changes with the instantaneous displacement. The particle position changes based on their velocity in each step. The velocity effects in the previous step on the current velocity is controlled by , which is presented in Equation (1).
where is the function that causes the random numbers to be generated in the range of 0 and 1. are two positive coefficients that cause the particles to accelerate toward the solution field. The maximum number of iterations is set by the user and PSO algorithm is stopped while the number of iterations reach the maximum numbers. The inertial weighting coefficients are varied in each step using Equation (2).
where is the maximum step value in each iteration, is defined as inertial weighting coefficient in each iteration, and and are minimum and maximum inertial weighting coefficients, respectively. In this investigation, the PSO algorithm was applied to train the 5-layer neural network weighting coefficients and attain the most precise model. A new model for analyzing the cooling tower performance was developed using the PSO optimization algorithm and neural network. In this model, there are 6 inputs and 3 outputs. The inputs include air flow rate, water flow rate, inlet water temperature, inlet air temperature, relative humidity of inlet air, and packing compaction, while the outputs consist of outlet water temperature, temperature difference, and efficiency. The following correlations present the temperature difference and efficiency:
and represent water temperature in the inlet and outlet, respectively, and is the wet bulb temperature of inlet air. Moreover, the circulation heat loss in the WTCs was obtained, including a component owing to evaporation and also a parameter related to convection .
They are as follows:
In these correlations, Q is the cooling capacity used for WCT. The air and water mass flow rates are and , respectively. and represent air and water specific heat capacities, respectively.
and are inlet and outlet water temperatures. and refer to the dry-bulb temperature of air in the inlet and outlet, respectively. shows the latent heat of evaporation. and are inlet and exit absolute humidity, respectively.
The ANN-PSO algorithm flowchart is shown in Figure 4. PSO was used to compute the best solution in the neural network. The particle position and velocity varied in each iteration, which led to the weighting coefficients change. These weighting coefficients were used to modify the pbest and gbest values. This process continued in each step to reach the final iteration. The final iteration occurred when the stop condition and the best solution were obtained. The estimated values of network were reported as output results.
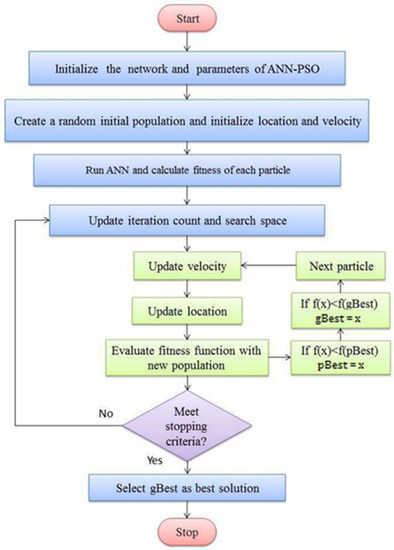
Figure 4.
ANN-PSO algorithm flowchart.
Regression Analysis
The correlation coefficient was used to analyze the model performance and efficiency. This coefficient shows how proportional the experimental values and estimated outputs of the model are. It is defined as [15]:
where is the covariance between a and b that shows the experimental values and estimated outputs and it is defined:
where is the average experimental values and is the average predicted values of model. Besides, n is the number of experimental values or estimated outputs of the model. Similarly, and are auto covariances of the experimental data and estimated outputs of the model. They are presented in the form of:
The correlation coefficient closer to +1 and −1 shows better agreement between experimental data and estimated outputs. The root mean square error is defined as:
4. Results
The experiments were conducted by changing the air flow rate, water flow rate, inlet water temperature, and different packings. The repeatability of the experiments was checked. The data were curved for a wide variety of operating conditions in cooling towers.
4.1. Impacts of Cooling Tower Various Parameters on Efficiency
The dependence of cooling tower efficiency on air flow rate is depicted in Figure 5 for three different inlet water temperatures. In this experiment, the packing compaction and water flow rate were constant with values of 6 and 100 , respectively. The efficiency in the cooling tower increased when the inlet water temperature rose. In addition, by increasing the air flow rate, the efficiency soared.
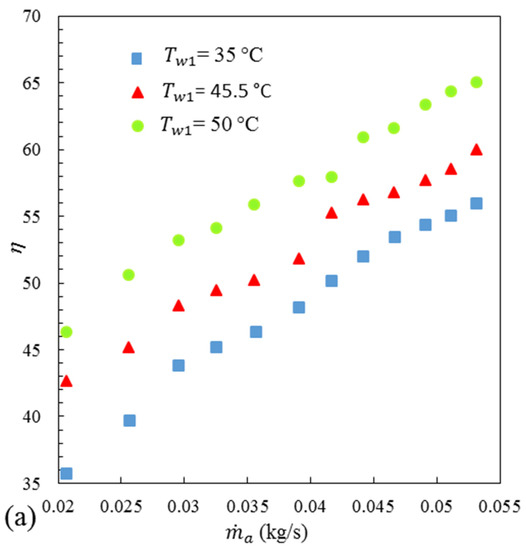
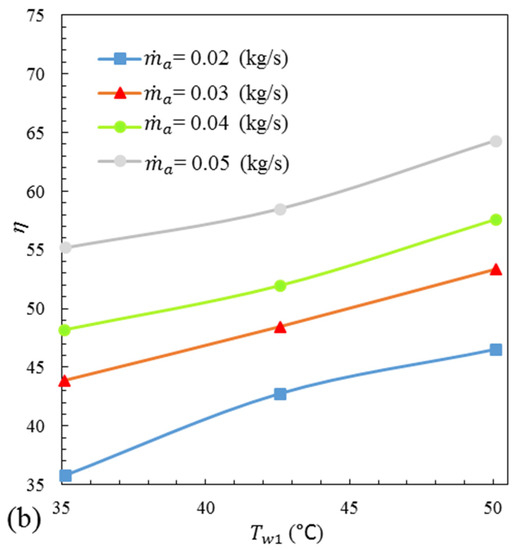
Figure 5.
Cooling tower efficiency based on air flow rate at three different inlet water temperatures: (a) Efficiency versus air mass flow rate; (b) Efficiency versus inlet water temperature.
The dependence of cooling tower efficiency on air flow rate in four disparate water flow rates is demonstrated in Figure 5.
In this experiment, the packing compaction and inlet water temperature were considered constant with values of L/D = 6 and 35 °C, respectively. Figure 6 shows that the efficiency in the cooling tower declined by increasing the water flow rate. By increasing the inlet water flow rate, a greater volume of water was cooled at a certain air flow rate under the same operating conditions, hence the system experienced an efficiency drop.
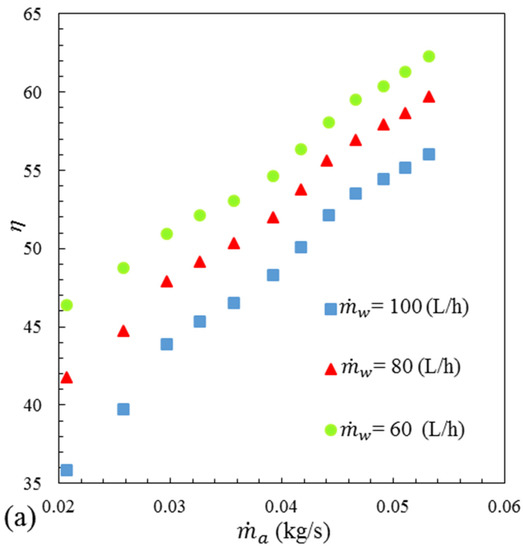
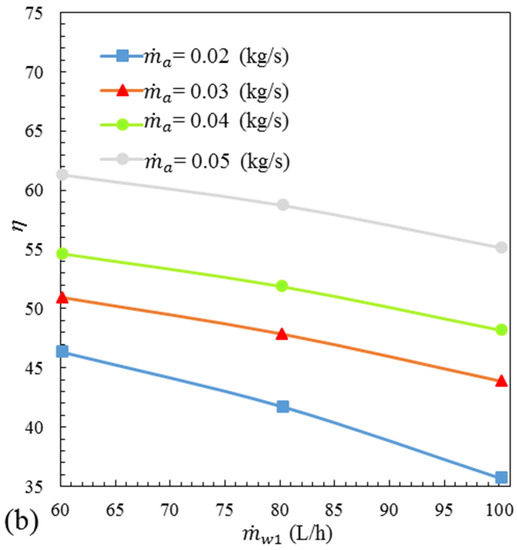
Figure 6.
Cooling tower efficiency based on air flow rate at different water flow rates: (a) Efficiency versus air mass flow rate; (b) Efficiency versus water mass flow rate.
The cooling tower efficiency dependence on air flow rate is shown in Figure 7 with three different packing compactions. In this experiment, the water flow rate and inlet water temperature were invariable and equal to 100 L/h and 35 °C, respectively. By increasing the packing compaction, the cooling tower efficiency increased significantly. By increasing the number of packings, the interface between water and air increased. This increased interface between water and air led to increase in temperature discrepancy between inlet and outlet of tower that caused the system efficiency to increase.
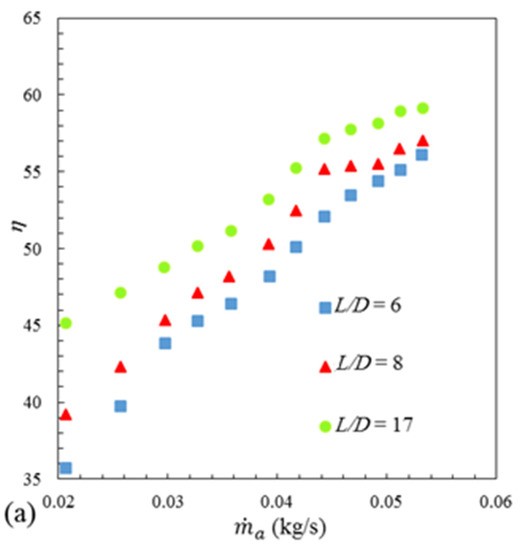
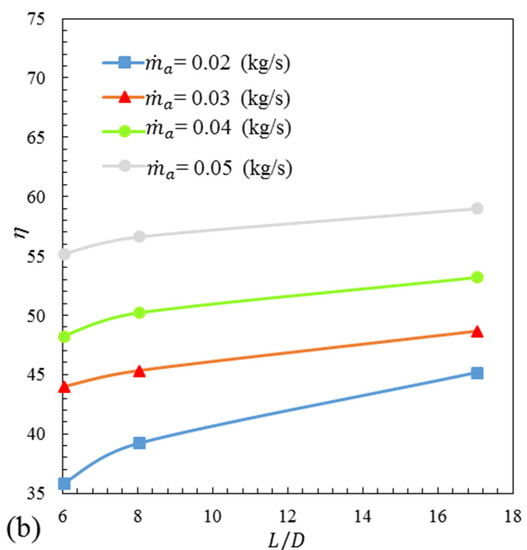
Figure 7.
Cooling tower efficiency based on air flow rate at three different packing compactions: (a) Efficiency versus air mass flow rate; (b) Efficiency versus compaction.
4.2. The Correlations and Optimization
The high-accuracy empirical correlations for investigating the cooling tower performance are presented in this section. The cooling tower efficiency is introduced based on inlet water temperature and air flow rate. The coefficient constants in this model, correlation coefficient and RMSE, are shown in Table 2. Equation (14) shows the cooling tower efficiency based on the inlet water temperature and air flow rate. In Equation (14), the packing compaction and water flow rate are constant with values of 6 and 100 , respectively. Equation (15) is introduced to compute the cooling tower efficiency correlated with the water and air flow rate. In Equation (15), the packing compaction and inlet water temperature are considered constant with values of 6 and 35 °C, respectively.
Table 2.
Constant parameters, correlation coefficient, and RMSE for Equations (10)–(12).
The constant parameters of this correlation, correlation coefficient and RMSE, are presented in Table 2. In addition, Equation (16) is presented to analyze the packing compaction effect and air flow rate. In Equation (16), the water flow rate and inlet water temperature are constant and reach 100 and 35, respectively.
The optimized values of each parameter were detected based on the introduced correlations for calculating the efficiency using Figure 8, Figure 9 and Figure 10. In Figure 8, the cooling tower efficiency is studied under the influence of inlet water temperature and air flow rate using Equation (14). The optimized values of efficiency occurred in the inlet water temperature between 45 °C and 50 °C and in the air flow rate between 0.04 kg/s and 0.05 kg/s. The surface evaporation was increased by increasing the air flow rate. This factor was obvious in efficiency. When the water temperature rose, surface evaporation was accelerated.
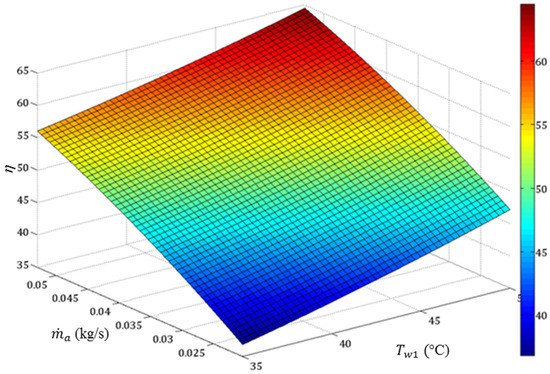
Figure 8.
Cooling tower efficiency based on inlet water temperature and air flow rate.
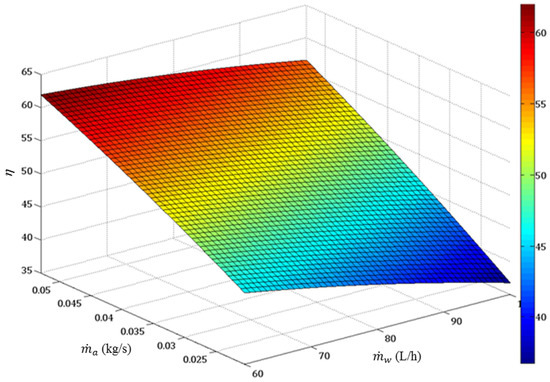
Figure 9.
Cooling tower efficiency based on water and air flow rate.
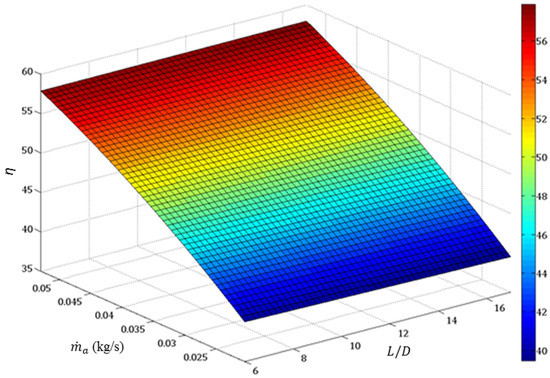
Figure 10.
Cooling tower efficiency based on packing compaction and air flow rate.
In Figure 9, the impact of water and air flow rate on cooling tower efficiency is investigated using Equation (15). The optimized values of efficiency occurred in the water flow rate between 60 L/h and 70 L/h and in the air flow rate between 0.04 kg/s and 0.05 kg/s.
Figure 10 illustrates the cooling tower efficiency based on packing compaction and air flow rate using Equation (16). The optimum values of packing compaction and air flow rate occurred at the maximum efficiency point. These optimum values occurred in the packing compaction between 14 and 17 and in the air flow rate between 0.04 kg/s and 0.05 kg/s. When the packing compaction was increased, the friction between air and water was enhanced. In order words, turbulence between the two phases was increased and the heat transfer increased.
4.3. ANN-PSO Results
A model with a combination of the PSO optimization algorithm and neural network was used to precisely predict the temperature difference, efficiency, and outlet water temperature, which are dependent on air flow rate, water flow rate, inlet water temperature, inlet air temperature, relative humidity of inlet air, and packing compaction. The experimental data related to three different packing compactions were used to develop this model.
The estimated temperature difference by ANN-PSO is shown in Figure 11 and Figure 12 as a function of experimental data. The predicted temperature discrepancy at the test stage had a value of 0.975 and 0.09 for the correlation coefficient and RMSE, respectively. These values were 0.982 and 0.07 in the training stage. The correlation coefficient and RMSE demonstrate the precise and appropriate prediction of the cooling tower temperature difference.
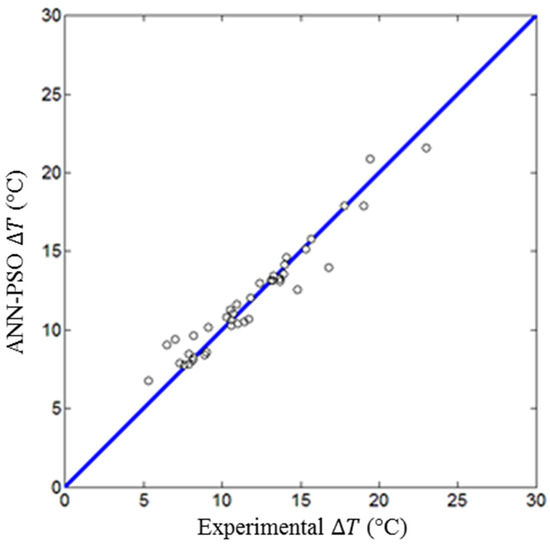
Figure 11.
Estimated temperature difference by ANN-PSO based on experimental data (test stage).
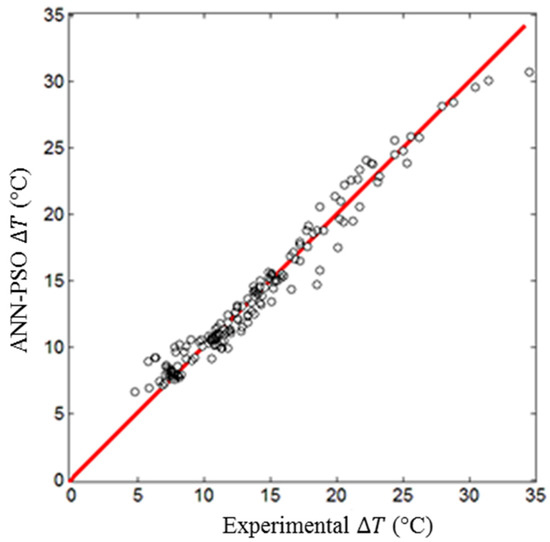
Figure 12.
Estimated temperature difference by ANN-PSO based on experimental data (training stage).
The estimated values of efficiency by ANN-PSO are shown in Figure 13 and Figure 14 as a function of the experimental data. The developed neural network at the test stage caused the correlation coefficient and RMSE to be 0.966 and 0.11, respectively. The correlation coefficient and RMSE had values of 0.972 and 0.09, respectively, in the training stage. These values were obtained by a precise prediction of the efficiency.
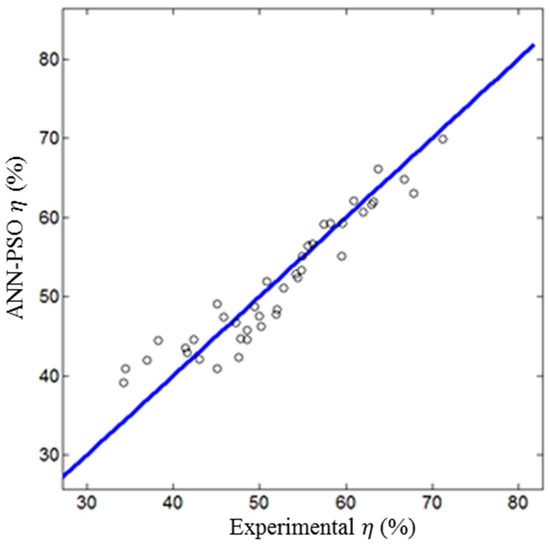
Figure 13.
Estimated efficiency by ANN-PSO based on experimental data (test stage).
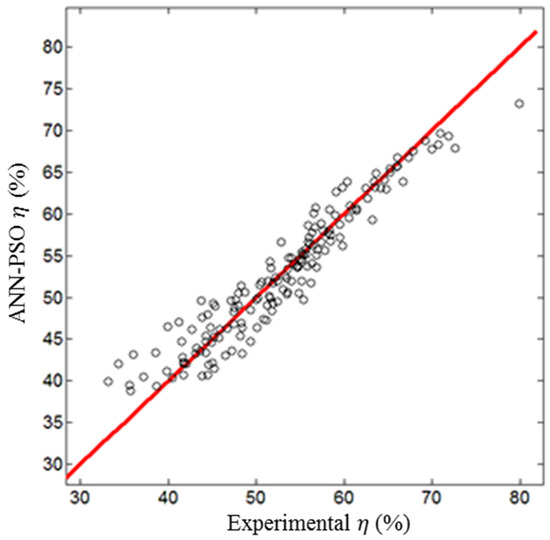
Figure 14.
Estimated efficiency by ANN-PSO based on experimental data (training stage).
The estimated outlet water temperatures by ANN-PSO are shown in Figure 15 and Figure 16 as functions of the experimental data. The ANN-PSO results at the test stage had a value of 0.969 and 0.12 for the correlation coefficient and RMSE, respectively. These values were 0.964 and 0.13 at the training stage. The results reveal the precise and powerful prediction for three output parameters of the ANN-PSO model in a wide variety of operating conditions.
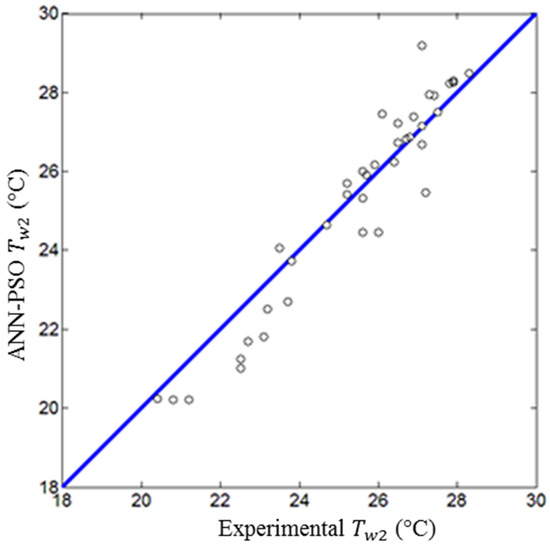
Figure 15.
Estimated outlet water temperature by ANN-PSO based on experimental data (test stage).
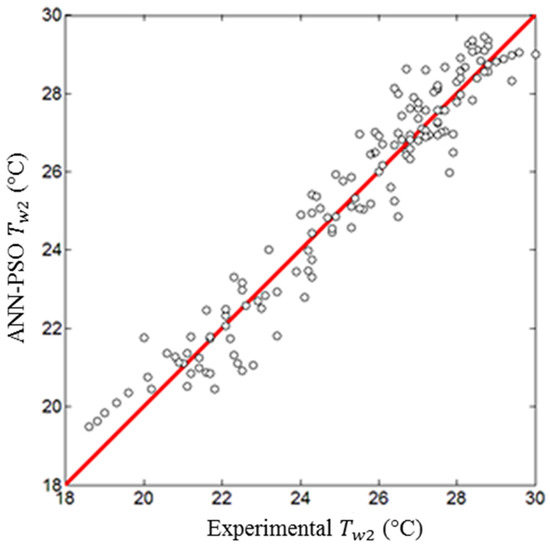
Figure 16.
Estimated outlet water temperature by ANN-PSO based on experimental data (training stage).
5. Conclusions
The combination of the PSO optimization algorithm and neural network was used to analyze the performance of the cooling tower using the model which included six inputs and three outputs. The number of nodes in the inlet, hidden layers, and output layers were six, five, and three, respectively. The packing compaction was used to estimate the cooling tower performance as an input parameter. The correlation coefficient and RMSE were used as parameters to investigate the ANN-PSO performance and applicability. The measured values of correlation coefficient and RMSE in this model showed that the ANN-PSO outputs were in appropriate agreement with the experimental data. The effects of different parameters such as air flow rate, water flow rate, inlet water temperature, and packing compaction on cooling tower efficiency were studied. The efficiency of the cooling tower increased by increasing the air flow rate, inlet water temperature, and packing compaction. In addition, the cooling tower efficiency decreased by raising the water flow rate. The efficiency increased by raising the inlet water temperature and decreasing inlet air temperature. The optimal performance in this cooling tower occurred when the range of air flow rate, water flow rate, and packing compaction was between 0.04 and 0. 05, between 60 and 70, and between 14 and 17, respectively.
Author Contributions
Conceptualization, H.A., M.S., P.S., F.M.K., M.A. and B.G.; methodology, H.A., R.L., K.R.; software, H.A., P.S., F.M.K.; validation, H.A., R.L.; formal analysis, H.A., P.S.; investigation, H.A., M.S., P.S., F.M.K., M.A. and Behzad Ghasemi; resources, M.S.; data curation, H.A.; writing—original draft preparation, H.A., P.S., F.M.K.; writing—review and editing, M.S., R.L., K.R., M.A. and B.G.; visualization, F.M.K.; supervision, M.S.; project administration, M.S.; funding acquisition, K.R. All authors have read and agreed to the published version of the manuscript.
Funding
This research received no external funding.
Conflicts of Interest
The authors declare no conflict of interest.
References
- Goshayshi, H.; Missenden, J. The investigation of cooling tower packing in various arrangements. Appl. Therm. Eng. 2000, 20, 69–80. [Google Scholar] [CrossRef]
- Hasan, A.; Sirén, K. Theoretical and computational analysis of closed wet cooling towers and its applications in cooling of buildings. Energy Build. 2002, 34, 477–486. [Google Scholar] [CrossRef]
- Kloppers, J.C.; Kröger, D.G. The Lewis factor and its influence on the performance prediction of wet-cooling towers. Int. J. Therm. Sci. 2005, 44, 879–884. [Google Scholar] [CrossRef]
- Lemouari, M.; Boumaza, M.; Mujtaba, I.M. Thermal performances investigation of a wet cooling tower. Appl. Therm. Eng. 2007, 27, 902–909. [Google Scholar] [CrossRef]
- Emouari, M.; Boumaza, M.; Kaabi, A. Experimental analysis of heat and mass transfer phenomena in a direct contact evaporative cooling tower. Energy Convers. Manag. 2009, 50, 1610–1617. [Google Scholar] [CrossRef]
- Yoo, S.-Y.; Kim, J.-H.; Han, K.-H. Thermal performance analysis of heat exchanger for closed wet cooling tower using heat and mass transfer analogy. J. Mech. Sci. Technol. 2010, 24, 893–898. [Google Scholar] [CrossRef]
- Heyns, J.; Kröger, D. Experimental investigation into the thermal-flow performance characteristics of an evaporative cooler. Appl. Therm. Eng. 2010, 30, 492–498. [Google Scholar] [CrossRef]
- Braun, J.E.; Klein, S.A.; Mitchell, J.W. Effictiveness models for cooling towers and cooling coils. In ASHRAE Transactions (American Society of Heating, Refrigerating and Air-Conditioning Engineers); 95.CONF-890609; U.S. Department of Energy, Office of Scientific and Technical Information: Washington, DC, USA, 1989. [Google Scholar]
- Fisenko, S.; Brin, A.; Petruchik, A. Evaporative cooling of water in a mechanical draft cooling tower. Int. J. Heat Mass Transf. 2004, 47, 165–177. [Google Scholar] [CrossRef]
- Naphon, P. Study on the heat transfer characteristics of an evaporative cooling tower. Int. Commun. Heat Mass Transf. 2005, 32, 1066–1074. [Google Scholar] [CrossRef]
- Swider, D.J. A comparison of empirically based steady-state models for vapor-compression liquid chillers. Appl. Therm. Eng. 2003, 23, 539–556. [Google Scholar] [CrossRef]
- Ertunc, H.; Hosoz, M. Artificial neural network analysis of a refrigeration system with an evaporative condenser. Appl. Therm. Eng. 2006, 26, 627–635. [Google Scholar] [CrossRef]
- Islamoglu, Y. A new approach for the prediction of the heat transfer rate of the wire-on-tube type heat exchanger—Use of an artificial neural network model. Appl. Therm. Eng. 2003, 23, 243–249. [Google Scholar] [CrossRef]
- Alimoradi, H.; Shams, M. Optimization of subcooled flow boiling in a vertical pipe by using artificial neural network and multi objective genetic algorithm. Appl. Therm. Eng. 2017, 111, 1039–1051. [Google Scholar] [CrossRef]
- Hosoz, M.; Ertunc, H.; Bulgurcu, H. Performance prediction of a cooling tower using artificial neural network. Energy Convers. Manag. 2007, 48, 1349–1359. [Google Scholar] [CrossRef]
- Huang, W.S.; Chen, C.W.; Lee, C.W.; Chen, C.L.; Jan, T.S.; Chang, Y.C.; Chang, T.W. Application of Artificial Neural Network for Modeling of Mechanical Cooling Tower. Adv. Mater. Res. 2011, 383, 7746–7749. [Google Scholar] [CrossRef]
- Gao, M.; Sun, F.-Z.; Zhou, S.-J.; Shi, Y.-T.; Zhao, Y.-B.; Wang, N.-H. Performance prediction of wet cooling tower using artificial neural network under cross-wind conditions. Int. J. Therm. Sci. 2009, 48, 583–589. [Google Scholar] [CrossRef]
- Gao, M.; Shi, Y.-T.; Wang, N.-N.; Zhao, Y.-B.; Sun, F.-Z. Artificial neural network model research on effects of cross-wind to performance parameters of wet cooling tower based on level Froude number. Appl. Therm. Eng. 2013, 51, 1226–1234. [Google Scholar] [CrossRef]
- Singh, K.; Das, R. An experimental and multi-objective optimization study of a forced draft cooling tower with different fills. Energy Convers. Manag. 2016, 111, 417–430. [Google Scholar] [CrossRef]
- Zheng, W.-Y.; Zhu, D.-S.; Song, J.; Zeng, L.-D.; Zhou, H.-J. Experimental and computational analysis of thermal performance of the oval tube closed wet cooling tower. Appl. Therm. Eng. 2012, 35, 233–239. [Google Scholar] [CrossRef]
- Lavasani, A.M.; Baboli, Z.N.; Zamanizadeh, M.; Zareh, M. Experimental study on the thermal performance of mechanical cooling tower with rotational splash type packing. Energy Convers. Manag. 2014, 87, 530–538. [Google Scholar] [CrossRef]
- Shahali, P.; Rahmati, M.; Alavi, S.R.; Sedaghat, A. Experimental study on improving operating conditions of wet cooling towers using various rib numbers of packing. Int. J. Refrig. 2016, 65, 80–91. [Google Scholar] [CrossRef]
- Lu, Y.; Guan, Z.; Gurgenci, H.; Hooman, K.; He, S.; Bharathan, D. Experimental study of crosswind effects on the performance of small cylindrical natural draft dry cooling towers. Energy Convers. Manag. 2015, 91, 238–248. [Google Scholar] [CrossRef]
- Zhao, Y.; Sun, F.; Long, G.; Huang, X.; Huang, W.; Lyv, D. Comparative study on the cooling characteristics of high level water collecting natural draft wet cooling tower and the usual cooling tower. Energy Convers. Manag. 2016, 116, 150–164. [Google Scholar] [CrossRef]
- Singla, R.K.; Singh, K.; Das, R. Tower characteristics correlation and parameter retrieval in wet-cooling tower with expanded wire mesh packing. Appl. Therm. Eng. 2016, 96, 240–249. [Google Scholar] [CrossRef]
- Dehghani-Sanij, A.; Soltani, M.; Raahemifar, K. A new design of wind tower for passive ventilation in buildings to reduce energy consumption in windy regions. Renew. Sustain. Energy Rev. 2015, 42, 182–195. [Google Scholar] [CrossRef]
- Soltani, M.; Dehghani-Sanij, A.; Sayadnia, A.; Kashkooli, F.M.; Gharali, K.; Mahbaz, S.; Dusseault, M.B. Investigation of Airflow Patterns in a New Design of Wind Tower with a Wetted Surface. Energies 2018, 11, 1100. [Google Scholar] [CrossRef]
- Mehryan, S.A.M.; Kashkooli, F.M.; Soltani, M. Comprehensive study of the impacts of surrounding structures on the aero-dynamic performance and flow characteristics of an outdoor unit of split-type air conditioner. Build. Simul. 2017, 11, 325–337. [Google Scholar] [CrossRef]
- Imani-Mofrad, P.; Heris, S.Z.; Shanebedi, M. Experimental investigation of the effect of different nanofluids on the thermal performance of a wet cooling tower using a new method for equalization of ambient conditions. Energy Convers. Manag. 2018, 158, 23–35. [Google Scholar] [CrossRef]
- Gilani, N.; Hendijani, A.D.; Shirmohammadi, R. Developing of a novel water-efficient configuration for shower cooling tower integrated with the liquid desiccant cooling system. Appl. Therm. Eng. 2019, 154, 180–195. [Google Scholar] [CrossRef]
- Chen, X.; Sun, F.; Chen, Y.; Gao, M. Novel method for improving the cooling performance of natural draft wet cooling towers. Appl. Therm. Eng. 2019, 147, 562–570. [Google Scholar] [CrossRef]
- Russell, E.; Kennedy, J. A new optimizer using particle swarm theory. In Proceedings of the MHS’95, Sixth International Symposium on Micro Machine and Human Science, Nagoya, Japan, 4–6 October 1995. [Google Scholar]
- Kennedy, J.; Eberhart, R. Particle swarm optimization. In Proceedings of the IEEE International Conference on Neural Networks, Honolulu, HI, USA, 12–17 May 2002; Volume 4, pp. 1942–1948. [Google Scholar]
Publisher’s Note: MDPI stays neutral with regard to jurisdictional claims in published maps and institutional affiliations. |
© 2020 by the authors. Licensee MDPI, Basel, Switzerland. This article is an open access article distributed under the terms and conditions of the Creative Commons Attribution (CC BY) license (http://creativecommons.org/licenses/by/4.0/).