Article

Analysis of Influence Factors for Heat Generation Minimization of DC-Link Capacitor

1
Department of Mechanics Engineering, Kongju National University, Cheonan-daero, Seobuk-gu, Cheonan-si 31080, Korea
2
Industrial Technology Research Institute, Kongju National University, Cheonan-daero, Seobuk-gu, Cheonan-si 31080, Korea
3
Department of Future Convergence Engineering, Industrial Technology Research Institute, Kongju National University, Cheonan-daero, Seobuk-gu, Cheonan-si 31080, Korea
*
Authors to whom correspondence should be addressed.
Energies 2021, 14(1), 114; https://doi.org/10.3390/en14010114
Submission received: 7 November 2020 / Revised: 23 December 2020 / Accepted: 24 December 2020 / Published: 28 December 2020

Abstract

:
With the rapid development of ecofriendly cars, various inverters are also being developed depending on the performance of motors. The DC-link capacitor is used as an inverter component; however, there are several limitations on its size, such as the requirement for wide films. Film width is a major factor that affects the capacitor’s equivalent series resistance (ESR) and is closely related to heat generation. When the temperature of the capacitor increases, the dielectric breakdown due to high voltage causes a reduction in capacitance, which leads to a decrease in inverter power and causes vehicle defects; this needs to be addressed to minimize the heat of the capacitor. Recently, genetic films that can be used at high temperatures have been developed. However, producing such films is difficult because of their 5 µm thickness; thus, the size increases when they are designed and they consequently cannot be used in practical applications. Based on a film width of 50 mm, this study analyzed the factors that can reduce ESR, set the level for each factor, and conducted experiments using the Box–Behnken design. The variables (thermal conductivity, film thickness, and capacitance) were set to three levels for each factor, and the ESR, thermal flux, and temperature characteristics were analyzed through finite element analysis. Based on the temperature results, optimized conditions for film thickness of 3.15 μm, capacitance of 390 μF, and thermal conductivity epoxy of 4.5 W/m·K were derived using Minitab, and samples were made for verification tests. A capacitor was installed in the chamber and was saturated for 2 h at 85 °C and current of 50 A rms was applied at 16 kHz frequency. The K Type sensor attached to the film surface was connected to a temperature recorder to measure the temperature change in the film over time after applying the current. The experimental results confirmed that the temperature of the genetic film with a 50 mm film width was similar to that with a 35 mm film width, and this confirmed that the set factors were similar to that of the genetic film with 35 mm film width. It was confirmed that increased film width can reduce ESR and minimize heat generation.

1. Introduction

Air pollution and global warming caused by the use of fossil fuels are becoming progressively more serious, and car exhaust emissions are affecting the air quality significantly. Regulations on the carbon dioxide emissions of internal combustion engines are being strengthened to reduce air pollution. All countries have started to regulate the production and importation of internal combustion engine vehicles, especially in Europe. Many European countries are making mid- to long-term plans to increase the supply of electric vehicles and to ban the sale of all internal combustion engines. As a result, increasingly more ecofriendly cars are being produced and distributed and the battery charging system industry for electric vehicles is rapidly being developed. As regards ecofriendly cars, there are hybrid electric vehicles (HEVs), plug-in hybrid electric vehicles (PHEVs), electric vehicles (EVs), and fuel cell electric vehicles (FCEVs). Ecofriendly cars have an inverter system for transmitting battery power to motors and capacitors are important components for a constant supply of electricity [1,2,3,4].
A DC-link capacitor is an inverter component that stabilizes the power by rectifying the high-frequency ripple current generated at the inverter. The core material of the capacitor is a dielectric material. The capacitor heat up by dielectric loss. In particular, the equivalent series resistance (ESR) of the electrical characteristics is a major factor related to heat generation [5]. It is important to lower the ESR as much as possible to increase the lifetime of the capacitor. The factor that most significantly affects the ESR of the capacitor is the film width. An increase in film width causes an increase in ESR and heating temperature. Moreover, the dielectric breakdown caused by voltage reduces the capacitance, which leads to lower output of the inverter [6,7,8]. While it is important to use the smallest possible film width, the size restraint inevitably causes an increase in the film width, and the resulting heat becomes a problem. The type of capacitor used in a power conversion inverter comprises a film and an electrolyte; typically, it uses a film with excellent electrical characteristics depending on the changes in temperature and frequency [9,10,11,12].
Some of the film capacitors being studied utilize polyetherimide (PEI) films (high-temperature ultra-thin polymer films) that can be used at a high temperature. Most dielectric films need to maintain their performance at temperatures of 105 °C and higher. While the maximum permittivity temperature is 100 °C for polypropylene and 125 °C for polyester (PET), it is 160 °C for polyphenylene sulfide (PPS) and PEI. This is because they are considered as high-temperature dielectric materials that can maintain their permittivity between 160 and 200 °C, respectively [13,14,15,16,17,18,19]. However, self-healing is the most important function of a dielectric material; this involves removing the metal layer deposited when the dielectric material is damaged by temperature and voltage [20,21]. PPS is not used as a capacitor material as its self-healing function is poor and it does not remove any metal deposition layer, which might lead to a fire accident [22,23,24,25]. Moreover, the application of a PEI film in the capacitance design is difficult as the film thickness is 5 µm [
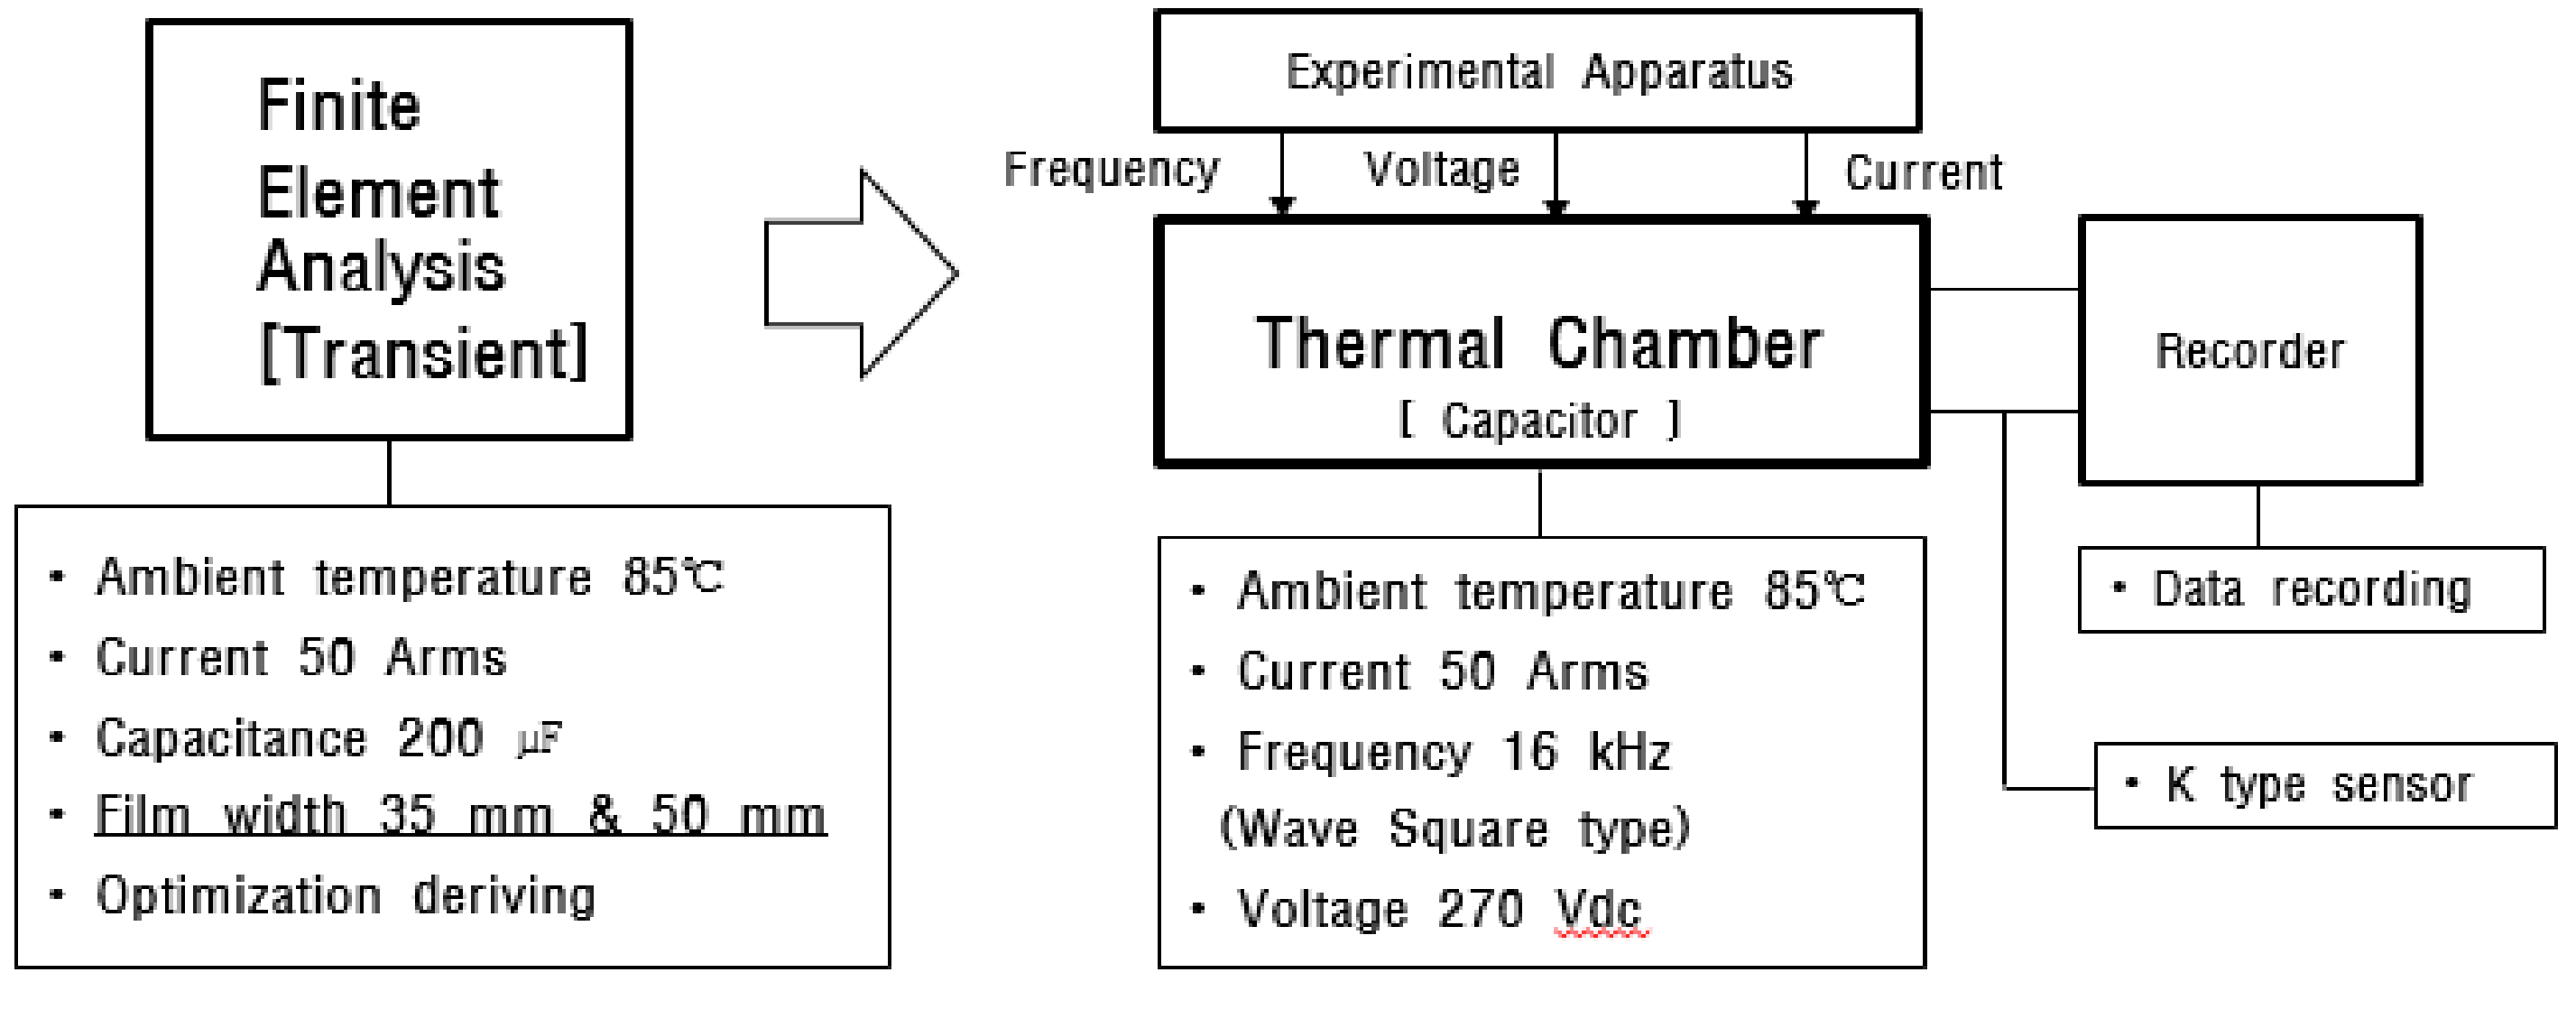
15]. Therefore, factor analysis is necessary to minimize the heat generation in extended use polypropylene film. In this study, several factors were analyzed to minimize the ESR and heat resulting from increased film width, and the performance of each factor was confirmed experimentally. For the analysis of the heat minimization factors of the capacitor, the film width was set at 50 mm, and the experimental plan was established based on the Box–Behnken method for the response surface analysis methodology. Film thickness, capacitance, and epoxy with thermal conductivity were used as variables, all varied to three different levels. The △t (°C), ESR (mΩ), and heat transfer rate ( Q · ) results were derived as a function of the variables through finite element analysis (FEA). The temperature on the graph is the maximum temperature of the capacitor and △t is the difference between the maximum temperature and the saturation temperature. ESR can be used to calculate the resistance of a heating element through numerical analysis and to determine the heating value. In addition, the total heating value (W) was analyzed in terms of heat transfer rate, and heat resistance was used to analyze the differences in temperature with the varying levels of thermal conductivity of epoxy. After finite element analysis, the optimized design conditions for film width and film thickness to satisfy the temperature requirements were derived, which were then verified experimentally by producing physical samples. The experimental results showed an accuracy of approximately 99.07%, and the conditions for minimizing heat generation of the capacitor were determined based on the film thickness and capacitance set as variables.

2. Finite Element Analytical Model Settings

2.1. Variable Settings

Equation (1) is the formula for determining the ESR of the capacitor. tan δ denotes the total loss of the capacitor module elements, including dielectric loss, loss of copper conductor, loss of metal-sprayed zinc on the side of the film, and loss of Pb-free.
ESR   =   ( tan δ / 2 π f C )
where π represents the circumference rate, f represents the frequency, and C represents the capacitance.
Based on ESR from Equation (1), the heating value can be calculated using Equation (2):
P ( W )   = I 2   ×   ESR ( Ω )
The dielectric flux density, D, in Equation (3) refers to the amount of charge passing through the cross section of the dielectric material, which is inversely proportional to the square root of the charge distance ( r 2 ) and proportional to the charge, Q.
D   =   Q / ( 4 π r 2 )
The internal heating temperature of the capacitor is affected by the convection coefficient and is dictated by Newton’s law of cooling. The heat transfer rate, Q · is proportional to the convection heat transfer coefficient, h; external area of the object, A s ; and the temperature difference, △T, as expressed in Equation (4). Moreover, as internal heating occurs due to Joule heating in a film capacitor, Fourier’s law of conduction is applied and can be expressed as shown in Equation (5), where K is the thermal conductivity coefficient and x is the thickness.
Q · conv   =   h A s T surface     T surround
Q · cond   =   KA   ( T inner   temp     T out   temp ) / x
Therefore, the total heat transfer rate of the capacitor can be defined using Equation (6) and is expressed in Equation (7).
Q · total   =   Q · convection   +   Q · conduction
Q · total   =   [ h A s   T ] + [ KA T x ]
Numerical analysis can also be performed using the thermal resistance formulas in Equations (8) and (9):
Q ·   =   [ T maxtemp     T ambient ] / R total
R total   =   [ 1 / ( h × A s ) ]   +   [ L / K A s ]
where T maxtemp is the maximum temperature, T ambient is the ambient temperature, R total is the total resistance, and L is the thickness of the case that is heat-conducting.

2.2. Analysis Method

2.2.1. Box–Behnken Experimental Design

Experimental design is a powerful statistical tool that helps to reduce the process variability and the number of required resources (time, reagents, and experimental work). Conversely, the response surface methodology (RSM) facilitates the solving of multivariable equations and evaluates the relative significance of several affecting factors even in the presence of complex interaction [26]. In this study, finite element analysis was performed by using the factors that affect heat generation as design variables—including film thickness, capacity, and epoxy—and by establishing an experimental design based on the Box–Behnken method.
As the heating value increases with the increase in ESR when the film width is greater than 35 mm, the purpose of the analysis was to analyze the factors at each specified level and obtain temperature results similar to that obtained when the film width is set as 35 mm. To achieve this, the film width was set at 50 mm, and the levels were specified for each factor. Film thicknesses of 2.8 μm, 3.15 μm, and 3.5 μm were selected to improve the current density, and capacitance was set based on the section area when 200 µF was designed with the film width of 35 mm and film thickness of 3.15 µm. Subsequently, the capacitance was calculated to be 350 µF at 3.15 μm, 390 µF at 2.8 μm, and 250 µF at 3.5 μm, and each level was set as an analysis factor. Epoxy products with enhanced thermal conductivity were used, including the mass-produced product with thermal conductivity of 0.6 W/m·K and the newly developed products with thermal conductivities of 2.55 and 4.5 W/m·K. The variable levels determined using finite element analysis are listed in Table 1.
Figure 1 shows a schematic of the overall experimental method to confirm the feasibility of the analysis conditions and model. Based on the experimental method, the heating characteristics with various design variables were analyzed, the conditions to minimize heat generation were determined, and samples were produced and compared to verify the feasibility of the analysis results and model.

2.2.2. Analysis Conditions

Numerical analysis modeling was performed based on the Box–Behnken design. Polypropylene film, zinc primary conductor, copper secondary conductor, a polycarbonate case for module assembly, and hard-type epoxy were used. The module was designed such that the film and copper would be approximately 2 mm apart and the case and film would be 2.5 mm apart. The ANSYS analysis tool was used, and transient thermal analysis was conducted to identify the changes in temperature over time. A hex-dominant (quadrilateral/triangle) mesh with a size of 2 mm was used. The thermal properties of each element were set as listed in Table 2; the ambient temperature of 85 °C and convection coefficient of 6.29 W/m2·K calculated using Newton’s law of cooling and Fourier’s law of conduction were set up. The time set for the analysis was 3 h, and a current of 50 Arms was applied for the finite element analysis.

3. Analysis

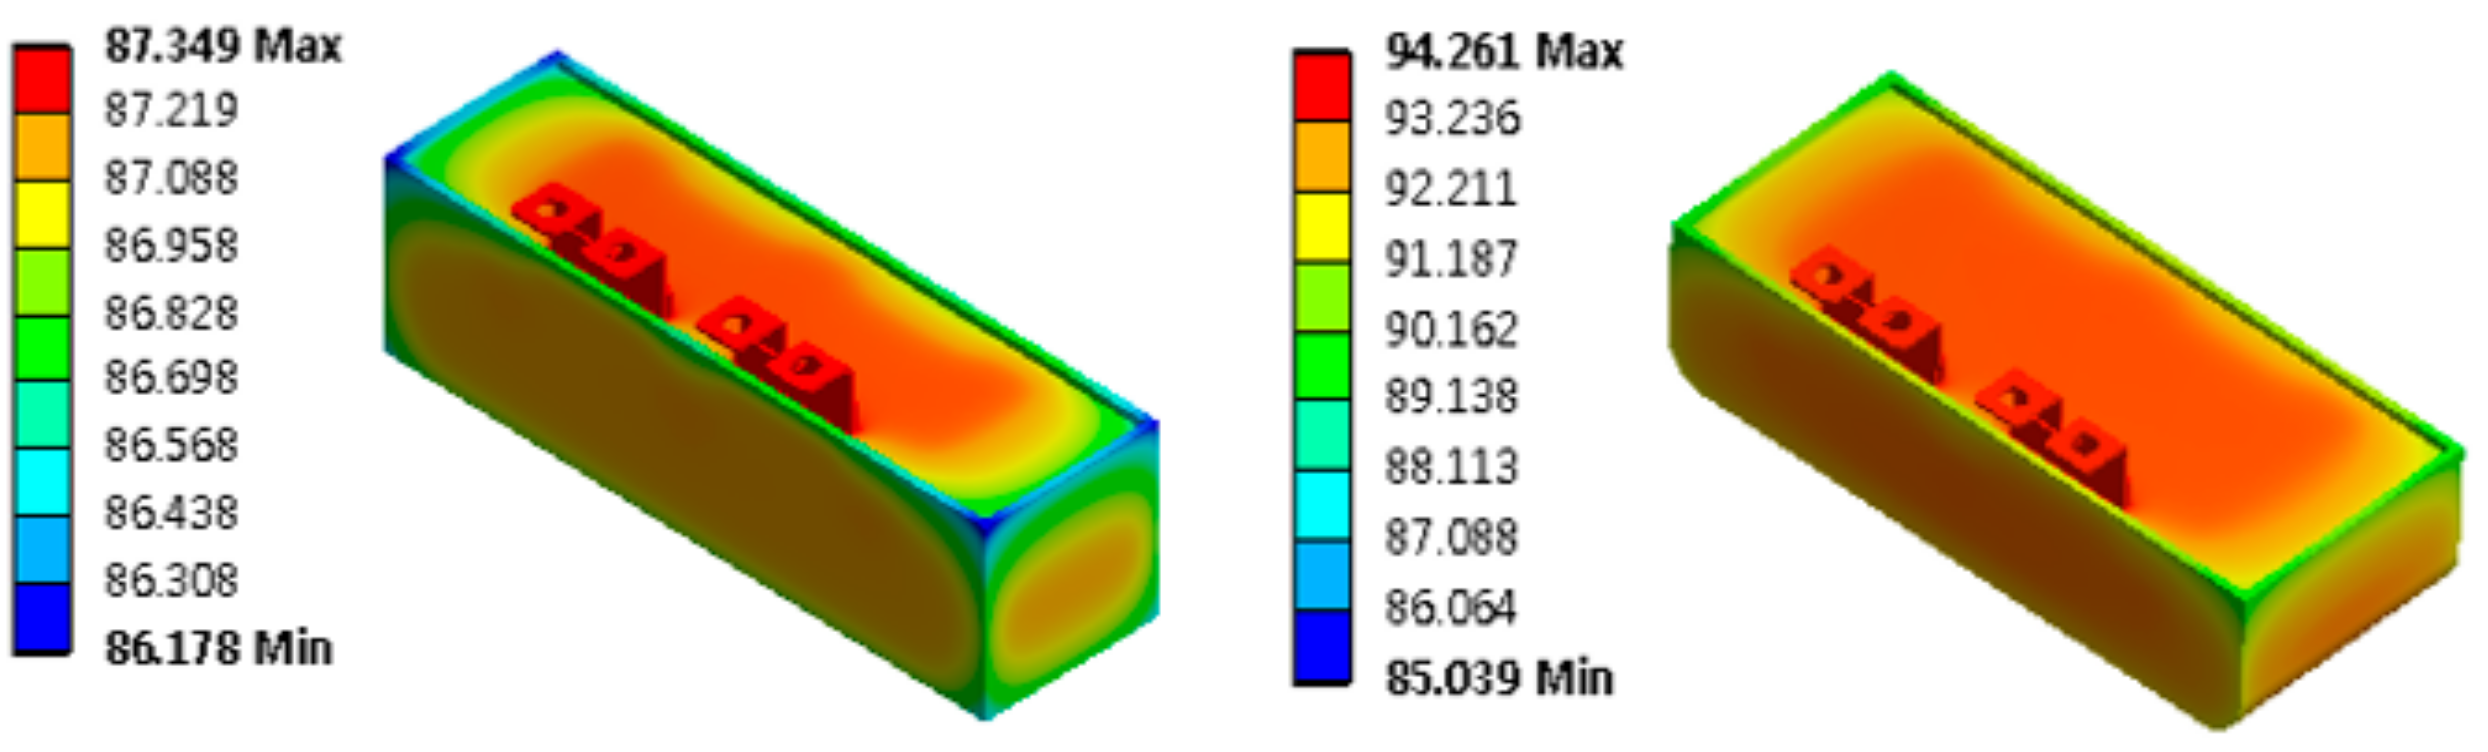
Figure 2 compares the temperature results for film widths of 35 mm and 50 mm to identify the specifications to minimize heat generation with increasing film width. As shown in Table 3, the thermal properties with 50 mm film width were found to be high when the analysis was performed with film thickness of 3.15 µm and capacitance of 200 µF. In particular, △T for the 50 mm film width was approximately four times higher than that for the 35 mm film width, ESR for the 50 mm film width was approximately 2.1 times higher than that for the 35 mm film width, and Q · for the 50 mm film width was approximately 3.95 times higher than that for the 35 mm film width. The increase in ESR with larger film width increased both the thermal and electrical properties. As such, factor analysis was necessary to minimize heat generation with increased film width, and the conditions that would result in temperature properties similar to that of the 35 mm film width shown in Table 3 were explored in the study.
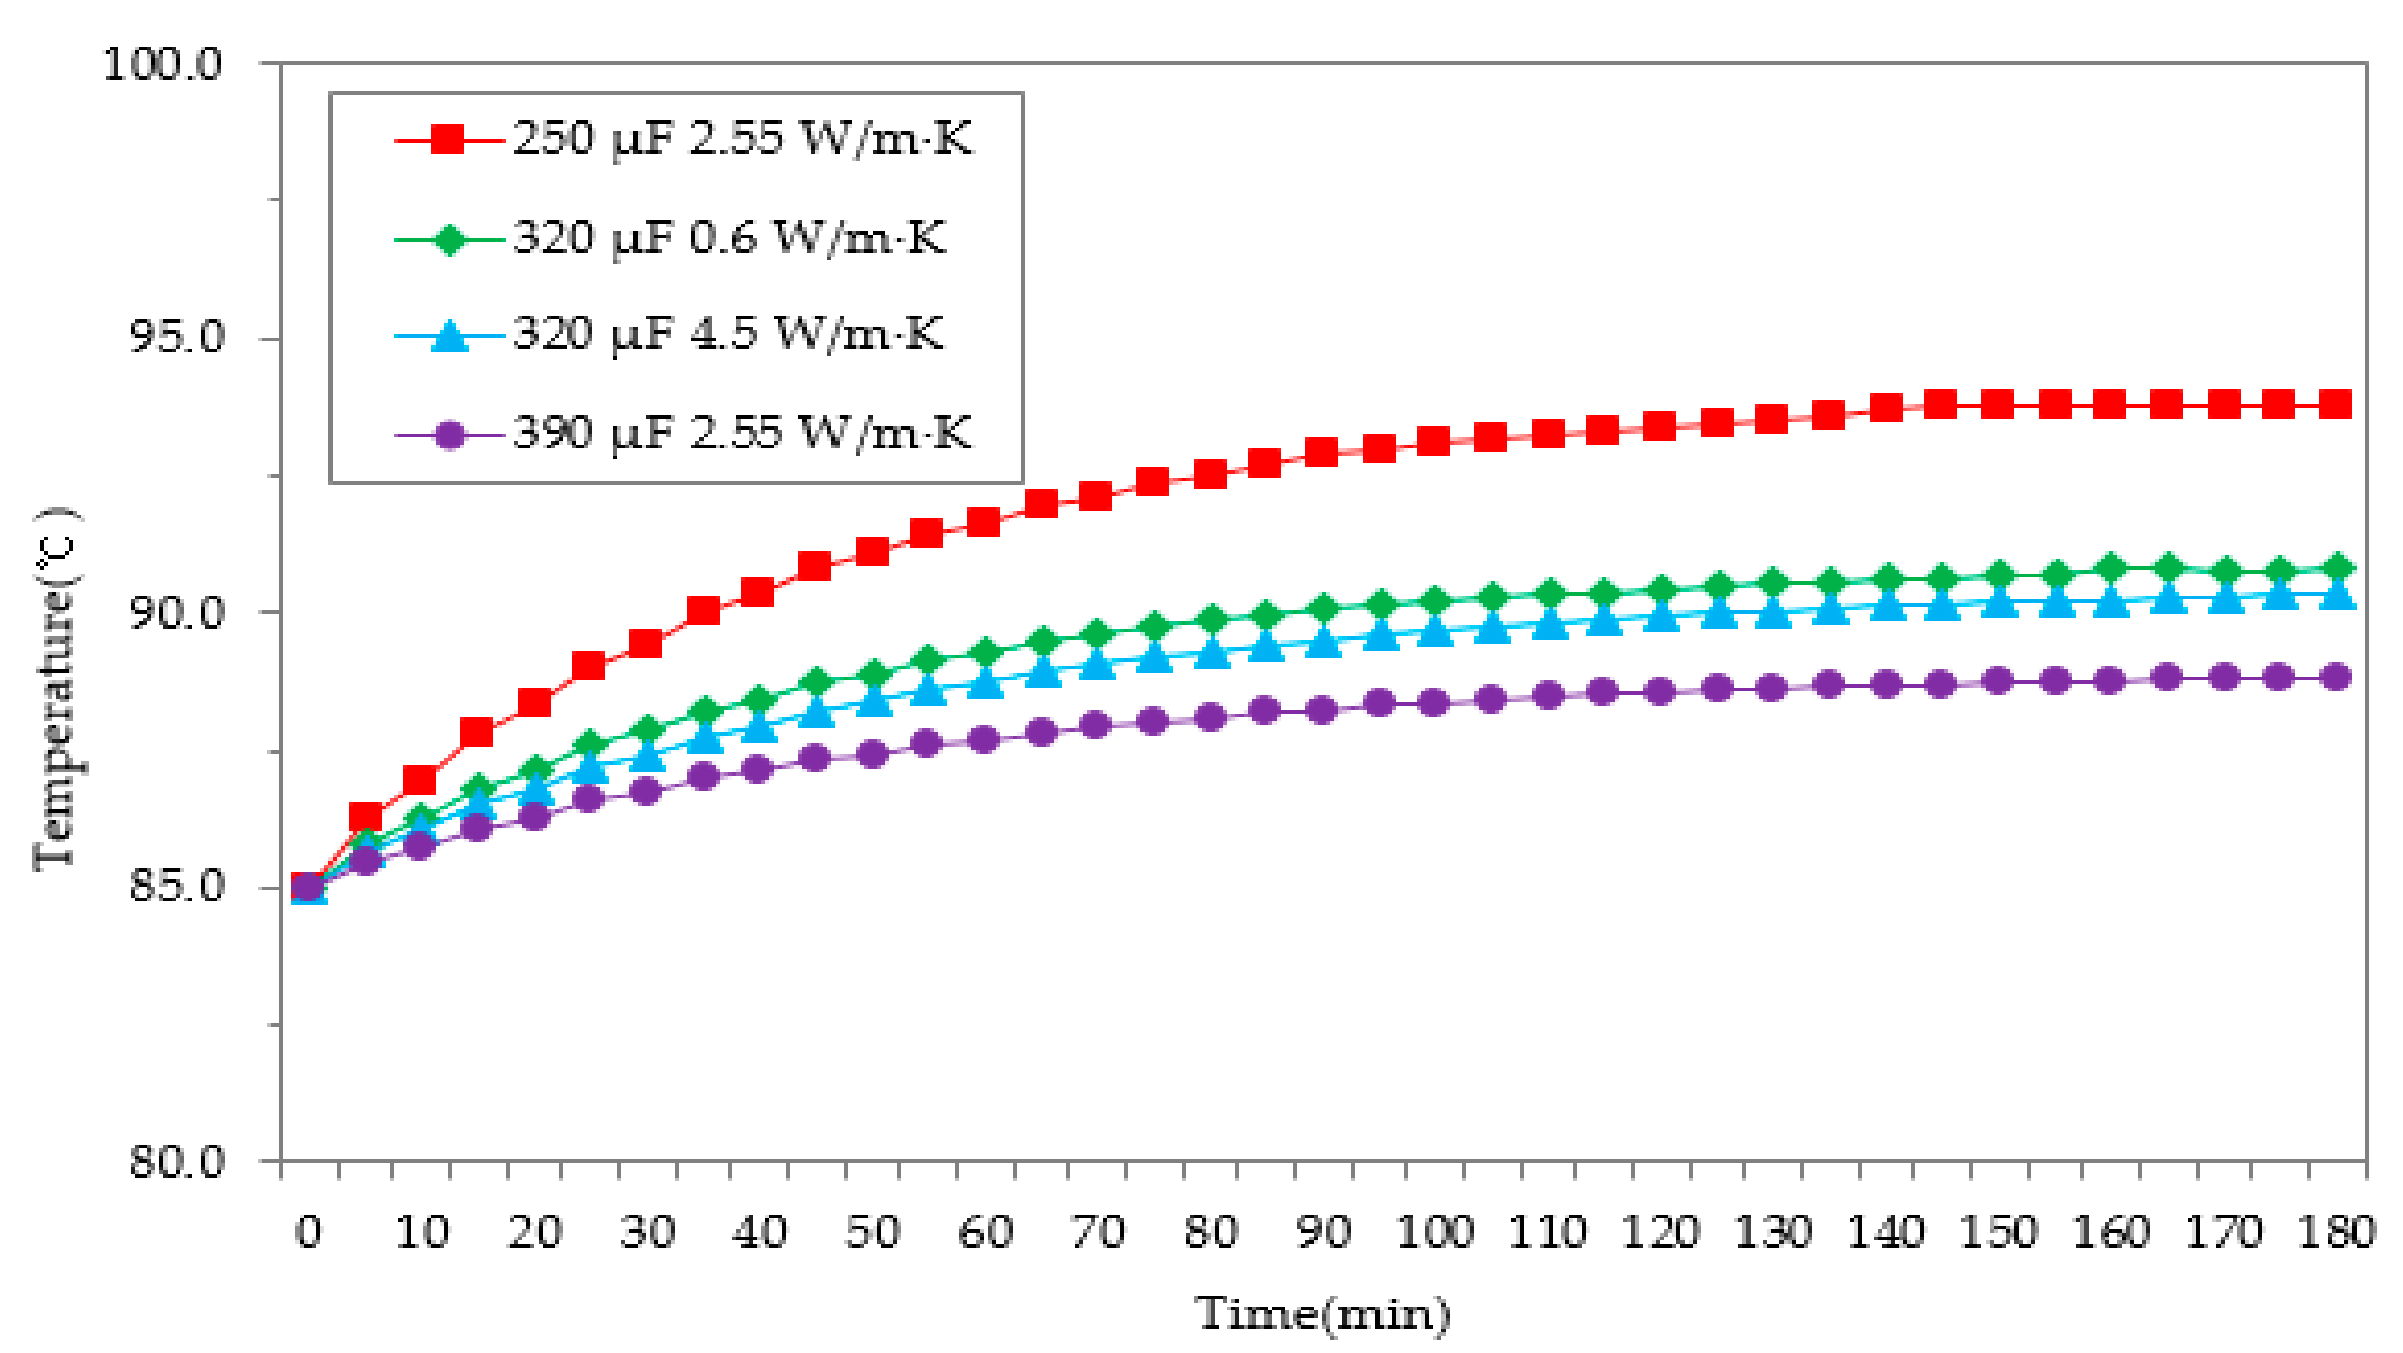
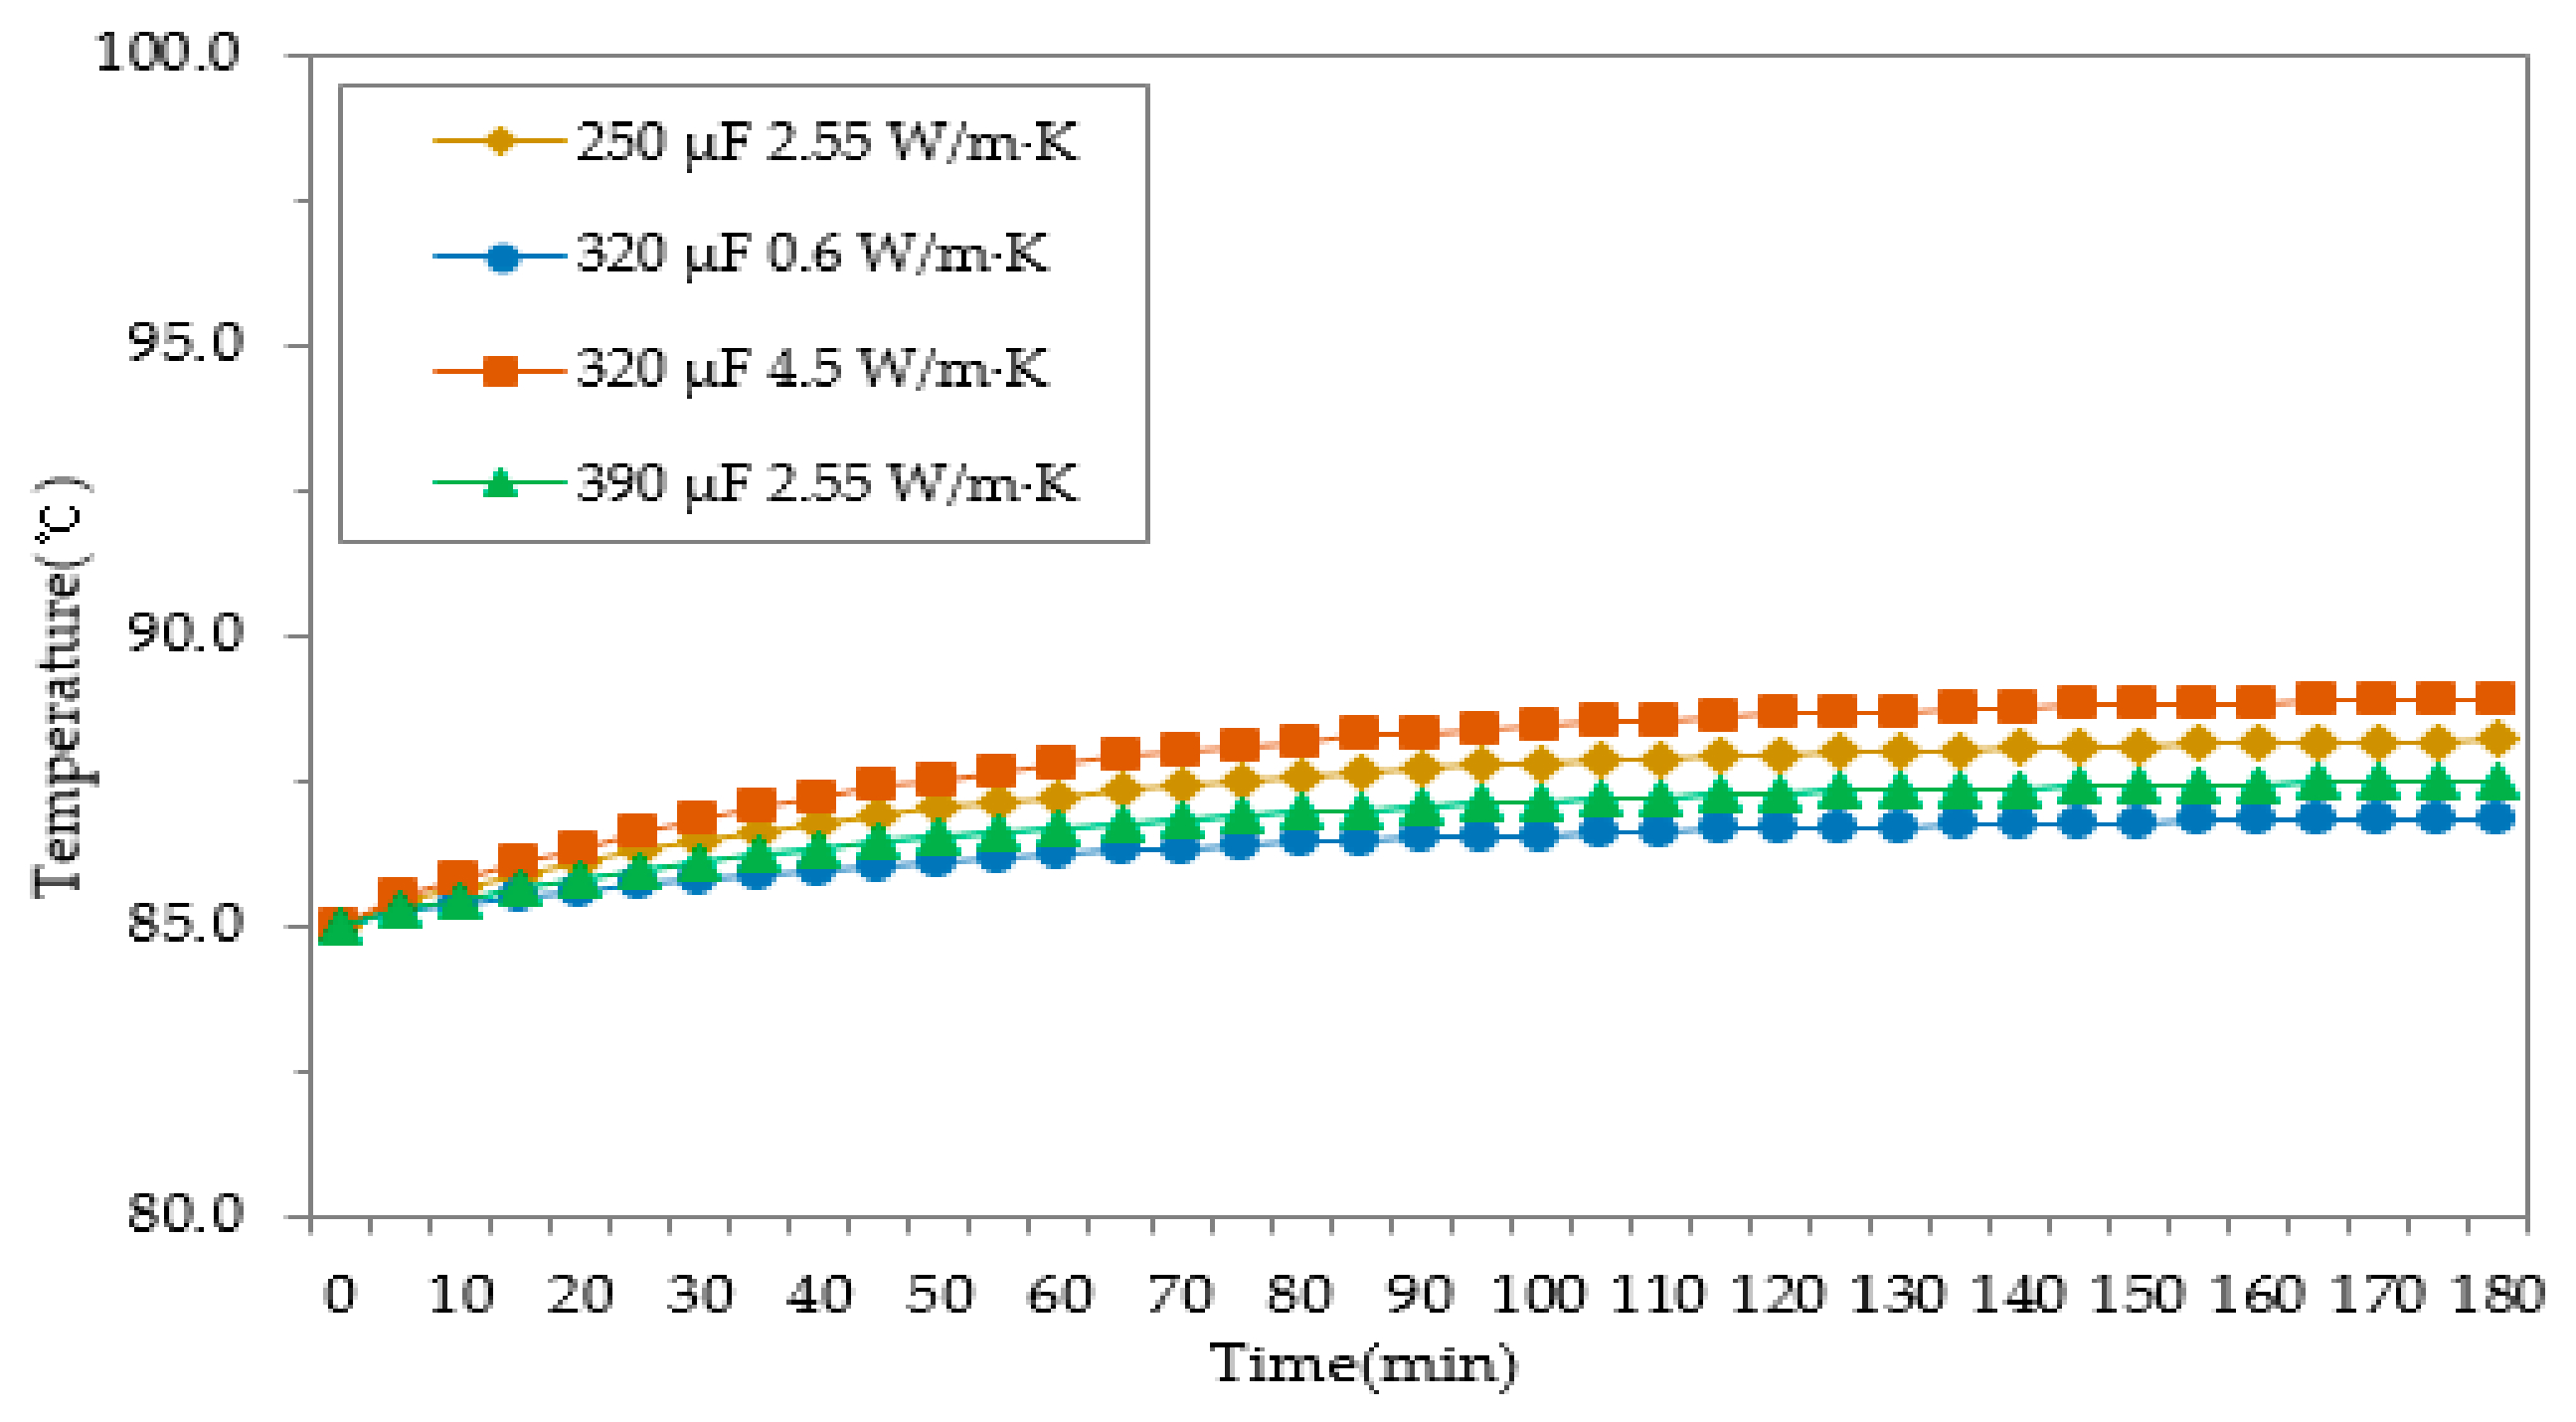
Figure 3 and Table 4 show the analysis results for film thickness of 2.8 μm. The capacitance and thermal conductivity conditions that produced the highest temperature were 250 μF and 2.55 W/m·K, respectively, with the largest temperature increase, △T, of 8.85 °C. Moreover, ESR was 1.71 mΩ and the heat transfer rate ( Q · ) was 4.28 W, which are approximately twice as high as those in the case of 390 μF. When the capacitance was 390 μF, △T was the lowest at 3.82 °C, ESR was 0.84 mΩ, and the heat transfer rate ( Q · ) was 2.10 W, which is approximately half of those in the case of 250 μF. This confirmed that the effect of capacitance (μF) on ESR was very significant. As seen in Figure 3, the heating temperature decreased with increasing capacitance. Moreover, the temperature difference with high-conductivity epoxy was minimal. △T was 5.8 °C under 320 μF and 0.6 W/m·K, whereas it was 5.34 °C under 320 μF and 4.5 W/m·K, exhibiting only a small temperature difference of 0.46 °C between the two levels. Under general convection conditions, the thermal conductivity difference of epoxy had very little effect to reduce the capacitor’s heat generation. The film thickness of the experiment is 2.8 μm and the dielectric flux density is 543.39 C/mm2.
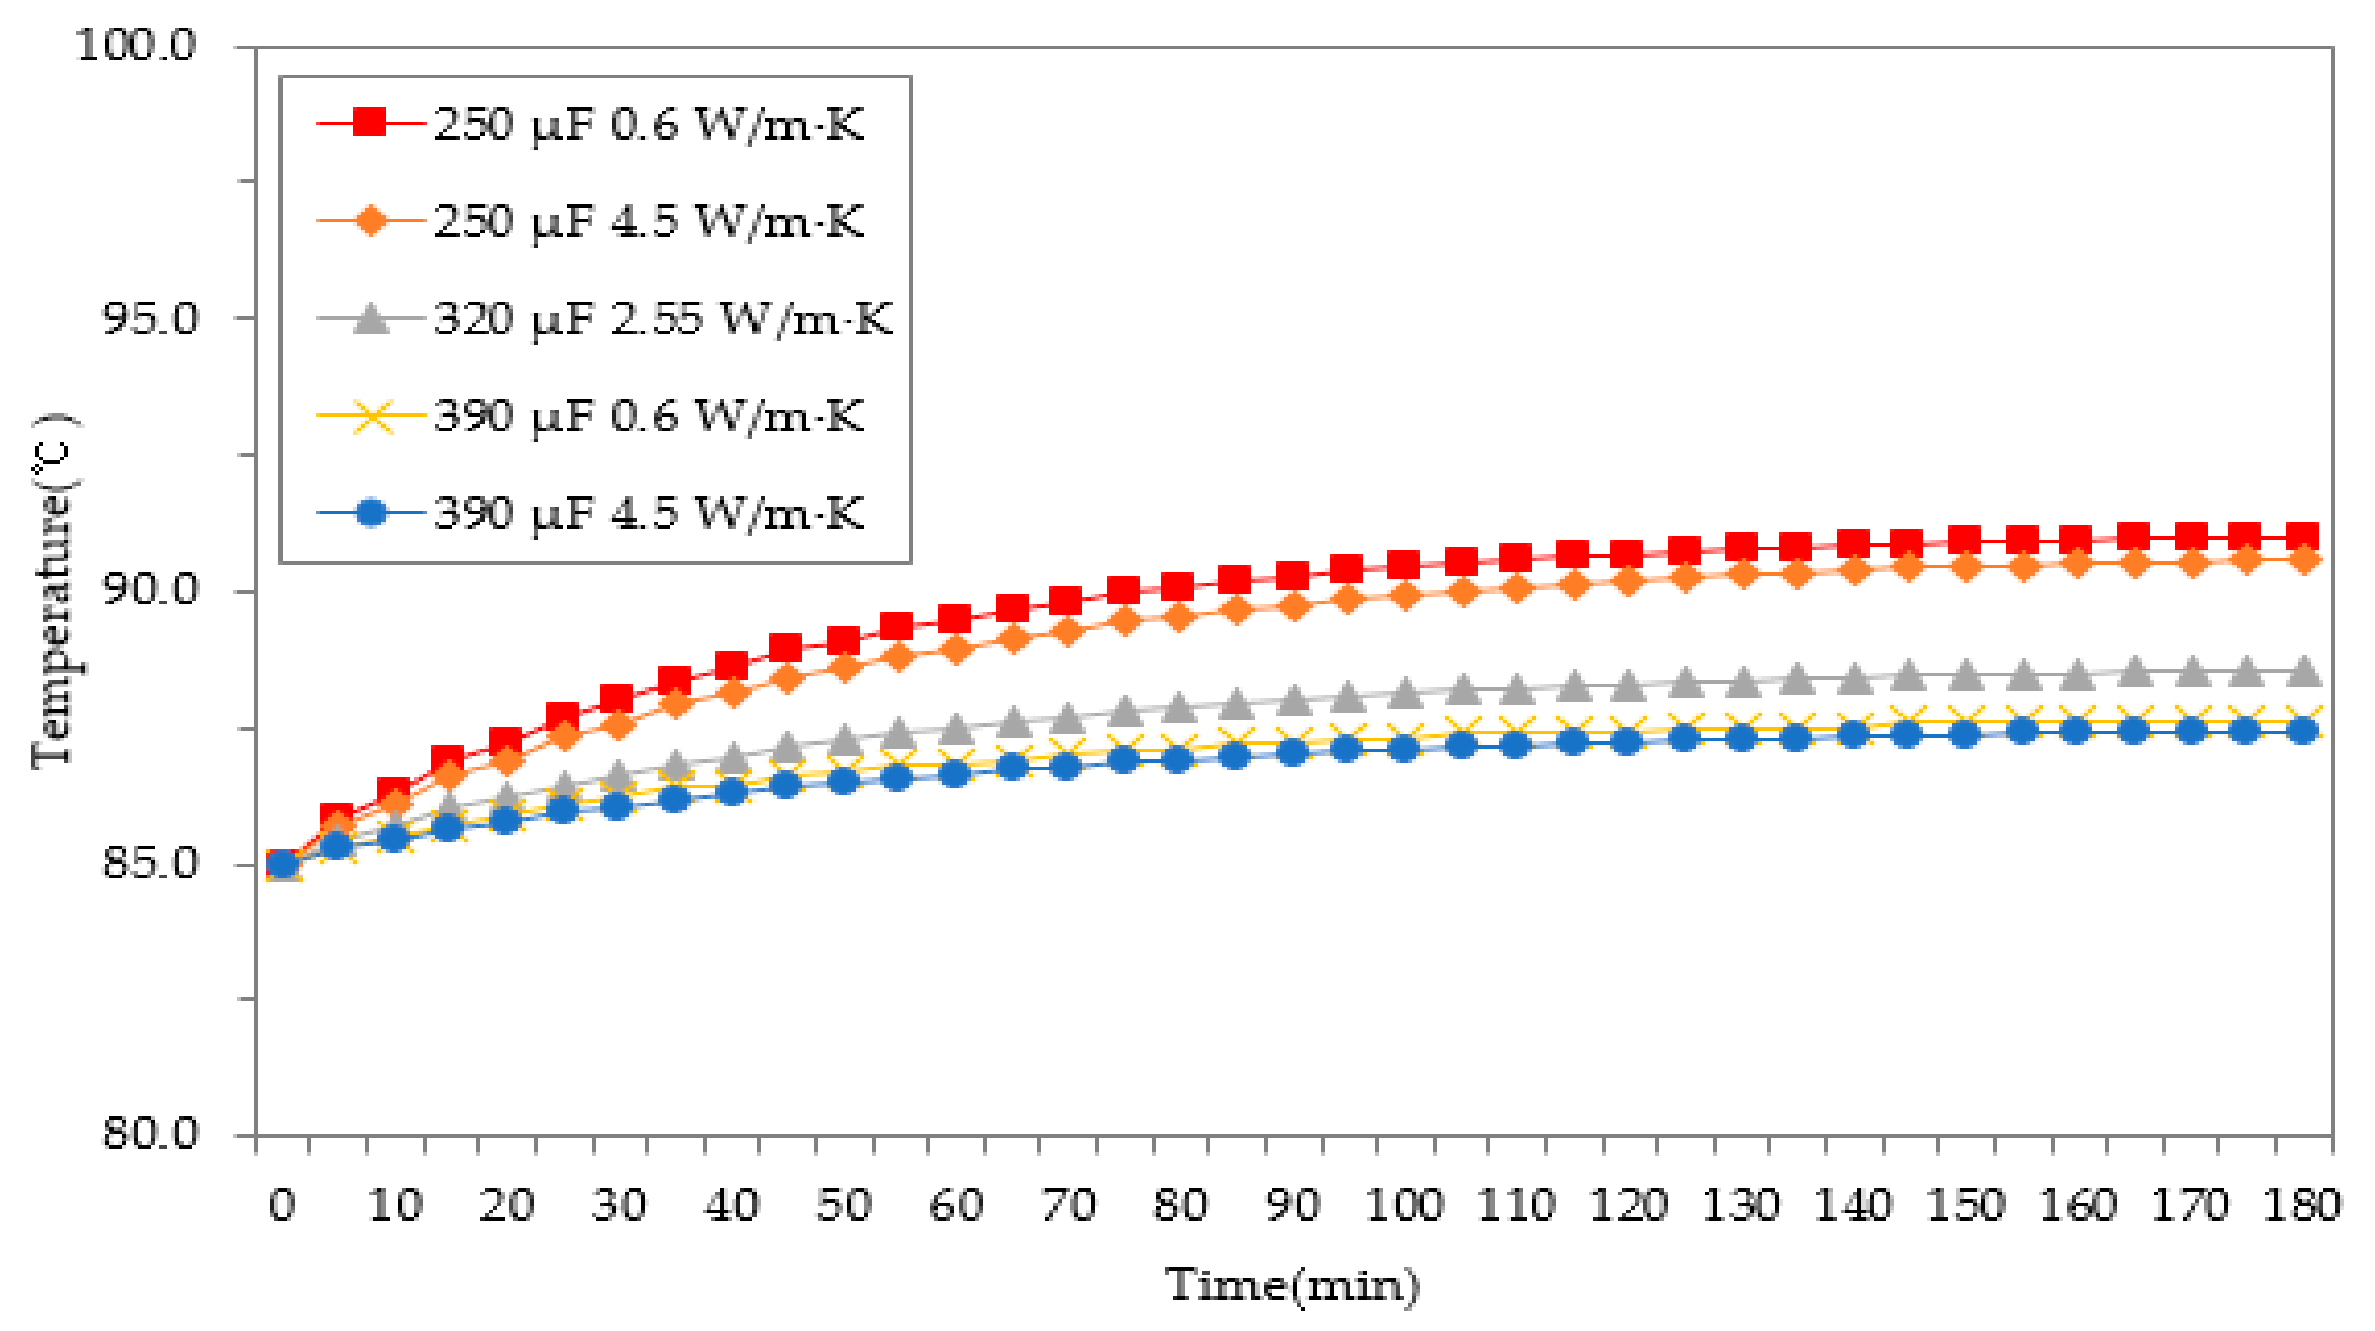
The results of the finite element analysis performed at five different levels for a film thickness of 3.15 μm are shown in Figure 4 and Table 5. The 250 μF and 0.6 W/m·K factor level showed the best results with ESR of 1.25 mΩ, △T of 6.08 °C, and a total heat transfer rate ( Q · ) of 3.13 W. Given the identical capacitance and epoxy thermal conductivity of 4.5 W/m·K, the values of ESR, △T, and Q · were 1.15 mΩ, 5.59 °C, and 2.88 W, respectively, showing a minimal temperature difference compared to when the thermal conductivity was 0.6 W/m·K. Even when the thermal conductivity of epoxy was increased by a factor of 7.5, no significant change in temperature was observed under general convection conditions. The 390 µF and 4.5 W/m·K level showed the lowest temperature properties with ESR of 0.64 mΩ, △T of 2.45 °C, and Q · of 1.59 W. Capacitance is considered to be the main factor that reduces ESR and the heating value, as shown in Equations (1) and (2), respectively. ESR, △T, and the total heat transfer rate for a film thickness of 3.15 μm were approximately 84% of the corresponding values when the film thickness was 2.8 μm. This is attributed to the lower electric flux density and increased film thickness. The dielectric flux density is 433.29 C/mm2, and it can be increased by 25.4% compared to the 2.8 μm film thickness.
Figure 5 shows the analysis results for the film thickness of 3.5 μm and Table 6 lists the property data from the results. The temperature was highest under 250 µF and 2.55 W/m·K with △T of 3.88 °C, ESR of 0.86 mΩ, and the total heat transfer rate, Q · , of 2.14 W. Although capacitance was low at 250 μF, the increased film thickness resulted in lower electrical-thermal properties. Moreover, the increase in thermal conductivity did not affect the result under general convection conditions, as the temperature difference between the epoxy products with thermal conductivity of 0.6 W/m·K and 4.5 W/m·K was only 0.69 °C. The 390 μF and 2.55 W/m·K level produced the lowest values with △T of 1.82 °C, ESR of 0.47 mΩ, and a total heat transfer rate ( Q · ) of 1.18 W. In this analysis, capacitance and film thickness were also found to have a significant effect in reducing ESR, total heat transfer rate, and △T. The dielectric flux density is 350.97 C/mm2 and it can be increased by 54.8% compared to the 2.8 μm film thickness and by 23.5% compared to 3.15 μm film thickness.
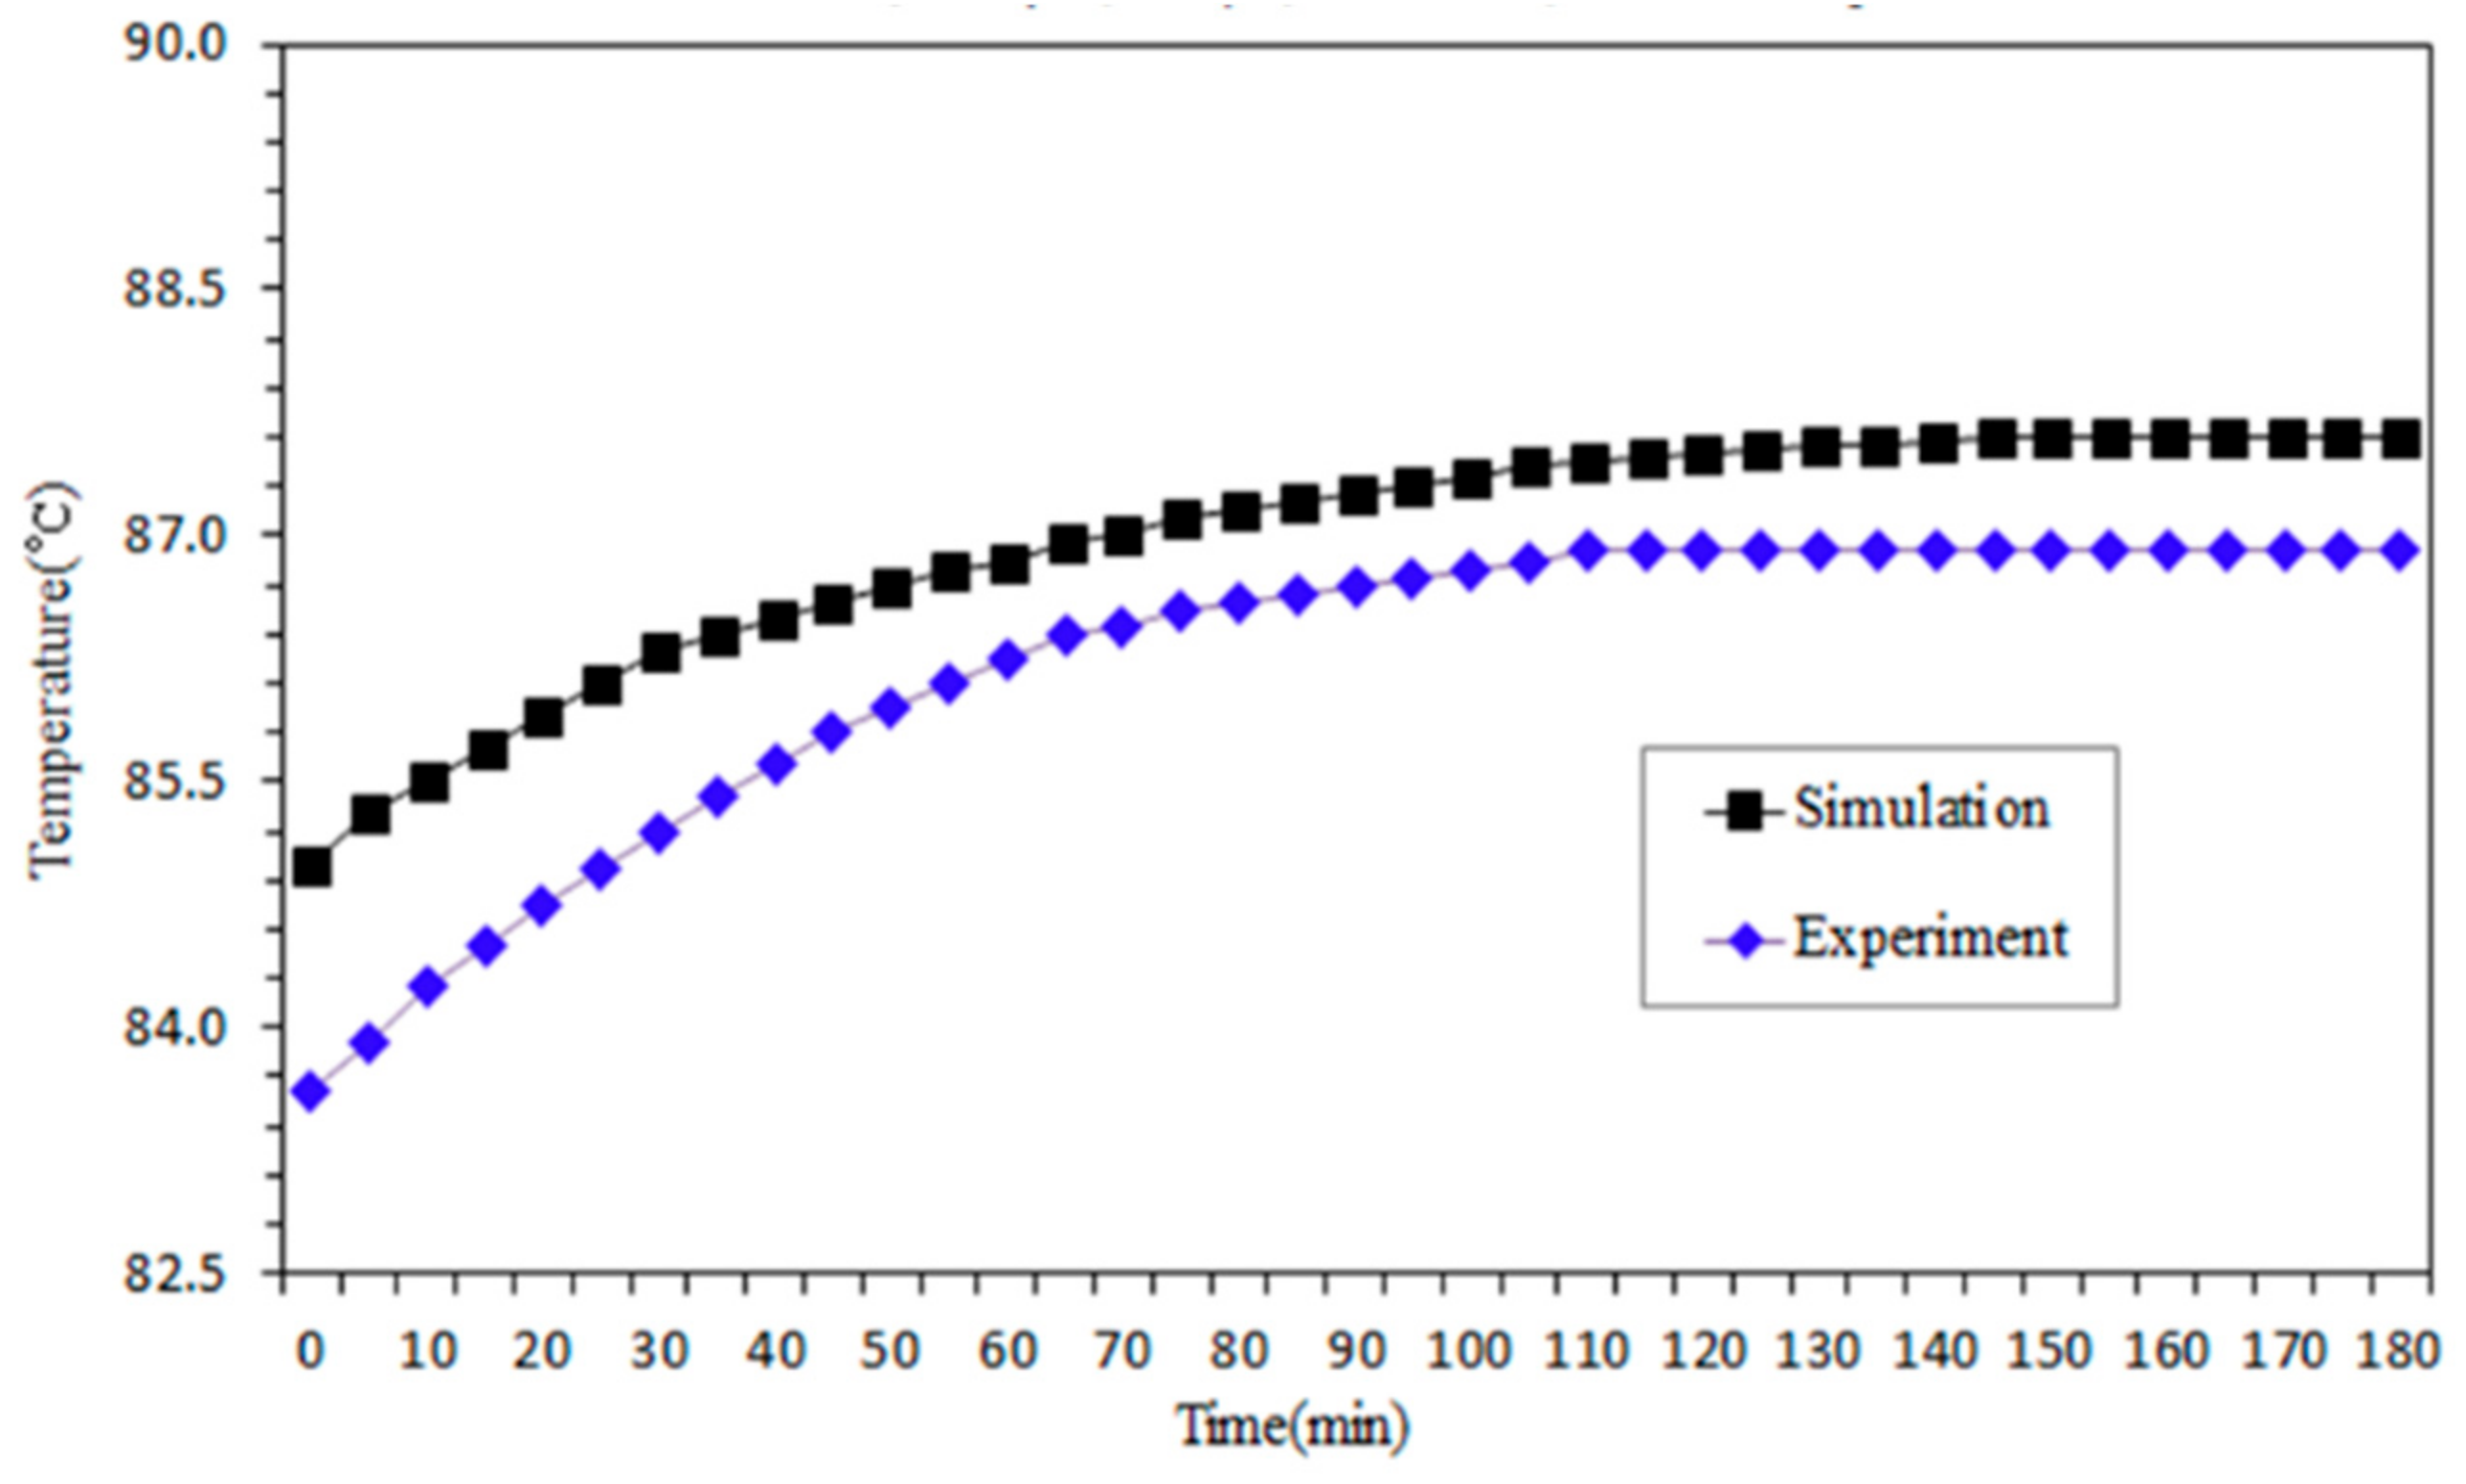
4. Results and Discussions

4.1. Analysis of Variance (ANOVA)

As can be seen in Table 7, ANOVA analysis was conducted on the finite element analysis results for each factor. The linear film thickness and capacitance appeared to be significant with a p-value of 0.000, whereas the increased thermal conductivity of epoxy was not significant for a p-value of 0.237, exceeding 0.05. The two-way interaction was significant for film thickness * capacitance with a p-value of 0.001. The model suitability R-squared was 99.64%, R-squared (modified) was 98.99%, and R-squared (predicted) was 94.22%, indicating high accuracy of the finite element analysis. The temperature prediction model of the DC capacitor was derived using the second-degree polynomial function shown as Equation (10):
Temperature (°C) = 185.48 − 35.51 FT − 0.1859 C − 0.257 TC + 3.408 FT ∗ TF + 0.000109 C ∗ C + 0.0053 TC ∗ TC + 0.02929 FT ∗ C + 0.040 FT ∗ TC + 0.000183 C ∗ TC

4.2. Effect Plots

The response surface analysis was conducted using the finite element analysis result. Figure 6 shows the response surface analysis of △T, capacitance, and film thickness. The value of △T decreased with the increase in film thickness and capacitance; △T was largest when the film thickness and capacitance were 2.8 μm and 250 μF, respectively. In contrast, the value of △T was smallest when the film thickness and capacitance were 3.5 μm and 390 μF, respectively. Figure 7 shows the effect of capacitance and film thickness on ESR. The analysis indicated that ESR decreased with the increase in capacitance and film thickness. ESR was highest when the film thickness and capacitance were 2.8 μm and 250 μF, respectively. In contrast, ESR was lowest when the film thickness and capacitance were 3.5 μm and 390 μF, respectively. Therefore, this confirms that capacitance and film thickness affect ESR significantly and that these are the main factors that minimize heat generation.

4.3. Optimized Conditions

The optimized conditions for heat generation were derived based on the following specifications: film width of 35 mm, capacitance of 200 μF, film thickness of 3.15 μm, and maximum temperature of 87.35 °C. The optimized conditions obtained by the finite element analysis are as follows: capacitance of 390 μF, film thickness of 3.15 μm, and enhanced epoxy thermal conductivity of 0.6 W/m·K. The analysis indicated a fitted value at 87.32 °C, a 95% confidence interval in the range of 86.916 to 87.724 °C, and a 95% prediction interval in the range of 86.702 to 87.938 °C.
The samples were prepared for experimental verification, and the temperature changes were measured over time. Figure 8 shows the developed sample for conducting an experiment under the optimized conditions, which consisted of a K-type sensor attached to the film surface 6 point and electrodes made of copper (Cu). The capacitance was an Agilent LCR METER E4980A, and current, voltage, and frequency were set to the oscilloscope. Temperature data were stored using the SDR100 recorder. The changes in temperature data over 3 h were measured under the electrical conditions, that is, ambient temperature of 85 °C and current of 50 Amps, and the frequency was 16 kHz with a square waveform generated during the inverter PWM switching (Table 8).
Figure 9 shows a graph comparing the results of finite element analysis and that of actual measurements from the experiment conducted under the optimization conditions. The experiment was repeated three times to minimize deviations, the average data calculated for the highest temperature of the film surface, and the result values plotted. Table 9 lists the quantitative results of the finite element analysis and the physical experiment. The finite element analysis result indicated a maximum temperature of 87.72 °C, whereas the physical experiment showed a maximum temperature of 86.9 °C with 99.07% accuracy

5. Conclusions

In this study, the factors affecting the minimization of heat generation of a capacitor were determined, and their properties were analyzed through finite element analysis. The variables that affect heat generation—including capacitance, film thickness, and thermal conductivity of epoxy—were set at three different levels. The analysis results confirmed the significant effect of capacitance and film thickness on heat generation. It was found that temperature decreased with increasing capacitance and film thickness, whereas higher thermal conductivity of epoxy did not have a significant effect under general convection conditions. The interaction between film thickness and capacitor was found to be effective in minimizing ESR reduction and heat generation. As the film thickness increased, the ΔT and dielectric flux density decreased. The optimized conditions for minimizing heat generation were derived, and the feasibility of the analysis model was verified experimentally. Further, comparison of the prediction and experimental values confirmed the high accuracy of the analysis model.

Author Contributions

Y.W.J., Y.S.K., and E.S.J. conceived and designed the experiments; Y.W.J., Y.S.K., and E.S.J. performed the experiments; Y.W.J., Y.S.K., and E.S.J. analyzed the data; Y.W.J., Y.S.K., and E.S.J. contributed reagents/materials/analysis tools; Y.W.J., Y.S.K., and E.S.J. wrote the paper. All authors have read and agreed to the published version of the manuscript.

Funding

This work was supported by the research grant of the Kongju National University in 2020.

Institutional Review Board Statement

Not applicable.

Informed Consent Statement

Not applicable.

Data Availability Statement

Data available in a publicly accessible repository.

Conflicts of Interest

The authors declare no conflict of interest.

References

  1. He, T.; Zhu, J.; Zhang, J.; Zheng, L. An optimal charging/discharging strategy for smart electrical car parks. Chin. J. Electr. Eng. 2018, 4, 28–35. [Google Scholar]
  2. Aymen, F.; Mahmoudi, C. A novel energy optimization approach for electrical vehicles in a smart city. Energies 2019, 12, 929. [Google Scholar] [CrossRef] [Green Version]
  3. Sobol, Ł.; Dyjakon, A. The influence of power sources for charging the batteries of electric cars on CO2 emissions during daily driving: A case study from Poland. Energies 2020, 13, 4267. [Google Scholar] [CrossRef]
  4. Korea Energy Agency. 2017 General Energy Survey Electric Vehicle Survey Results Report. Available online: https://www.energy.or.kr (accessed on 12 December 2017).
  5. Li, Z.; Li, H.; Huang, X.; Li, H.; Wang, W.; Wang, B.; Lin, F.; Zhang, Q. Temperature rise of metallized film capacitors in repetitive pulse applications. IEEE Trans. Plasma Sci. 2015, 43, 2038–2045. [Google Scholar] [CrossRef]
  6. Kim, N.; Park, C.; Kwak, S.; Baek, J. experimental comparisons and evaluations of different types of DC-link capacitors for VSI-based electric compressors in battery electric vehicle systems. Electronics 2020, 9, 1276. [Google Scholar] [CrossRef]
  7. Anusree, R.; Sreelekshmi, R.; Nair, M.G. Study & simulation for determining the age of electrolytic capacitor using ESR. In Proceedings of the 2018 IEEE Distributed Computing, VLSI, Electrical Circuits and Robotics (DISCOVER), Mangalore, India, 13–14 August 2018; pp. 55–59. [Google Scholar]
  8. Cui, S.; Hu, L.; Zhang, C.; Han, S.; Zheng, W. Research on temperature characteristic of DC-link capacitors applied in electric vehicles. In Proceedings of the 2014 IEEE Conference and Expo Transportation Electrification Asia-Pacific (ITEC Asia-Pacific), Beijing, China, 31 August–3 September 2014; pp. 1–5. [Google Scholar]
  9. Sommer, C.; Merkert, A.; Mertens, A. A new control method for minimizing the DC-link capacitor current of HEV inverter systems. In Proceedings of the 2014 IEEE Energy Conversion Congress and Exposition (ECCE), Pittsburgh, PA, USA, 14–18 September 2014; pp. 1188–1193. [Google Scholar]
  10. Kanazawa, T.; Furukawa, K.; Aoyagi, S. Analysis of RMS current on DC-link capacitor with single-shunt current sensing system. In Proceedings of the 2015 IEEE Energy Conversion Congress and Exposition (ECCE), Montreal, QC, Canada, 20–24 September 2015; pp. 3637–3642. [Google Scholar]
  11. Wang, H.; Blaabjerg, F. Reliability of capacitors for DC-link applications in power electronic converters—An overview. IEEE Trans. Ind. Appl. 2014, 50, 3569–3578. [Google Scholar] [CrossRef] [Green Version]
  12. Yao, F.; Wang, B.; Li, Z.-G.; Peng, Y. Reliability study on DC-link capacitor in fault states of VSI in elective vehicle. J. Eng. 2019, 2019, 2544–2550. [Google Scholar] [CrossRef]
  13. Stewart, J.; Neely, J.; Delhotal, J.; Flicker, J. DC link bus design for high frequency, high temperature converters. In Proceedings of the 2017 IEEE Applied Power Electronics Conference and Exposition (APEC), Tampa, FL, USA, 26–30 March 2017; pp. 809–815. [Google Scholar]
  14. Ho, J. Effects of dielectric material properties on metalized film capacitor performance. In Proceedings of the 2016 IEEE International Conference on Dielectrics (ICD), Montpellier, France, 3–7 July 2016; pp. 934–937. [Google Scholar]
  15. Pfeiffenberger, N.; Milandou, F.; Niemeyer, M.; Sugawara, T.; Sanner, M.; Mahood, J. High temperature dielectric polyetherimide film development. IEEE Trans. Dielectr. Electr. Insul. 2018, 25, 120–126. [Google Scholar] [CrossRef]
  16. Tan, D.Q. Differentiation of roughness and surface defect impact on dielectric strength of polymeric thin films. IET Nanodielectrics 2020, 3, 28–31. [Google Scholar] [CrossRef]
  17. Jia, W.; Hou, Y.; Zheng, M.; Xu, Y.; Zhu, M.; Yang, K.; Cheng, H.; Sun, S.; Xing, J. Advances in lead-free high-temperature dielectric materials for ceramic capacitor application. IET Nanodielectrics 2018, 1, 3–16. [Google Scholar] [CrossRef]
  18. Fan, B.; Liu, F.; Yang, G.; Li, H.; Zhang, G.; Jiang, S.; Wang, Q. Dielectric materials for high-temperature capacitors. IET Nanodielectrics 2018, 1, 32–40. [Google Scholar] [CrossRef]
  19. Umran, H.M.; Wang, F.; He, Y. Ageing: Causes and effects on the reliability of polypropylene film used for HVDC capacitor. IEEE Access 2020, 8, 40413–40430. [Google Scholar] [CrossRef]
  20. Li, Z.; Li, H.; Lin, F.; Liu, D.; Wang, B.; Dai, L.; Li, H.; Zhang, Q.; Chen, Y. Lifetime improvement of metallized film capacitors by inner pressure strengthening. IEEE Trans. Plasma Sci. 2013, 41, 3063–3068. [Google Scholar] [CrossRef]
  21. Chen, Y.; Li, H.; Lin, F.; Lv, F.; Zhang, M.; Li, Z.; Liu, D. Study on self-healing and lifetime characteristics of metallized-film capacitor under high electric field. IEEE Trans. Plasma Sci. 2012, 40, 2014–2019. [Google Scholar] [CrossRef]
  22. Fei, Y.; Zijian, W.; Ting, Y. Research on the self-healing failure characteristics and its protection methods of high-voltage self-healing capacitors. J. Eng. 2019, 2019, 3371–3377. [Google Scholar] [CrossRef]
  23. Walgenwitz, B.; Tortai, J.; Bonifaci, N.; Denat, A. Self-healing of metallized polymer films of different nature. In Proceedings of the 2004 IEEE International Conference on Solid Dielectrics, Toulouse, France, 5–9 July 2004; pp. 29–32. [Google Scholar]
  24. Li, H.; Li, H.; Li, Z.; Lin, F.; Liu, D.; Wang, W.; Wang, B.; Xu, Z. T pattern fuse construction in segment metallized film capacitors based on self-healing characteristics. Microelectron. Reliab. 2015, 55, 945–951. [Google Scholar] [CrossRef]
  25. Valentine, N.; Azarian, M.H.; Pecht, M. Metallized film capacitors used for EMI filtering: A reliability review. Microelectron. Reliab. 2019, 92, 123–135. [Google Scholar] [CrossRef]
  26. Berkani, M.; Kadmi, Y.; Bouchareb, M.K.; Bouhelassa, M.; Bouzaza, A. Combination of a Box-Behnken design technique with response surface methodology for optimization of the photocatalytic mineralization of CI Basic Red 46 dye from aqueous solution. Arab. J. Chem. 2020, 13, 8338–8346. [Google Scholar] [CrossRef]
Figure 1. Schematic diagram of capacitor temperature experiment.
Energies 14 00114 g001
Figure 2. Film width 35 mm (left) versus 50 mm (right) finite element analysis results.
Energies 14 00114 g002
Figure 3. Finite element analysis (FEA) results of capacitance and thermal conductivity of epoxy for film thickness 2.8 μm.
Energies 14 00114 g003
Figure 4. FEA results of capacitance and thermal conductivity epoxy for film thickness of 3.15 μm.
Energies 14 00114 g004
Figure 5. FEA results of capacitance and thermal conductivity epoxy for film thickness 3.5 μm.
Energies 14 00114 g005
Figure 6. Response surface analysis results for △T versus film thickness and capacitance.
Energies 14 00114 g006
Figure 7. Response surface analysis results for Arms/△t versus film thickness and film width.
Energies 14 00114 g007
Figure 8. Optimization conditions sample.
Energies 14 00114 g008
Figure 9. Temperature test results for optimization conditions.
Energies 14 00114 g009
Table 1. Range and levels of experimental parameters.
VariableSymbolRanges and Levels
−101
Film thickness (µm)FT2.83.153.5
Capacitance (µF)C250350390
Thermal conductivity (W/m·K)TC0.62.554.5
Table 2. Thermal characteristics of parts.
MaterialThermal Conductivity (W/m·K)Specific Heat (J/kg °C)
Copper401 385
Zinc116 116
Epoxy0.6 810
Polypropylene2.8 1920
Polycarbonate0.21 1700
Table 3. Analysis results for 35 mm and 50 mm widths.
Item△TESR Q ·
35 mm2.35 °C0.46 mΩ1.14 W
50 mm9.26 °C1.80 mΩ4.50 W
Table 4. Analysis results for film thickness 2.8 μm.
Item△TESR Q ·
250 µF 2.55 W/m·K8.85 °C1.71 mΩ4.28 W
320 µF 0.6 W/m·K5.80 °C1.21 mΩ3.03 W
320 µF 4.5 W/m·K5.34 °C1.21 mΩ2.79 W
390 µF 2.55 W/m·K3.82 °C0.84 mΩ2.10 W
Table 5. Analysis results of film thickness of 3.15 μm.
Item△TESR Q ·
250 µF 0.6 W/m·K6.08 °C1.25 mΩ3.13 W
250 µF 4.5 W/m·K5.59 °C1.15 mΩ2.88 W
320 µF 2.55 W/m·K3.55 °C0.79 mΩ1.98 W
390 µF 0.6 W/m·K2.72 °C0.71 mΩ1.77 W
390 µF 4.5 W/m·K2.45 °C0.64 mΩ1.59 W
Table 6. Analysis results for film thickness 3.5 μm.
Item△TESR Q ·
250 µF 2.55 W/m·K3.88 °C0.86 mΩ2.14 W
320 µF 0.6 W/m·K3.17 °C0.76 mΩ1.90 W
320 µF 4.5 W/m·K2.48 °C0.60 mΩ1.49 W
390 µF 2.55 W/m·K1.82 °C0.47 mΩ1.18 W
Table 7. Response surface analysis results for three factors.
SourceDF 1)Adj SS 2)Adj MS 3)F-Value 4)p-Value 5)
Model945.48495.0539153.310.000
Linear341.828713.9429422.960.000
FT120.416120.4161619.330.000
C121.353121.3531347.750.000
TC10.05950.05951.810.237
Square31.59150.530516.090.005
FT ∗ FT10.64360.643619.520.007
C ∗ C11.05681.056832.060.002
2-Way Interaction32.06470.688220.880.003
FT ∗ C12.05922.059262.470.001
Error50.16480.0330
Lack-of-Fit30.16480.0549
Pure Error20.00000.0000
Total1445.6498
1) DF: Degree of freedom; 2) Adj SS: Sum of squares; 3) Adj MS: Mean of square; 4) F-Value: MSTR/MSE; 5) p-Value: The criterion for determining the significance level and the reference value is less than 0.05.
Table 8. Parameters used in the temperature experiment.
FactorLevelUnit
Capacitance390μF
Frequency16kHz
Current50Amps
Voltage270Vdc
Ambient temp’85°C
Table 9. Experimental results of optimization results.
ItemTemp’△tESR
Optimization results (Est)87.72 °C2.72 °C0.71 mΩ
Test results86.9 °C3.53 °C0.64 mΩ
Accuracy99.07%--
Publisher’s Note: MDPI stays neutral with regard to jurisdictional claims in published maps and institutional affiliations.

