Abstract
We analyze the solar influence of space weather events on Polish energy infrastructure via geomagnetic disturbances. We consider two time intervals of very different levels of solar activity (SA) in the course of the solar activity cycle 24: 2010—an early rising phase of SA, near the solar minimum and 2014—solar maximum. From the total number of electrical grid failures, we extract almost five thousand failures in 2010 and more than ten thousand in 2014, which could be related to space weather effects. We analyze data of failures having unidentified causes, failures coupled with the aging of transmission network elements and electronic devices, which appeared during the time intervals of enhanced geomagnetic activity. We show that around the times of increasing geomagnetic activity level, the amount of transmission lines failures in the groups mentioned above grows, but mostly with some delay. It might be connected to some cumulative effect due to the result of transient states and their propagation in the distribution network. Although we do not exclude that the other factors may play a role, the solar-originating disturbances strengthen these effects.
1. Introduction
The capacity installed in the Polish National Power System in 2017 was 43,332 MW increasing by 5% in relation to 2016. According to the Energy Regulatory Office, the volume of gross domestic electricity production in 2017 was at a higher level than during the previous year being 165,852 GWh, which is an increase of 1.98% [1]. This tendency is kept—Polish industry, as well as Polish society electricity demands, are continuously growing [2]. Although, due to redundancy, the blackouts in the Polish system are infrequent events, each factor, which possibly may increase the probability of their occurrence, should be considered [3].
One of these factors is solar-driven effects, which can continuously influence the near-Earth’s environment, hence the space-born and terrestrial technological systems, for example, [4], and as a result, humankind existence, for example, [5,6], as well. Sun is changing its behavior in various time scales. A sunspot number generally categorizes solar activity (SA). Sunspots emerge on the surface of Sun, wavering in time. The 11-year solar cycle, from one sunspot minimum to the subsequent minimum, demonstrates time-based changes in the solar activity level [7]. The maximum epoch of SA is a period with a peak in the sunspot number. Sun is an origin of the coronal mass ejections (CMEs) and the exceptional solar flares causing the influential turbulences in the interplanetary space. They perform randomly in time, irregularly, with growth in a frequency in the maxima of SA. Different phenomena appearing on the Sun draw to an alteration of solar magnetic energy into space-weather driving events. During the sunspot maximum, the transient phenomena, like solar flares and CMEs, are much more frequent than around the solar minimum. The interaction of solar-induced phenomena with the geomagnetic field can give rise to geomagnetic storms causing the generation of various effects, for instance, geomagnetically induced currents (GICs). GICs are phenomenon initiated by the interplay between the solar wind and the geomagnetic field, and arising from generated Earth electric fields that are caused by magnetic field alternations via Faraday’s law, for example, [8,9]. During the extreme geomagnetic storms, GIC can disorganize transmission systems, sometimes directly damaging transformers through spot heating [10]. The damages of transformers can have weighty economic repercussions because it can eventually leave particular regions without power for a long time-interval, as well as incurring the costs of the replacement of the transformer.
At the very beginning, the focus on GIC consequences was at high latitudes (>60 degrees) [8], particularly in Scandinavian countries and in North America. However, there occur gradually growing indications of GIC impacts also at mid- and low-latitudes. In mid- and low-latitude countries, GIC can be a source of the transformers’ failures through the transformer insulation repeated heating [11,12]. Over the last few years, substantial magnetic field rates of change have also been noticed in near-equator latitudes at coronal mass ejecta arrival moments [13,14] and even in the quiet period of the solar activity cycle 24 (the year 2017) at Malaysia region [15]. It is worth mentioning that in Gil et al. [16] we have shown, using the Wilcoxon Matched Pairs Test, that the greater value of Kp index, the higher is the amount of Polish transmission lines failures caused by the aging of elements. Vybostokova and Svanda [17] provided indirect evidence that GICs may affect the electrical grid’s operations in the middle part of Europe (in the mid-latitudes). It was described by Zois [18], Tozzi et al. [19], Clilverd et al. [20] that despite to not very high GICs intensity at middle and low latitudes, GICs can have cumulative and long-term effects on transformers. The number of failures, simply attributed to aging, could be the result of the stress accumulated over the time caused by GICs flowing, for example, [18].
High values of the temporal derivative of the geomagnetic field are linked to significant GIC appearance. It means rapid fluctuations in time of the Earth’s magnetic field, particularly the magnetic component in the horizontal direction [9,21,22,23]. Nevertheless, Watari et al. [24] concluded that variations in time of geomagnetically induced currents are highly correlated with geomagnetic field changes, rather than with its derivatives in time. Mac Manus et al. [25] studied the correlation coefficients between the time variations of the Earth’s magnetic field and the GIC appearances. Rodger et al. [26] examined the correlation between the peak geomagnetically induced currents magnitudes at the transformers in New Zealand and the peak of values of the horizontal components of the magnetic field for the 25 emergencies during 2001–2015. They showed that the range of the New Zealand values weakly correlates to global geomagnetic indices and is not well linked to the global geomagnetic field variation amplitudes [26].
However, those effects are not very extensively studied concerning Polish energy infrastructure. Pulkkinen et al. [27], describing the Halloween Storm’s aftermath, mentioned an episode on SwePol Link cable. SwePol Link connects, under the Baltic Sea, Polish and Swedish energy infrastructure, by the 450 kV high voltage direct current. On 29 October 2003, at 07:46 an import to Sweden from Poland by the SwePol Link of 300 MW energy was disrupted. Also, on 20 November 2003, at 18:04 on the SwePol Link line was the disruption of an import from Poland to Sweden of 400 MW [27,28]. During this Halloween Storm, a blackout occurred in Sweden on 30 October 2003 at 21:07 (local time, UTC+1) lasting for 20–50 min. This blackout affected 50,000 customers in Malmo and neighboring locations [29]. The same storm was reported to generate serious damage of 15 transformers in South Africa [12,30].
The more recent event is the St. Patrick’s Day geomagnetic storm on 17 March 2015, being the strongest in the 24th solar activity cycle [31]. Kozyreva et al. [32] reported that its main phase was rather step-wise (∼17 h duration), it contained shortly-living substorm-like activities, with geomagnetic indices, IE and AE, up to ∼1500–2500 nT (where AE index from http://wdc.kugi.kyoto-u.ac.jp, describes the planetary geomagnetic field disturbance at auroral latitudes, which are caused by the auroral electrojet and IE is the IMAGE Electrojet indicator from https://space.fmi.fi, being a simple estimator of the total eastward and westward currents crossing the magnetometer network). This event was initiated by the interplay between two CMEs and high-speed solar wind streams from a corotating interaction region [33] and caused the GIC enhancement in transmission lines on the Kola peninsula [32]. Though, the one-to-one coherence between the power of the substorm, described by the local electrojet index, and the power GIC was not found. Carter et al. [14] also examined the St. Patrick’s storm and found that even at the around equator latitudes, strengthened GIC appearance was noticed, both at the moment of sudden storm commencement and about 10h after the storm, at similar moments as the greatest perturbations of the geomagnetic field in the high-latitudes areas. These authors explained the high-intensity GIC appearance around the equator by the magnetospheric, as well as ionospheric currents’ fluctuations linked to a sudden growth of the solar wind dynamic pressure with interplanetary electric fields () playing a minor role.
Over the last few decades, a number of authors have investigated the potential impact of severe space weather on energy infrastructure, for example, [34,35,36,37]. In particular, space weather phenomena may affect the physical infrastructure (e.g., transformers) required to handle electricity transmission and generate an energy collapse in the transmission lines, presumably announced by voltage stability loss, which will shield the power system’s resources from damage. Schulte in den Bäumen et al. [38] showed that depletion of 10% in electricity supply in the Earth’s immensely industrialized and most populous areas due to an extreme geomagnetic storm can impact the global economy in the same scale as global financial crises and wars. Schrijver et al. [39] found that insurance claim rates for industrial electrical equipment across North America greatly rose on days with strengthened geomagnetic activity.
The above-mentioned failures of energy facilities make society conscious that geomagnetic storms are the result of a very complex chain of events derived from the accumulated, in the interior of the Sun, magnetic energy [28]. In the process of the national power systems maintenance and development, it should be taken into account that geomagnetic storms are indeed genuine threats and can cause significant damage to both power systems and other critical infrastructure elements. If not appropriately handled, the socio-economic ramifications can be severe. Significant consequences for the power system are local or nationwide power outages, catastrophic transformer breakdowns, and long-term loss of production. Therefore, it is necessary to analyze whether and to what extent the space weather effects influence the Polish energy infrastructure by the enhanced GICs.
This paper is organized as follows: in the introduction, we present a short overview of solar impact mirrored in geomagnetic disturbances. In the second section, we introduce the data used in this paper. The third section describes transmission lines in southern Poland, as well as reasons for their failures. In the fourth section, we present our results and discussion. The last section concludes the paper.
2. Geomagnetic Conditions in Poland in 2010 and 2014
Daily regular magnetic field variation arises from current systems caused by regular solar radiation changes. Other irregular current systems produce magnetic field changes caused by the interaction of the solar wind with the magnetosphere, by the magnetosphere itself, by the interactions between the magnetosphere and ionosphere, and by the ionosphere itself. Various indices were designed to describe variation in the geomagnetic field caused by these irregular current systems. Geomagnetic indices are a measure of geomagnetic activity, which is a signature of the response of the Earth magnetosphere and ionosphere to solar forcing. They play a significant role in describing the magnetic configuration of the Earth’s ionized environment [40]. In the second half of the twentieth century, they have become a key parameter in solar-terrestrial studies; in the past 15 years, they have become a key parameter in space weather, being commonly used to detect and describe space weather events. Geomagnetic disturbances can be monitored by ground-based magnetic observatories recording the three magnetic field components. Magnetic observations are carried out by high precision magnetometers, for example, [41,42], that measure the total geomagnetic field intensity F, , where , and are the Cartesian components of the geomagnetic field vector in the north X, east Y and down Z directions, respectively. Geomagnetic field measurements detected by magnetometers include the regular and irregular (contributing to K index) time variations of geomagnetic activity.
One of the essential indexes of global geomagnetic activity is the planetary Kp index. The planetary three-hour-range index Kp was introduced by J. Bartels in 1949 and is derived from the standardized local K index of 13 magnetic observatories between 44 degrees and 60 degrees northern or southern geomagnetic latitude. It is designed to measure solar particle radiation by its magnetic effects, and today it is considered a proxy for the energy input from the solar wind to Earth. The local three-hour range K index is a number in the range of zero (quiet) to nine (disturbed) that classifies the observed variations of the geomagnetic field locally after subtraction of the regular daily variation. Each activity level relates almost logarithmically to the corresponding disturbance amplitude of the horizontal field component during a 3-h UT interval. In a day, eight K indices are given in successive 3-h UT intervals (0–3 h, 3–6 h, …, 21–24 h UT) [43].
According to NOAA Space Weather Prediction Center scales, the K index 5 may indicate geomagnetic storm appearance (National Oceanic and Atmospheric Administration, NOAA, scale: https://www.swpc.noaa.gov/noaa-scales-explanation). This scale distinguishes various possible effects depending on the K index value. Thus, for , we can expect weak power grid fluctuations; for , high-latitude power systems may experience voltage alarms, long-duration storms may cause transformer damage; for , voltage corrections may be required, false alarms triggered on some protection devices; for , possible widespread voltage control problems and some protective systems will mistakenly trip out key assets from the grid might occur; while for , widespread voltage control problems and protective system problems can occur, some grid systems may experience complete collapse or blackouts. Transformers may experience damage.
To study precisely geomagnetic conditions in Poland in 2010 and January-July 2014, we have analyzed data from Belsk observatory [41], which is a part the of International Real-time Magnetic Observatory Network (INTERMAGNET). The INTERMAGNET is a consortium of geophysical institutes around the world connecting the action of geomagnetic observatories, for example, [44], monitoring different physical processes in the Earth’s interior and the Earth’s environment, for example, [42]. Nowadays, the INTERMAGNET consortium incorporates 57 institutes from 40 countries supporting 120 observatories, for example, [45] (Figure 1a,b therein). It provides the homogeneous observations of the terrestrial effects of solar corpuscular radiation by measuring the intensity of the geomagnetic activity caused by the electric currents produced around the Earth by that radiation [43]. Physically, the magnetic disturbance is primarily attributed to electric currents flowing in the ionosphere. Electric currents generate magnetic fields that contribute to the geomagnetic field measured by an observatory on Earth. For more amounts of events, it is sufficient to consider only three circular current-circuits [43]: the equatorial ring-current responsible for most of the world-wide effects, and currents in the two polar auroral zones, normally with about 23 degrees radius around the geomagnetic poles, but increasing in radius during intense storms.
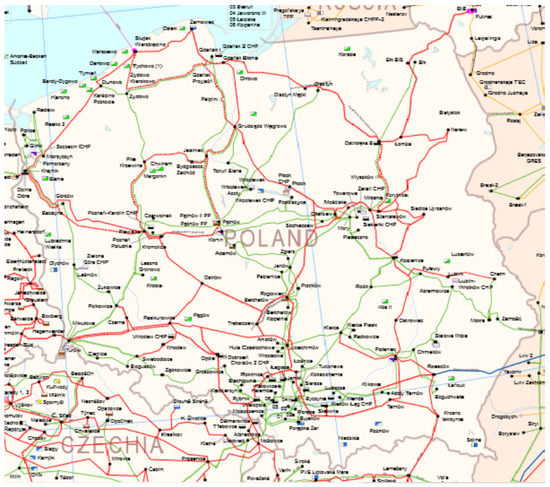
Figure 1.
Map of the Polish National System of high voltage lines by the European Network of Transmission System Operators for Electricity, where the blue line marks 750 kV line, red 380–400 kV, yellow 300–330 kV and green 220–275 kV, the pink line means DC, gray lines are connection lines, and lines intersected by vertical small parallel lines marks two or more circuits. The alternative version of the map (in Polish) can be found here: https://www.pse.pl/web/pse-eng/areas-of-activity/polish-power-system/scheme-of-the-extra-high-voltage-power-grid.
We took into consideration geomagnetic index K from Belsk [46] in 2010 and 2014. Since K ≥ 5 may indicate geomagnetic storm appearance, we recognized all of the three-hour intervals with K index from Belsk being greater than or equal to 5. There were 31 events in 2010 and 26 during January-July of 2014 (from the entire number of 53 in the whole of 2014). An event with the highest K index value, being equal to 7, during the studied period was on 5 April 2010 (95th day of the year) at 9 a.m.
3. Characteristic Features of Transmission Lines in South Poland and General Reasons of Their Failures
Here we analyze failures of transmission lines in South Poland. This part of Poland is covered by tree type radial nets with a single power supply. There is also an option of backup power supply from another source point. It is accomplished by the Distribution System Operator (DSO) Tauron. DSO routines are based on modern technological solutions having the potential of guaranteeing the client’s security of supply. To execute its responsibility, DSO advances and modernizes its energy infrastructure. Their transmission network consists of power lines, power stations, distribution transformers, branches, and street lighting. This electric energy system covers ∼25% of the electricity grids in the Polish National Power System [47]. The Polish National System of high voltage lines presents a map (Figure 1) arranged by the European Network of Transmission System Operators for Electricity (ENTSOE, www.entsoe.eu). ENTSOE represents forty-two electricity transmission system operators from thirty-five European countries.
Electrical Grids Failures’ Classification
We have studied two-time intervals of the solar cycle 24: the whole year 2010 and January–July 2014. The first one was during an early rising phase of the solar activity cycle, around sunspot minimum and the second around solar maximum.
DSO logged 25,616 minor electrical grids failures (EGFs) in 2010. The failures’ causes were divided into sixteen various categories (see details in [16]). Over the first seven months of 2014, the System Operator registered 30,155 minor failures. Based on data from the DSO reports (www.tauron.pl/tauron/relacje-inwestorskie/raporty-okresowe in Polish), an increase appeared in the number of recipients of about 3.8% and the area covered by the distributor of about 7.4%. There was also growth noticed in the energy production of about 21.7% and in the length of transmission lines of about 25.7% between the years 2010 and 2014. Comparing the percentage of relative growth in the number of failures between 2010 and 2014, being around 50.4%, and the above-described development, we cannot expect that this increase in the number of failures was only due to the enlargement of the network.
The EGFs reasons were categorized into twenty-nine clusters. We have aggregated all these reasons into six, more general, groups from A to F. Similar categorization was used by Zois [18]. The EGFs occurrence rate in 2010 and in the first seven months of 2014 is presented in Table 1.

Table 1.
The number and main reasons for electrical transmission network failures in southern Poland in 2010 and January–July 2014.
The first three main groups (A–C) in Table 1 can be considered as impartial reasons. The next three (D–F), to some extent, can be linked to space weather effects. It gives us 4525 failures in 2010 and 10,656 in January–July of 2014, which may have a solar/geomagnetic origin, and only these failures are taken in further considerations. All the considered cases have been inspected using meteorological observations and measurements from the Institute of Meteorology and Water Management-National Research Institute (IMGW-PIB). One can see that during the first seven months of 2014, around the sunspot maximum, there were 2.4 times more failures in transmission lines, which could be attributable to the solar factors, than in 2010, around the sunspot minimum. The monthly average values of failures owing to the aging in 2010 varied from 0.0 up to 1.14, with the overall average, calculated as a mean of all considered monthly averages, being 0.62 and root mean square error, RMSE = 0.10, and in January–July 2014 varied from 1.55 up to 6.63, the total average 2.94 with RMSE = 0.66. For the failures having unidentified causes, the monthly averages in 2010 were from 0.02 to 2.41, with a total average of 0.84 and RMSE = 0.23. During the first seven months of 2014, mean values varied from 0.24 to 3.51, being averagely 1.55 with RMSE = 0.44. Failures originating from electronic devices breakdowns in 2010 had a mean value equal to 0.0. In 2014 it fluctuated from 0.0 up to 1.50, with an average of 0.56 with RMSE = 0.22. Hence, this quantitative distinction can be considered as a clear manifestation of dependency between failures’ number from the main groups (D-F) and the solar activity level. Details about solar activity impact may be found in [16,17]. Moreover, because meteorological effects (group A) in transmission lines failures were also more frequent in 2014, from meteorological observations and measurements provided by IMGW-PIB (https://dane.imgw.pl), we selected these meteorological effects, which were stated as the causes of failures in DSO reports. The data covered the southern part of Poland, and among them, there was information on the occurrence, duration, and strength of various types of effects. Detailed analyses have shown that in the first seven months of 2014, hail precipitation was 17 times more frequent than in the whole of 2010. Rime and snowfall appeared twice as often in the studied area in January–July 2014 than in the whole of 2010. During the first seven months of 2014, storms were 48% more frequent than in 2010, while gusty wind (15 m/s) appeared by 3% more often in 2014 than in 2010. The above data confirms the results contained in Table 1 that failures of power line components caused by meteorological effects were much more common in 2014 than in 2010.
4. Results and Discussion
Solar cycle 24 was much less active than, for instance, solar cycle 23, being somewhat analogous to cycles at the beginning of the XX century, when the Sun was pretty calm. In the course of this cycle, not many remarkable geomagnetic storms happened, and none of them was comparable to the Halloween Storm. During the examined time intervals, there were only a few cases when the geomagnetic K index from Belsk observatory was 5. The geomagnetic disturbances occurrence could not be indifferent to the functioning of the electrical infrastructure elements in Poland. Although there were no observed spectacular blackouts, the total number of electrical grids failures from general groups (D–F), which we suppose that might be connected, or at least strengthened by solar-induced phenomena (see Table 1), have grown around (with some delay) the time of geomagnetic disturbances. The mentioned delay (around one day) in EGFs emergence was shown by Gil et al. [16] using the method of superposed epoch analysis. This delay may be connected to some cumulative effect, for example, [18] due to the result of transient states and their propagation in the distribution network.
We compute geomagnetically induced currents based on the study by [48,49] with the induced surface geoelectric field according to the methodology introduced by Viljanen and Pirjola [50] and successfully used, for instance, to study St. Patrick’s Day geomagnetic storm [51]. We had performed our computations for each case when the K index from Belsk was ≥5. For every event, we have considered 1-min data of geomagnetic field components and from Belsk observatory at least one day before the first appearance of K value not less than five with an interesting event placed in the middle of the data-series.
We applied the uniform Earth’s simple model with resistivity () information for the first ∼100 km layer [48]. By assuming that the earth is a half-space, we can use a Cartesian coordinate system with the x-axis directed to the north, y to the east and z downwards, for example, [50]. In a spatially uniform electric field , GIC is given by formula , where are unit vectors. Constants depend only on the power grid parameters such as the geometry and resistances of the network [52]. Here we use after [53]. The horizontal electric field on the surface of the earth along power lines is defined using the following equations [50]:
where conductivity and magnetic permeability H/m, the electric field is related to the magnetic field by function describing a derivative over time of the magnetic component (for simplicity of the equations we omit subscripts: and ) and
with denoting a mean value for the interval and , (with n being an integer).
The same relation, of course, holds between and the geomagnetic field component expressed by the function . Thus, geoelectric field component can be written in the following way:
with and being an auxiliary function:
We present, as examples, the computed values for the three longest events during the studied periods, i.e., 5 April (Figure 2), 2 May 2010 (Figure 3) and 19 February 2014 (Figure 4). Analysis of all of the considered events showed that computed GICs grew after the time intervals when K index was greater than or equal to five (the second panel of Figure 2, Figure 3 and Figure 4).
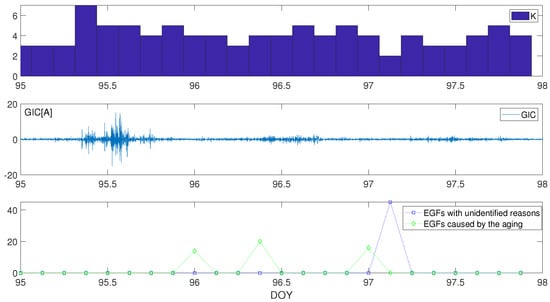
Figure 2.
K index from Belsk (3-h resolution), computed geomagnetically induced currents (1-min resolution) and electrical grids failures (EGFs) (3-h resolution) around 5–6 April 2010 (95–96 doy). On the horizontal axis is marked the day-of-year.
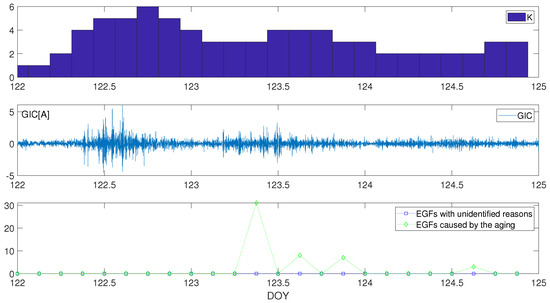
Figure 3.
K index from Belsk (3-h resolution), computed geomagnetically induced currents (1-min resolution) and electrical grids failures (EGFs) (3-h resolution) around 2 May 2010 (122 doy). On the horizontal axis is marked the day-of-year.
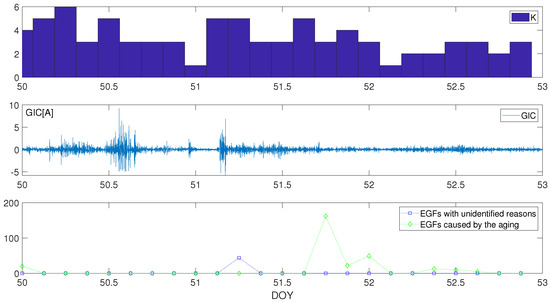
Figure 4.
K index from Belsk (3-h resolution), computed geomagnetically induced currents (1-min resolution) and electrical grids failures (EGFs) (3-h resolution) around 19 February 2014 (50 doy). On the horizontal axis is marked the day-of-year.
Figure 2 presents the computed GICs (the second panel) for the period when K index from Belsk (the first panel) reached the highest value for the studied time intervals, being equal to seven. Input data are 1-min data of and components. During day 95 of 2010, i.e., 5 April 2010, there was a rapid drop, first in the component, and a bit later in component, which resulted in producing a noticeable changeability in GIC. For this event, the computed GIC experienced the greatest absolute change mostly during the second half of the 95th day-of-year (doy).
Figure 3 displays computed GIC (the second panel) for the period around which K index (first panel) reached six on 2 May 2010. The input data of and components started their extensive variability on 2 May (122 doy), practically at the same time. At the second half of 2 May and the first half of 3 May, the highest fluctuations of the computed GIC appeared.
The second panel of Figure 4 depicts GIC calculated around the time of K = 6 on 19 February 2014 (50 doy 2014). The strongest changes in and components started on 50 doy, and after that GIC suffered sharp fluctuations during long hours of 50 and 51 doy.
In Figure 2, the lowest panel presents the number of occurrence of electrical grids failures, which might have been caused by the space weather effects, at the beginning of April 2010. One can see that after the time when a high changeability in the geomagnetic field and thus in computed GIC appeared there was observed (with some delay) an unquestionable increase from the background null number of failures up to around 20 in the case of EGFs owing to the aging of transmission line elements and even 45 unidentified reasons. At the lowest panel of Figure 3, it is shown that there was a pulse rise up to 31 in the number of EGFs connected to the aging of infrastructure elements. At the lowest panel of Figure 4, it is depicted that during and after time intervals of strong geomagnetic fluctuations in February 2014, there was a strong growth of electrical grid failures’ number in the categories D and F with the cumulative peak number equal to 162 in the group of failures due to the aging of the transmission line elements.
5. Conclusions
- The assessment of the electrical grid failures’ total number in the categories of failures, which might be connected to space weather effects near the solar minimum, i.e., in 2010 and around the sunspot maximum, January–July 2014, shows that the number of failures is twice larger in January–July 2014 than in 2010. Thus, it can be an indication of solar cycle phase dependency.
- The presented rapid growth of the number of electrical grids failures coincides in time (mostly with some delay) with an increase of geomagnetic activity mirrored in the increase of geoelectric field’ disturbances reflected in GICs. This suggests a link to the space weather effects.
- The delay in EGFs emergence may be connected to some cumulative effect due to the result of transient states and their propagation in the distribution network.
- Performed analysis implies that prominent phenomena having a solar origin had an impact on the efficiency of the transmission lines in southern Poland in 2010 and January–July 2014.
Author Contributions
Scientific content of the article: A.G.; methodology and performed analysis: A.G., A.W., R.M., A.S.; data collection: A.G., M.S., S.M., S.D.; discussion: A.G., A.W., R.M., M.S., M.P.; writing: A.G., A.W., R.M., M.S.; visualization: A.G., A.S., A.W, R.M. All authors have read and agreed to the published version of the manuscript.
Funding
The Polish National Science Centre, grant No. 2016/22/E/HS5/00406.
Acknowledgments
The Institute of Meteorology and Water Management-National Research Institute for the meteorological data (https://dane.imgw.pl). Data of geomagnetic field components Bx, By and K index are from Belsk observatory, being part of INTERMAGNET, (http://rtbel.igf.edu.pl/). NOAA space weather scales (https://www.swpc.noaa.gov/noaa-scales-explanation). We acknowledge the financial support by the Polish National Science Centre, grant no. 2016/22/E/HS5/00406.
Conflicts of Interest
The authors declare no conflict of interest.
Abbreviations
The following abbreviations are used in this manuscript:
| CME | Coronal Mass Ejection |
| DSO | Distribution System Operators |
| EGF | Electrical Grid Failure |
| GIC | Geomagnetically Induced Current |
| IMGW-PIB | The Institute Of Meteorology And Water Management-National Research Institute |
| NOAA | National Oceanic and Atmospheric Administration |
| SA | Solar Activity |
References
- Szmitkowski, P.; Zakrzewska, S.; Gil, A.; Swiderski, P. Capabilities of Polish power plants-advantages and threats. Przeglad Elektrotech. 2019, 95, 188–193. [Google Scholar] [CrossRef]
- Zakrzewska, S.; Gil-Swiderska, A. Energetic critical infrastructure in Poland—Perspectives and threats. Rynek Energii 2012, 5, 55–64. [Google Scholar]
- Zbunjak, Z.; Kuzle, I. System Integrity Protection Scheme (SIPS) Development and an Optimal Bus-Splitting Scheme Supported by Phasor Measurement Units (PMUs). Energies 2019, 12, 3404. [Google Scholar] [CrossRef]
- Lanzerotti, L.J. Space Weather: Historical and Contemporary Perspectives. Space Sci. Rev. 2017, 212, 1253–1270. [Google Scholar] [CrossRef]
- Lindborg, L.; Bartlett, D.; Beck, P.; McAulay, I.; Schnuer, K.; Schraube, H.; Spurny, F. Cosmic radiation exposure of aircraft crew: Compilation of measured and calculated data. Radiat. Protect. Dosim. 2004, 110, 417–422. [Google Scholar] [CrossRef]
- Sigurdson, A.J.; Ron, E. Cosmic radiation exposure and cancer risk among flight crew. Cancer Investig. 2004, 22, 743–761. [Google Scholar] [CrossRef]
- Hathaway, D.H. The Solar Cycle. Living Rev. Sol. Phys. 2015, 12. [Google Scholar] [CrossRef]
- Pirjola, R. Geomagnetically induced currents during magnetic storms. IEEE Trans. Plasma Sci. 2000, 28, 1867–1873. [Google Scholar] [CrossRef]
- Viljanen, A. Relation of Geomagnetically Induced Currents and Local Geomagnetic 700 Variations. IEEE Trans. Power Deliv. 1998, 13, 1285–1290. [Google Scholar] [CrossRef]
- Eastwood, J.P.; Biffis, E.; Hapgood, M.A.; Green, L.; Bisi, M.M.; Bentley, R.D.; Wicks, R.; McKinnell, L.A.; Gibbs, M.; Burnett, C. The Economic Impact of Space Weather: Where Do We Stand? Risk Anal. 2017, 37, 206–218. [Google Scholar] [CrossRef]
- Gaunt, C.T. Reducing uncertainty—Responses for electricity utilities to severe solar storms. J. Space Weather Space Clim. 2014. [Google Scholar] [CrossRef]
- Gaunt, C.T.; Coetzee, G. Transformer failures in regions incorrectly considered to have low GIC-risk. In Proceedings of the 2007 IEEE Lausanne Power Tech, Lausanne, Switzerland, 1–5 July 2007; pp. 807–812. [Google Scholar]
- Carter, B.A.; Yizengaw, E.; Pradipta, R.; Halford, A.J.; Norman, R.; Zhang, K. Interplanetary shocks and the resulting geomagnetically induced currents at the equator. Geophys. Res. Lett. 2015, 42, 6554–6559. [Google Scholar] [CrossRef]
- Carter, B.A.; Yizengaw, E.; Pradipta, R.; Weygand, J.M.; Piersanti, M.; Pulkkinen, A.; Moldwin, M.B.; Norman, R.; Zhang, K. Geomagnetically induced currents around the world during the 17 March 2015 storm. J. Geophys. Res. Space Phys. 2016, 121, 496–507. [Google Scholar] [CrossRef]
- Anuar, N.M.; Kasran, F.A.M.; Zatul, I.A.L.; Ab Rahim, S.A.E.; Manut, A.; Jusoh, M.H.; Hadi, N.A.; Yoshikawa, A. Estimation of Time Derivative of Horizontal Geomagnetic Component for GIC Assesment in Malaysia during Quiet Period. In Proceedings of the 8th International Conference on System Engineering and Technology (ICSET), Bandung, Indonesia, 15–16 October 2018; Institute of Electrical and Electronics Engineers Inc.: Bandung, Indonesia, 2018; pp. 118–122. [Google Scholar]
- Gil, A.; Modzelewska, R.; Moskwa, S.; Siluszyk, A.; Siluszyk, M.; Wawrzynczak, A.; Zakrzewska, S. Does time series analysis confirms the relationship between space weather effects and the failures of electrical grids in South Poland? J. Math. Ind. 2019, 9. [Google Scholar] [CrossRef]
- Vybostokova, T.; Svanda, M. Statistical Analysis of the Correlation between Anomalies in the Czech Electric Power Grid and Geomagnetic Activity. Space Weather 2019, 17, 1208–1218. [Google Scholar] [CrossRef]
- Zois, J.P. Solar activity and transformer failures in the Greek national electric grid. J. Space Weather Space Clim. 2013. [Google Scholar] [CrossRef]
- Tozzi, R.; De Michelis, P.; Coco, I.; Giannattasio, F. A preliminary risk assessment of geomagnetically induced currents over the Italian territory. Space Weather 2019, 17, 46–58. [Google Scholar] [CrossRef]
- Clilverd, M.A.; Rodger, C.J.; Brundell, J.B.; Dalzell, M.; Martin, I.; Mac Manus, D.H.; Thomson, N.R.; Petersen, T.; Obana, Y. Long-lasting geomagnetically induced currents and harmonic distortion observed in New Zealand during the 7–8 September 2017 disturbed period. Space Weather 2018, 16, 704–717. [Google Scholar] [CrossRef]
- Bolduc, L. GIC observations and studies in the Hydro Qubec power system. J. Atmos. Sol. Terr. Phys. 2002, 64, 1793–1802. [Google Scholar] [CrossRef]
- Boteler, D.H.; Pirola, R.J.; Nevanlinna, H. The effects of geomagnetic disturbances on electrical systems at the Earth’s surface. Adv. Space Res. 1998, 22, 17–27. [Google Scholar] [CrossRef]
- Makinen, T. Geomagnetically Induced Currents in the Finnish Power Transmission System; Finnish Meteorological Institute, Geophysical Publications: Helsinki, Finland, 1993. [Google Scholar]
- Watari, S.; Kunitake, M.; Kitamura, K.; Hori, T.; Kikuchi, T.; Shiokawa, K.; Nishitani, N.; Kataoka, R.; Kamide, Y.; Aso, T.; et al. Measurements of geomagnetically induced current in a power grid in Hokkaido, Japan. Space Weather 2009. [Google Scholar] [CrossRef]
- Mac Manus, D.H.; Rodger, C.J.; Dalzell, M.; Thomson, A.W.P.; Clilverd, M.A.; Petersen, T.; Wolf, M.M.; Thomson, N.R.; Divett, T. Long term Geomagnetically Induced Current Observations in New Zealand: Earth return Corrections and Geomagnetic Field Driver. Space Weather 2017, 15, 1020–1038. [Google Scholar] [CrossRef]
- Rodger, C.J.; Mac Manus, D.H.; Dalzell, M.; Thomson, A.W.P.; Clarke, E.; Petersen, T.; Divett, T. Longterm geomagnetically induced current observations from New Zealand: Peak current estimates for extreme geomagnetic storms. Space Weather 2017, 15, 1447–1460. [Google Scholar] [CrossRef]
- Pulkkinen, A.; Lindahl, S.; Viljanen, A.; Pirjola, R. Geomagnetic storm of 29–31 October 2003: Geomagnetically induced currents and their relation to problems in the Swedish high-voltage power transmission system. Space Weather 2005. [Google Scholar] [CrossRef]
- Thorberg, R. Risk Analysis of Geomagnetically Induced Currents in Power Systems. Available online: http://www.iea.lth.se/publications/MS-Theses/Fulldocument/5296$_{}$full$_{}$document$_{}$GIC.pdf (accessed on 1 March 2020).
- Wik, M. The Sun, Space Weather and Effects. Ph.D. Thesis, Department of Physics, Lund University, Lund, Sweden, 2008. [Google Scholar]
- Marusek, J.A. Solar Storm Threat Analysis. Impact. Indiana. Available online: https://pdfs.semanticscholar.org/9fa3/16d0b9bb073d9826d9d4295b36e0f282d3eb.pdf (accessed on 26 November 2019).
- Ramsingh, S.S.; SrLeekumar, S.; Banola, S.; Emperumal, K.; Tiwari, P.; Kumar, B.S. Low-latitude ionosphere response to super geomagnetic storm of 17/18 March 2015: Results from a chain of ground-based observations over Indian sector. J. Geophys. Res. Space Phys. 2015, 120, 10864–10882. [Google Scholar] [CrossRef]
- Kozyreva, O.V.; Pilipenko, V.A.; Belakhovsky, V.B.; Sakharov, Y.A. Ground geomagnetic field and GIC response to March 17, 2015, storm. Earth Planets Space 2018. [Google Scholar] [CrossRef]
- Kamide, Y.; Kusano, K. No major solar flares but the largest geomagnetic storm in the present solar cycle. Space Weather 2015, 13, 365–367. [Google Scholar] [CrossRef]
- Cannon, P.S. Extreme Space Weather: Impacts on Engineered Systems and Infrastructure; Royal Academy of Engineering: London, UK, 2013; Available online: http://www.raeng.org.uk/publications/reports/space-weather-full-report (accessed on 26 November 2019).
- Juusola, L.; Viljanen, A.; Van de Kamp, M.; Tanskanen, E.I.; Vanhamaki, H.; Partamies, N.; Kauristie, K. High-latitude ionospheric equivalent currents during strong space storms: Regional perspective. Space Weather 2015, 13, 49–60. [Google Scholar] [CrossRef]
- Oughton, E.J.; Skelton, A.; Horne, R.B.; Thomson, A.W.P.; Gaunt, C.T. Quantifying the daily economic impact of extreme space weather due to failure in electricity transmission infrastructure. Space Weather 2017, 15, 65–83. [Google Scholar] [CrossRef]
- Pulkkinen, A.; Viljanen, A.; Pirjola, R. Estimation of geomagnetically induced current levels from different input data. Space Weather 2006. [Google Scholar] [CrossRef]
- Schulte in den Bäumen, H.; Moran, D.; Lenzen, M.; Cairns, I.; Steenge, A. How severe space weather can disrupt global supply chains. Nat. Hazards Earth Syst. Sci. 2014, 14, 2749–2759. [Google Scholar] [CrossRef]
- Schrijver, C.J.; Dobbins, R.; Murtagh, W.; Petrinec, S.M. Assessing the impact of space weather on the electric power grid based on insurance claims for industrial electrical equipment. Space Weather 2014, 12, 487–498. [Google Scholar] [CrossRef]
- Menvielle, M.; Iyemori, T.; Marchaudon, A.; Nosé, M. Geomagnetic Indices. In Geomagnetic Observations and Models; Mandea, M., Korte, M., Eds.; IAGA Special Sopron Book Series; Springer: Dordrecht, The Netherlands, 2011; Volume 5. [Google Scholar]
- Jankowski, J.; Sucksdorff, C. Guide for Magnetic Measurements and Observatory Practice; PAN Press: Warsaw, Poland, 1996. [Google Scholar]
- Love, J.J. Magnetic monitoring of Earth and space. Phys. Today 2008, 61, 31–37. [Google Scholar] [CrossRef]
- Bartels, J.; Heck, N.H.; Johnston, H.F. The three-hour-range index measuring geomagnetic activity. Terr. Magnet. Atmos. Electr. 1939, 44, 411–454. [Google Scholar] [CrossRef]
- Rasson, J.J. Observatories, instrumentation. In Encyclopedia of Geomagnetism and Paleomagnetism; Gubbins, D., Herrero-Bervera, E., Eds.; Springer: New York, NY, USA, 2007; pp. 711–713. [Google Scholar]
- Love, J.J.; Chulliat, A. An International Network of Magnetic Observatories. EOS 2013, 94, 373–374. [Google Scholar] [CrossRef]
- Nowozynski, K.; Ernst, T.; Jankowski, J. Adaptive smoothing method for computer derivation of K-indices. Geophys. J. Int. 1991, 104, 85–93. [Google Scholar] [CrossRef]
- Szmitkowski, P.; Gil-Swiderska, A.; Zakrzewska, S. Electrical energy infrastructure in Poland and its sensitivity to failures as part of the energy security system. Energy Policy J. 2019, 22, 59–80. [Google Scholar] [CrossRef]
- Adam, A.; Pracser, E.; Wesztergom, V. Estimation of the electric resistivity distribution (EURHOM) in the European lithosphere in the frame of the EURISGIC WP2 project. Acta Geod. Geophys. Hung. 2012, 47, 377–387. [Google Scholar] [CrossRef]
- Viljanen, A.; Pirjola, R.; Wik, M.; Adam, A.; Pracser, E.; Sakharov, Y.; Katkalov, J. Continental scale modelling of geomagnetically induced currents. J. Space Weather Space Clim. 2012. [Google Scholar] [CrossRef]
- Viljanen, A.; Pirjola, R. Statistics on geomagnetically-induced currents in the Finnish 400 kV power system based on recordings of geomagnetic variations. J. Geomagnet. Geoelectr. 1989, 41, 411–420. [Google Scholar] [CrossRef]
- Demetrescu, C.; Dobrica, V.; Greculeasa, R.; Stefan, C. The induced surface electric response in Europe to 2015 St. Patrick’s Day geomagnetic storm. J. Atmos. Sol. Terr. Phys. 2018, 180, 106–115. [Google Scholar] [CrossRef]
- Pirjola, R.; Lehtinen, M. Currents produced in the Finnish 400 kV power transmission grid and in the Finnish natural gas pipeline by geomagnetically induced electric fields. Ann. Geophys. 1985, 3, 485–491. [Google Scholar]
- Wik, M.; Viljanen, A.; Pirjola, R.; Pulkkinen, A.; Wintoft, P.; Lundstedt, H. Calculation of geomagnetically induced currents in the 400 kV power grid in southern Sweden. Space Weather 2008, 6, 7. [Google Scholar] [CrossRef]


© 2020 by the authors. Licensee MDPI, Basel, Switzerland. This article is an open access article distributed under the terms and conditions of the Creative Commons Attribution (CC BY) license (http://creativecommons.org/licenses/by/4.0/).