Article

Decision-Making Process in the Circular Economy: A Case Study on University Food Waste-to-Energy Actions in Latin America

by
Laura Brenes-Peralta
1,
María F. Jiménez-Morales
2,
Rooel Campos-Rodríguez
2,
Fabio De Menna
1,* and
Matteo Vittuari
1
1
Department of Agricultural and Food Sciences, University of Bologna, 40127 Bologna, Italy
2
Agribusiness School, Tecnológico de Costa Rica, Cartago 30101, Costa Rica
*
Author to whom correspondence should be addressed.
Energies 2020, 13(9), 2291; https://doi.org/10.3390/en13092291
Submission received: 2 April 2020 / Revised: 21 April 2020 / Accepted: 25 April 2020 / Published: 6 May 2020

Abstract

:
Economies have begun to shift from linear to circular, adopting, among others, waste-to-energy approaches. Waste management is known to be a paramount challenge, and food waste (FW) in particular, has gained the interest of several actors due to its potential impacts and energy recovery opportunities. However, the selection of alternative valorization scenarios can pose several queries in certain contexts. This paper evaluates four FW valorization scenarios based on anaerobic digestion and composting, in comparison to landfilling, by applying a consistent decision-making framework through a combination of linear programming, Life Cycle Thinking (LCT), and Analytic Hierarchy Process (AHP). The evaluation was built upon a case study of five universities in Costa Rica and portrayed the trade-offs between environmental impacts and cost categories from the scenarios and their side flows. Results indicate that the landfill scenario entails higher Global Warming Potential and Fresh Water Eutrophication impacts than the valorization scenarios; however, other impact categories and costs are affected. Centralized recovery facilities can increase the Global Warming Potential and the Land Use compared to semi-centralized ones. Experts provided insights, regarding the ease of adoption of composting, in contrast to the potential of energy sources substitution and economic savings from anaerobic digestion.

1. Introduction

The circular economy is regarded as a sustainable economic system that reduces raw material extraction and recirculates resources, while creating benefits to society, industries, and the environment [1]. Strategies for its achievement include principles from various schools of thought, where designing out what is commonly observed as waste is fundamental [2] because of the value remaining in these materials. Waste, together with productive activities and transport, are relevant sources of environmental degradation and impacts, such as global warming, which involves a significant risk for humanity [3]. Ordinary waste entails almost 50% of organic sources approximately, and food waste (FW) is the highest contributor of that organic fraction [4]. Globally, it is accountable for 4.4 Gt CO2 eq per year [5]. Consequently, the disregard of FW causes economic, social, and environmental constraints [6,7].
Target 12.3 of the Sustainable Development Goals (SDG) aims to halve FW by 2030 [8], and in pursuit of that reduction, the “food use-not-waste” hierarchy embraces alternatives from most to less desirable, similar to the waste management hierarchy from the EU Waste Framework Directive 2008/98/EC [9,10]. FW management begins with the prevention and optimization of food use and supply. Actions include the avoidance of FW throughout the supply chain, as well as the donation and redistribution of surplus for human consumption when possible, and then the allocation to animal feed or non-food product transformation. Once FW occurs, it shall be valorized and treated through recycling and energy recovery, before landfilling [9,10,11]. That final disposal is commonly perceived as the least preferable option, due to its high environmental implications, such as emissions to soil, water, and air, occurring during biowaste degradation [10].
The interest in the circular economy and FW reduction in food systems rests, among other reasons, on the fact that this sector is high in energy demand, and suffers from intake-output energy imbalances [12]. Therefore, the recovery of currently wasted energy embodied in FW can represent an opportunity to recirculate energy into human activities again, thus aiding into more sustainable systems.
Depending on FW composition, anaerobic digestion and composting, are regarded as suitable options for energy recovery [12]. Anaerobic Digestion (AD) consists of the anaerobic degradation of the residues while generating biogas and digestate, which can be used as fertilizer with lower environmental impacts [13,14,15,16]. Even when suggesting the fittingness of the obtained by-products from this alternative, various authors recommend a close observation in regards to the source and composition of the FW and co-digesting materials, and the technical and economic potential challenges [17,18,19,20]. Composting (CP) is defined as the controlled organic waste degradation through biological agents, suitable to treat the biological fraction of ordinary waste [10], resulting in a rich soil substrate. Experiences using the Takakura composting method has proven it to be an efficient option for food and garden biowaste treatment [21], while remaining a relatively easy-to-adopt practice at domestic or larger scales [22,23].
Even when preferred over landfilling, FW valorization will also have recognized risks and embedded effects, due to emissions, transport, degradation, and labor [22,24]. Therefore, decision-making processes to support the selection of one option or another are not simple. Life Cycle Thinking (LCT) is considered to be an apt approach to evaluate food waste valorization alternatives through methods like Life Cycle Assessment (LCA) and Environmental Life Cycle Costing (E-LCC) [7,25,26,27]. In addition, multicriteria decision methods can aid managers and policy-makers from different levels to analyze the trade-offs offered by science-based evidence from the evaluation of different alternatives [28].
Several studies in certain regions such as Latin America and the Caribbean, focus on waste generation and composition analysis [4,29,30,31,32] and few of them directly involve LCT [33] or decision-making approaches for waste management, neither a combination of those. Therefore, gaps in literature availability and decisional frameworks, suggest integrated approaches are required [34]. Enormous amounts of biomass are possibly available for circular strategies in this Region, since 54% of the 160 million tons of its yearly waste belonging to biowaste, is generally disposed in landfills [31]. Even when a regional agreement or framework for bioeconomy is lacking, Latin American countries have recently begun to undertake specific policies towards a circular economy and food waste valorization [35]. Costa Rica, in particular, launched several initiatives on this matter, such as the inter-sectorial actions led by the Costa Rican Food Loss and Waste Network [36], the National Policy on Sustainable Production and Consumption [37], the National Decarbonisation Strategy [38], and the Integrated Waste Management Law no.8839 [39]. On one hand, these policies motivate different stakeholders to pursue FW valorization actions; on the other, it enables actions that would directly support further steps into the achievement of the SDGs, such as less FW generation and waste management alternatives with lower emissions.
This paper evaluates FW valorization alternatives and compares them to the business-as-usual FW landfilling, through a combination of methods that includes linear programming to determine an optimal collection route for the waste, environmental and economic potential impacts analysis through a system-expanded LCA and E-LCC, and the prioritization of alternatives through an Analytic Hierarchy Process (AHP). The evaluation was built upon a case study of five universities, and it is one of the first assessments of this kind in Costa Rica and the Latin American region. The final aim is to contribute to decision-making processes to move into more circular approaches at the university consortium level, but also at the local level by offering a consistent framework to support actions to valorize FW. Potentially, the study can help other similar institutions, small communities or even small municipalities to plan for their biodegradable waste management in small centralized or semi-centralized units, and prioritize sustainable approaches to address food waste.

2. Materials and Methods

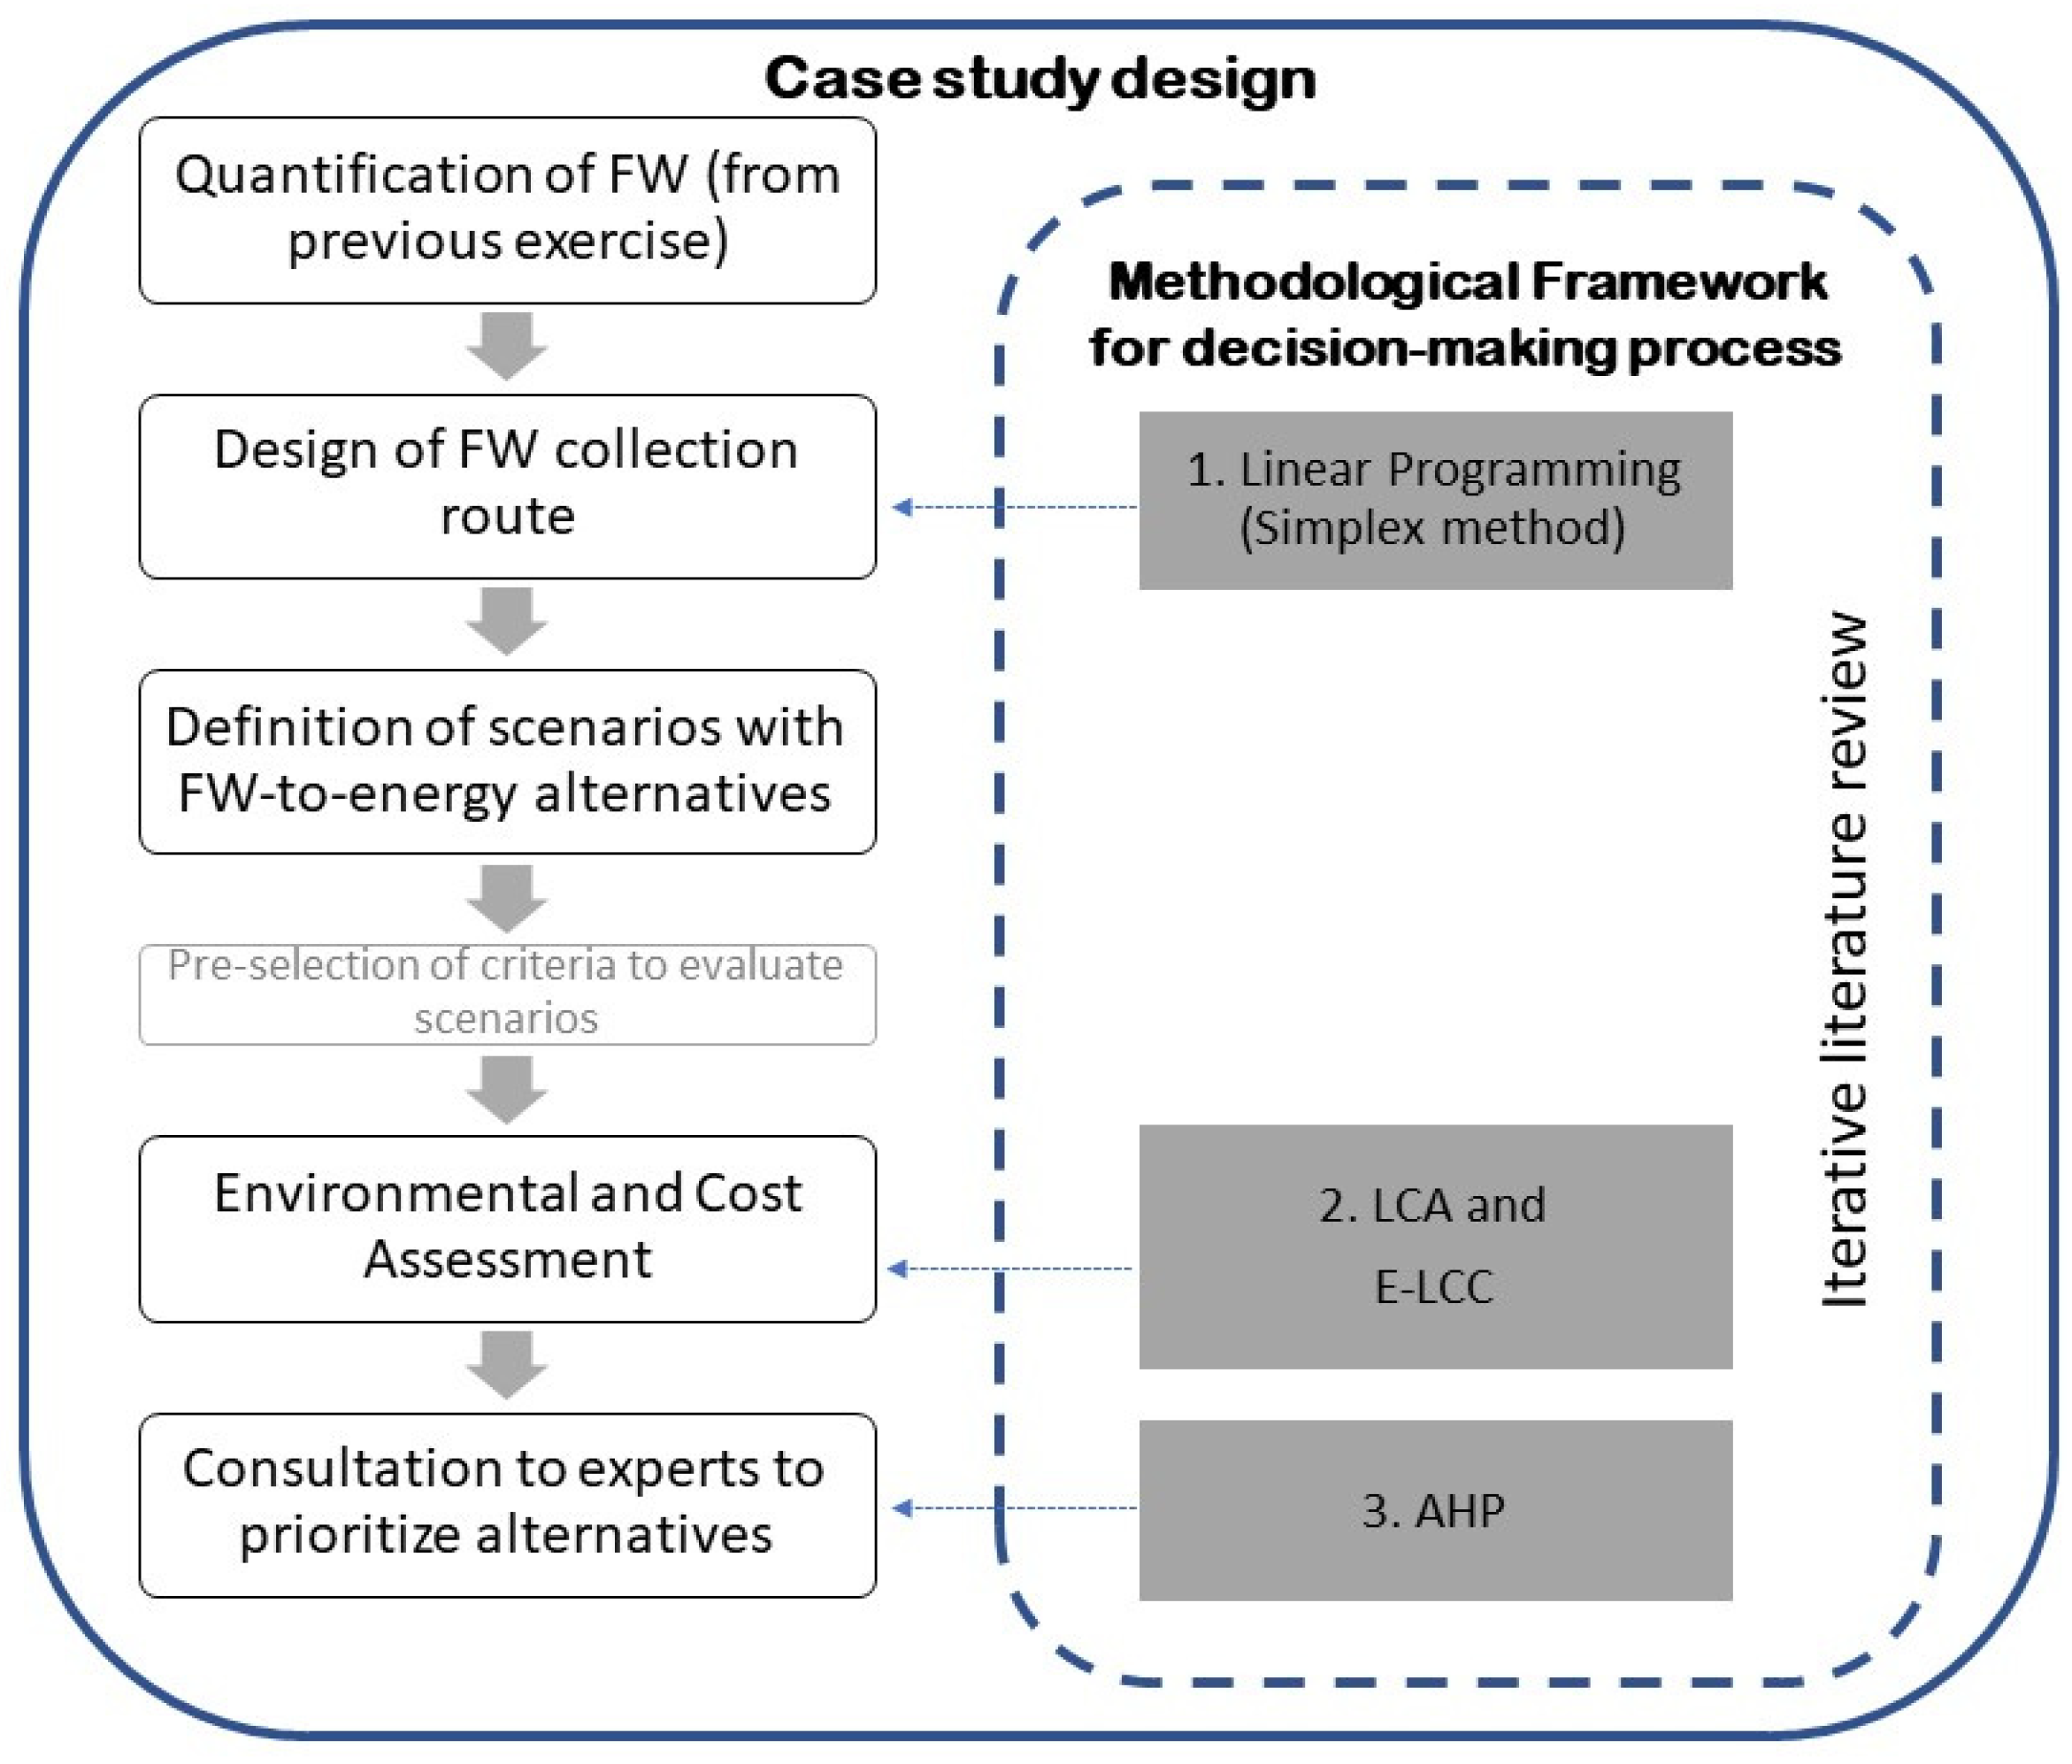
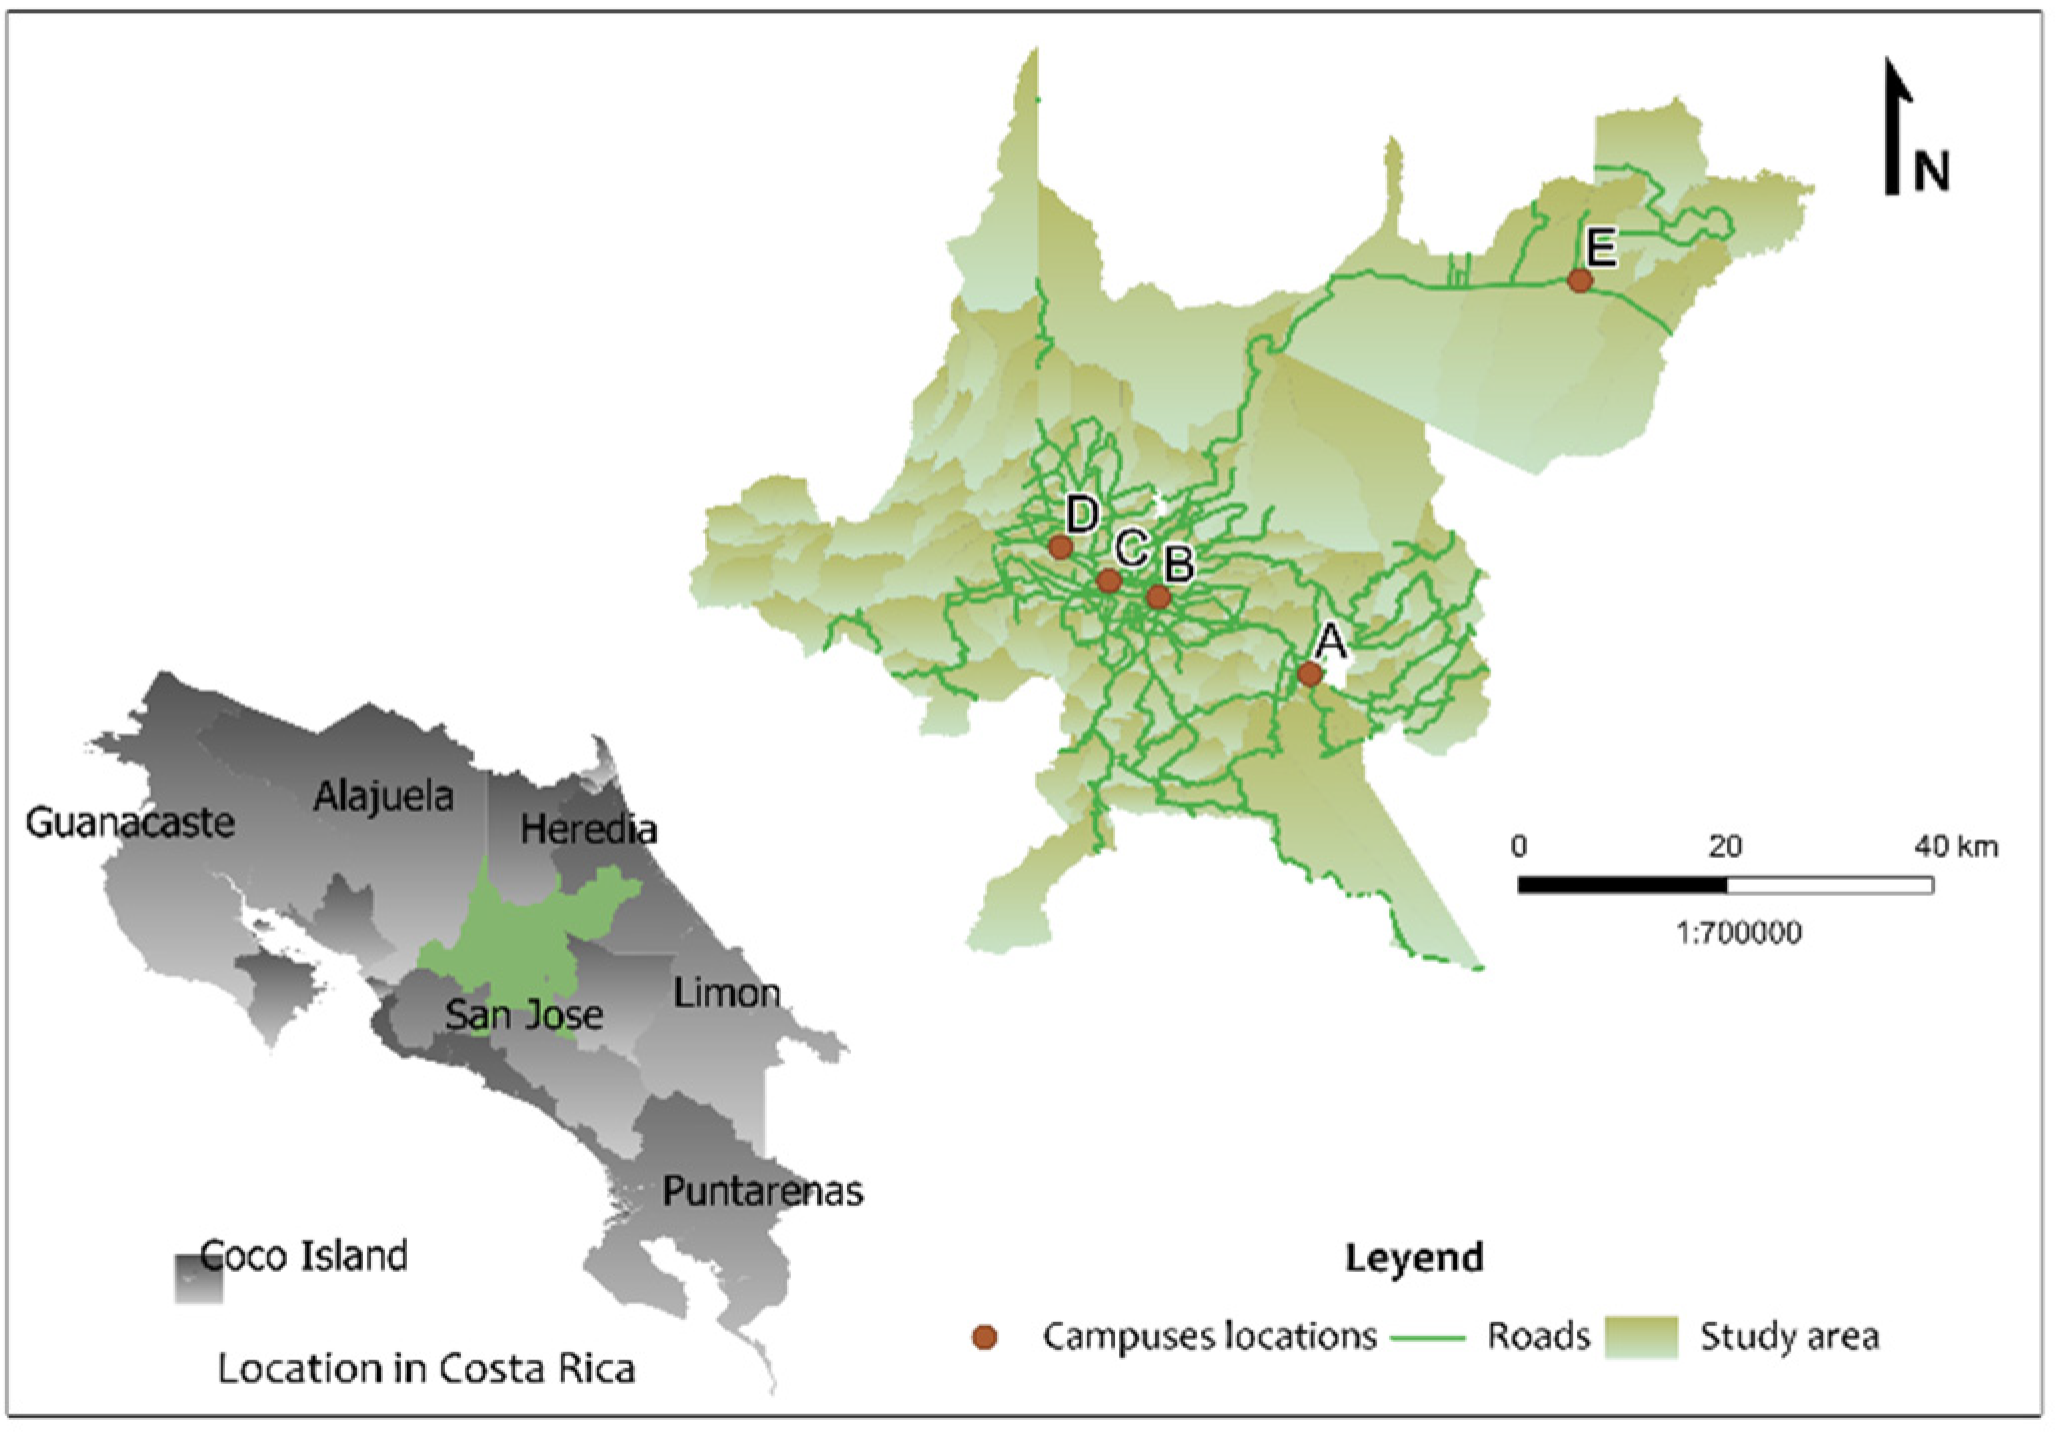
2.1. Methodological Framework and Case Description

This case study proposed a decision-making process for food waste-to-energy scenarios, through their evaluation and comparison to a business-as-usual scenario, landfill (LF).
It aggregated the FW from a consortium of five universities located in and nearby the Central Valley of Costa Rica, belonging to a national network of sustainable education institutions called REDIES. Rojas-Vargas et al. [30] determined the amount of FW generated in these university canteens using the standardized guidelines to measure FW in restaurants provided by the Costa Rican Food Loss and Waste Network [40]. That first and only available formal study on FW quantification for a group of universities in the country amounted 2.607 tonnes of FW per week, with an operative service of 45 weeks, given their academic calendar. There are different food waste definitions; and this paper adopts the FW conceptualization reported by the FUSIONS definitional framework that describes it as “any food, and inedible parts of food, removed from the food supply chain to be recovered or disposed” [41].
Being the landfilling disposal a common practice in Costa Rica, and generally in Latin America, this study proposed to follow the “food use-not-waste” hierarchy [9], which can be easily aligned to the Costa Rican Waste Management Law [39] and the REFRESH Generic strategy for LCA and LCC [42]. This study proposed to move from a situation where FW was disposed at the landfill, to a situation of valorization, or food waste-to-energy alternatives. This perspective was similar to the one described by the REFRESH strategy as REFRESH Situation (RS) RS 4 to RS 3, since the university consortium would agree to hand over the FW for valorization as part of their waste management (RS 3) instead of sending it to an end-of-life treatment or landfill (RS 4) as presented in Figure 1.
Anaerobic Digestion (AD) and Composting (CP) are among the alternatives to be considered, generating a side flow that has some value with the potential to replace a product on the market.
The overall methodological framework, accompanied by an iterative literature review, combined three methods (Figure 2) in a step-wise sequence.
The first method aimed to define the FW valorization sites and collection routes, through Linear programming. This led to two possible route designs that were used to model four FW valorization scenarios. Once the scenarios were defined and supported by literature reviews and by experts, a pre-selection of evaluation criteria was considered to later conduct a system-expanded LCA and E-LCC, which considered the impacts caused by the valorization scenarios, as well as the avoided impacts since FW would be diverted from LF and side flows would be utilized. LCA and E-LCC allowed to observe the performance of each scenario in terms of the environmental impacts and costs categories, offering relevant data for an experts’ assessment developed through the third applied method of this framework: the AHP. This latter allowed to prioritize the scenarios within the local context and following a science-to-expert approach.

2.2. Route Optimization

Since the five universities have accredited environmental managers and operate under the university autonomy principle, it was assumed that they could potentially treat the FW and would agree on diverting the FW from a business-as-usual to a valorization scenario. Therefore, a simulation of an FW collection route was performed for this consortium. First, the FW valorization plant location was evaluated, through a decision matrix defined by the researchers, with four criteria and the following qualification scale and weight, based on similar techniques presented by various authors [43,44]:
  • Space availability to install the waste valorization plant: this criterium would receive a binomial response, where a value of 1 will be assigned if the campus had an available area of at least 250 m2 where a waste valorization plant can be established without negatively affecting the university activities, 0 would be given if that space was not available. This area (m2) was selected base on the experience and observation of biowaste treatment facilities in municipalities and institutions;
  • Technical capacity to operate an FW treatment process: with a binomial response also, the site would receive a score of 1 if there was a minimum of one professional at campus capable and knowledgeable in waste management at least at the pilot scale, 0 if that kind of professional was unavailable;
  • Available infrastructure: the binomial qualification for this criterion would consist of assigning a value of 1 if the campus had at least one operative anaerobic digestor or composter to process the FW, 0 if they did not have any infrastructure for FW treatment;
  • FW quantity: a 5-value scale was assigned in this criterion, where 5 corresponds to the highest FW quantity generated within the group of campuses, and 1 for the smallest amount of FW.
Each criterion was weighted [43,44,45,46] from a full score of 100%, as follows: a weight of 15% was assigned to technical capacity, supported by a law requirement in the country, a 25% weight was assigned to space availability and FW quantity, since they would have a higher impact than the previous criterion but in equal conditions among themselves. Finally, a 35% weight was assigned to available infrastructure, since it would have higher importance than the previous in terms of the possibility of short-term establishment of the valorization alternatives and budget implications. The location(s) with the highest score were to be selected to install the FW valorization facility since it would have available space, technical capacities, available infrastructure and higher amounts of FW to process.
Afterwards, the researchers calculated the average distances between each FW generation site (institutions) using Google maps. This allowed us to obtain the distance in kilometers between each two points, later used in the route design, with the assumption that budget constraints in the universities would only allow one truck for a weekly FW transportation. The five institutions were codified as A, B, C, D and E, corresponding to the five campuses of this study (Figure 3). A value matrix was set up with the average distances between each two points (Table 1) and modeled by linear programming, using the Simplex LP Method [47] and the Solver Tool from Microsoft ® Excel ® (2019 MSO Version, Microsoft Corporation ©, Redmond, WA, USA), to obtain the optimal route by minimizing the total distance.
Due to the farther distance from location E to the rest of the group, a second linear programming model was calculated (Table 2).
Two routes were calculated, one that would accept all the FW from the first four generation sites and deliver it at the fifth campus for centralized valorization (coded as 1), and a second route that would consist of a semi-centralized valorization where more than one campus would be in charge of processing the FW (coded as 2). The obtained data was later used in the LCA and E-LCC to compare the effect of the two routes on each FW valorization alternatives.

2.3. LCA and LCC

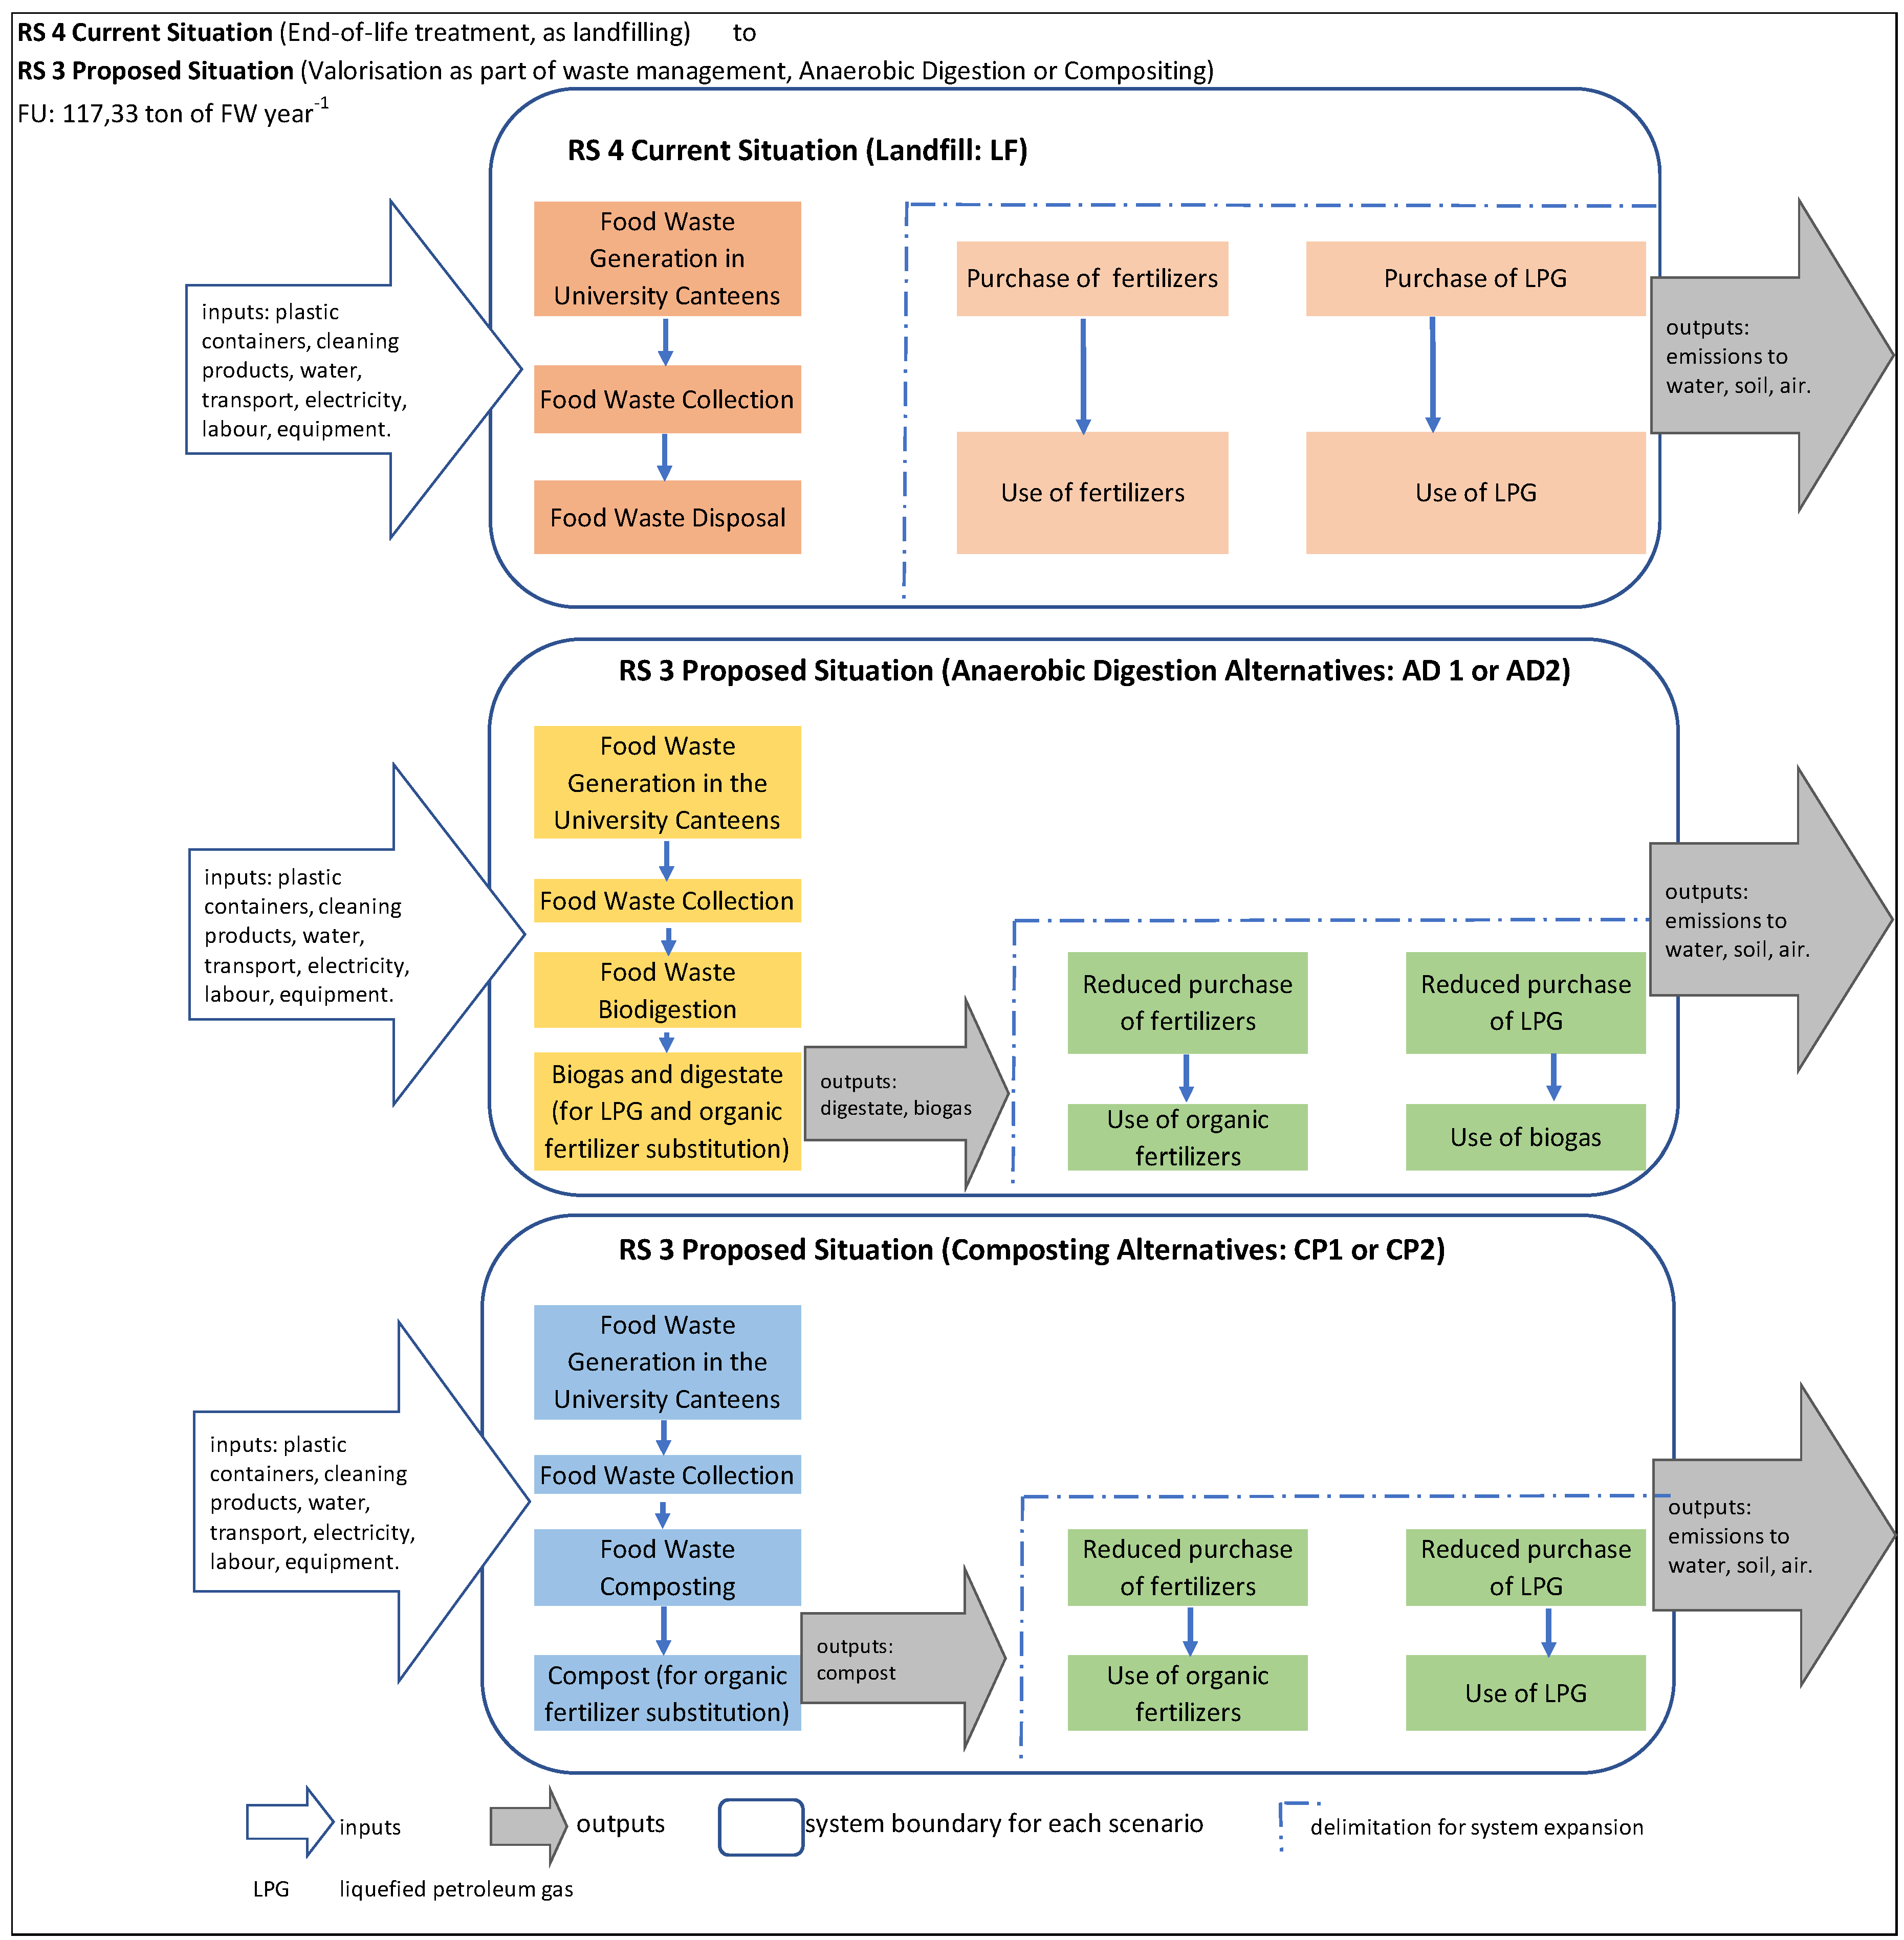
2.3.1. Goal and Scope

Following the ISO14040 Standard [48] and Hunkeler D., Lichtenvort K., and Rebitzer, G. [49] respectively, LCA and E-LCC were used to understand the environmental and economic effects the consortium of universities would have as a result of moving from a business-as-usual to an FW valorization scenario. This consortium with already well-established FW measurement and environmental management units, defined the system boundaries from gate to gate: from the FW generation point to the campus where the valorization facilities would be established and side flows would be obtained [42,50]. These side flows, have an already existing market value in Costa Rica [51] and could be used by the same university or a third party, who would collect them at the campus gate.

2.3.2. Reference Flows and Functional Unit

The study uses a reference flow that consists of a mass-based unit for the LCA and monetary-based units for the E-LCC, considering as functional unit (FU) the amount of treated FW per year: 117.3 t of FW per year.

2.3.3. Environmental Impact Categories, Cost Elements and Assessment Methods

Literature reviews, the criteria of the researchers and a set of three advisors with international, regional and national experience in FW and waste management suggested the main indicators to evaluate the alternatives. The two main environmental impacts were Gobal Warming Potential and Land-Use, both consistent with the recommended categories in FW LCA analysis, as well as with Costa Rican aim on decarbonization. Midpoint indicators were preferred by this study in order to observe particular impact categories for this type of FW valorization processes. Therefore, the ReCiPe 2016 midpoint method, Hierarchic version (developed by RIVM, Radboud University Nijmegen, Leiden University and PRé Sustainability) was applied using SimaPro (Version 9.0.0.49, PRè Consultants ©, Amersfoort, The Netherlands). In general, the study calculated these potential environmental impacts, focusing mostly on the first two:
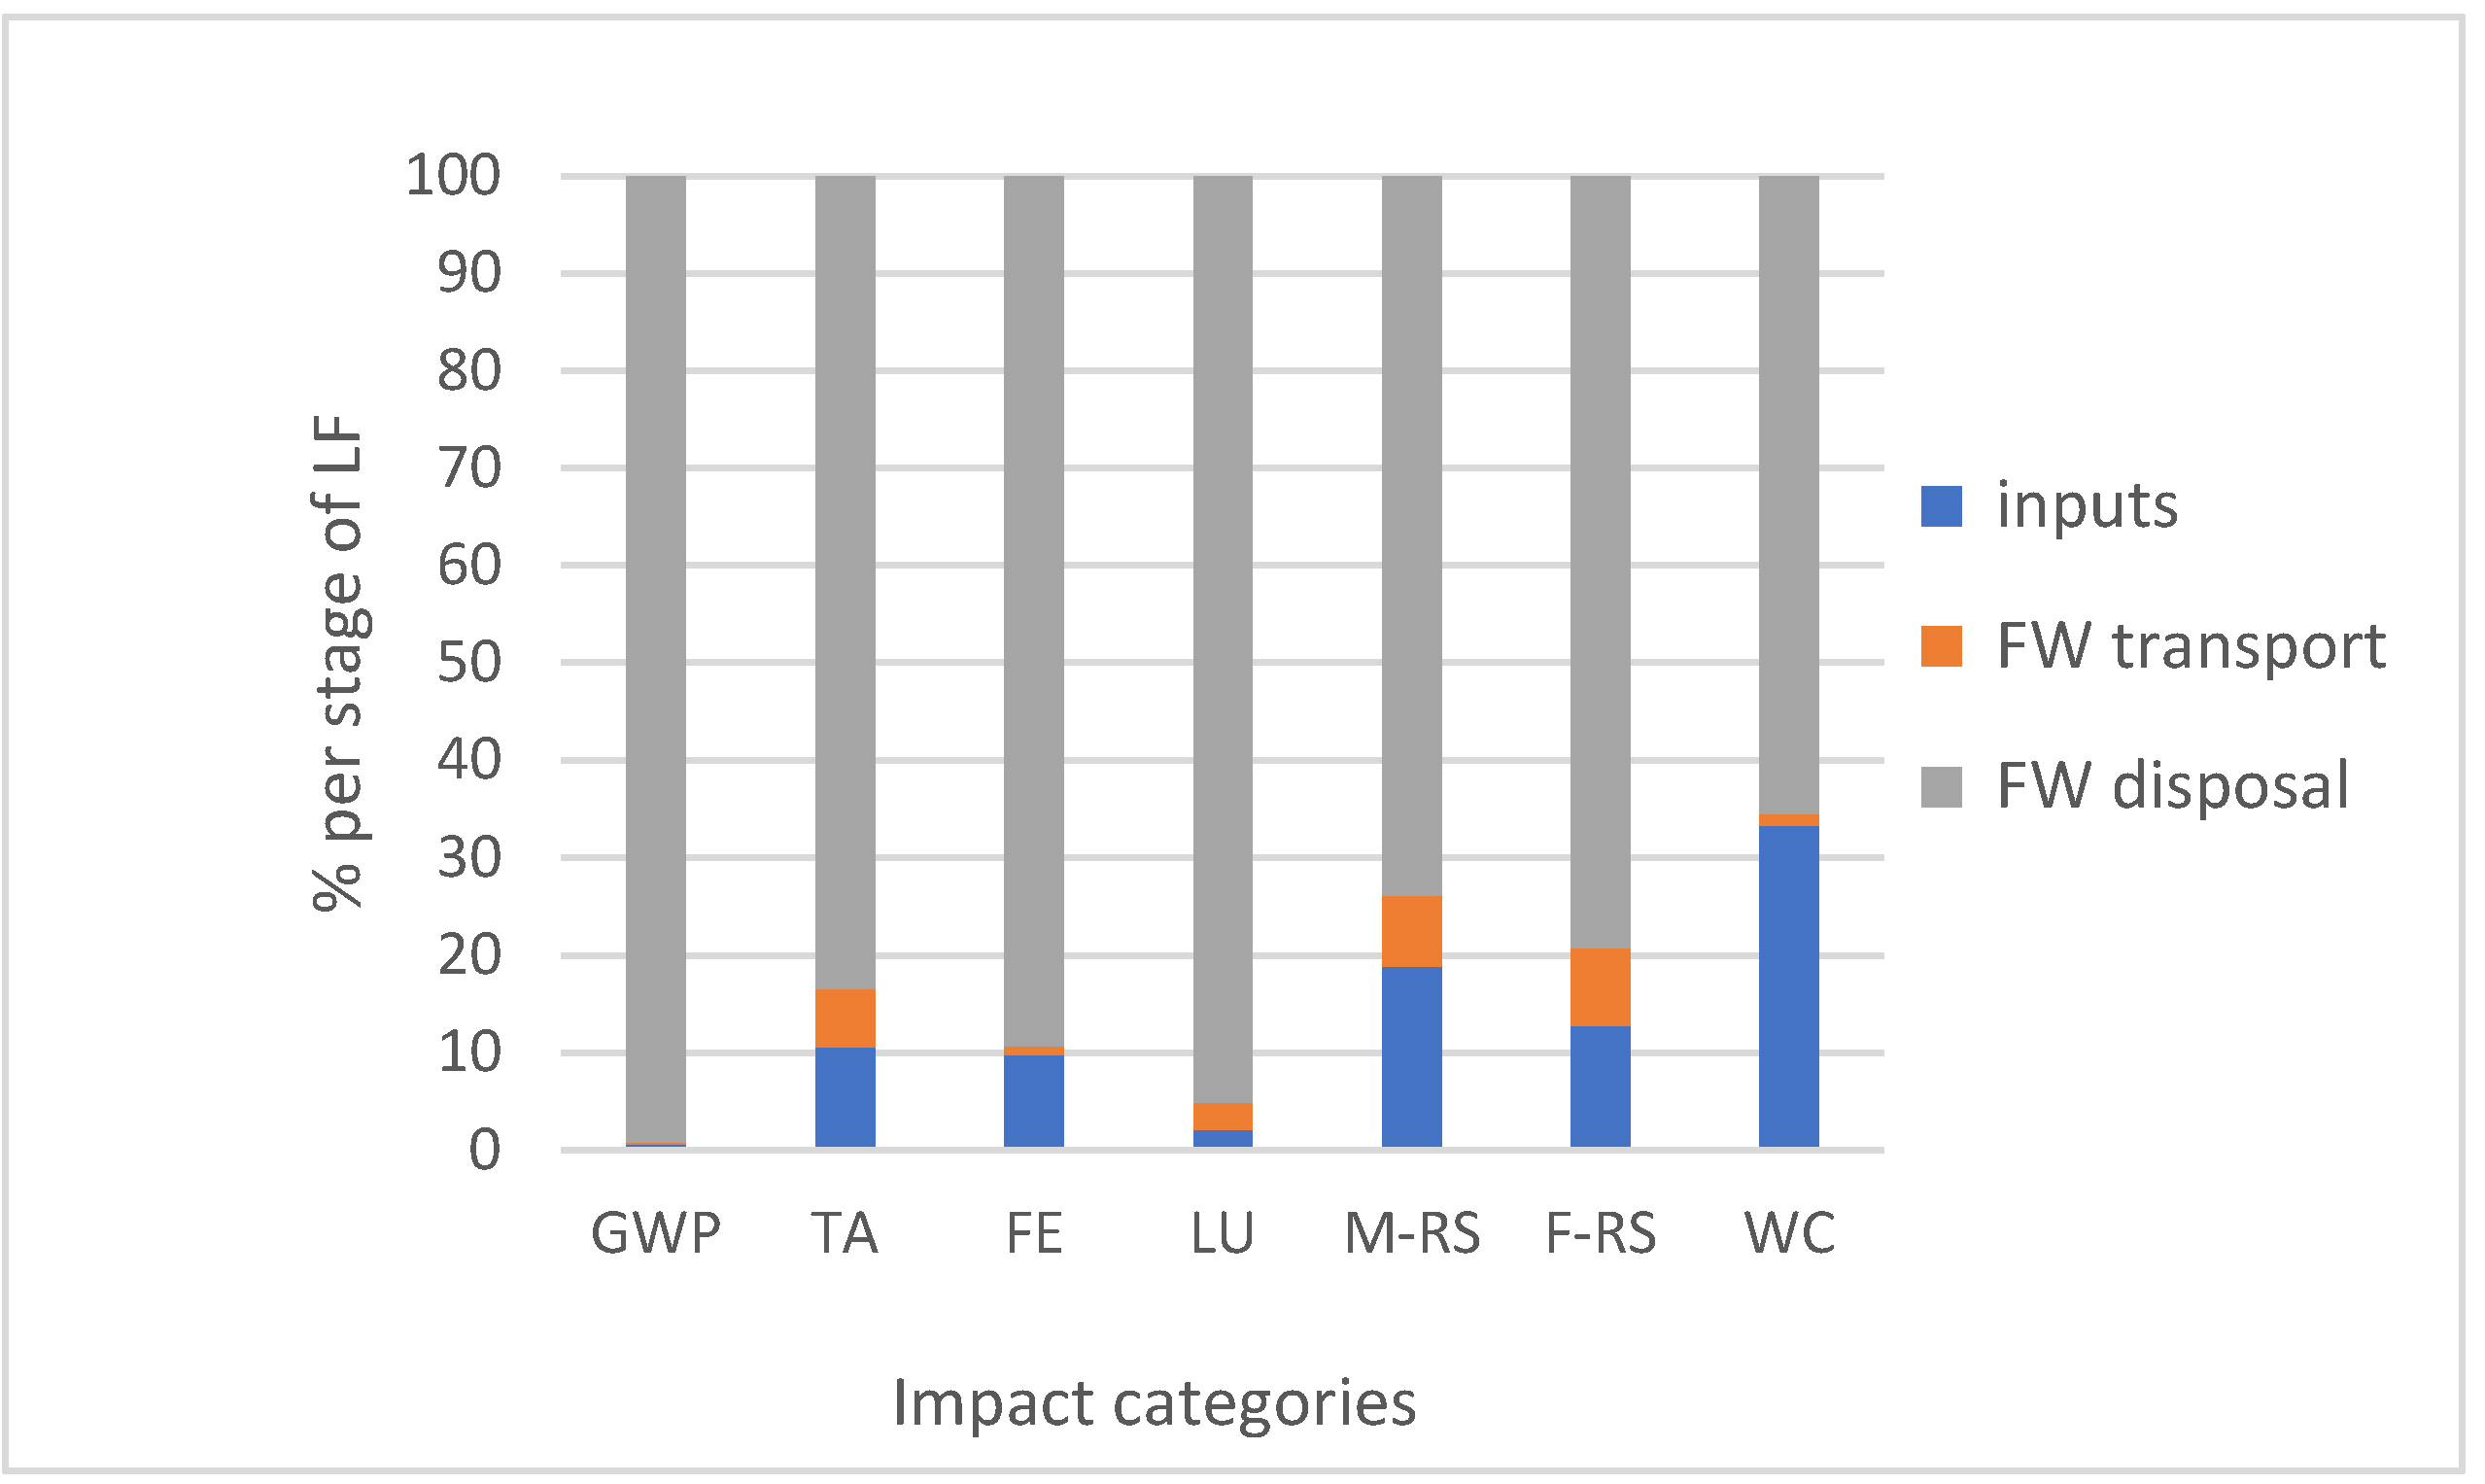
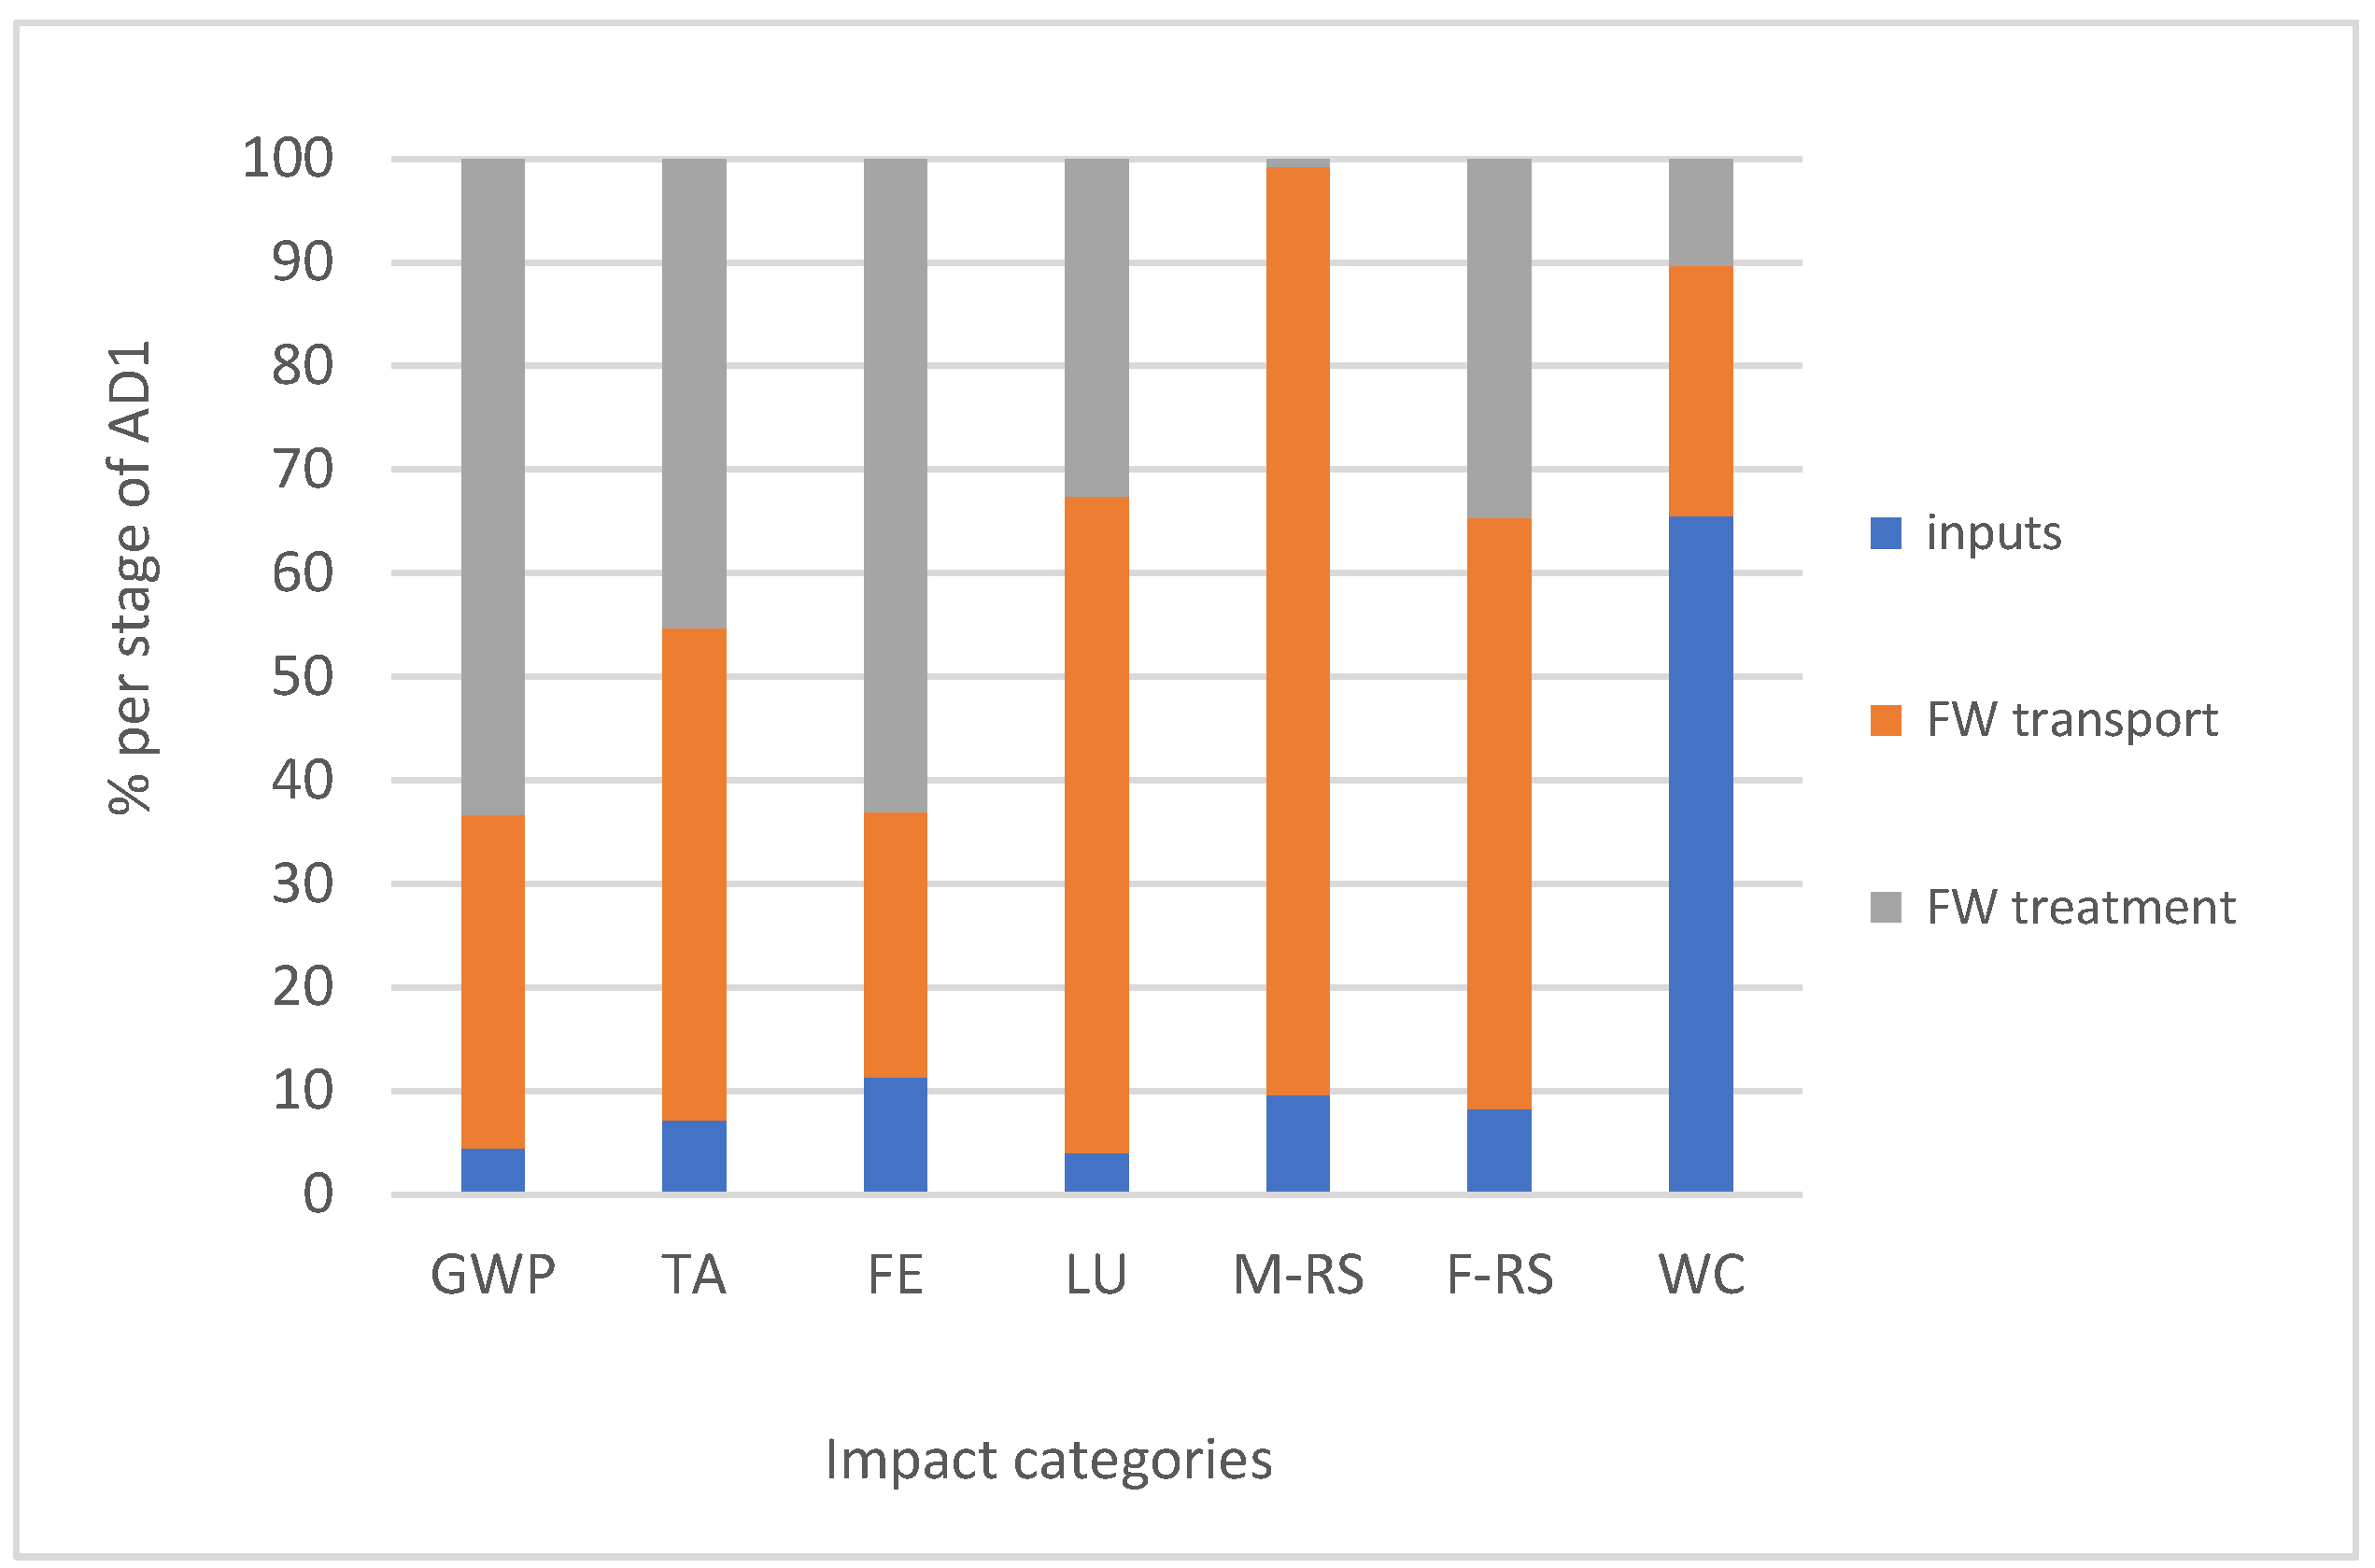
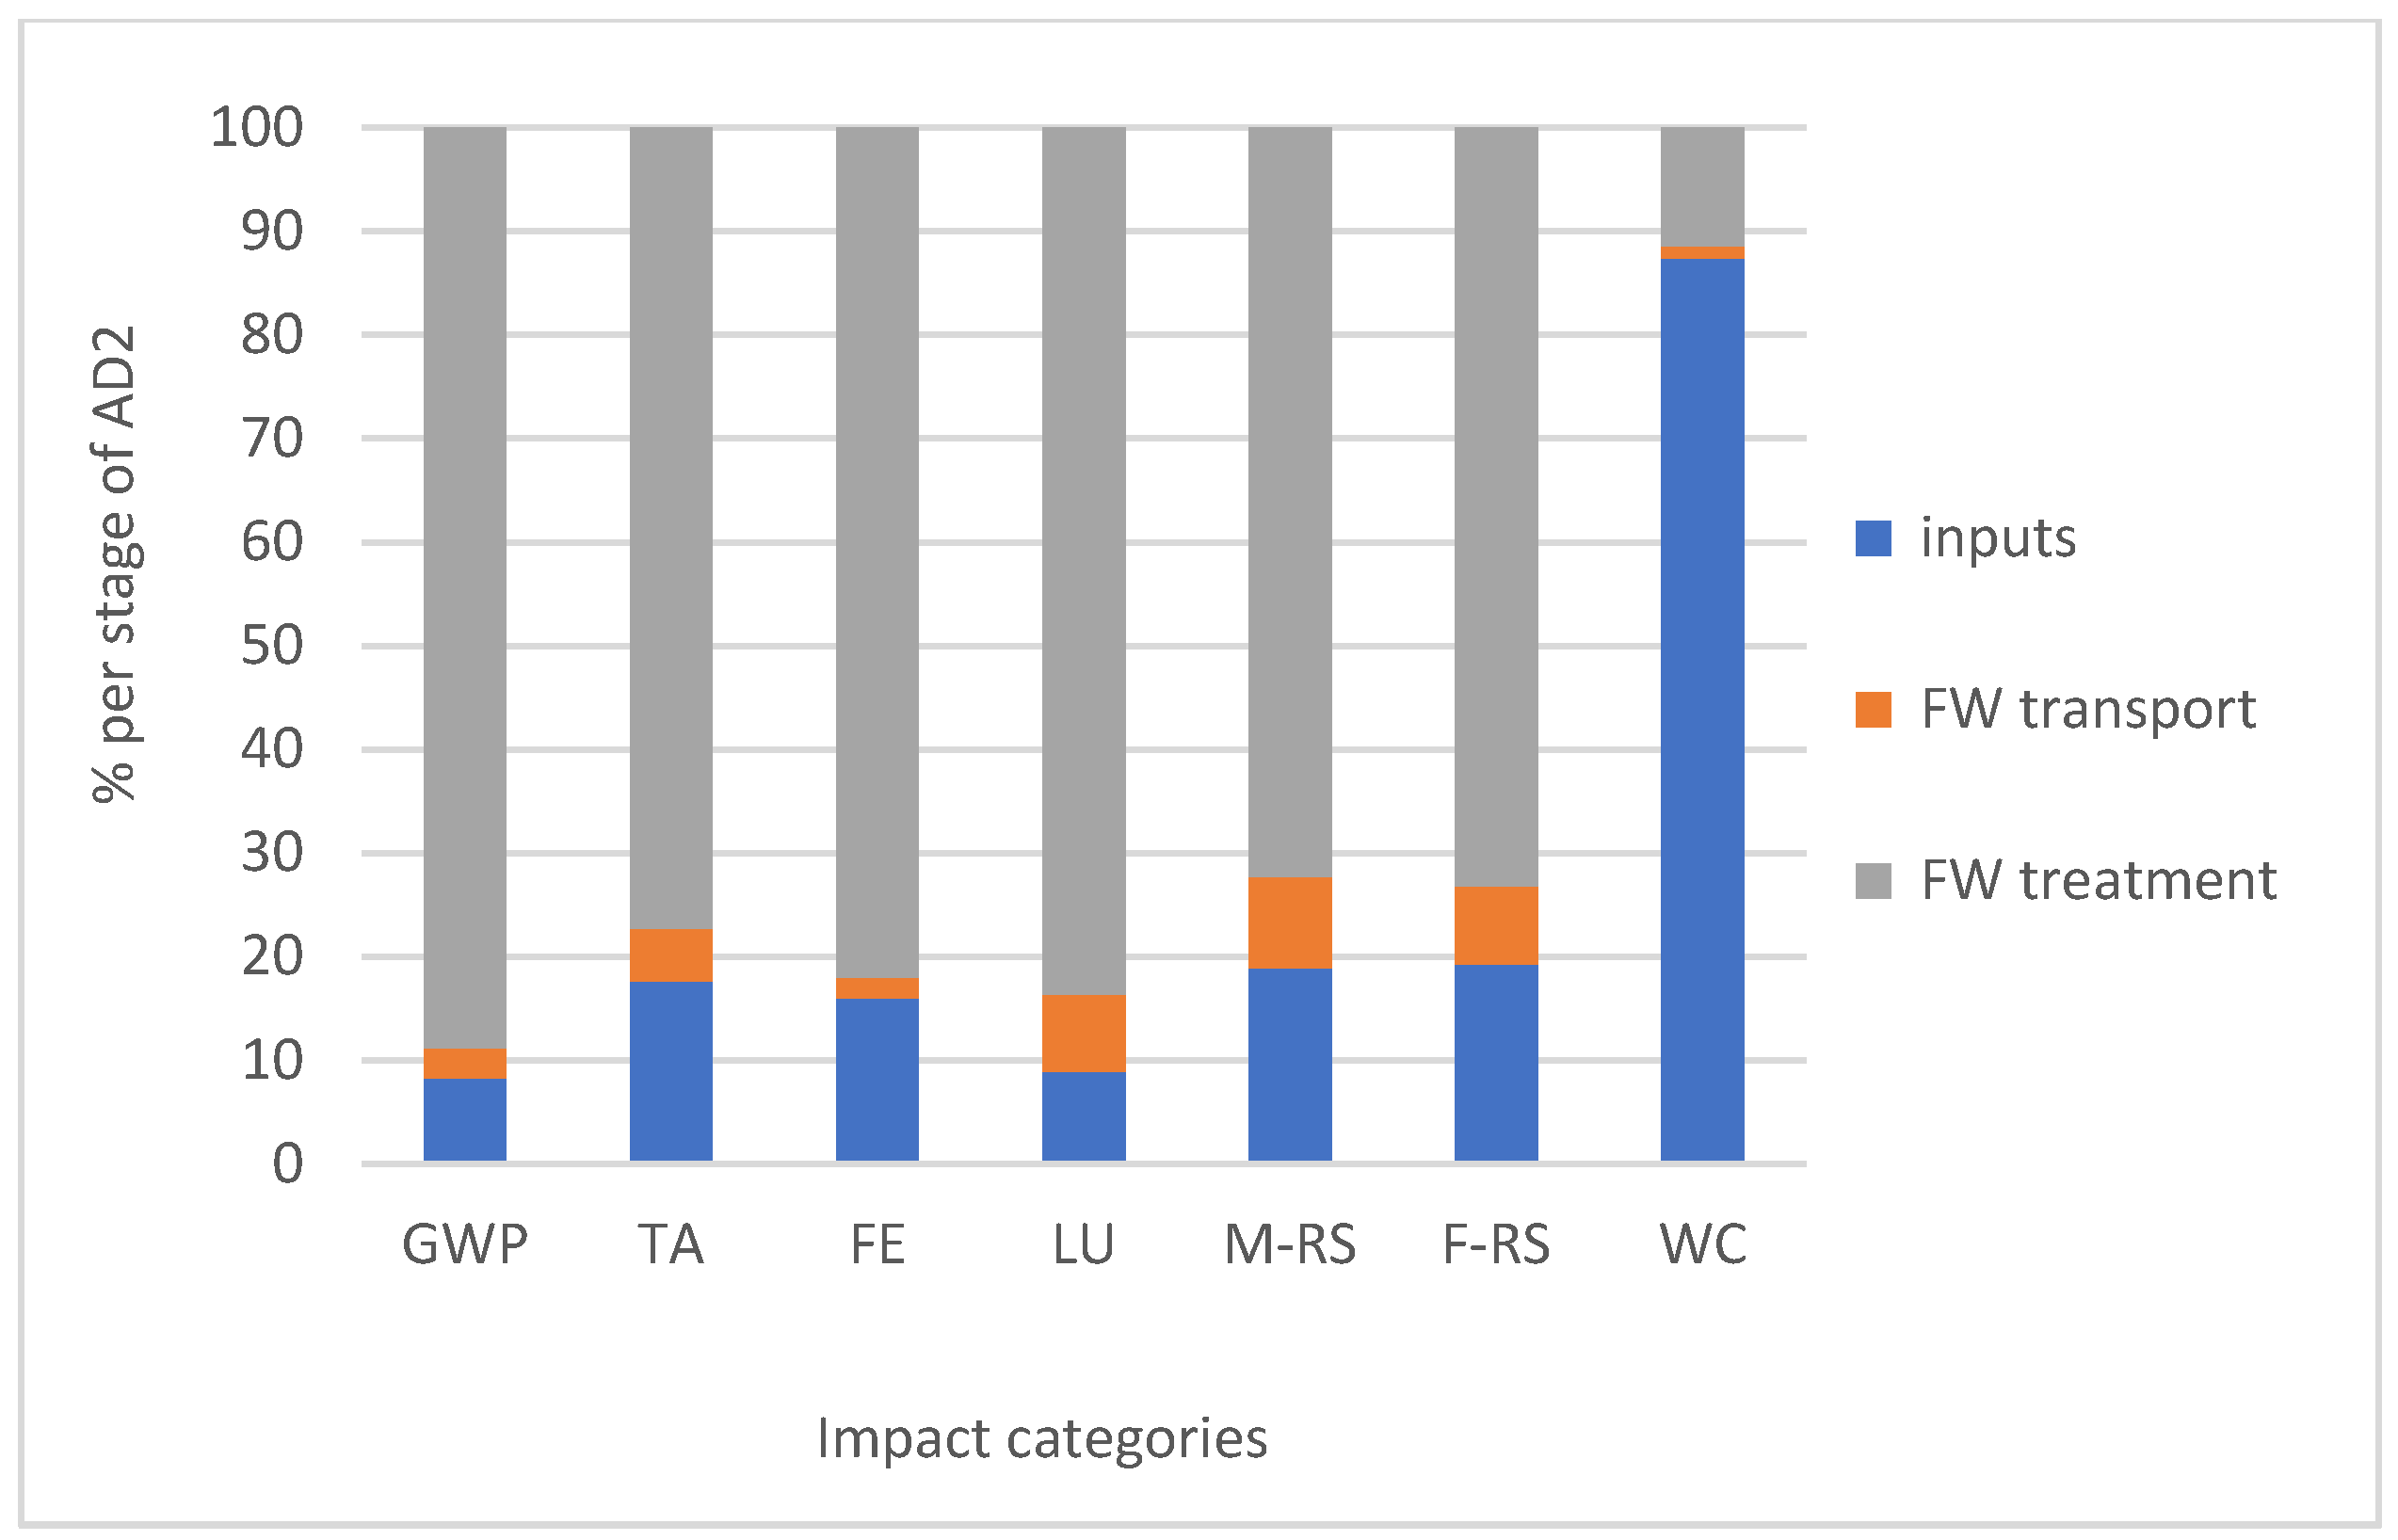
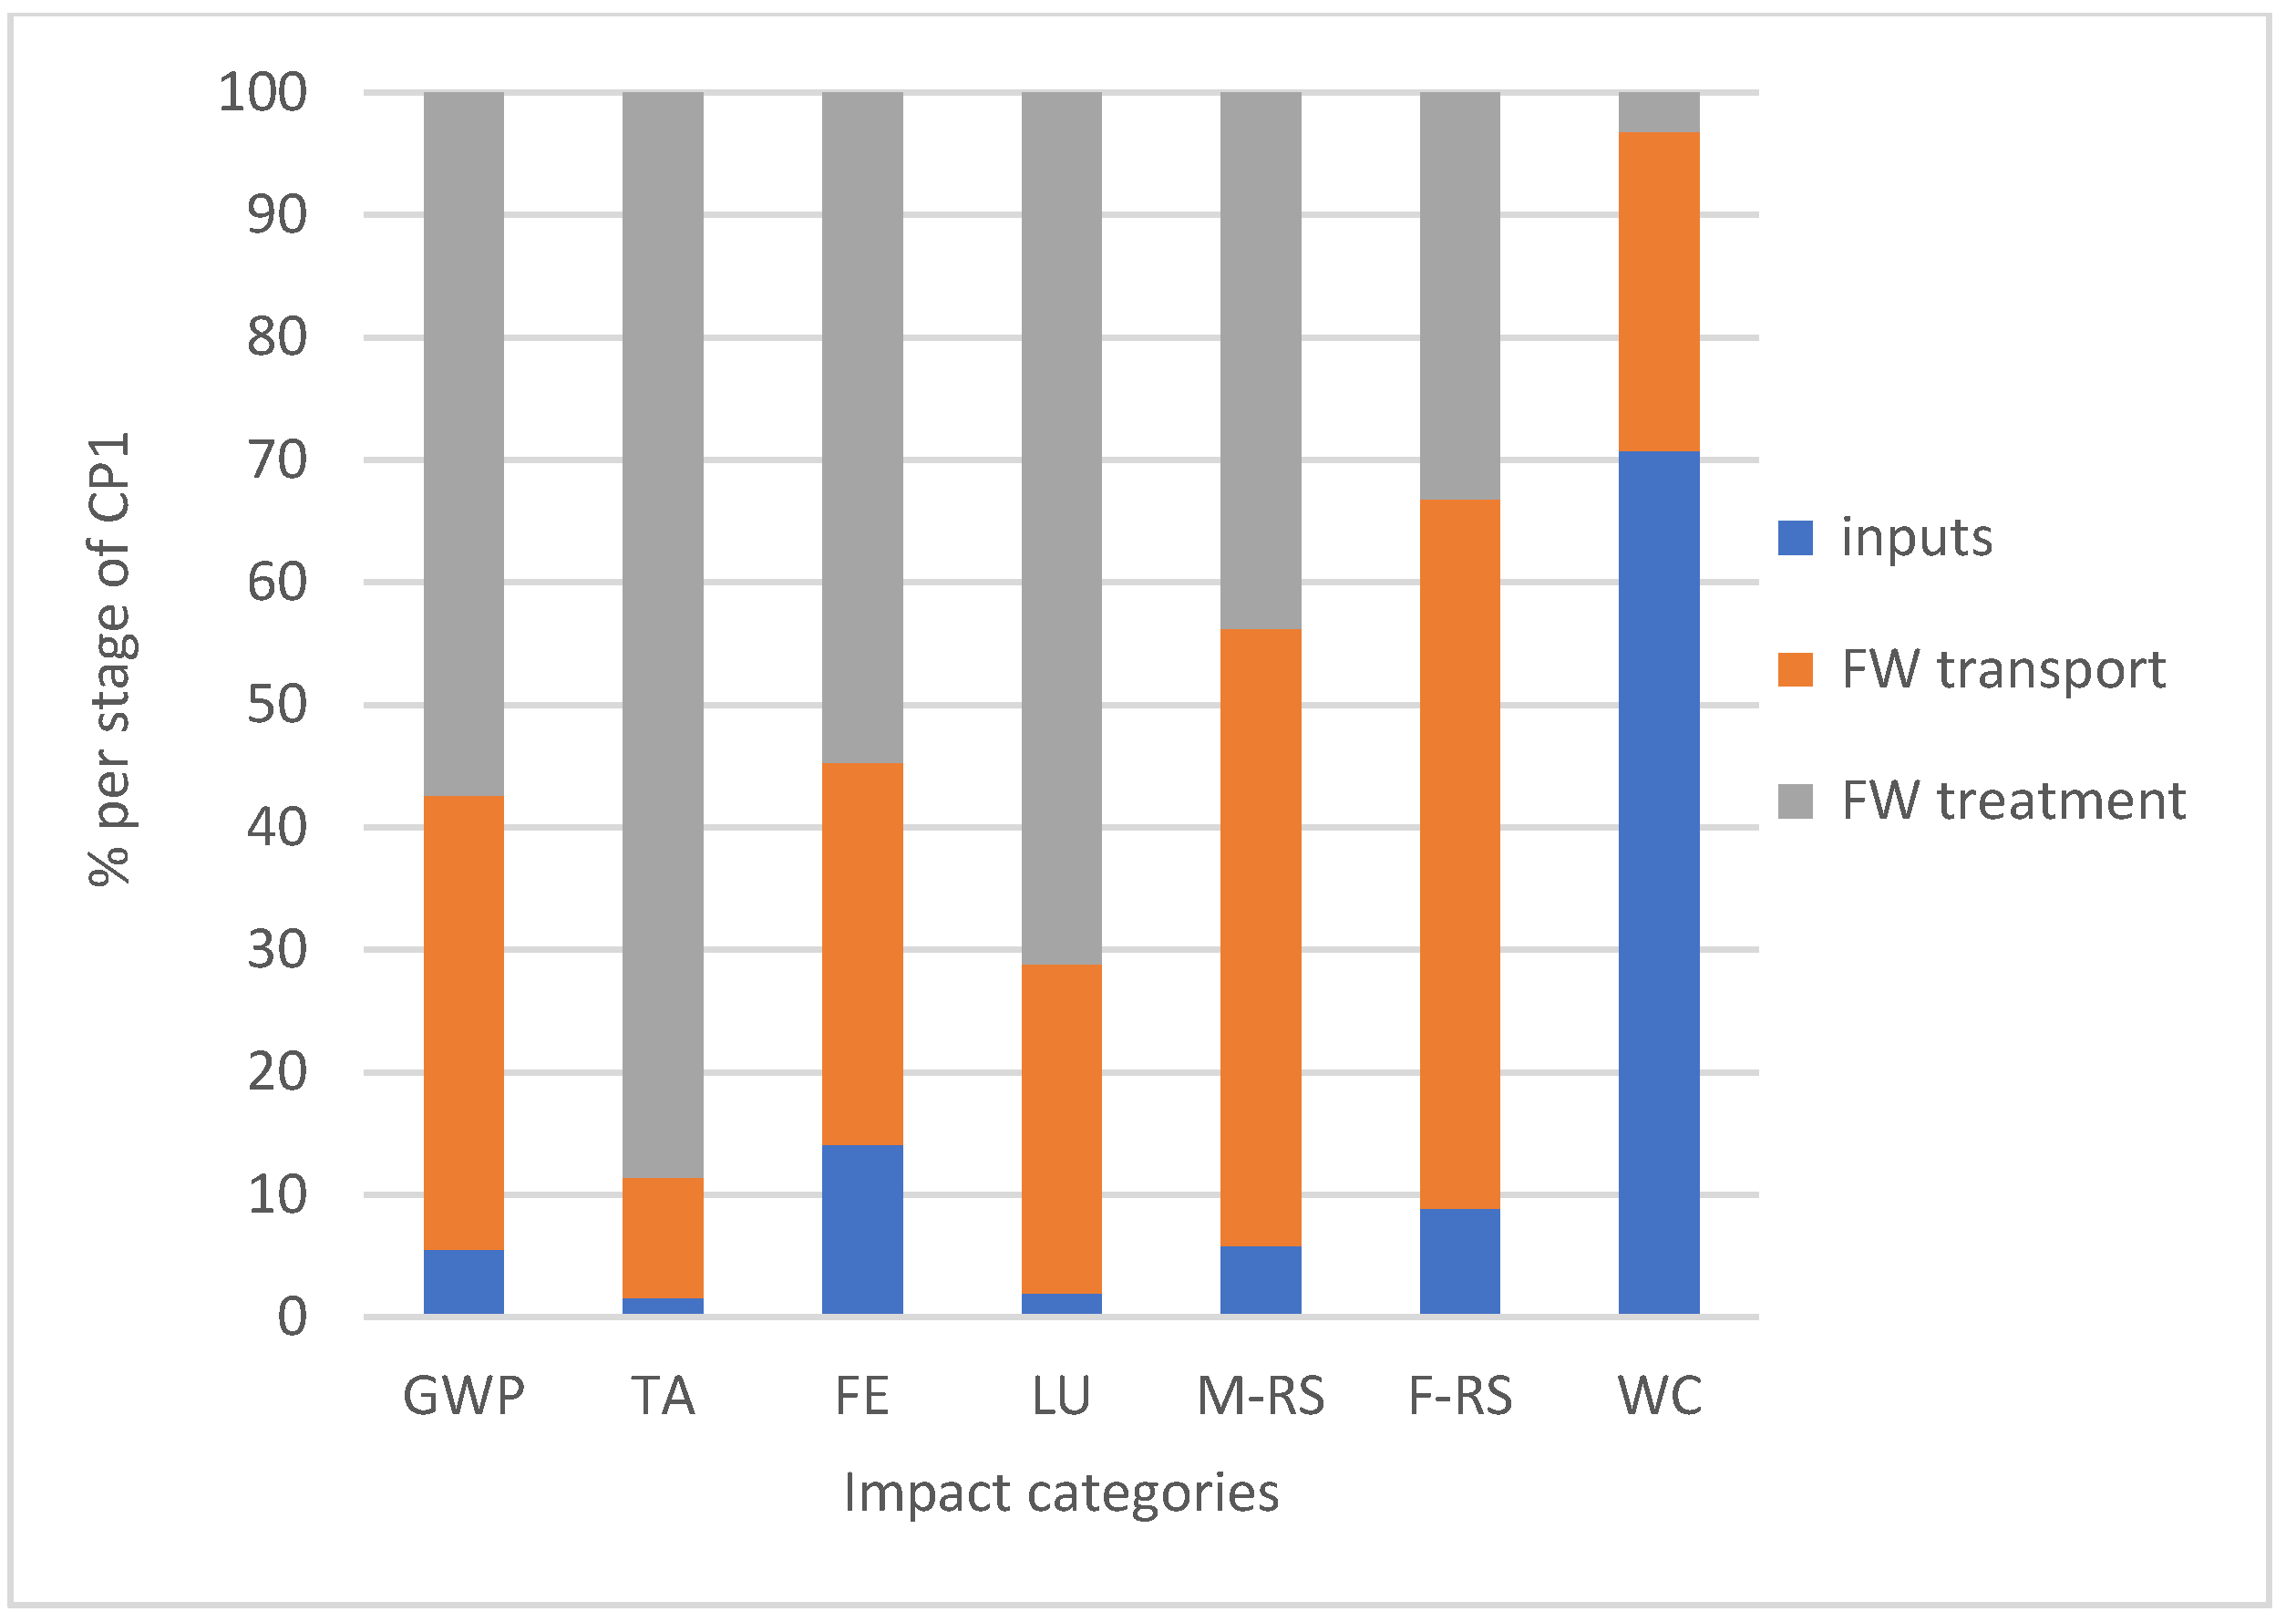
  • Global Warming Potential (GWP), expressed in kg CO2 eq;
  • Land-Use (LU), expressed in m2a crop;
  • Terrestrial Acidification (TA), expressed in kg SO2 eq;
  • Freshwater Eutrophication (FE), expressed in kg P eq;
  • Mineral Resource Scarcity (M-RS), expressed in kg Cu eq;
  • Fossil Resource Scarcity (F-RS), expressed in kg oil eq;
  • Water Consumption (WC), expressed in m3.
The E-LCC included the following cost categories: inputs, labor, transport, public services and depreciation from equipment investments. They were categorized in four main groups: a-inputs and labor at the generation point, b-transport to the disposal or valorization site, c-valorization system (this one includes all operation elements such as inputs, labor, energy, water), and d-depreciation due to the use of the equipment in which the consortium shall invest. The depreciation cost related to the required investment and the net economic effect as a result of the overall operative costs and savings during the valorisation of the FW, were selected as indicators in the economic dimension, expressed in American dollars (USD).
A category of social-oriented indicators, such as job generation and ease-of-implementation were considered as well. Job generation was calculated after the FW valorization labour requirement was inventoried for the E-LCC and then translated into the amount of new required full-time collaborators for each scenario. The ease-of-implementation was defined as the attribute that expresses how practical or less complex an alternative was in terms of technique, equipment and operation. Both indicators were assessed by the experts during the AHP implementation. Therefore, these indicators not only guided the proper data collection in the inventory phase of the LCA and E-LCC, but were the ones to be considered as criteria during the science-to-expert approach.

2.3.4. Scenarios and Inventory

The alternatives consisted of Anaerobic Digestion (AD) and Composting (CP) as seen in Figure 1 (more detailed information in the Supplementary Materials). The assessment comprised four FW valorization scenarios:
AD1:
Anaerobic Digestion in a centralized plant and FW collection route design 1. It proposed the operation of a continuous-load digester, and considered there was an already existing and operational digester on the selected site that would have the capacity to process the annual amount of FW.
AD2:
Anaerobic Digestion in a semi-centralized alternative of three valorization plants with route design 2. This scenario required three continuous-load digesters, one was already operating in one site, and new digesters would have to be set in two more valorization sites. It is assumed that the digestate from the already operative digestor would help to establish the microbiota in the other two locations.
CP1:
Composting in a centralized plant and FW collection route design 1. This scenario anticipated a modified and scaled Takakura composting method, operated through a set of seven automatic composters ( the Model JK5100 ®, Joraform, Laholm, Sweden) available in the market to manage 0.08 ton of FW per day each.
CP2:
Composting in a semi-centralized alternative of three valorization plants with an FW collection route design 2. This scenario would also use a modified and scaled Takakura composting method, operated through a set of six new JK5100 ® automatic composters capable to process 0.08 tonnes of FW per day each and one already similar composter in one of the sites.
In the business-as-usual scenario, the FW was collected and disposed of in a landfill (LF) by an authorized third party. It was modeled upon national data regarding FW collection and disposal costs [52,53], and calculated distances in Google Maps, from the campus to the closest landfill where ordinary wastes would be usually directed to, according to the Environmental managers of these institutions.
An inventory of the inputs and outputs of each scenario was performed, with data gathered from previous experiments [22], literature and a questionnaire filled by the restaurant manager and operators. When necessary, the allocation of certain inputs based on the FW generation proportion of each campus was applied, due to a lack of primary data in some of the institutions. Inputs consisted of plastic containers to collect FW, products and water to clean (both the generation and valorization sites), transport of those inputs, and electricity to pre-condition FW, as well as the required labor to operate each stage. The FW transport was calculated regarding the FW mobilized mass and the FW transportation route; this meant that it considered the kilometers in the business-as-usual route for LF, as well as the kilometers for route 1 or route 2 obtained in the optimized route design. Outputs included the compost or digestate, biogas depending on the valorization alternative, the wastewater, as well as the correspondent emissions for the valorization process and expanded system. Packaging waste from inputs were not included since they would be considered to be outside the system boundaries of the present study. Finally, processes for the correspondent FW treatment or disposition were selected from the Ecoinvent database, whether it was a landfill for municipal solid waste, biowaste anaerobic digestion, or industrial composting on each scenario.

2.3.5. Assumptions and Data Sources

Several literatures present AD and CP as alternatives for FW valorization, and prior studies in one of the universities concluded that those were technically fit within the local conditions, which motivated further analysis and the assumption that these would be the valorization alternatives to be assessed in this study. Most inputs were considered as yearly consumables, except for the plastic containers for the FW, which were estimated to have a life of five years; therefore, the cost and mass for the yearly FW treatment was estimated. All alternative scenarios suppose that 50% of water consumption in cleaning operations would come from rainwater collection, a practice that is becoming more usual in the country. The compost yield was estimated to be 18.75% from the mass of the FW [22]. The biogas yield was obtained from literature reviews regarding biogas production, digestate production, technical characteristics, and calorific potentials, to assume a methane production of 53% of the produced biogas [13,54,55,56,57]. Distances from input suppliers as well as from the FW generation to valorization sites were calculated with Google Maps, and databases like Ecoinvent 3.4 were used for the inventoried processes on each scenario. The exchange rate to convert Costa Rican market prices (CRC) into American dollars (USD) was retrieved from the Costa Rican Central Bank at the moment of the study, at a rate of 596.18 CRC: 1 USD. Other information sources included scientific literature, environmental declarations, Costa Rican public services databases and market prices.

2.3.6. Interpretation

Critical stages or hotspots regarding environmental and economic data were identified in the business-as-usual and alternative scenarios, and an evaluation regarding the avoidance of certain impacts through a system expansion was used for a comparison among the four alternatives. A sensitivity analysis was conducted to observe the result of potential input changes suggested by experts during the exercise as well as contextual conditions. The summary of the LCA and E-LCC results was presented to a group of experts, to prioritize the option with more potential to be adopted by the consortium.

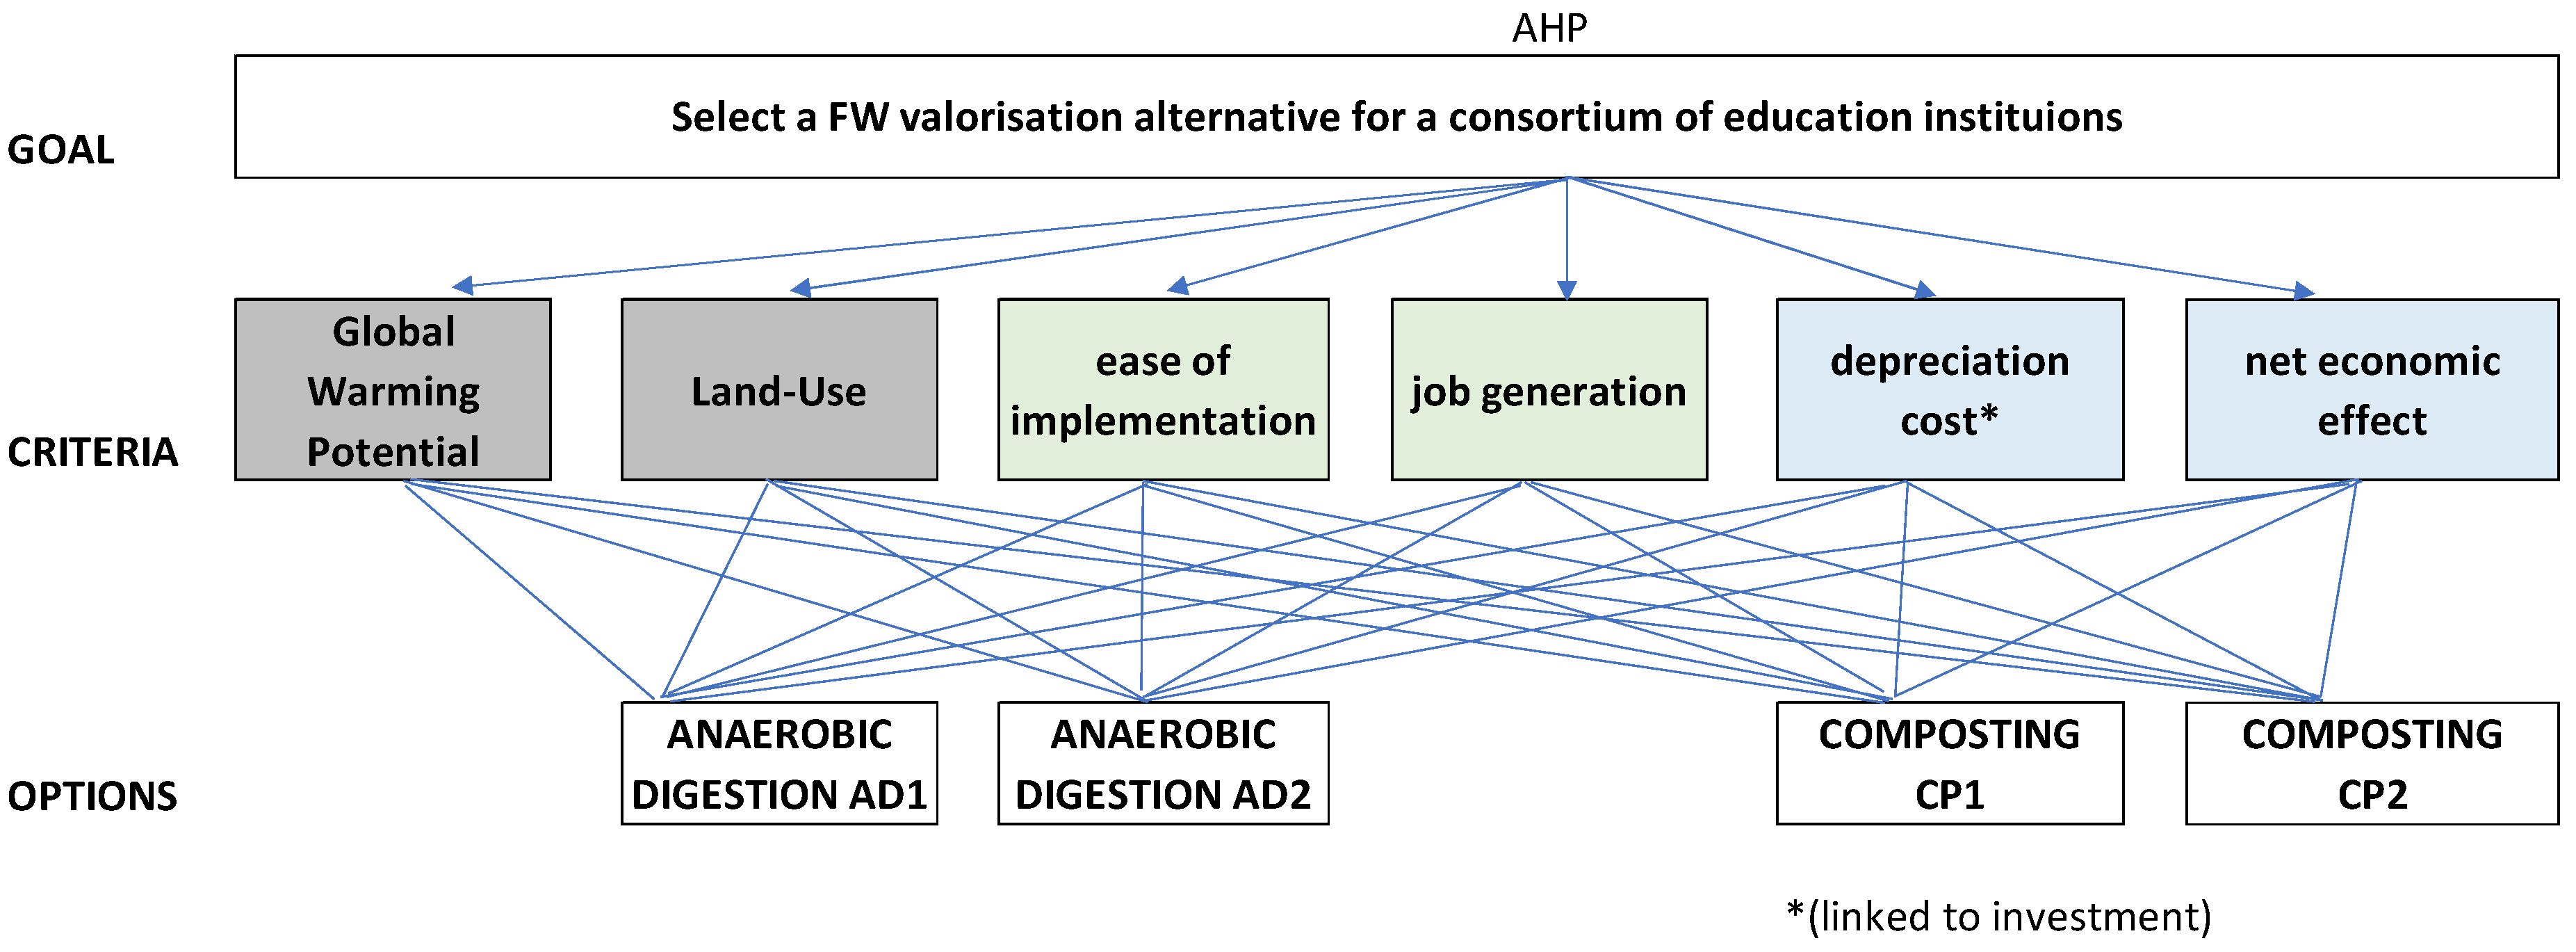
2.4. Multicriteria Decision Method: AHP

Saaty (2008) established the basis of a multicriteria decision-making approach named Analytic Hierarchy Process (AHP) [28], in which factors are arranged in a hierarchic structure. It follows a systematic set of steps, beginning with the definition of the problem. The second step sets a decision hierarchy structure where the goal of the process is placed at the first level of the structure, criteria on which subsequent elements depend are placed at the intermediate level and the alternatives to be considered in the decision process rest at the lowest level. A third step consists of the construction of pairwise comparison matrices, which are later normalized and an eigenvector is determined to later, in the fourth step, use the obtained priority vectors in the pairwise comparison to weigh the alternatives in the subsequent level. In this study, the goal was to select an FW valorization alternative for this University Consortium, based on pairwise comparisons of environmental, economic and social criteria to later prioritize the FW valorization alternatives.
This study considered six criteria from the environmental, economic and social dimensions (Figure 4), regarded as Global Warming Potential, Land-Use, depreciation cost (linked to the required investment), net economic effect, ease-of-implementation and job generation.
A group of 10 experts was reached to provide a science-to-expert approach. The technical information from the description of the scenarios and the results of the LCA and E-LCC was offered to these professionals. The group of experts was gender-balanced and formed by professionals in environmental sciences, engineering and economics, most of them with postgraduate education and currently holding positions as environmental managers from education institutions or local governments, policy makers, academics, specialists in international/non-governmental organizations, or waste valorization entrepreneurs. The responses of the experts where registered in a data collection tool created for this purpose (validated and tested, Cronbach’s α = 0.93).
They were asked first to prioritize each criterion versus the other and then to judge each FW-to-energy alternative versus the other regarding the mentioned criteria, using the fundamental scale for absolute numbers. This nine-point scale qualifies the alternatives in regards of the intensity of importance of one option over the other, assigning a value of 1 when there is equal importance, and up to a value of 9 when there is extreme importance [28]. The results were aggregated by a geometric mean, computed into a matrix, and later normalized using Microsoft ® Excel ®. The Eigenvector was calculated and used to weight the results for the four valorization alternatives. Then, the process allowed to prioritize the FW-to-energy or valorization alternatives for the consortium. A consistency check was performed for each matrix through the calculation of the Consistency Ratio (CR ≤ 0.10). Finally, experts observed the overall results and offered feedback on the methodological framework in a single open-question section of the data collection tool.

3. Results

3.1. Selection of FW Valorization Facility and Route Optimization
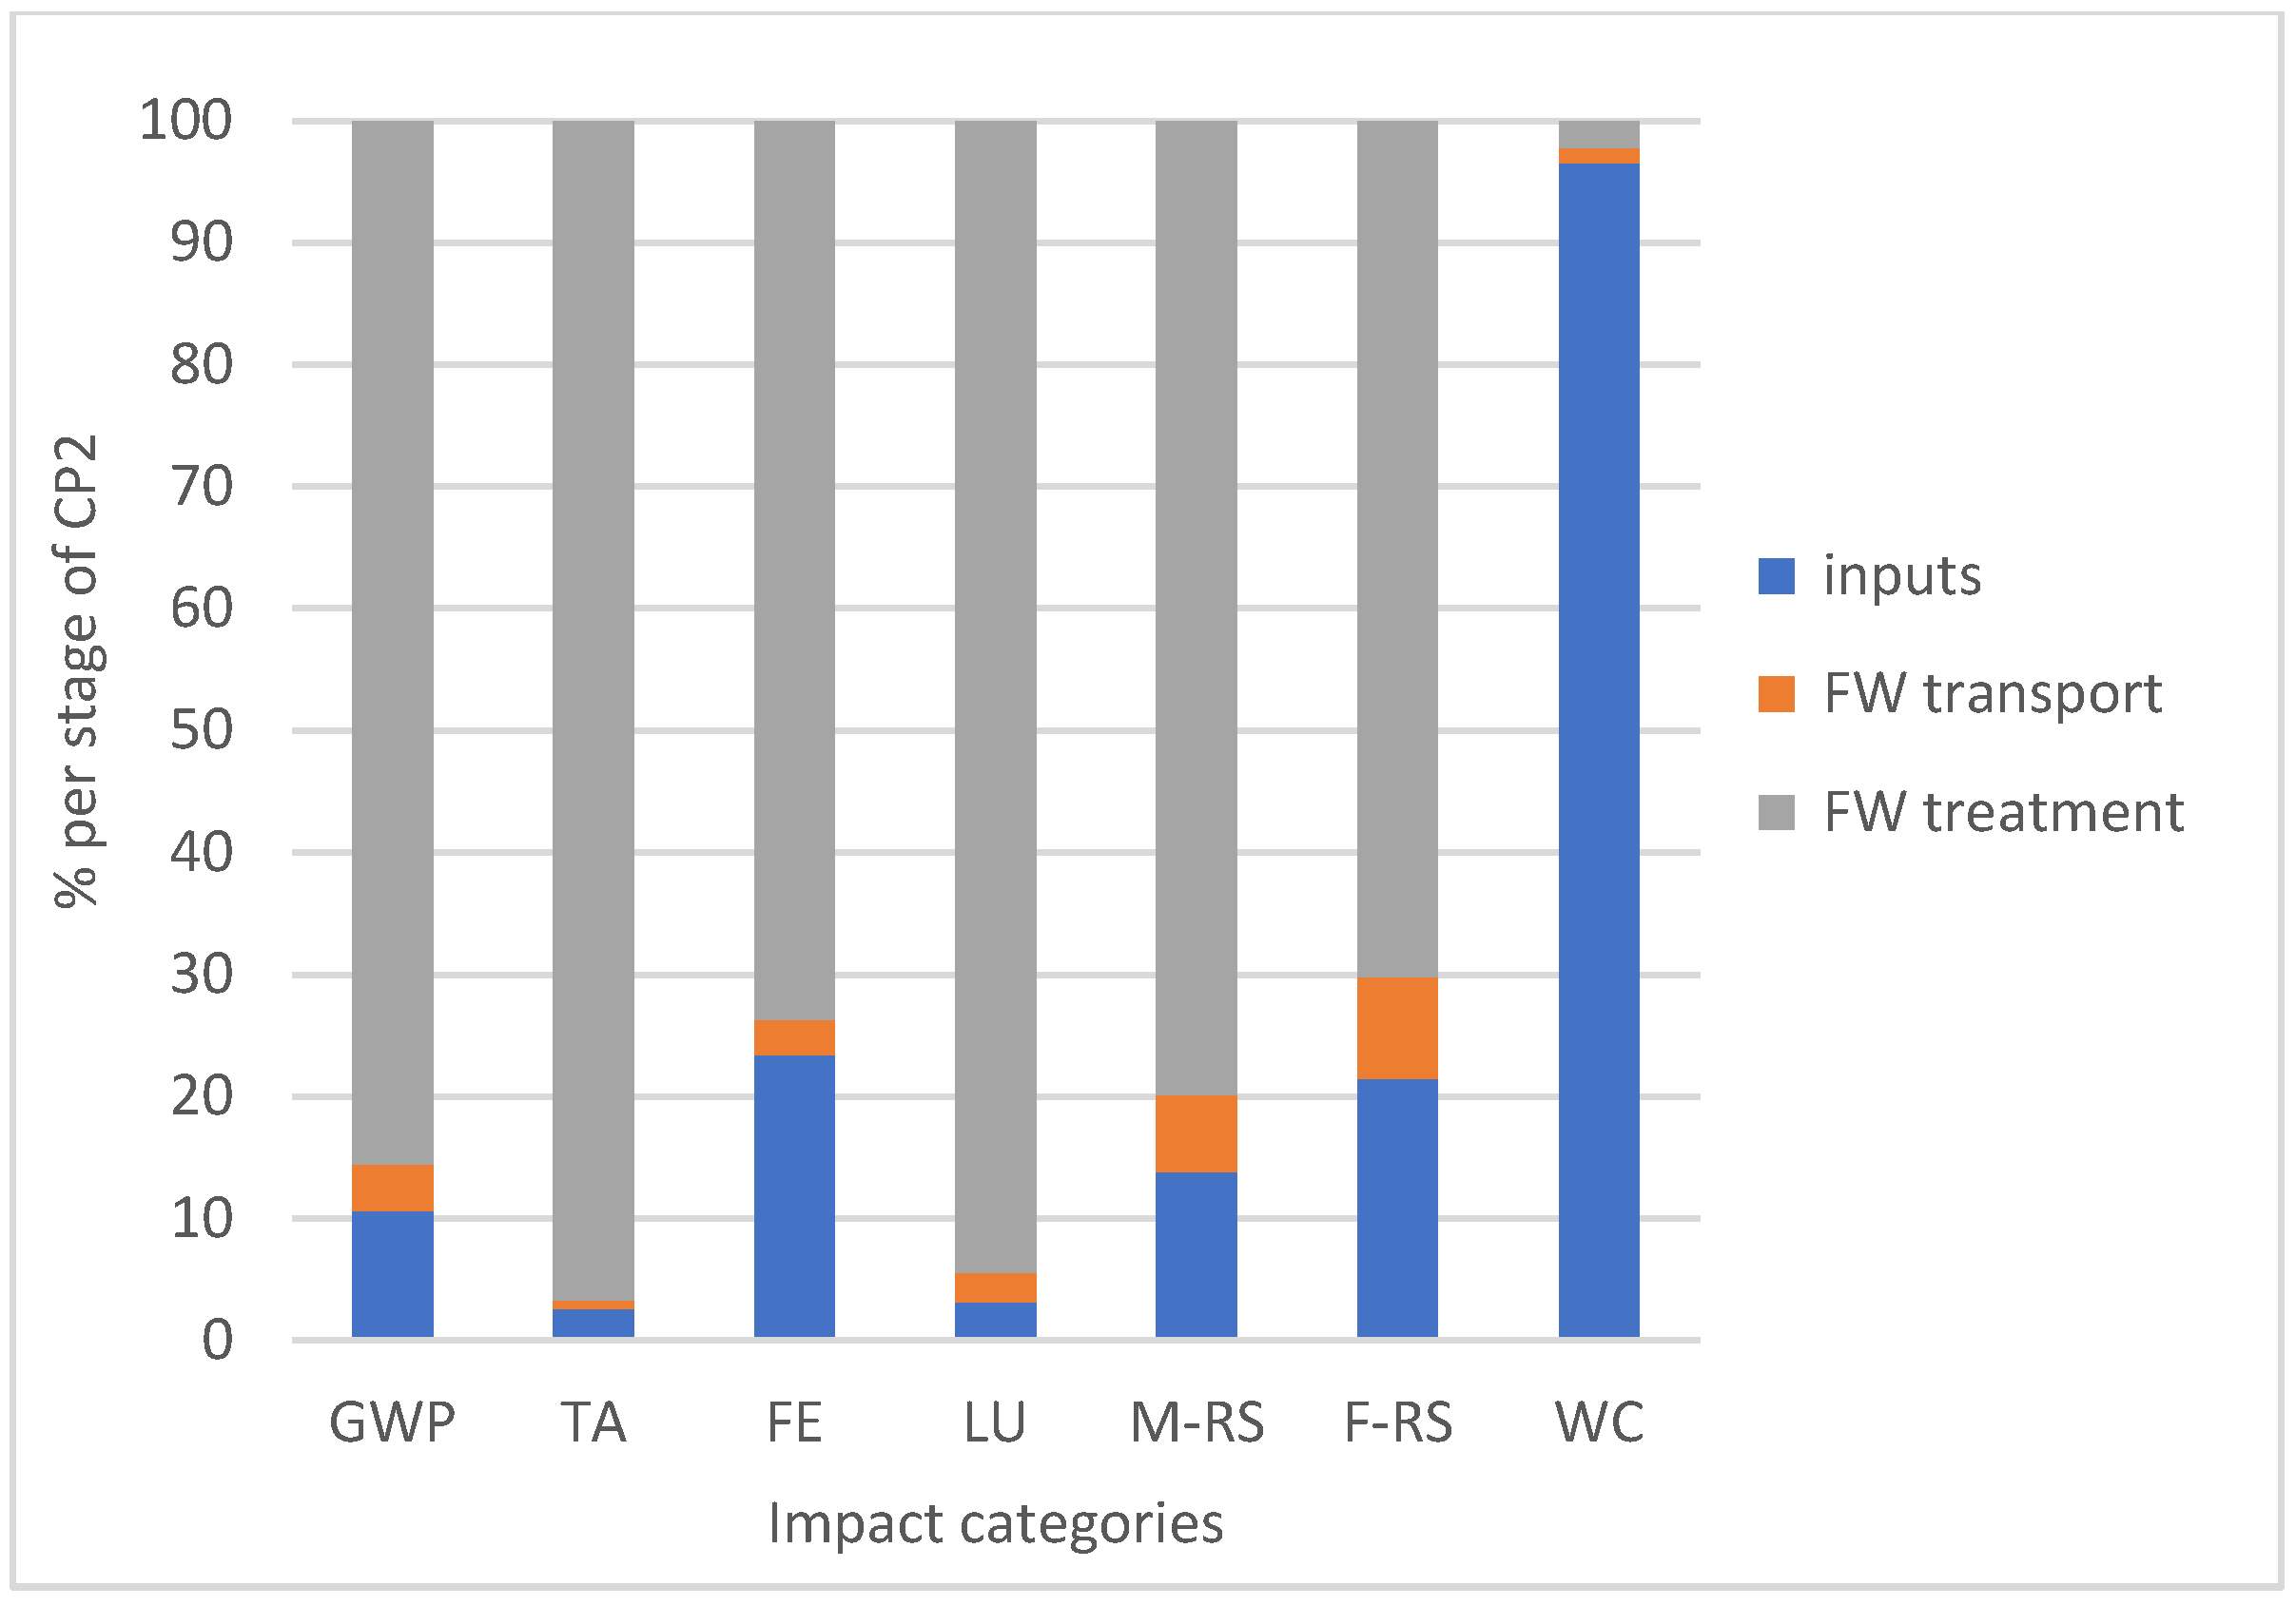
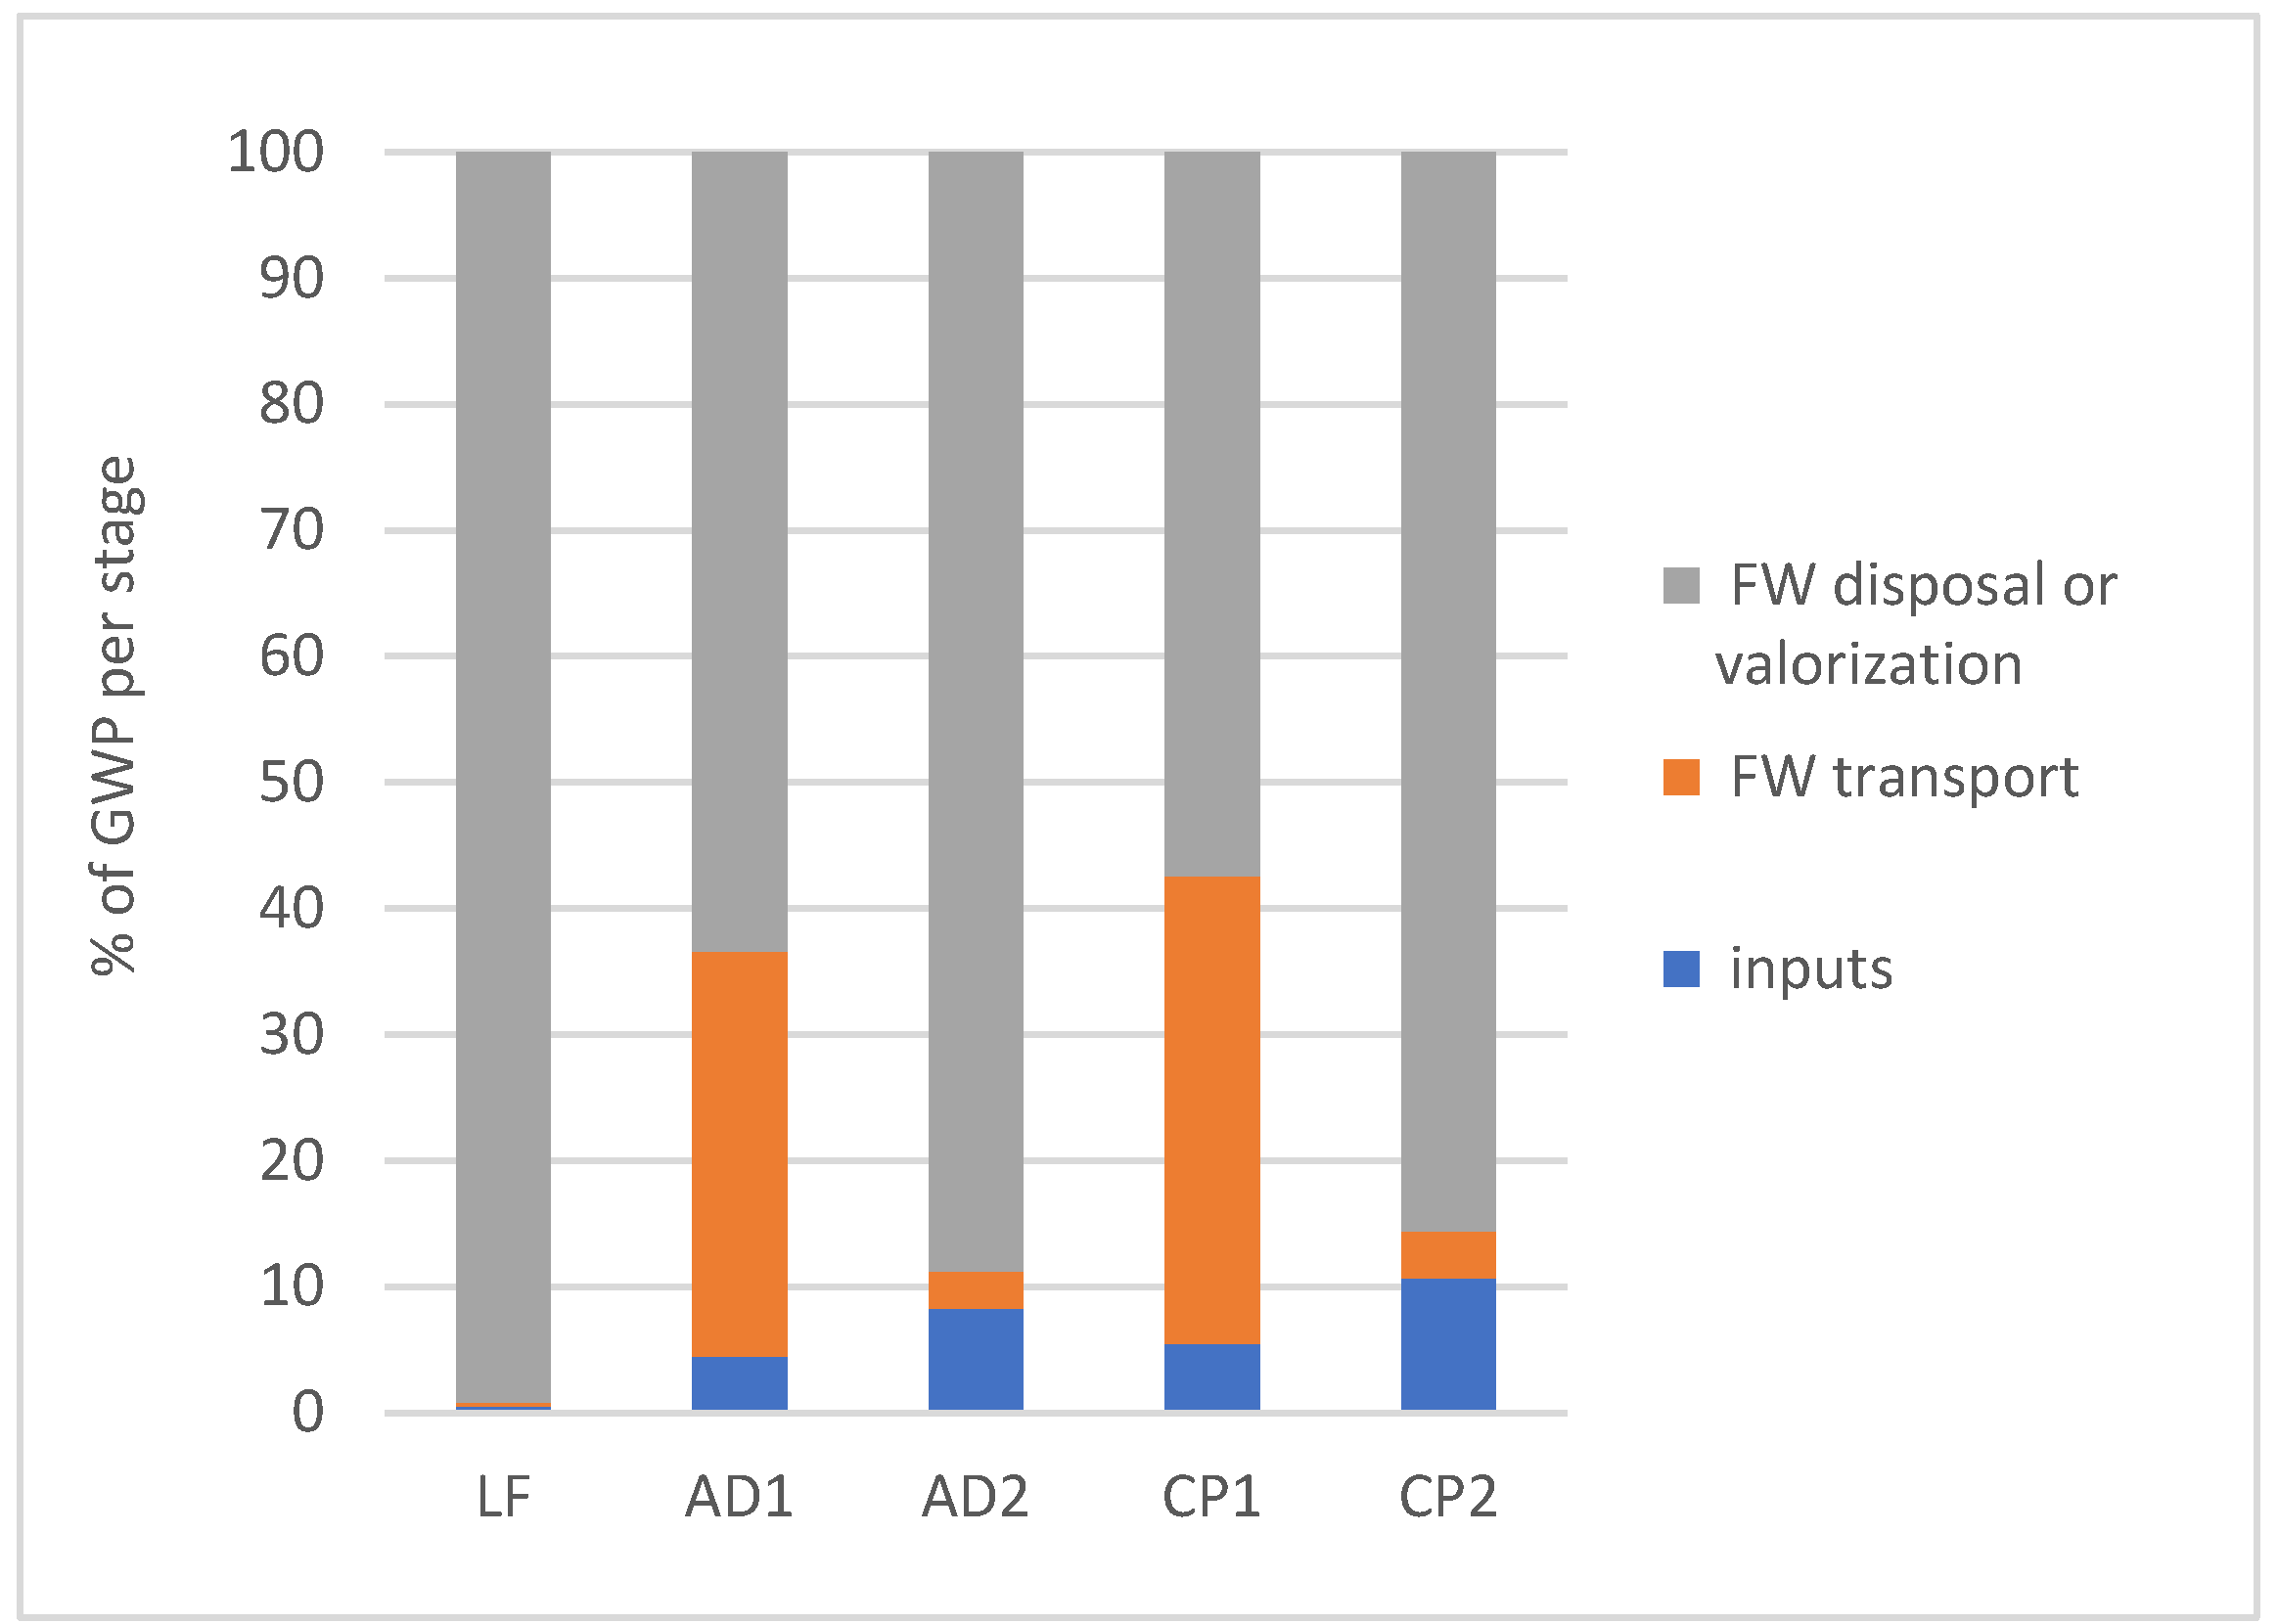
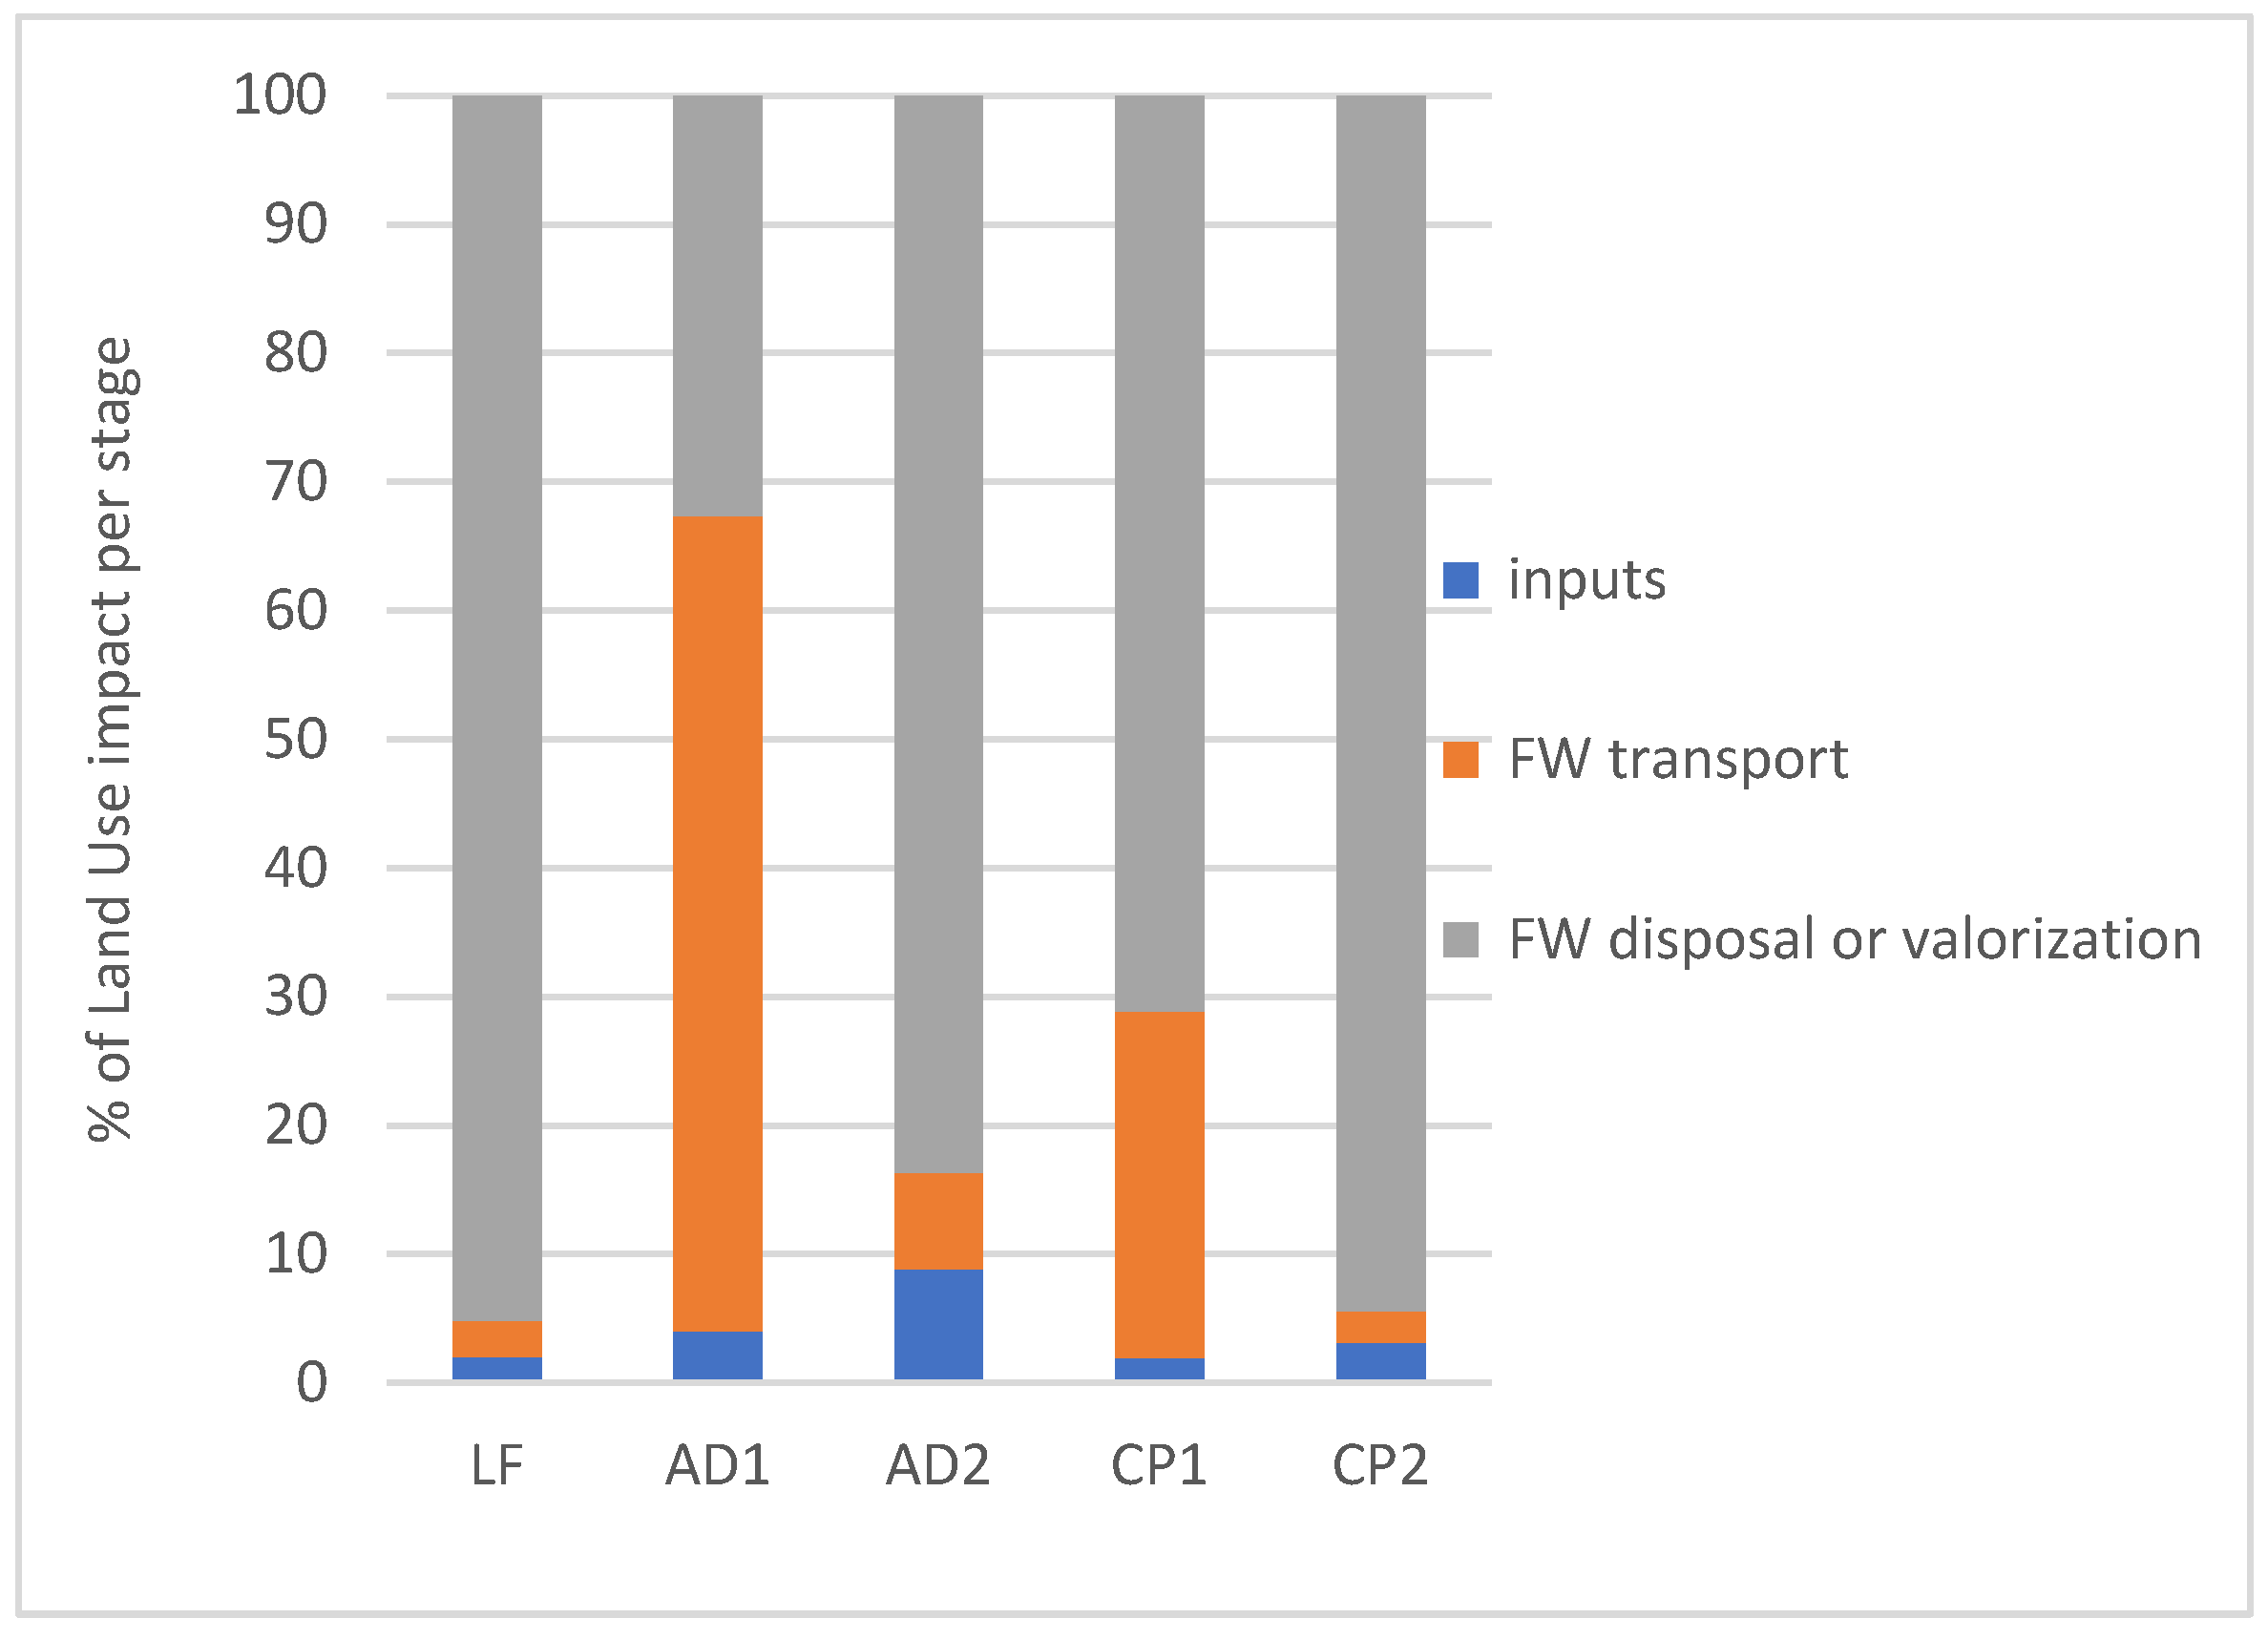
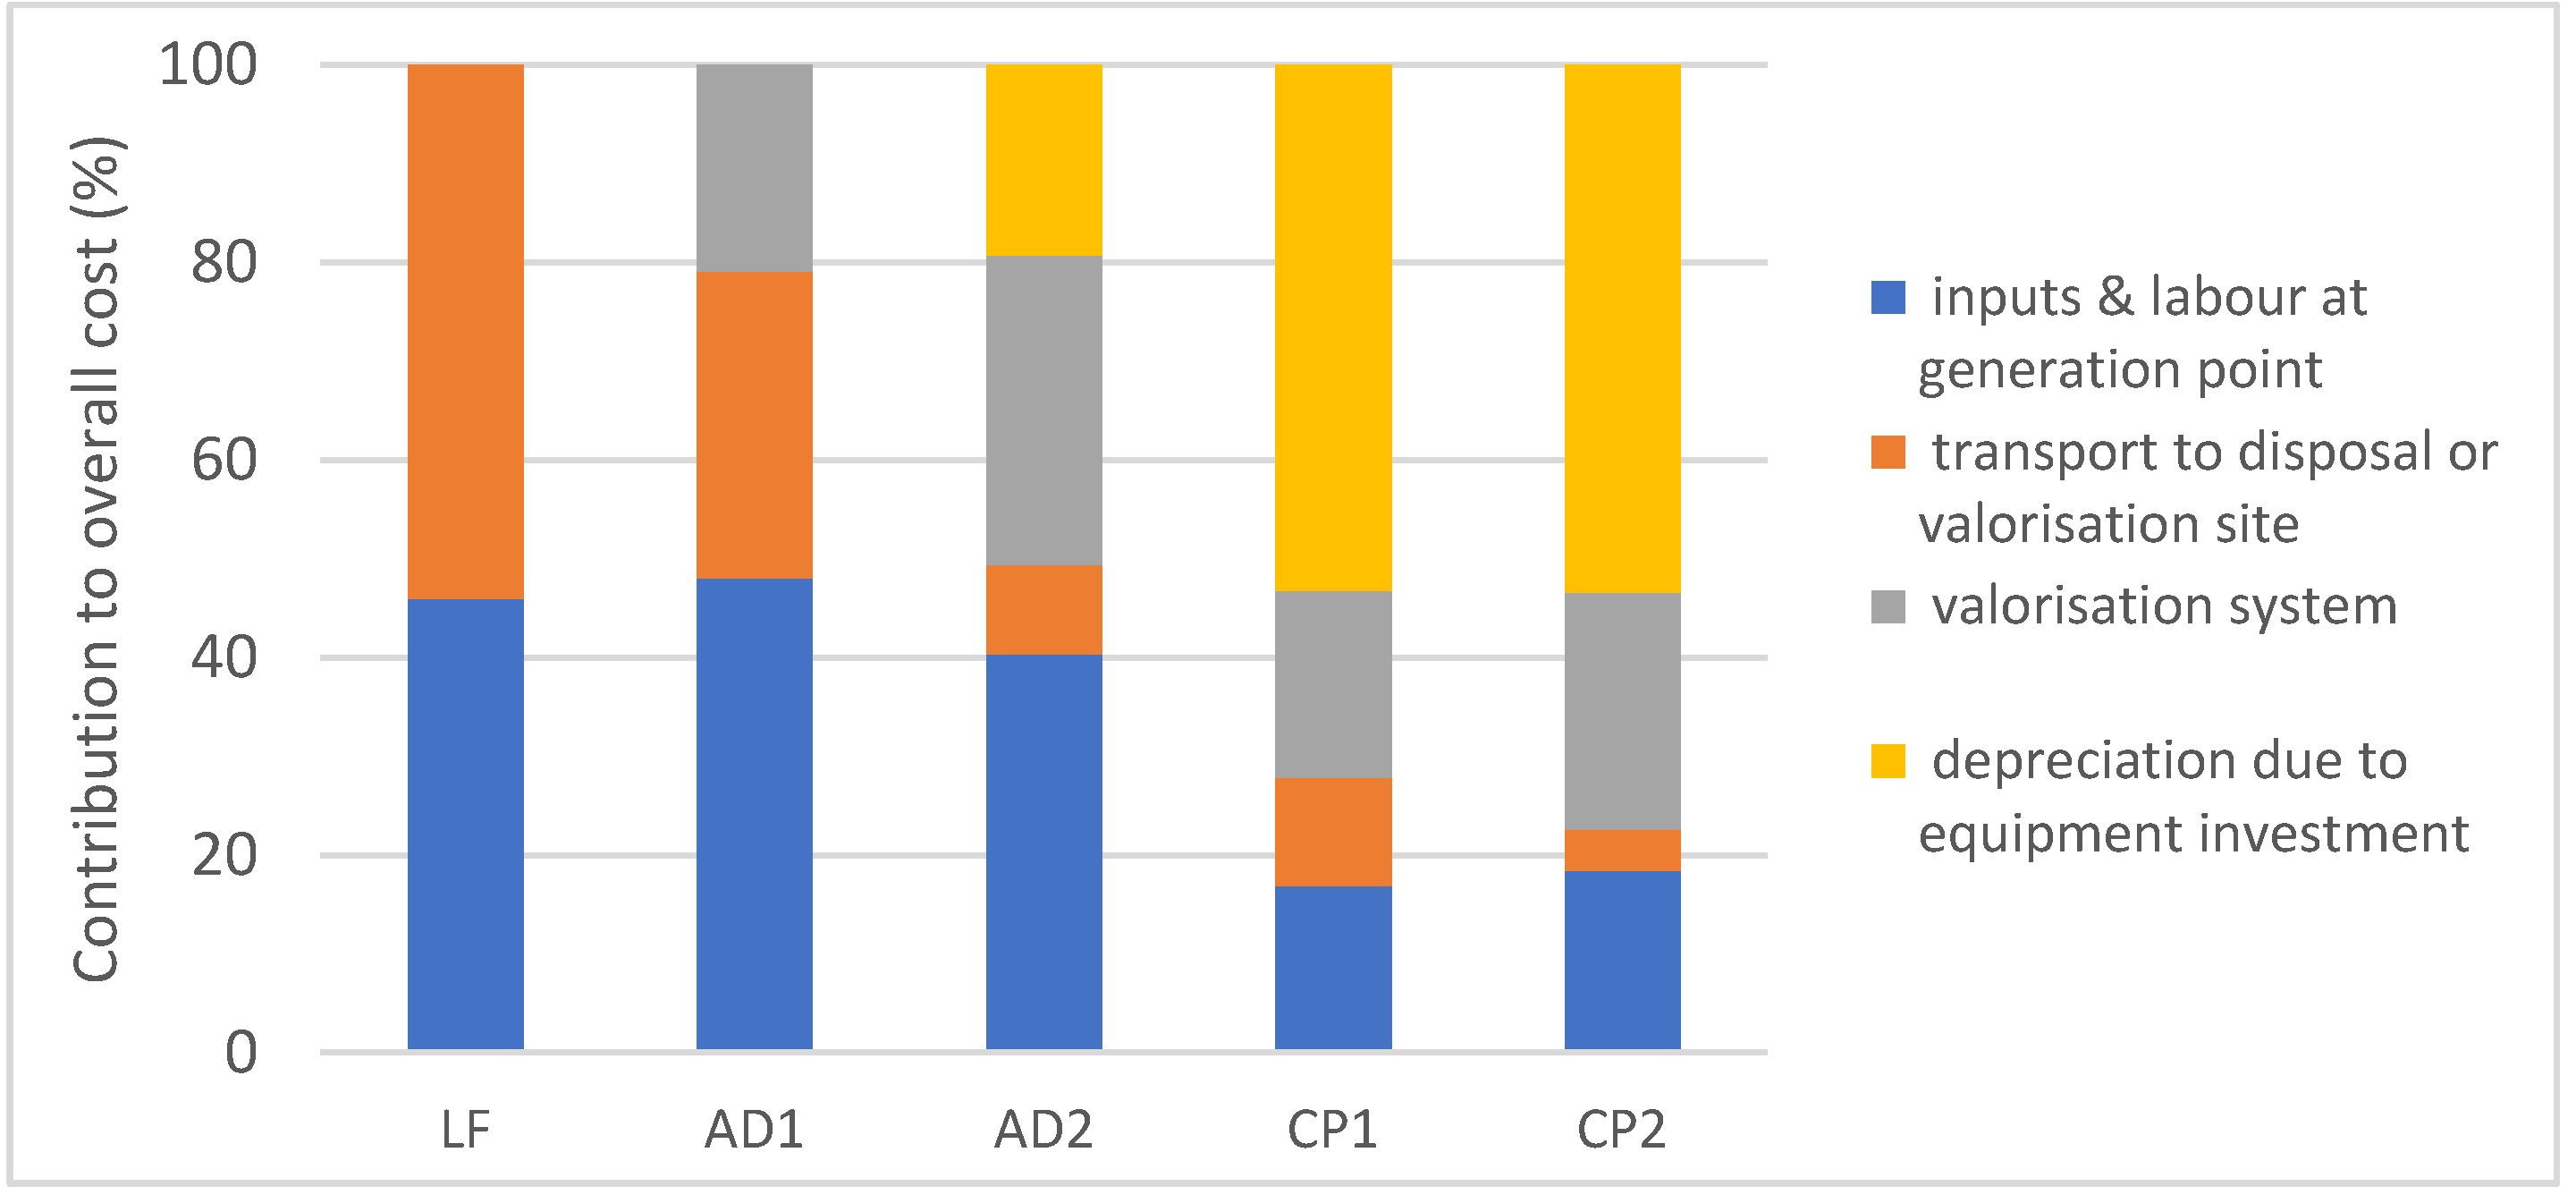
The five campuses were evaluated to assess the possibility of establishing an FW valorization plant (Table 3).
As part of the design of the scenarios, this study qualified the capacity of the five campuses to implement FW valorization alternatives. Sites A, C and E had available space, and C and E would have already existing infrastructure and equipment for at least one of the valorization alternatives. Site A obtained the highest score due to the generation of 41.72 ton of FW per year, followed by E (26.51 ton FW year−1), C (20.33 ton FW year−1), B (20.32 ton FW year−1) and D (8.45 ton FW year−1). Consequently, after assigning the values and weight for each criterion, site E was defined as the site of preference to establish an FW valorization plant. Sites C and A would follow, one because of the existence of space and infrastructure, and the other because of the available space and amount of FW which could remain in place in order to avoid its transportation around the consortium. Sites B and D had limited capacities for the establishment of FW-to-energy alternatives.
Considering those results, there was a fist calculation of the best possible route design, named route 1. It consisted of 126 km and FW would be collected first at site A, and continue to point B, to D, to C and finalize in E where the valorization would take place.
The second route calculation proposed a collection route with four sites. In that case, the FW collection route 2 would consist of 33 km of FW transportation. It entailed a semi-centralized valorisation system, where the sites that obtained the second and third highest scores in the site evaluation matrix for the plant selection (Table 3) would become FW treatment facilities as well. Therefore, FW from site B would be transported to site A, where FW valorization of both sites would take place; in parallel, site C would valorize its own FW and the one carried from site D; and site E would process its own waste. It would be still done with the restriction of one single truck for FW collection.

3.2. LCA and E-LCC

The second method of this framework, based on LCT allowed us to observe the different environmental and cost impacts of the evaluated scenarios.
Table 4 presents the LCA results, regarding the impact categories selected for this study, and from which the GWP and LU were considered for the further science-to-expert approach.
The disposal of the FW in a business-as-usual scenario such as LF, presents higher Global Warming Potential and Freshwater Eutrophication impacts than the four valorization scenarios. However, CP1 and CP2 present a higher Land-Use than the rest, while AD1 and AD2, has the lowest Land-Use impact of the scenarios. LF has lower Acidification Potential than scenarios AD1, CP1 and CP2; and the four alternative scenarios would have higher Mineral Resources and Fossil Resources depletion than LF. Water Consumption is also increased in all valorization alternatives, except CP1.
Figure 5, Figure 6, Figure 7, Figure 8, Figure 9, Figure 10, Figure 11 and Figure 12 summarise the environmental impacts, detailed in three phases or stages for each scenario: inputs, FW transport and FW disposal (or treatment).
Trade-offs among impact categories are observed. Transportation and the biodegradation process itself explains the higher Land-Use in CP1 and CP2; in contrast to AD1 and AD2, which would represent the least Land-Use impact of the scenarios. The Acidification Potential is influenced mostly by higher transport requirements and valorization processes. The higher potential impacts than LF for Mineral Resources and Fossil Resources depletion are attributable mostly to the increase in the FW transport. With the exception of scenario CP1, Water Consumption is also increased in all valorization alternatives, being the main reason, that now more cleaning operations would be mandatory both at generation point and in the valorization sites, while this latter was not required in the LF scenario. However, it should be observed that an approximately of 15% to 33% of this water would come from sustainable sources such as rainfall in alternative scenarios.
In summary, the FW treatment technique is the highest contributor to the Global Warming Potential, the Water Consumption and Land-Use impact categories (Figure 5, Figure 6, Figure 7, Figure 8, Figure 9, Figure 10 and Figure 11); however, inputs would have higher proportional contributions in AD2 and CP2 scenarios, evidencing that transport becomes a hotspot.
GWP and LU are two relevant categories that would deserve in-depth observation (Figure 10 and Figure 11), where the disposal or treatment practice plays a relevant role in the whole impact on both categories.
While transport of the FW is almost imperceptible in the overall LF Global Warming Potential (it is assumed the FW would be transported from the generation sites to closer landfills), the centralized alternatives AD1 and CP1 show a considerable increase due to the transport of the FW in route 1, accountable for a distance of 126km. This impact is lowered in the semi-centralized scenarios AD2 and CP2, where the FW transport is responsible for less than 4% of that impact, consequent with the 33km in route 2. Besides the treatment or valorization process, transport operations remain as one of the main contributors in the centralized scenarios (AD1 and CP1) for the impact category concerning Land-Use as well.
Regarding costs, the E-LCC showed that all valorization alternatives, except AD1, would result in higher yearly costs than LF (Table 5), and the contribution of the different elements of the cost will vary depending on each scenario (Figure 12).
Besides the already considered operators at the FW generation point to aid in cleaning and collection activities, AD1 and CP1 scenarios would require an estimate of 1.36 fulltime additional operators, while AD2 and CP2 would require 1.87 fulltime additional operators, with the correspondent calculation in monetary units and addition to the valorization system costs.
The increased yearly costs for most of the alternatives are attributed to a scale effect, the undertaking of new operations within the campus where the plant or plants would be established, and the depreciation of the required equipment were not previously available. LF does not incur in depreciation or valorization costs. In contrast, AD1, AD2, CP1 and CP2 would have new cost elements represented by the FW transport to the valorization site(s), and the FW processing operations, represented by materials, transport of those materials, and labor. In addition, the investment in new equipment will most definitely have economic impacts in the operation, as observed in the CP1 and CP2 scenarios in contrast to the AD1 and AD2 alternatives, or between AD1 and AD2 (for instance, AD1 would not require new investments because of an already existing and operational digestor). Similarly, CP2 would have a slightly lower depreciation cost since one of the campuses already has a composter.
The centralized scenarios such as CP1 have higher overall costs than AD2, CP2, and LF, attributable to the FW transport category; providing an important vision regarding the effects of centralization or semi-centralization of this type of recovery processes.
The study involved a system expansion, where market products were substituted by the side flows on each process, such as the biogas, digestate or compost (Table 6). For each alternative, a net effect was estimated, consisting of the impact that each new practice would suppose, the avoided impacts due to diverting the FW from the landfill, and the savings from substituting market products by the obtained side flows. In this case, liquified petroleum gas (LPG) would be substituted by biogas, and fertilizers, whether conventional or commercial compost bought by some of the universities or nearby farmers, would be substituted by the compost or digestate from the alternative scenarios.
The four FW-to-energy alternatives would suggest savings in CO2 eq emissions in comparison to the business-as-usual practice. The net effect for Costs shows savings for AD1 and AD2, but avoided expenses do not make up for the potential new costs of valorizing FW in scenarios CP1 and CP2. There would be a substitution in the purchase of inputs, creating attractive yearly savings in scenarios AD1 and AD2. These savings are explained by the LPG substitution and smaller contribution from the substitution of commercial organic fertilizers once the universities use the digestate. In contrast, CP1 and CP2, even when substituting fertilizers by the obtained compost, will not represent yearly savings; instead, it will result in increased expenses because of higher depreciation costs and lower value products (compost) in regards to the AD alternatives.
A sensitivity analysis was conducted, observing effects in GWP and LU because of changes of certain inputs. On one hand, rice husk is one of the inputs for the adapted-Takakura compost method in the CP1 and CP2 alternatives, and would suppose an increased impact. However, the researchers decided to only account for its upstream transportation into the system. This was founded in the fact that the rice husk is a side flow of other processes, and the potential consumption of the input in the evaluated scenarios would not surpass 0.003% of the national inventory; therefore, competitive use of the husk or changes in the already existing local conditions are not expected to cause significant changes in the local market. Another input that deserved attention was the cleaning products, like chlorine, due to the contaminant power it is accounted for. Experts would suggest that quaternary ammonium and peracetic acid can be an effective option for disinfecting, besides the latter would be widely accepted to be used in food processing areas. Therefore, the analysis considered substituting sodium hypochlorite for acetic acids in one of the valorization scenarios, suggesting that this change would decrease the GWP by 180.976 kg CO2 eq, and the LU by 4.224 m2a crop eq. One additional concern in this last matter has to do with cost, since quaternary ammonium and peracetic acid can be more expensive than chlorine.

3.3. AHP Multicriteria Decision-Method

The science-to-expert approach indicated that, given the context where this case study was developed, the two most relevant criteria under which FW-to-energy alternatives should be evaluated are job generation and Land-Use (Table 7). Depreciation costs and Global Warming Potential followed at an intermediate level of relevance, and finally, the ease of implementation and the net economic effect were the less relevant criteria for these experts.
Knowing the assigned priority to the criteria, comparison matrices are presented in Table 8, consisting of the judgment for the FW-to-energy scenarios under consideration, regarding each of the evaluation criteria. Afterwards, Table 9 presents the ranking for the scenarios that entailed different FW-to-energy alternatives for this university consortium according to the experts.

4. Discussion

As a first method of the proposed methodological framework, the calculations through the site decision matrix and linear programming allowed the researchers to identify site E as the preferred to establish an FW valorization plant. However, it is observed that factors such as the integration of the consortium and the withdrawing of one of them from the route would account for a significant reduction of distance between one route and the other. Expected implications were observed in the results of CP or AD alternatives, entailing effects on the environmental and cost performance of the valorization alternatives, as well as in the decision in this study, of centralized FW valorization systems (with an FW collection route of 126 km) or semi-centralized ones (with FW collection route of 33km). In this sense, careful selection of parameters, weighting, and available information play a key role in the output of similar design of case studies.
As the second method of the framework, LCT proves to be clear and consistent in expressing the environmental and cost impacts of the evaluated scenarios. Previous sources indicate the fittingness of LCA [27,42] and E-LCC [15,25,42] to approach waste management situations, including FW. The stability of the LCT for the environmental and economic dimensions of sustainability studies, oriented by ISO14040 Standard [48] and Hunkeler D., Lichtenvort K., and Rebitzer, G [49] opens the possibility of comparability, perhaps not always among cases due to the diversity of elements of each scenario, but within cases as an improvement monitoring tool. However, the social dimension is still not addressed in the same manner, suggesting this to be a further area of research. Therefore, in this case, it was mostly evaluated by experts.
The LCA and E-LCC results of this study suggest AD to be the better performing FW-to-energy alternative, whether centralized or semi-centralized, being consistent with the municipal and experimental analysis that locates anaerobic digestion as a suitable treatment in terms of lower environmental impacts, side flow opportunities and economic perspectives [14,15,34]. Even when finding coincidence in hotspots such as the actual degradation technique, many of the consulted sources disregard transportation as a hotspot, reinforcing the need to observe system boundaries definitions when comparing studies and the relevance of centralization (or not) when proposing waste management systems [17].
The properties of the biomass to be valorized play a relevant role in the outcomes of each alternative. This study undertook valorization techniques already proven to work under the local conditions [21,22], based particularly in the balance of food groups comprised in FW. However, further experimentation based on properties regarding side flow production, calorific or nutritional potential and feedstock [17], as well as geographical origin, the type of collection source and the season of the collection [20] should be considered. In this sense, biomass characteristics could be included inside flow characterization experiments, or as a criterion to be assessed by the experts in decisional methods like the AHP.
The E-LCC also allowed to observe that the contribution of each element of the cost will vary with each scenario and more long-term and expanded perspectives must become part of these decisions. As an illustration of this argument, it is possible that if the decision was to rest uniquely upon the overall cost, FW treatment alternatives would not be of interest due to higher costs than the business-as-usual scenario. However, a wider comprehension of the circular economy principles, that considers the use and value of side flows [2,42] and performed by a system expansion in this study, allowed to understand that the AD scenarios would not only be avoiding environmental impacts but would be generating potential incomes.
Context-wise, it is relevant to highlight that the biogas was not considered in this case for electricity production, since the Costa Rican electricity grid is considered as already sustainable, and sufficient energy comes mostly from hydroelectric sources, followed by Eolic and geothermal sources [58]. Nonetheless, the country has an important consumption of fossil fuels such as LPG for combustion. For instance, universities would use liquefied petroleum gas (LPG) for their academic and research laboratories, and in their restaurants. In parallel, there is a relevant amount of Costa Ricans that would use LPG for cooking [56], consequently the study assumed the universities or nearby users can substitute LPG by biogas; however, acceptance rates were not inserted in this study. Another product would be the digestate from the AD1 and AD2 scenarios, as well as the compost in CP1 and CP2 scenarios. The selected valorization sites could use these products as a source of organic fertilizers in experimental fields where agricultural-related study programs or gardening activities are detected. Consequently, the costs and substitution preference cannot be considered as general for these valorization alternatives, but rather case-specific.
As a third and final step in the proposed decisional framework, the AHP method allowed the consulted experts to provide answers that were later computed to rank the alternatives. In this case, the two centralized alternatives ranked first (AD1 followed by CP1), then the semi-centralized composting scenario CP2 obtained the third place in the ranking and the AD2 alternative was placed fourth. Both the results of the pairwise comparisons and the open-question answers suggest AD1 would have a priority within the alternatives because of less Land-Use impact and lower Depreciation costs. However, when considering the rest of the criteria, CP1 was a second choice related to aspects such as the Ease-of-implementation. This last criterion, even when not highly prioritized, was usually present in the comments of the experts, mentioning that operating one facility might be easier than managing the simultaneous operation of several. In that sense, the comparison between the two semi-centralized alternatives, suggested composting in three plants was preferred to installing AD plants in three sites, therefore AD2 ranked the lowest from the four alternatives.
Feedback from the experts resulted in a positive overview of the proposed methodological framework for decision-making towards more circular approaches to manage FW, given the combination of methods and quantitative data that allowed to better understand the scenarios when supplied to the experts. They also expressed the sequence of methods allowed them to make an informed choice together with their experience and knowledge. Finally, they also found it to be innovative for the local context where decisions need to be more robust and consistent, since public policy creation, and implementation is considered by them to be a complex, multidisciplinary and dynamic process. Other experts suggested future scenarios to be evaluated as well, due to the scale of the consortium, where more artisanal composters were evaluated, and some presented a potential concern regarding the use of biogas and its acceptability at the consortium and local levels.

5. Conclusions

This paper evaluated four FW-to-energy alternatives and compared them to a landfill scenario through a system expanded LCA and E-LCC. The ultimate purpose was to contribute in decision-making processes related to FW valorization alternatives, and therefore it proposed an integrated methodological framework, combining LCT approaches with Linear programming and multicriteria decision methods such as (AHP).
From the environmental standpoint, main findings indicate that FW valorization alternatives in general, would entail reduced Global Warming Potential and Freshwater Eutrophication than the landfilling alternative; however, trade-offs are observed regarding other impact categories such as Terrestrial Acidification, Mineral Resource Scarcity and Fossil Resource Scarcity, where the potential impact from the valorization would be increased. Other environmental impact categories would perform differently when anaerobic digestion or composting were evaluated; nonetheless, it was clear that anaerobic digestion would entail lower Land-Use than composting and landfilling. Moreover, centralization or semi-centralization would also suggest different impacts, mostly in terms of the contribution that transportation would make to each impact category.
Regarding the economic and social dimensions, the findings conclude that, for the given circumstances and context, most of the FW-to-energy alternatives would have higher overall costs than the landfilling, something that is evidently reverted once a system expansion approach is considered. In this sense, when the valorization and the circular economy concepts are understood and explained through savings in products that can be substituted by side flows of the composting and the anaerobic digestion of the wastes, the proposed alternatives can become appealing for decision-makers. Besides, the valorization of the FW would require more labor, seen as an increased cost but also as an opportunity for job creation.
Further research and validation of the framework in different contexts are suggested, as well as the consideration of extended scopes where other criteria are evaluated, such as more in-depth biomass composition and energy properties, and the effects on the obtained side flows.
The trade-offs and potential interpretation of results will not always provide a straightforward selection of an alternative. Therefore, the proposed holistic methodological framework allowed a logical process of case definition and scenarios modeling, accompanied by scientifically-based assessment methods, together with a science-to-expert approach. This latter comprised a better understanding within this context, once experts offer their perspective by a well-structured and systematized method as the AHP.
Even with the limits of a case study, this research suggests that the circular economy is applicable for different activities. Evidence is always necessary to consider shifting from one scenario, as the usual and current landfilling one, to a more circular one where valorization of FW can improve not only the waste management within this university consortium, but the obtention of valuable products with the opportunity to positively affect environmental, social, and economic indicators.
Similar cases, such as small municipalities or groups of institutions, can benefit from a similar approach as the one presented in this research, since decisions can be guided in a systematic manner with already proven, sequential and steady methods like linear programming, LCA, LCC and AHP.

Supplementary Materials

The following are available online at https://www.mdpi.com/1996-1073/13/9/2291/s1 and include LCA and LCC information (Goal and Scope, system boundaries and flow diagram, inventories of LF, CP1, CP2, AD1 and AD2 scenarios, calculations and assumptions for inventories and generic information and sources used for those calculations.

Author Contributions

Conceptualization: L.B.-P.; methodology: L.B.-P., F.D.M.; M.F.J.-M.; validation, M.V. and R.C.-R.; formal analysis, L.B.-P., F.D.M. and M.F.J.-M.; writing—original draft preparation L.B-P.; writing—review and editing, M.V., F.D.M. and R.C.-R.; supervision, M.V. All authors have read and agreed to the published version of the manuscript.

Funding

This research was funded by Tecnológico de Costa Rica, project ID 1431012 in cooperation with the Universitly of Bologna within the Agricultural, Environmental and Food Science and Technology PhD Programme, CV in International cooperation and sustainable development policies.

Acknowledgments

The authors would like to thank and recognized the support provided by Gerlin Salazar from University of Costa Rica, Oliviero Bergamin from the University of Bologna, and Rui Leonardo Madime, Felipe Vaquerano, Rubén Calderón, from Tecnológico de Costa Rica for their professional advice. Students Jonathan Castro, Daniela Valverde, Marianela Ávila, Raizeth Chaves, Noelia González, Fiorella Ramírez, Eva Vargas, Andrey Ureña and Rolando Jimenez from Tencnológico de Costa Rica also provided provided support during field and data collection processes. We would also like to recognize REDIES for their proactive approach in FW quantification together with the Costa Rican Food Loss and Waste Network, together with the authors of the first FW quantification study in Costa Rica: Julián Rojas-Vargas, Yanory Monge-Fernán, Manrique Arguedas Camacho, Cindy Hidalgo-Viquez, Marcela Peña-Vásquez y, Blanca Vásquez Rodríguez, co-authors with Laura Brenes-Peralta and María Fernanda Jiménez-Morales. Finally, the experts of the consultation provided invaluable support to this research, out deep thanks.

Conflicts of Interest

The authors declare no conflict of interest.

References

  1. Corona, B.; Shen, L.; Reike, D.; Carreón, J.R.; Worrell, E. Towards sustainable development through the circular economy—A review and critical assessment on current circularity metrics. Resour. Conserv. Recycl. 2019, 151, 104498. [Google Scholar] [CrossRef]
  2. Ellen MacArthur Foundation. Concept, What Is Circular Economy? A Framework for an Economy that Is Restorative and Regenerative by Design. Available online: https://www.ellenmacarthurfoundation.org/circular-economy/concept (accessed on 18 December 2019).
  3. Fridahl, M. Bioenergy with Carbon Capture and Storage: From Global Potentials to Domestic Realities. Available online: https://www.liberalforum.eu/wp-content/uploads/2018/11/beccs_publication.pdf (accessed on 5 October 2019).
  4. Herrera-Murillo, J.; Rojas-Marín, J.F.; Anchía-Leitón, D. Tasas de generación y caracterización de residuos sólidos ordinarios en cuatro municipios del área metropolitana costa rica. Revista Geográfica de América Central 2016, 2, 235–260. [Google Scholar] [CrossRef] [Green Version]
  5. FAO. Food Wastage Footprint & Climate CHANGE. Available online: http://www.fao.org/3/a-bb144e.pdf (accessed on 5 October 2019).
  6. FAO. Food Wastage Footprint: Fool Cost-Accounting, Final Report; FAO: Rome, Italy, 2014; ISBN 978-92-5-108512-7. [Google Scholar]
  7. Corrado, S.; Ardente, F.; Sala, S.; Saouter, E. Modelling of food loss within life cycle assessment: From current practice towards a systematisation. J. Clean. Prod. 2017, 140, 847–859. [Google Scholar] [CrossRef]
  8. FAO. FAO and the SDSs. Indicators: Measuring up to the 2030 Agenda for Sustainable Development; FAO: Rome, Italy, 2017. [Google Scholar]
  9. HLPE. Food Losses and Waste in the Context of Sustainable Food Systems. A Report by the High Level Panel of Experts on Food Security and Nutrition of the Committee on World Food Security; FAO: Rome, Italy, 2014. [Google Scholar]
  10. Wang, D.; Tang, Y.-T.; Long, G.; Higgitt, D.; He, J.; Robinson, D. Future improvements on performance of an EU landfill directive driven municipal solid waste management for a city in England. Waste Manag. 2020, 102, 452–463. [Google Scholar] [CrossRef]
  11. Papargyropoulou, E.; Lozano, R.; Steinberger, J.K.; Wright, N.; Bin Ujang, Z. The food waste hierarchy as a framework for the management of food surplus and food waste. J. Clean. Prod. 2014, 76, 106–115. [Google Scholar] [CrossRef]
  12. Hoehn, D.; Margallo, M.; Laso, J.; Aldaco, R.; Bala, A.; Fullana-I-Palmer, P.; Irabien, A.; Aldaco, R. Energy Embedded in Food Loss Management and in the Production of Uneaten Food: Seeking a Sustainable Pathway. Energies 2019, 12, 767. [Google Scholar] [CrossRef] [Green Version]
  13. El Mashad, H.M.; Zhang, R. Biogas production from co-digestion of dairy manure and food waste. Bioresour. Technol. 2010, 101, 4021–4028. [Google Scholar] [CrossRef]
  14. Slorach, P.C.; Jeswani, H.K.; Cuéllar-Franca, R.; Azapagic, A. Environmental and economic implications of recovering resources from food waste in a circular economy. Sci. Total Environ. 2019, 693. [Google Scholar] [CrossRef]
  15. Edwards, J.; Othman, M.; Crossin, E.; Burn, S. Life cycle assessment to compare the environmental impact of seven contemporary food waste management systems. Bioresour. Technol. 2018, 248, 156–173. [Google Scholar] [CrossRef]
  16. Demichelis, F.; Piovano, F.; Fiore, S. Biowaste Management in Italy: Challenges and Perspectives. Sustainability 2019, 11, 4213. [Google Scholar] [CrossRef] [Green Version]
  17. Xu, F.; Li, Y.; Ge, X.; Yang, L.; Li, Y. Anaerobic digestion of food waste—Challenges and opportunities. Bioresour. Technol. 2018, 247, 1047–1058. [Google Scholar] [CrossRef] [PubMed]
  18. Ávila-Hernández, M.; Campos-Rodríguez, R.; Brenes-Peralta, L.; Jiménes-Morales, M.F. Generación de biogás a partir del aprovechamiento de residuos sólidos biodegradables en el Tecnológico de Costa Rica, sede Cartago. Revista Tecnología en Marcha 2018, 31, 159–170. [Google Scholar] [CrossRef]
  19. Bong, C.P.C.; Lim, L.Y.; Lee, C.T.; Klemeš, J.J.; Ho, C.S.; Ho, W.S. The characterisation and treatment of food waste for improvement of biogas production during anaerobic digestion—A review. J. Clean. Prod. 2018, 172, 1545–1558. [Google Scholar] [CrossRef]
  20. Fisgativa, H.; Tremier, A.; Dabert, P. Characterizing the variability of food waste quality: A need for efficient valorisation through anaerobic digestion. Waste Manag. 2016, 50, 264–274. [Google Scholar] [CrossRef] [PubMed]
  21. Borrero-González, G.P.; Arias-Aguilar, D.; Campos-Rodríguez, R.; Pacheco-Rodríguez, F. Estudio comparativo del uso de dos sustratos con inóculos microbiales para el tratamiento de residuos orgánicos sólidos en compostaje doméstico. Análisis Económico. Revista Tecnología en Marcha 2016, 29, 28–37. [Google Scholar] [CrossRef] [Green Version]
  22. Chaves-Arias, R.; Campos-Rodríguez, R.; Brenes-Peralta, L.; Jiménez-Morales, M.F. Compostaje de residuos sólidos biodegradables del restaurante institucional del Tecnológico de Costa Rica. Revista Tecnología en Marcha 2019, 232, 39–53. [Google Scholar] [CrossRef]
  23. Ramírez-Ramírez, F.; Campos-Rodríguez, R.; Jiménez-Morales, M.F.; Brenes-Peralta, L. Evaluación técnica, ambiental y económica de tres tipos de tratamiento para el cultivo de lechuga en huertas caseras de Guácimo, Limón, Costa Rica. Revista Tecnología en Marcha 2016, 29, 14–24. [Google Scholar] [CrossRef] [Green Version]
  24. Yang, Y.; Bao, W.; Xie, G.H. Estimate of restaurant food waste and its biogas production potential in China. J. Clean. Prod. 2019, 211, 309–320. [Google Scholar] [CrossRef]
  25. De Menna, F.; Dietershagen, J.; Loubière, M.; Vittuari, M. Life cycle costing of food waste: A review of methodological approaches. Waste Manag. 2018, 73, 1–13. [Google Scholar] [CrossRef]
  26. Cleary, J. The incorporation of waste prevention activities into life cycle assessments of municipal solid waste management systems: Methodological issues. Int. J. Life Cycle Assess. 2010, 15, 579–589. [Google Scholar] [CrossRef]
  27. Saraiva, A.B.; Jansen, J.L.C. Review of comparative LCAs of food waste management systems—Current status and potential improvements. Waste Manag. 2012, 32, 2439–2455. [Google Scholar] [CrossRef]
  28. Saaty, T.L. Decision making with the analytic hierarchy process. Int. J. Serv. Sci. 2008, 1, 83–98. [Google Scholar] [CrossRef] [Green Version]
  29. Campos-Rodríguez, R.; Soto-Córdoba, S. Análisis de la situación del estado de la Gestión Integral de Residuos (GIR) en el Cantón de Guácimo, Costa Rica. Revista Tecnología en Marcha 2014, 27, 114–124. [Google Scholar] [CrossRef] [Green Version]
  30. Rojas-Vargas, J.; Monge-Fernánde, Y.; Jiménez-Morales, M.F.; Brenes-Peralta, L.; Arguedas-Camacho, M.; Hidalgo-Víquez, C.; Peña-Vásquez, M.; Vasquez-Rodríguez, B. Food Loss and Waste in food services from educational institutions in Costa Rica. Tecnología en Marcha 2020. (accepted). [Google Scholar]
  31. Sepúlveda, J.A.M. Outlook of Municipal Solid Waste in Bogota (Colombia). Am. J. Eng. Appl. Sci. 2016, 9, 477–483. [Google Scholar] [CrossRef] [Green Version]
  32. JICA; Ex Reserach Institute Ltd.; Rurban Designs Inc. Estudio y Recopilación de Datos sobre el Sector de Manejo de Residuos Sólidos en América Central y Caribe. Available online: https://openjicareport.jica.go.jp/pdf/12091906.pdf (accessed on 30 March 2020).
  33. Sánchez Tejeda, G.M. Análisis de Ciclo de Vida aplicado a la gestión de residuos urbanos del Distrito Nacional de la República Dominicana. Master’s Thesis, Nebrija Universidad, Madrid, Spain, July 2012. [Google Scholar]
  34. Fernández-González, J.; Grindlay, A.; Serrano-Bernardo, F.; Rojas, M.I.R.; Zamorano, M. Economic and environmental review of Waste-to-Energy systems for municipal solid waste management in medium and small municipalities. Waste Manag. 2017, 67, 360–374. [Google Scholar] [CrossRef] [PubMed]
  35. Rodríguez, A.G.; Rodrigues, M.; Sotomayor, O. Hacia una Bioeconomía Sostenible en América Latina y el Caribe: Elementos para una Visión Regional. Serie Recursos Naturales y Desarrollo; Comisión Económica para América Latina y el Caribe (CEPAL): Santiago, Chile, 2019. [Google Scholar]
  36. FAO. 4° Boletín Pérdidas y Desperdicio de Alimentos en América Latina y el Caribe; FAO-RLC: Santiago, Chile, 2017; I7248ES/1/12.17. [Google Scholar]
  37. MINAE; MIDEPLAN; Ministerio de Relaciones Exteriores de Costa Rica. Política Nacional de Producción y Consumo Sostenibles 2018–2030. Available online: http://www.digeca.go.cr/sites/default/files/documentos/politica_nacional_de_produccion_y_consumo_sostenibles.pdf (accessed on 8 January 2020).
  38. MINAE. Plan de Descarbonización 2019–2050. Available online: https://minae.go.cr/images/pdf/Plan-de-Descarbonizacion-1.pdf (accessed on 8 January 2020).
  39. Sistema Costarricense de Información Jurídica, Ley para la Gestión Integral de Residuos 883. Available online: https://www.pgrweb.go.cr/scij/Busqueda/Normativa/Normas/nrm_texto_completo.aspx?param1=NRTC&nValor1=1&nValor2=68300&nValor3=83024&strTipM=TC (accessed on 8 January 2020).
  40. Red Costarricense para Disminución de pérdida y desperdicio de alimentos. Guía para Medición de Desperdicio de Alimentos en Cocinas Institucionales o Comerciales. Available online: https://www.tec.ac.cr/sites/default/files/media/doc/2_guia_medicion_cocinas_web.pdf (accessed on 20 January 2020).
  41. Östergren, K.; Gustavsson, J.; Bos-Brouwers, H.; Timmermans, T.; Hansen, O.-J.; Møller, H.; Anderson, G.; O’Connor, C.; Soethoudt, H.; Quested, T.; et al. FUSIONS Definitional Framework for Food Waste; SIK—The Swedish Institute for Food and Biotechnology: Göteborg, Sweden, 2014; ISBN 978-91-7290-331-9. [Google Scholar]
  42. Davis, J.; De Menna, F.; Unger, N.; Östergren, K.; Loubiere, M.; Vittuari, M. Generic Strategy LCA and LCC —Guidance for LCA and LCC Focused on Prevention, Valorisation and Treatment of Side Flows from the Food Supply Chain; SP Technical Research Institute of Sweden: Boras, Sweden, 2017; ISBN 978-91-88349-84-2. [Google Scholar]
  43. Tobón Botache, M.I.; Cruz Viveros, J.A. Métodos de Localización de Plantas Industriales. Available online: https://repository.usc.edu.co/handle/20.500.12421/2458 (accessed on 14 February 2020).
  44. Carro Paz, R.; González Gómez, D. Localización de Instalaciones. Universidad Nacional de Mar del Plata. Available online: http://nulan.mdp.edu.ar/1619/1/14_localizacion_instalaciones.pdf (accessed on 14 February 2020).
  45. Quintero-Peralta, M.A.; Gallardo-Cobos, R.; Ceña-Delgado, F. Impact of decreasing staple food production capacity on food self-sufficiency in poor rural communities in Mexico. Economía Agraria y Recursos Naturales 2016, 16, 33–67. [Google Scholar] [CrossRef] [Green Version]
  46. Gaytán Iniesta, J.; Arroyo López, M.d.P.E.; Enríquez Colón, R. Un modelo bi-criterio para la ubicación de albergues, como parte de un plan de evacuación en caso de inundaciones. Revista Ingeniería Ind. 2012, 11, 35–56. [Google Scholar]
  47. Taha, H.A. Investigación de Operaciones, Authorized Translation from the English Language Edition Entitled Operations Research: An Introduction, 9th ed.; Pearson Education Inc.: Ciudad de México, Mexico, 2012; ISBN 978-607-32-0796-6. [Google Scholar]
  48. INTECO. Análisis de ciclo de vida: INTE/ISO 14040:2007; INTECO: San José, Costa Rica, 2007. [Google Scholar]
  49. Hunkeler, D.; Lichtenvort, K.; Rebitz, G. Environmental Life Cycle Costing; Taylor & Francis Group: Boca Raton, FL, USA, 2008; ISBN 1-880611-38-X. [Google Scholar]
  50. De Menna, F.; Davis, J.; Östergren, K.; Unger, N.; Loubiere, M.; Vittuari, M. A combined framework for the life cycle assessment and costing of food waste prevention and valorization: An application to school canteens. Agric. Food Econ. 2020, 8, 1–11. [Google Scholar] [CrossRef]
  51. Brenes-Peralta, L.; Jiménez-Morales, M.F. Condición actual del mercado del abono orgánico en el cantón de Alvarado, Cartago. Revista Tecnología en Marcha 2014, 27, 65–75. [Google Scholar] [CrossRef]
  52. Ministerio de Salud de Costa Rica. Inventario de Georeferenciación y de Caracterización Fìsico—Químico de Lixiviados, Suelos y Gases, en sitios de Disposicion Final de Residuos. Available online: https://www.ministeriodesalud.go.cr/index.php/component/content/article?id=617 (accessed on 8 January 2020).
  53. Rudín, V.; Soto, S.; Linnenberg, C. Elaboración de la Propuesta de Proyecto a Financiar para una NAMA de Residuos Sólidos en Costa Rica. Available online: https://cambioclimatico.go.cr/wp-content/uploads/2019/07/Primer-informe-Situaci%C3%B3n-de-la-Gesti%C3%B3n-de-los-Residuos-S%C3%B3lidos-para-la-determinaci%C3%B3n-de-la-NAMA-residuos-Costa-Rica.pdf (accessed on 20 January 2020).
  54. Suhartini, S.; Lestari, Y.P.; Nurika, I. Estimation of methane and electricity potential from canteen food waste. Int. Conf. Green Agro Ind. Bioecono. IOP Conf. Ser. Earth Environ. Sci. 2019, 230. [Google Scholar] [CrossRef]
  55. United Nations. Conversion Factors. Available online: http://mdgs.un.org/unsd/energy/balance/2013/05.pdf (accessed on 8 January 2020).
  56. RECOPE. Gas Licuado de Petróleo (G.L.P.). Available online: https://www.recope.go.cr/productos/calidad-y-seguridad-de-productos/gas-licuado-de-petroleo-glp/ (accessed on 8 January 2020).
  57. Bergamin, O. Evaluation of the Economic and Environmental Feasibility of a Biogas Plant in a University Campus: The Case of Tecnológico: The Case of Tecnológico de Costa Rica. Master’s Thesis, University of Bologna, Italy, February 2019. [Google Scholar]
  58. ICE. Informe Anual 2018 Generación y Demanda, Centro Nacional de Control de Energía. Available online: https://apps.grupoice.com/CenceWeb/CenceDescargaArchivos.jsf?init=true&categoria=3&codigoTipoArchivo=3008 (accessed on 30 March 2020).
Figure 1. Flow diagram of proposed situations in the University Consortium, for valorization through FW-to-energy alternatives. Source: [42] adapted by the authors.
Energies 13 02291 g001
Figure 2. Methodological framework for a decision-making process of food waste (FW) valorization alternatives.
Energies 13 02291 g002
Figure 3. Location of the five campuses of the universities from the consortium (image developed by Mariajosé Esquivel, using Costa Rican Digital Atlas, 2014. Projection: CRTM05. Q GIS Software, Version V3.4, The Open Source Geospatial Foundation OSGeo, Chicago, IL, USA).
Energies 13 02291 g003
Figure 4. Analytic Hierarchy Process (AHP) structure to evaluate FW valorization alternatives for the university consortium.
Energies 13 02291 g004
Figure 5. Impacts from FW landfilling disposal (LF).
Energies 13 02291 g005
Figure 6. Impacts from FW Anaerobic Digestion in a centralized scenario (AD1).
Energies 13 02291 g006
Figure 7. Impacts from FW Anaerobic Digestion in a semi-centralized scenario (AD2).
Energies 13 02291 g007
Figure 8. Impacts from FW Composting in a centralized scenario (CP1).
Energies 13 02291 g008
Figure 9. Impacts from FW Composting in a centralized scenario (CP2).
Energies 13 02291 g009
Figure 10. Contribution from each operation stage per FW treatment in the Global Warming Potential category.
Energies 13 02291 g010
Figure 11. Contribution from each operation stage per FW treatment in the Land-Use impact category.
Energies 13 02291 g011
Figure 12. Proportion of each cost element within the E-LCC analysis.
Energies 13 02291 g012
Table 1. Distance matrix among the five university campuses (sites) in kilometers (km).
SITESABCDE
A0224034104
B220161186
C401601182
D341111095
E1048682950
Table 2. Distance matrix among four of the university campuses (sites) in kilometers (km).
SITESABCD
A0224034
B2201611
C4016011
D3411110
Table 3. Evaluation matrix for the selection of the FW treatment site.
SiteAvailable SpaceTechnical CapacityAvailable InfrastructureFW QuantityScore
A251502565
B0150520
C2515351590
D01501025
E2515352095
Table 4. Life Cycle Assessment (LCA) for the business as usual and alternative FW disposal or treatment scenarios.
Impact CategoryUnitLFAD1AD2CP1CP2
Global Warmingkg CO2 eq90,050.0016,113.1611,906.4213,973.269376.31
Terrestrial Acidificationkg SO2 eq17.0140.1125.45193.92177.66
Freshwater Eutrophicationkg P eq2.232.201.921.801.34
Land Usem2a crop eq388.48230.30132.64542.52408.88
Mineral Resource Scarcitykg Cu eq6.8416.8011.6829.9216.41
Fossil Resource Scarcit kg oil eq1140.303034.221553.352992.811417.40
Water Consumptionm358.2259.7488.5755.5380.32
Table 5. Cost of the business as usual and alternative FW treatment scenarios, expressed in USD.
Cost CategoryLFAD1AD2CP1CP2
Inputs and labour at generation point7635.327635.327635.327635.327635.32
Transport to disposal or valorisation plant8986.264938.271709.294938.271709.29
Valorisation system-3334.815940.728562.199907.89
Depreciation due to equipment investment -3647.7024,023.6922,112.71
Total16,621.5815,908.4118,933.0345,159.4741,365.21
Table 6. Net effect of FW valorization alternatives for GWP, LU and Economic effect.
Indicator AD1AD2CP1CP2
GWP
(CO2 eq)
new impact16,113.1611,906.4213,973.269376.31
avoided impact1,260,078.391,219,486.4991,012.2990,050.00
net effect−1,243,965.24−1,207,580.07−7039.03−80,673.69
LU
(m2a crop eq)
new impact230.30132.64542.53408.88
avoided impact13,391.9512,248.63417.27388.48
net effect−13,161.65−12,115.99125.2620.40
Net Economic effect
(USD)
new cost15,908.4118,933.0345,159.4741,365.21
avoided cost729,659.58729,05.6619,985.7720,016.95
Net cost effect−713,751.18−710,772.6325,173.7021,348.26
Table 7. Evaluation criteria comparison matrix and priority vector.
IndicatorGlobal Warming PotentialLand-UseEase of ImplementationJob GenerationDepreciation CostNet Economic EffectPriority Vector
Global Warming Potential0.1300.1360.1940.1150.1240.1200.136
Land-Use0.2350.2450.1520.3130.2390.2210.234
Ease of implementation0.0570.1380.0850.0710.0870.0950.089
Job generation0.3060.2120.3270.2710.3010.2970.286
Depreciation cost0.1780.1730.1650.1520.1690.1810.170
Net economic effect0.0930.0950.0770.0780.0800.0860.085
CR = 0.01 < 0.10
Table 8. FW-to-energy valorization alternatives comparison matrices for each evaluation criterion.
Global Warming Potential Land-Use
AD1AD2CP1CP2priority vector AD1AD2CP1CP2priority vector
AD10.2010.2780.2040.1630.211 AD10.2660.3910.2550.1760.272
AD20.1070.1490.1660.1690.148 AD20.1080.1590.2850.1100.166
CP10.4050.3680.4110.4350.405 CP10.3600.1940.3460.5380.360
CP20.2870.2050.2200.2330.236 CP20.2660.2560.1130.1760.203
CR = 0.02 CR = 0.09
Ease of Implementation Job Generation
AD1AD2CP1CP2priority vector AD1AD2CP1CP2priority vector
AD10.2570.2650.3350.1780.259 AD10.5420.5400.5760.4840.535
AD20.2510.2580.2900.2100.252 AD20.1870.1860.1790.1890.185
CP10.1900.2200.2470.4020.265 CP10.1630.1800.1730.2300.186
CP20.3020.2580.1290.2100.225 CP20.1080.0940.0720.0960.093
CR = 0.05 CR = 0.01
Depreciation Cost Net Economic Effect
AD1AD2CP1CP2priority vector AD1AD2CP1CP2priority vector
AD10.1990.1100.2680.2080.196 AD10.2210.3850.1910.1860.246
AD20.3310.1820.2330.0950.210 AD20.0930.1610.2540.1560.166
CP10.2460.2600.3320.4640.325 CP10.4430.2420.3820.4530.380
CP20.2240.4470.1670.2340.268 CP20.2430.2110.1730.2050.208
CR = 0.10 CR = 0.06
Table 9. Evaluation and ranking of the FW-to-energy alternatives under study.
Global Warming PotentialLand-UseEase of ImplementationJob GenerationDepreciation CostNet Economic EffectPrioritizationRanking
(priority vector)(0.136)(0.234)(0.089)(0.286)(0.170)(0.085)
AD10.0290.0640.0230.1530.0330.0210.3231
AD20.0200.0390.0220.0530.0360.0140.1844
CP10.0550.0840.0240.0530.0550.0320.3042
CP20.0320.0480.0200.0260.0460.0180.1893

