Abstract
This research studies the macroscopic spray structure from a single-hole common rail diesel injector using gasoline-blended 5% biodiesel for use in compression ignition engines. To reduce the NOX/PM trade-off emissions, researchers are investigating gasoline used in compression ignition engines, called gasoline compression ignition. As a result that gasoline is injected directly into the combustion chamber, its spray field has a significant effect on combustion and emissions. Due to its low lubricity, gasoline is blended with biodiesel 5%, as a lubricity enhancer, to prevent the failure of the high-pressure injection system. The macroscopic spray structures of this gasoline blend were investigated Schlieren photography and planar laser-induced fluorescence-particle image velocimetry. Injection pressure was handled by a conventional common rail system, while ambient pressure was controlled by supplying nitrogen into the constant-volume combustion chamber. The effects of injection pressure and ambient pressure on the gasoline spray elucidated by Planar laser-induced fluorescence coupled with particle-image velocimetry (PLIF-PIV) imagery and comparisons with variations in neat diesel spray. In addition, the flow field of gasoline spray that formed vortexes and vorticity was characterized. The results show that the injection pressure and back pressure had the same effects on the gasoline spray structure, in terms of the penetration tip and cone angle, as on the diesel spray. However, the injection pressure had a greater effect on the diesel spray than the gasoline at low ambient pressure due to the occurrence of cavitation. Moreover, the images show the remarkable turbulent structure of gasoline spray and indicate air entrainment at the spray tip region.
1. Introduction
The low-temperature combustion (LTC) [1,2] concept has been widely investigated to reduce the NOX/PM trade-off emissions in conventional compression ignition (CI) engines. Many approaches have been taken to apply the LTC concept in all operating regimes. For instance, homogeneous charge compression ignition (HCCI) combustion has been in use for the past four decades [3] using ethanol as a fuel [4]. Partially premixed compression ignition (PPCI) uses port fuel and direct injection of gasoline [5], while reactivity-controlled compression ignition (RCCI) is the PPCI engine concept using low- and high-reactivity fuels (dual fuel) [6,7]. Gasoline compression ignition (GCI) [8] combustion has demonstrated its benefit of decreasing the level of NOX and soot, much like a spark ignition (SI) engine and with the same high thermal efficiency as CI combustion. High volatility and long ignition delay period of gasoline facilitates superior mixture homogeneity, which eventually allows the GCI engine to operate at lower fuel injection pressure [9]. Researchers are still attempting to overcome the limitation of narrower LTC operating ranges compared with those of conventional SI and CI combustion.
Based on a diesel engine configuration, a GCI engine applies a common rail injection system to directly inject gasoline at high pressure through the nozzle into the cylinder [10]. Unlike in HCCI, the start of GCI combustion/combustion phasing can be controlled by the injection timing, hint the end of injection [11]. Due to the low cetane number of gasoline, a longer ignition delay allows more time for the fuel to mix with the air as the premixed charge. This can lower NOX and soot emissions [12].
The lubricity of gasoline is relatively poor, therefore one challenge in using gasoline in a high-pressure injection operation is the failure of and damage to the high-pressure common rail system, including the high-pressure pump and nozzle. Due to its superior lubricity, biodiesel can be added to gasoline fuel as a lubricity enhancer [13]. In addition, the viscosity and surface tension which affect the spray characteristics of gasoline are different from diesel, while biodiesel has those properties in the opposite way. Adding biodiesel to gasoline can improve all of these properties. Moreover, biodiesel can reduce the particulate emissions or smoke when used in a CI engine as either a blend [14] or neat biodiesel [15].
Studies on Gasoline direct injection via the common rail system have been carried out in recent years based on either Diesel engines or Constant volume combustion chamber (CVCC) [16,17]. Since GCI involves the direct injection of fuel into the chamber, the combustion and emissions are strongly dependent on the spray characteristics. Not only does the nozzle geometry affect the spray behaviors, but the fuel properties also alter the spray shape. Previous researches have shown that there is no difference between the vapor penetration tip of gasoline and biodiesel, but for the liquid phase, the spray tip of gasoline is shorter and the cone angle is wider than that of diesel [18]. With the low resistance of gasoline, the injector needle opens earlier and closes faster compared with diesel injection. In addition, the injection rate of gasoline is lower than that of diesel when the injector is fully opened [19].
The spray characteristics of biodiesel have been investigated by many researchers. Densantes et al. [20] showed that biodiesel has a longer penetration length and a narrower spray angle than diesel. In addition, the study on the spray characteristics of gasoline and biodiesel under the non-evaporation condition presented by Shubhra [21] also showed the results of different spray shapes when increasing the biodiesel content. Moreover, the trend of injection penetration length and spray cone angle are inversely proportional to the increase in gasoline content in fuel. Meanwhile the results taken from Allocca et al. [22] showed that there is no significant difference in terms of spray patterns between diesel and biodiesel. The nozzle geometry strongly affects the spray behaviors. Biodiesel has a more compact spray (greater length and smaller angle) with the cylindrical-type nozzle, while the diesel spray has a longer tip with similar angles when using the conical injector [22]. Moreover, the injection timing is advanced and the injection duration is shortened when injecting biodiesel, compared with diesel.
Even though there has been a great many researches on spray characteristics of neat gasoline and biodiesel injection via high-pressure common rail systems, little data was found taking into account the gasoline-biodiesel blending, especially, the application of which to the CI engine conditions. Spray structure and its flow field play a key role in the fuel-air mixing process, laying the foundation for further investigation and enhancement of the combustion phase. Utilizing the characteristics of biodiesel, noticeably the lubrication capability as well as low PM generation, this research is first to investigate the vortex and vorticity distribution generated from the gasoline-biodiesel blend implementation which affects the spray structure and flow. The influences of injection and back pressure on the spray characteristics, namely penetration length, angle and speed were clarified. At the same time, comparison was made about magnitude of the spray variation with that of the diesel spray.
2. Materials and Methods
Two techniques were employed to investigate the gasoline spray characteristics. First the spray images were shot with Schlieren photography techniques [23] and then the spray images were taken via Planar laser-induced fluorescence coupled with particle-image velocimetry (the PLIF-PIV technique) [24]. Gasoline spray characteristics were assessed in a constant-volume combustion chamber (CVCC) with various injection and ambient pressures. The injection pressure (IP) was controlled through a common rail diesel injector system. The spray images were recorded by a high-speed camera, and image processing using MATLAB was employed to analyze the spray length and cone angle [25,26].
2.1. Test Fuels
Two different fuels, in particular, neat gasoline ad pure diesel obtained from a retail station were used to characterized the fundamentality of the spray in the experiment. Due to the fact that neat gasoline is of low lubricity, implementation of it to a high-pressure injection system might cause significant harms to the common rail diesel injection system, especially wear resistance. On the contrary, biodiesel is characterized by neat fatty compound, allowing for greater lubricity. To clarify, biodiesel should be considered a competitive lubricity enhancer compared to other conventional lubricity additives [27,28]. Indeed, a low percentage addition of biodiesel (1–5%) to the mixed fuel already extraordinarily compensated for the neat gasoline. Atadashi et al. [29] found that using less than 1% of biodiesel could increase viscosity up to 30%. In this study, gasoline was mixed with biodiesel (palm methyl ester) by 5% volume with an aim to increasing the viscosity property. Additionally, the so-called D100 (stands for pure diesel) and GB05 (stands for gasoline-biodiesel with mixing percentage by volume at 5% accordingly) were utilized. Physical properties of the GB05 and D100 adopted by the Korean standard had very different properties, as exhibited in Table 1 below.

Table 1.
Physical properties of the test fuels.
Given its lower value of wear scar in millimeters, lubricity of the GB05 was quite better than GB00, yet slightly lower than D100 when biodiesel was added to regular gasoline. Although the density of GB05 increased with the concentration of biodiesel, value of which was still found to be lower than diesel’s, given lower biodiesel ratio. Even though the kinematic viscosity of GB05 cannot be presented as the same standard as D100, its value was close to GB00 and lower than D100. The cloud point and pour point of B100 were higher than those of GB00 and diesel, and the cloud point of the blends increased with the increasing biodiesel concentration. However, the pour point was not altered with the biodiesel concentrations; it remained constant at −57 °C for all blends.
In this study, surface tension could not be directly evaluated due to the lack of testing equipment, but it could be calculated based on the Macleod-Sugden correlation. Therefore, the mixture surface tension of GB05 was estimated by Equation (1) [34]:
where γm is the surface tension of the mixture.
2.2. Experimental Setup
Schematic diagram in accordance with Schlieren photography technique are illustrated in Figure 1. Tracer-based PLIF-PIV technique is also applied, given the procedure in Figure 2. Moreover, the CVCC with a volume of approximately 1295 mL, consisting of six changeable ports (quartz windows, injector, gas in/out port, etc.) were used for data collection. The common rail injection system comprises a common rail, oil filter, fuel tank and low- and high-pressure pump. This common rail system can provide a maximum pressure of 1350 bar. The injection pressures were handled by a common rail pressure control valve (PCV) driver (ZB-1100). The single-hole injector utilized to develop the spray shape was a 33800_27400 common rail diesel injector (Bosch and Hyundai, Ulsan, Korea) with an orifice diameter of 0.3 mm. A ZB-5100 common rail solenoid injector peak and hold driver and a ZB-8035 multi-stage injection engine controller (Zenobalti, Daejeon, Korea) were employed to drive the single-hole injector and control the injection timings. The engine controller generated a trigger signal sent simultaneously to a high-speed camera responsible for image recording as well as the peak-and-hold driver, capable of fuel injection’s pressure management.
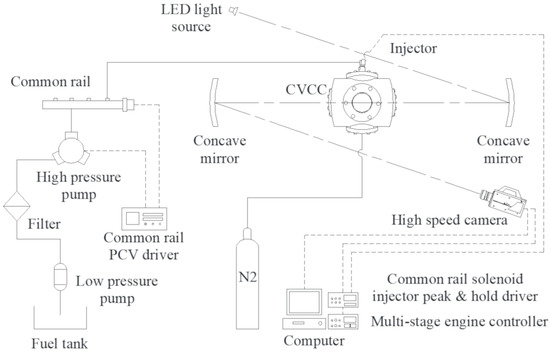
Figure 1.
Schematic diagram of the spray image recording system using Schlieren photography technique.
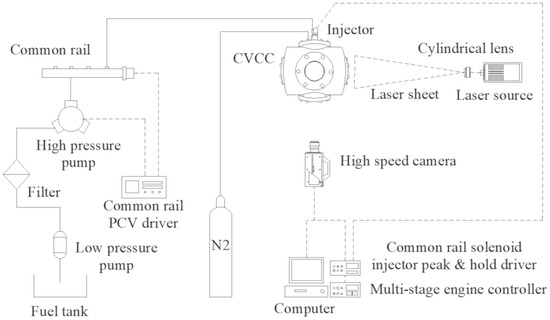
Figure 2.
Schematic diagram of the spray image recording system using Planar laser-induced fluorescence coupled with particle-image velocimetry (PLIF-PIV) technique.
Schlieren photography technique can briefly be described as follow: Principal light source comes from LED, via two concave mirrors (SM300), traveling to the high speed camera. The FASTCAM SA3 high-speed camera (Photron, CA, USA) was used to record the spray pattern illuminated by the LED light source. The Schlieren images having a resolution of 256 × 512 pixels were recorded at a speed of 10,000 frames/second and shutter speed of 1/200,000 s. Thus, the time interval for recording the two images was 100 µs. One thousand spray images were transferred and saved in a personal computer via the Photron FASTCAM Viewer (PFV) software. Meanwhile, tracer-based PLIF-PIV technique makes use of a diode-pumped solid-state (DPSS) laser with a wavelength of 532 ± 1 nm, continuously emitting light illumination; a cylindrical lens (FL = −25) serves as the laser sheet with thickness measurement at approximately 2 mm; A FASTCAM SA1.1 high-speed/resolution camera (Photron, CA, USA) was also deployed. The PLIF-PIV images were shot at 8000 frames/second and speed shutter 1/104,000 s with a resolution of 750 × 1024 pixels. The time interval between two images was 125 µs. All PLIF-PIV images were also managed by PFV software. Examples of images taken by Schlieren photography and PLIF-PIV techniques are shown in Figure 3.
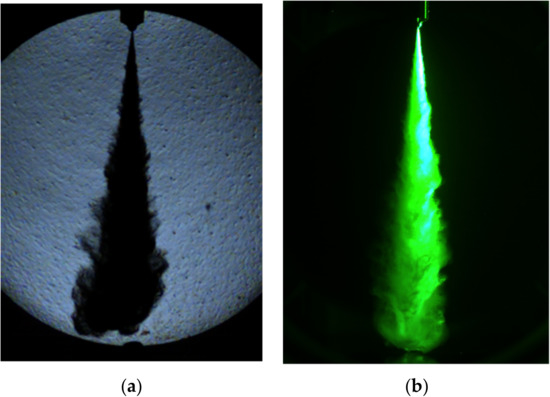
Figure 3.
(a) An image by Schlieren photography technique, and (b) an image by PLIF-PIV technique.
2.3. Experimental Procedure
2.3.1. Fuel Injection Conditions
This study investigated the spray characteristics of blended gasoline and neat diesel, including spray penetration, cone angle, area, average velocity and instantaneous velocity. To observe their behavior by using Schlieren photography, GB05 and D100 were injected into the CVCC at the simulated speed of 2000 rpm. The injection duration for all the experimental conditions was kept constant at 1000 µs. In terms of injector system, chosen experimental pressures for the injector were 500, 750 and 1000 bar, respectively. When the test fuel was injected into the CVCC, the high-speed camera was triggered by a signal from the engine controller to simultaneously record the images. The back pressure was set at 10 bar and 50 bar. Each test condition was repeated three times. In order to evaluate the spray distribution and vorticity with PLIF-PIV, only GB05 was created by adding 1% of silicone oil (KF-96) as a particle tracer seed. The testing conditions for each fuel are shown in Table 2.
Table 2.
Summary of fuel injection conditions.
2.3.2. Post-Processing Images
The image processing technique and PIV lab tool (a time-resolved particle-image velocimetry software) [35] based on the commercial MATLAB software were utilized to analyze the spray characteristics and the vector and vorticity distribution.
As is shown in Figure 4, spray penetration length (L) is defined as the distance from the injector’s tip to the very end of the fuel spray, and is calculated using Equation (2), followed by Equation (3) which allows for calculation of the spray angle (L), defined as the angle created by the two lines covering the spray from the injector’s tip to the middle length of the fuel spray (L/2) [36].
where L denotes the spray penetration length; Ainjector tip is the address of the pixel at the end of injector tip; Aspray end is the address of the pixel at the end of the spray and Psize is the dimension of the pixel (mm/pixel).
where L denotes the spray cone angle, V1 and V2 are the vectors along the boundaries of the spray image and L1 and L2 are the lengths of V1 and V2, respectively.
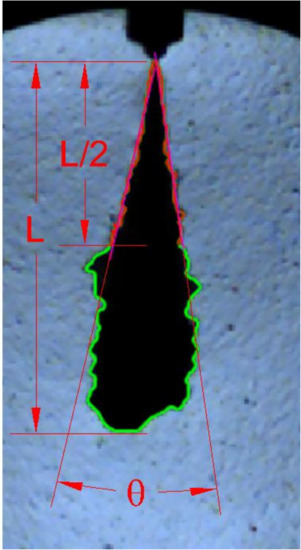
Figure 4.
Definition of the spray penetration length L and the spray cone angle (L) at L/2.
To measure the flow velocity, the discrete cross-correlation function determining the particle displacement is given by Equation (4) [37]. Two PLIF-PIV images exploding in the very short time interval were analyzed with the FFT window deformation algorithm (direct Fourier transform correlation with multiple passes and deforming windows). The initial pass, which was a relatively large interrogation area (size 32 × 32 pixels), was used to calculate the particle displacement of the data-target range. The second interrogation area and the others were reduced by 50%, respectively. Then the velocity of a vector could be calculated as shown in Equation (5) [38]:
where A1 and A2 are representative interrogation areas between the pair images.
where dx and dy are the displacements calculated from the coordinates of the location of the cross-correlation parameter.
3. Results
3.1. Spray Characteristics
Figure 5 presents the effects of different injection pressures (between rows) and the ambient pressures (between columns) on the spray development patterns of GB05 from the raw images. On the left side of the figure, the influence of injection pressure at the ambient pressure of 10 bar is clearly observed, like those of the right side presented for the 50-bar ambient pressure condition. Comparing the two columns clearly reveals the effect of ambient pressure at all injection pressures. When the injection pressure was increased from 500 to 750 and 1000 bar at an ambient pressure of 10 bar, the spray tip impacted on the chamber. Hence, there was a high chance of wall/piston impingement. However, when the ambient pressure (back pressure) was increased to 50 bar, the spray could not travel to strike the chamber.
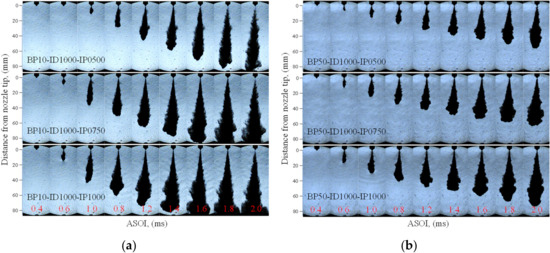
Figure 5.
Spray development patterns of gasoline-biodiesel (GB)05 with back pressure at (a) 10 bar, and (b) 50 bar, undergoing an injection duration of 1000 µs at three states of the injection pressure of 500, 750 and 1000 bar.
The following section discusses in detail the macrostructure of the spray, quantified from Figure 5. Furthermore, the characteristics of diesel spray have been included for reference. Unfortunately, the results of GB05 and the diesel were derived from different techniques, making it impossible to compare the two sprays. However, the effect of injection pressure and ambient pressure on the variation of the GB05 and diesel sprays can still be assessed.
Figure 6 illustrates the oscillation of the spray penetration lengths in accordance with varied injection pressure and back pressure. From the two diagrams (GB05 specification to the left and D100 specification to the right and the very first of both sides indicate back pressure of 10 bar, followed under by the back pressure parameter of 50 bar), ambient pressure was kept constant at 10 bar. When the injection pressure was increased, the momentum flux increased and the spray lengths increased for both fuels. At the lower back pressure of 10 bar, the spray length reached its maximum value at the injection pressures of 750 and 1000 bar for both test fuels due to the chamber impingement, as was seen in Figure 5. However, when the back pressure is adjusted to 50 bar, the spray length continued to increase without striking on the chamber. This is due to the fact that increased drag force of the surrounding air resisted the momentum flux of the liquid spray, thus lowering the spray penetration. Therefore, the spray lengths at the higher back pressure were shorter than those at lower ambient pressure conditions at the same injection pressure.
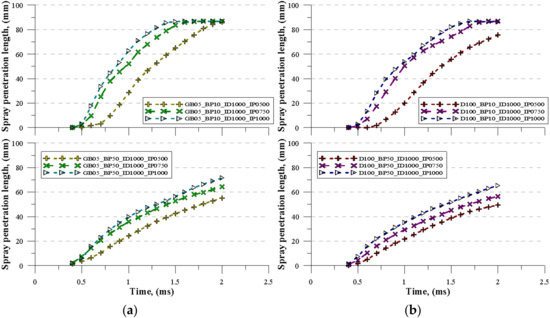
Figure 6.
Spray penetrations of (a) GB05, and (b) D100 with injection duration 1000 µs at back pressures of 10 and 50 bar and injection pressures of 500, 750 and 1000 bar.
The effects of injection pressure and the ambient pressure on the cone angles of GB05 and D100 with injection duration of 1000 µs are presented in Figure 7. Due to the instability of the spray during the beginning of the injection, the cone angles at this time could not be analyzed and compared. For instance, at the beginning of injection, the spray cone angle of D100 at around 0.75 ms at a back pressure of 10 bar was slightly narrow. This might be explained as that the fuel spray was affected by the operating transition zone (opening and closing needle) in which the dynamic of the injector needle was heavily influenced by the fluid viscosity. Due to the higher viscosity of diesel than that of gasoline, the needle was resisted and opened later. When the needle was lifting, the spray became unstable, making analysis difficult. This could be the cause of the spray cone angle readily increasing or decreasing [39].
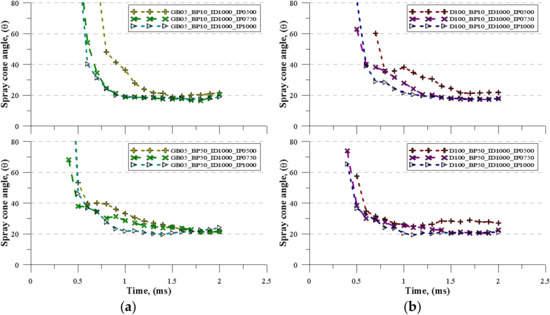
Figure 7.
Spray cone angles of (a) GB05, and (b) D100 with an injection duration 1000 µs at back pressures of 10 and 50 bar and injection pressures of 500, 750 and 1000 bar.
GB05 showed the same behavior as the D100, in which the cone angle decreased when the injection pressure was increased. The cone angle correlated well with the spray penetration length, as suggested earlier by Desanteset al. [20] and calculated by the following equation:
where K is a constant depending on the spray internal distribution, is the gas density, t is time, is the momentum flux and L is the spray angle. With a narrower cone angle, the spray can travel a longer distance. On the other hand, a short penetration tip couples with a broader spray cone angle. This correlation can be clearly proven in the case of the back pressure of 10 bar.
Following the large differences in the liquid spray lengths, the cone angle also differed greatly between the injection pressures of 750 and 500 bar, especially in the early stage of the injection period. This could be attributed to the injection rate, in which higher injection pressure accelerates the steady-state injection rate shape. Taking two test fuels into comparison, the injection pressure seemed to have a more significant impact on the cone angle of D100; increased injection pressure resulted in the reduction of cone angle. Different pattern was found on GB05, since the cone angles at 750 and 1000 bar injection pressures yielded quite the same a result. This was due to the development of cavitation. Under low ambient pressure, cavitation only occurs when there is a rise in the injection pressure, particularly for a non-viscous fuel, namely gasoline. Such cavitation led to enlarged cone angle [40]. All in all, as injection pressure narrowed down the cone angle, a reversed pattern was found within the existence of cavitation. Nonetheless, when the ambient pressure increases, very little cavitation is induced because of the lower pressure difference. Overall, GB05 and Diesel fuel follow the same pattern in in consideration of injection pressure effects.
As seen in Figure 8, the injection and back pressure affected the spray area at the same penetration length. When the injection pressure increased, same goes the spray area due to the increased spray length. In addition, the tip of the spray seemed to broaden, as in Figure 5, because the fuel with the high momentum flux was easily dispersed. Fuel vaporization could easily occur for the spray having the larger spray area. On the other hand, with increased ambient pressure, the decreased penetration length was the major cause of the decreased spray area. This means that fuel evaporation will be inhibited.
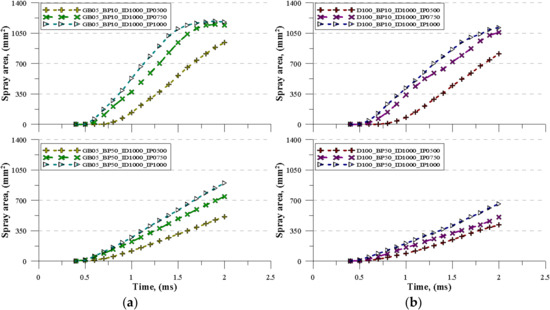
Figure 8.
Spray area of (a) GB05, and (b) D100 with an injection duration 1000 µs at back pressures of 10 and 50 bar and injection pressures of 500, 750 and 1000 bar.
Figure 9 shows the average velocity of the spray under back pressures of 10 and 50 bar. The average velocity of blended fuel trends to increase when injection pressure increases. The spray injected with an injection pressure of 1000 bar under a back pressure of 10 bar shows the highest average velocity, due to its low ambient density and low momentum flux. On the other hand, the lowest average velocity is observed under the back pressure of 50 bar and injection pressure of 500 bar. This is mainly because of high ambient density and high momentum flux. The average velocity rapidly increases in the range of 0.3–1.0 ms during the starting phase of the injection (speedy zone), paving the way for the average speed climax. After the speedy zone, the average velocity slightly decreases until the end of the injection duration. The behavior of the average velocities of GB and neat diesel fuel under back pressures of 10 and 50 bar are also of great similarities.
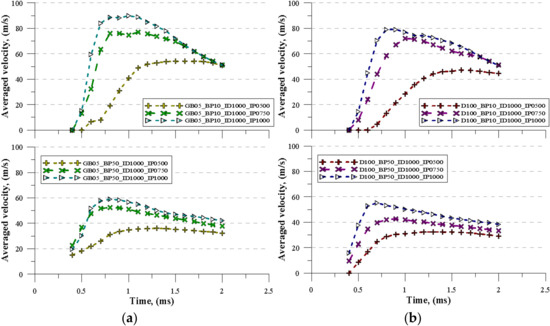
Figure 9.
Average velocity of spray penetration of (a) GB05, and (b) D100 with an injection duration 1000 µs at back pressures of 10 and 50 bar and injection pressures of 500, 750 and 1000 bar.
Figure 10 shows the instantaneous speed under back pressures of 10 and 50 bar. The instantaneous speed of GB05 and neat diesel fuel tends to increase when injection pressure increases, and the highest instantaneous speed is observed at the lowest back pressure of 10 bar and the injection pressure at 1000 bar. On the other hand, at the back pressure of 50 bar and the lowest injection pressure of 500 bar, the free spray has the slowest instantaneous speed. At 0.3 ms of the start of injection, the instantaneous speeds immediately increase and continuously boost. This results in the maximum instantaneous speed at 0.7–1.0 ms in the same speedy zone in the average speed. Then the instantaneous speed drastically decreases until the end of the injection duration. The instantaneous speeds of GB and neat diesel fuel are similar at the same injection pressure and back pressure.
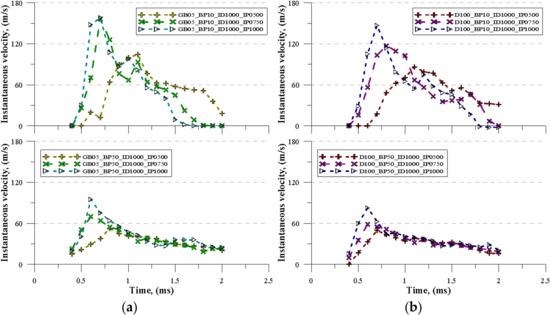
Figure 10.
Instantaneous velocity of spray penetration of (a) GB05, and (b) D100 with an injection duration 1000 µs at back pressures of 10 and 50 bar and injection pressures of 500, 750 and 1000 bar.
3.2. GB05 Spray Structure
The PLIF-PIV technique was adopted to investigate the internal spray structure of the GB05 fuel. The PLIF-PIV images of GB05, illuminated by the DPSS laser sheet, were recorded with a high-speed camera. Then the light intensities of the PLIF-PIV images were converted by MATLAB software into pseudocolor images with 256 levels of colors, in which 255 was taken to be red and 0 was taken to be black. Pixels having the 255-level color represented the locations of high spray concentration, and no spray droplets were detected at the pixel having the 0-level color. In Figure 11, for all test conditions, the dense spray (which is the presumed liquid core) is illustrated in the red color, positioned at the center of the spray and slightly to the right side where the laser source was located and emitted. At the low ambient pressure of 10 bar in Figure 11a, the liquid jets were observed after the needle started to open. As the needle was continuously lifted, the liquid lengths increased, which corresponds to the above results of the spray penetration tip. Finally, the dense spray/liquid core slightly diminished and disappeared when the time elapsed. At the lower injection pressure of 500 bar, the liquid jet disappeared sooner than with the high injection pressure.
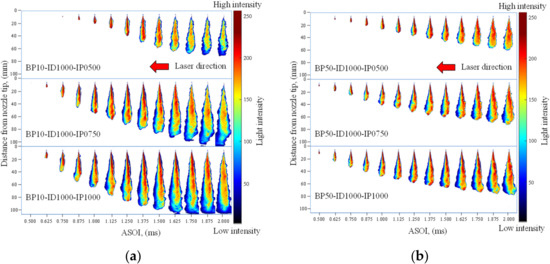
Figure 11.
PLIF-PIV images with pseudocolors of free sprays of GB05 under back pressures of (a) 10 bar, and (b) 50 bar, with an injection duration of 1000 µs and injection pressures of 500, 750 and 1000 bar.
As with low ambient pressure, the liquid jets at the high back pressure of 50 bar in Figure 11b were detected after the beginning of the spray development process. Then the liquid length increased with the increased duration. However, unlike the low ambient pressure condition, the liquid jets maintained a constant length after the spray reached the quasi-steady state, and still remained in the internal spray until the last image was captured for all injection pressures. The back pressure significantly affected the spray structure by compressing it in the confined area, making it difficult for the fuel to disperse throughout the whole spray and mix with air. As a result, the internal spray structure consisted of the most dense spray.
To clearly understand the effects of injection pressure and back pressure on the internal spray structure, the images taken after the needle fully closed for all test conditions in Figure 11 were selected and transformed into 25 contour lines with 256 levels of colors to define the fuel mass concentration boundaries, as presented in Figure 12. The black contour line corresponds to the lowest light intensity, indicating the low spray density area. The red contour line correlates to the highest light intensity, representing the high spray concentration area. The results show that at the ambient pressure of 10 bar, the internal spray structure is roughly asymmetric with the liquid core located at the center. The fuel mass concentration gradually decreases along the radial direction and downstream of the spray.
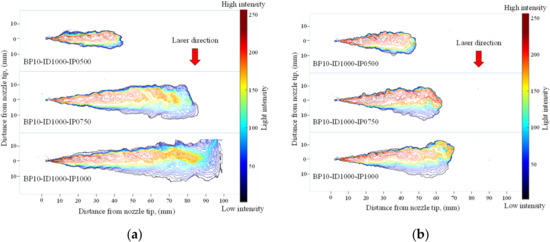
Figure 12.
The distribution of GB05 spray density under back pressures of (a) 10 bar, and (b) 50 bar with an injection duration of 1000 µs and injection pressures of 500, 750 and 1000 bar.
With regard to ambient pressure at 50 bar, the dense spray dominated almost the whole spray area, slightly more so on the right side, particularly at the low injection pressure. More dense spray located near the laser source resulted in the attenuated light further away. At the injection pressures of 750 and 1000 bar, the spray periphery shows a small wavy motion. A possible explanation is that when the fuel is injected into the surrounding air, some earlier fuel sprays are decelerated and move upward as the vortex motion [41]. The fuel droplets in this vortex region form into a stagnant point. When the later-injected fuel reaches this area, it develops these movements to avoid the stagnant point, or it intercepts the earlier-injected fuel. Therefore, the later fuel droplets form a buckled shape.
3.3. The Flow Fields of GB05 Spray
Figure 13 illustrates the spray internal flow of GB05, which is characterized by the vector (velocity) and vorticity distribution under 500 bar injection pressure and 10 bar back pressure. The whole shape of the PLIF-PIV spray image at 2.5 ms after start of injection (ASOI) is shown in Figure 13a, while Figure 13b,c show the vector and vorticity located in the downstream part of the spray in the range of 35 to 75 mm from the injector tip, which is magnified and analyzed. In the figure’s red circles, the spray droplets were pushed aside from the streamline and moved upward, forming the large-scale vortex motion at the side periphery like the diesel spray [42]. These vortex motion areas correspond to the recirculation zone of the surrounding gas flow, hint spray-induced gas flow field [43]. The droplets of the downstream spray at the side periphery, which were injected earlier, lose their momentum and are forced radially outward from the core by the successive higher-momentum droplets. At the same time, the ambient air resists the movement of the spray droplets and deviates the spray movement to the upward direction.
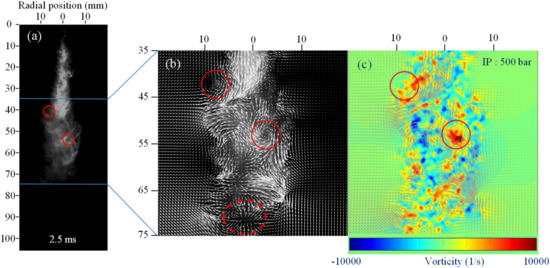
Figure 13.
(a) the PLIF-PIV spray image (b) the vector and (c) vorticity distribution of GB05 spray under a back pressure of 10 bar with an injection duration of 1000 µs and an injection pressure of 500 bar.
The locations at which the large-scale vortexes occurred (the red circles in Figure 13b) are the areas of highest vorticity (Figure 13c). The rotating movement of the vortexes, occurring at the periphery of the spray, induced entrainment of the surrounding air, thus making the fuel–air mix in this area leaner, as shown by the lower light intensity in the red circles in (Figure 13a). Meanwhile, these vortexes caused stagnation of the nearby spray droplets, making the mixture richer, as shown by the higher light intensity in the PLIF-PIV spray image (Figure 13a). As a result, the heterogeneous air–fuel mixture dispersed throughout the spray area and created the same branch-like spray structure as defined by Azetsu et al. [44].
Interestingly, the velocity vector at the end of the spray tip region of GB05 (encircled by the dashed red line in Figure 13b) shows the reverse direction, i.e., is backward to the spray injector. In past research [42,45] this behavior could not be seen clearly in the diesel spray. With the lower surface tension and viscosity of gasoline as compared with those of diesel, the fuel droplets of GB05 are readily broken. In addition, the fuel atomization and break-up process are accelerated due to the higher air entrainment related to the low density of gasoline. It is possible that the air could entrain into the spray in this tip region. With the low momentum of the smaller droplets hints low inertia mass, the surrounding gas could against the traveling of the GB05 higher than the diesel spray. As a result, the GB05 droplets move back in the opposite direction of the streamline, not radially as seen in the figure. Meanwhile, the ambient gas resistance merely diverts the diesel spray from the axial direction, as bifurcate spray, at the capturing section of the surrounding gas in the spray tip region [45].
The flow field of GB05 in a DI engine cannot be compared with the gasoline spray in a gasoline direct injection (GDI) engine. Due to different features of the injector and injection pressure, the characteristic reverse flow of GB05 is not be found in the gasoline spray in a GDI engine. The counter-rotating vortex motion in the periphery of the spray couples with the straightforward high velocity at the leading edge and the central part of the spray; these are the key features of gasoline spray injected via a GDI system [46].
Figure 14 shows the axial velocity of GB05 spray in asymmetrical profile with the spray core, calculated in the range of 5 to 75 mm in 5 mm increments from the injector tip. From 5 mm to 40 mm from the injector tip, the axial velocity has only positive values (the dashed red line is the reference; below that line are positive values, and vice versa). This means that all the spray droplets move down to the bottom. Around 45 mm, the axial velocity becomes slightly negative at the periphery of the spray, while at 50 and 55 mm it becomes very negative. The negative velocity relates to the direction of the vector which turns backward to the injector tip, thus corresponding with the location of the vortex motion. At the end of the spray tip (around 70–75 mm), the axial velocity has a negative value around the spray axis, which is the same location of the reverse vector shown in Figure 13b.
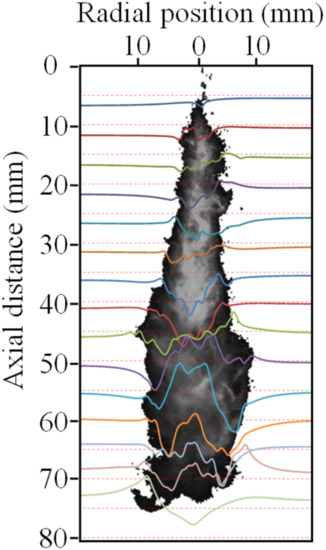
Figure 14.
The asymmetrical profile of GB05 spray, with the spray core at 2.5 ms (back pressure of 10 bar and injection pressure of 500 bar).
The effects of injection pressure on the spray flow at the back pressures of 10 and 50 bar are shown in Figure 15 and Figure 16, respectively. As can be seen from the time-resolved spatial distribution of the vector and vorticity, the spray at 2.5 ms ASOI shows more large- and small-scale vortexes than at 2.0 ms ASOI, which had shown a larger vortex distribution than at 1.5 ms. At the earlier injection timing, the surrounding/ambient gas was not perturbed by the injected spray, which means there were fewer fuel-air interfaces and interactions.
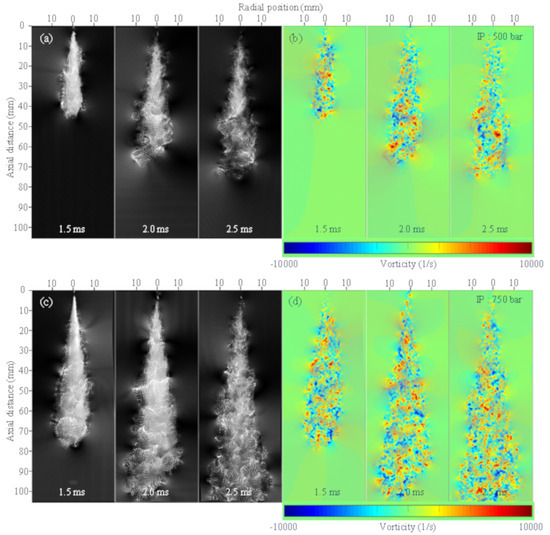
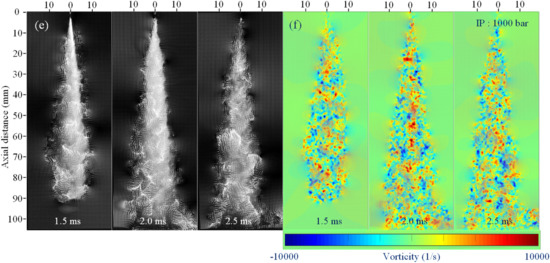
Figure 15.
The vector (a), (c) and (e) and vorticity distribution (b), (d) and (f) of GB05 spray under the back pressure of 10 bar with the injection duration of 1000 µs, and injection pressures of 500, 750 and 1000 bar.
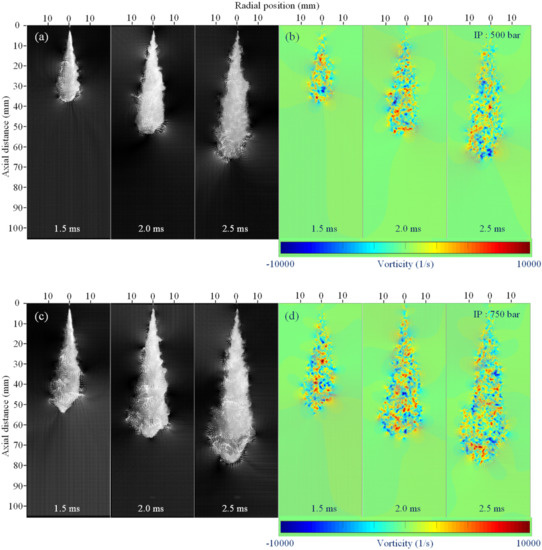
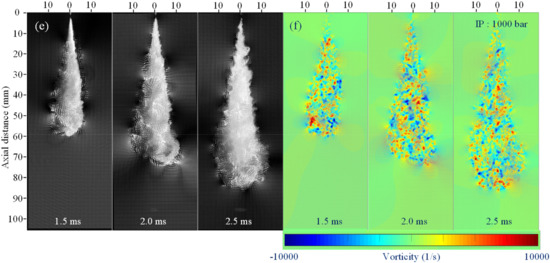
Figure 16.
The vector (a), (c) and (e) and vorticity distribution (b), (d) and (f) of GB05 spray under the back pressure of 50 bar with the injection duration of 1000 µs, and injection pressures of 500, 750 and 1000 bar.
Under constant ambient pressure value condition, the number as well as the intensity of large-scale vortexes increase when injection pressure is raised. Hint, higher vorticity occurred. At the higher injection pressure, the spray could travel with a longer penetration tip and greater speed due to the higher momentum flux. This led to more drag force to resist the moving spray and turned the axial velocity flow to the radial direction, thus forming the vortex and vorticity. In addition, small-scale vortex motions were engendered throughout the whole spray. The spray was developed with high turbulence motions and fluctuations. Consequently, the mixture formation process was enhanced.
In Figure 17, when the injection pressure increases, the axial velocity profile calculated at the time of 2.0 ms ASOI presents its first negative value when the spray distance is shorter than those of the low injection pressure. At the injection pressure of 500 bar, the negative velocity is first seen at 35 mm from the injector tip, while the injection pressure of 750 bar indicates negative axial velocity at 25 mm. Particularly, the injection pressure of 1000 bar shows the radial flow field of the spray at 5 mm, which is the shortest distance plane from the tip that was analyzed. The droplet size of the spray decreases as the injection pressure increases, due to the high shear rate. Therefore, air entrainment could exist earlier in the entrainment section and might attempt to bend the spray to the radial direction, thus creating the vortex motion. At longer spray distances, the negative axial velocity distributed along the radial direction corresponds with the higher number of the vortexes created throughout the spray.
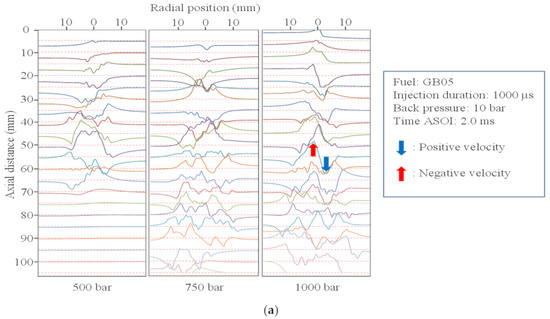
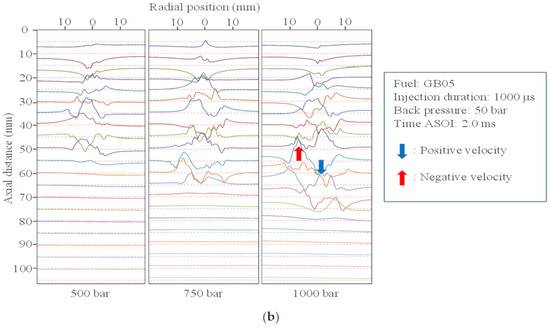
Figure 17.
The axial velocity distribution profile of GB05 with different injection pressures at back pressures of (a) 10, and (b) 50 bar.
In Figure 15 and Figure 16, when the injection pressure was held constant and the back pressure was increased, the number and the strength of vortexes and vorticity decreased. The spray periphery is relatively smooth and stable. At the higher back pressure, however, the compact spray was confined by the drag force. The spray could not travel easily and the spray distribution was thus suppressed. This means that the air-fuel mixing process was negligible. In contrast, Figure 17a,b compare different injection pressures as well as different back pressures. The axial velocity underwent less magnitude and distribution along the radial axis. Additionally, if back pressure rose over 50 bar, the first negative axial velocity occurred later than at 10 bar with injection pressure at 1000 bar. The dense ambient air compressed the spray to travel along the axis. There was less air entrainment to resist the droplets moving with high momentum, so the spray droplets hardly diverged from the axial direction.
4. Conclusions
This paper is the first to elucidate the spray flow field of gasoline blended with biodiesel 5%, using Schlieren photography and PLIF-PIV imagery. The behavior and structure of GB05 and neat diesel at various injection pressures and back pressures are analyzed, leading to these important conclusions:
- Increased injection pressure causes increased spray length because the increased momentum flux does not depend directly on the test fuel (fuel properties). Therefore, the effect of injection pressure on the spray penetration length of GB05 and neat diesel fuel are similar. At higher injection pressure, the spray can travel farther in the chamber.
- Like neat diesel, the spray cone angle of GB05 is enlarged with increased ambient pressure. However, the cone angle of GB05 increases less than that of neat diesel because cavitation phenomena occur in the GB05 flow, which inhibits the effect of the ambient pressure.
- The average speed and the instantaneous speed of GB05 and neat diesel are similar. At SOI 0.3–0.7 ms, the free spray speed immediately increases and is then continuously boosted. After that, it decreases rapidly until the end of the injection timing.
- The injection pressure and back pressure have the greatest effects on the spray structure and distribution. At high ambient pressure, the shape and size of the free spray are affected. The free spray clearly contracts and the liquid jet still remains after the needle closes.
- The spray density of GB05 is continuously distributed along the free spray at both the low and high back pressures. Moreover, wavy motions are found at the medium and high injection pressures, which causes a buckled shape.
- Although the spray flow field of GB05 appears to be similar to the diesel spray at the entrainment and recirculation zone, the air entrainment has an effect on the GB05 at the spray tip region but there is no clear evidence of an effect on the diesel (from past research). This suggests that using gasoline injected with a common rail injection system could improve the air-fuel mixing process.
- At high injection pressure and low back pressure, vortexes and vorticity are formed throughout the spray area, in large numbers and magnitude. This indicates a high-turbulence spray structure and heterogeneous fuel-air mixing distribution. In addition, the spray tip penetration of GB05 is lower than that of the diesel spray due to its low viscosity, density and surface tension (from the literature). Therefore, when using gasoline in a high-pressure injection system, the injection pressure can be increased with less spray impingement on the piston, and the fuel-air mixing process is better than when using diesel, facilitating the auto-ignition of gasoline.
Author Contributions
Conceptualization, S.T. and O.L.; Experiment and writing—original draft preparation, S.T.; review and editing, supervision, project administration, funding acquisition, O.L. All authors have read and agreed to the published version of the manuscript.
Funding
This research was financially supported by the Energy Technology Development Project of the Korea Energy Technology Evaluation and Planning (20182010106370, Demonstration Research Project of Clean Fuel DME Engine for Fine Dust Reduction), Republic of Korea.
Conflicts of Interest
The authors declare no conflict of interest.
Nomenclature
| PLIF | Planar laser-induced fluorescence |
| PIV | Particle-image velocimetry |
| LTC | Low-temperature combustion |
| CI | Compression ignition |
| HCCI | Homogeneous charge compression ignition |
| PPCI | Partially premix compression ignition |
| GCI | Gasoline compression ignition |
| CVCC | Constant volume combustion chamber |
| PCV | Pressure control valve |
| DPSS | Diode-pumped solid-state |
| IP | Injection pressure |
| GB | Gasoline-Biodiesel |
| GDI | Gasoline direct injection |
| SOI | Start of injection |
| ASOI | After start of injection |
| DI | Direct injection |
References
- Sasaki, S.; Ito, T.; Iguchi, S. Smoke-Less rich combustion by low temperature oxidation in diesel engines. In Proceedings of the 9th Aachen Colloquium Automobile and Engine Technology, Beijing, China, 13–15 November 2019; p. 767. [Google Scholar]
- Akihama, K.; Takatori, Y.; Inagaki, K.; Sasaki, S.; Dean, A.M. Mechanism of the Smokeless Rich Diesel Combustion by Reducing Temperature; SAE Techical Paper; SAE International: Warrendale, PA, USA, 2001; pp. 648–662. [Google Scholar] [CrossRef]
- Onishi, S.; Jo, S.H.; Shoda, K.; Jo, P.D.; Kato, S. Active Thermo-Atmosphere Combustion (ATAC)—A New Combustion Process for Internal Combustion Engines; SAE Techical Paper; SAE International: Warrendale, PA, USA, 1979; pp. 1851–1860. [Google Scholar] [CrossRef]
- Tongroon, M.; Zhao, H. Combustion Characteristics of CAI Combustion with Alcohol Fuels; SAE Techical Paper; SAE International: Warrendale, PA, USA, 2010. [Google Scholar] [CrossRef]
- Sang, W.; Cheng, W.K.; Maria, A. The Nature of Heat Release in Gasoline PPCI Engines; SAE Techical Paper; SAE International: Warrendale, PA, USA, 2014. [Google Scholar] [CrossRef]
- Hepp, C.; Krenn, M.; Wasserbauer, J.; Eichlseder, H. Dual Fuel Compression Ignition Combustion Concept for Gasoline and Diesel; SAE Techical Paper; SAE International: Warrendale, PA, USA, 2014. [Google Scholar] [CrossRef]
- Sun, J.; Bittle, J.A.; Jacobs, T.J. Influencing Parameters of Brake Fuel Conversion Efficiency with Diesel/Gasoline Operation in a Medium-Duty Diesel Engine; SAE Techical Paper; SAE International: Warrendale, PA, USA, 2013. [Google Scholar] [CrossRef]
- Cracknell, R.; Ariztegui Cortijo, J.; Dubois, T.; Engelen, B.; Manuelli, P.; Pellegrini, L.; Rickeard, D.J.; Heuser, B.; Schnorbus, T.; Kolbeck, A.F. Exploring a Gasoline Compression Ignition (GCI) Engine Concept; SAE Techical Paper; SAE International: Warrendale, PA, USA, 2014. [Google Scholar] [CrossRef]
- Singh, A.P.; Sharma, N.; Agarwal, R.; Agarwal, A.K. Advanced Combustion Techniques and Engine Technologies for the Automotive Sector, Energy, Environment, and Sustainability; Springer Nature Singapore Pte Ltd.: Singapore, 2020. [Google Scholar] [CrossRef]
- Thongchai, S.; Lim, O.. Investigation of the combustion characteristics of gasoline compression ignition engine fueled with gasoline-biodiesel blends. J. Mech. Sci. Technol. 2018, 32, 959–967. [Google Scholar] [CrossRef]
- Ra, Y.; Loeper, P.; Andrie, M.; Krieger, R.; Foster, D.E.; Reitz, R.D.; Durrett, R. Gasoline DICI Engine Operation in the LTC Regime Using Triple-Pulse Injection. SAE Int. J. Eng. 2012. [Google Scholar] [CrossRef]
- Sellnau, M.C.; Sinnamon, J.; Hoyer, K.; Kim, J.; Cavotta, M.; Husted, H. Part-Load Operation of Gasoline Direct-Injection Compression Ignition (GDCI) Engine; SAE Techical Paper; SAE International: Warrendale, PA, USA, 2013. [Google Scholar] [CrossRef]
- Wadumesthrige, K.; Ara, M.; Salley, S.O.; Ng, K.Y.S. Investigation of Lubricity Characteristics of Biodiesel in Petroleum and Synthetic Fuel. Energy Fuels 2009, 23, 2229–2234. [Google Scholar] [CrossRef]
- Suresh, M.; Jawahar, C.P.; Richard, A. A review on biodiesel production, combustion, performance, and emission characteristics of non-edible oils in variable compression ratio diesel engine using biodiesel and its blends. Renew. Sustain. Energy Rev. 2018, 92, 38–49. [Google Scholar] [CrossRef]
- Xiao, H.; Yang, X.; Hou, B.; Wang, R.; Xue, Q.; Ju, H. Combustion performance and pollutant emissions analysis of a diesel engine fueled with biodiesel and its blend with 2-methylfuran. Fuel 2019, 237, 1050–1056. [Google Scholar] [CrossRef]
- Zhong, W.; Li, B.; He, Z.; Xuan, T.; Lu, P.; Wang, Q. Experimental study on spray and combustion of gasoline/hydrogenated catalytic biodiesel blends in a constant volume combustion chamber aimed for GCI engines. Fuel 2019, 253, 129–138. [Google Scholar] [CrossRef]
- Pinazzi, P.M.; Hwang, J.; Kim, D.; Foucher, F.; Bae, C. Influence of injector spray angle and gasoline- diesel blending ratio on the low load operation in a gasoline compression ignition (GCI) engine. Fuel 2018, 222, 496–505. [Google Scholar] [CrossRef]
- Kim, K.; Bae, C.; Johansson, B. Spray and Combustion Visualization of Gasoline and Diesel under Different Ambient Conditions in a Constant Volume Chamber; SAE Techical Paper; SAE International: Warrendale, PA, USA, 2013. [Google Scholar] [CrossRef]
- Payri, R.; Garcia, A.; Domenech, V.; Durrett, R.; Plazas Torres, A. Hydraulic Behavior and Spray Characteristics of a Common Rail Diesel Injection System Using Gasoline Fuel; SAE Techical Paper; SAE International: Warrendale, PA, USA, 2012. [Google Scholar] [CrossRef]
- Desantes, J.M.; Payri, R.; Salvador, F.J.; Manin, J. Influence on Diesel Injection Characteristics and Behavior Using Biodiesel Fuels; SAE Techical Paper; SAE International: Warrendale, PA, USA, 2009. [Google Scholar] [CrossRef]
- Das, S.K.; Kim, K.; Lim, O. Experimental study on non-vaporizing spray characteristics of biodiesel blended gasoline fuel in a constant volume chamber. Fuel Process. Technol. 2018, 178, 322–335. [Google Scholar] [CrossRef]
- Allocca, L.; Mancaruso, E.; Montanaro, A.; Vaglieco, B.M.; Vassallo, A. Renewable Biodiesel/Reference Diesel Fuel Mixtures Distribution in Non-Evaporating and Evaporating Conditions for Diesel Engines; SAE Techical Paper; SAE International: Warrendale, PA, USA, 2009. [Google Scholar] [CrossRef]
- Postrioti, L.; Grimaldi, C.N.; Ceccobello, M.; Gioia, R.D. Diesel Common Rail Injection System Behavior with Different Fuels; SAE Techical Paper; SAE International: Warrendale, PA, USA, 2004. [Google Scholar] [CrossRef]
- Settles, G.S. Schlieren and Shadowgraph Techniques, 1st ed.; Springer Science & Business Media: Berlin/Heidelberg, Germany, 2001. [Google Scholar]
- Manaka, Y.; Ohta, T.; Saito, M.; Furuhata, T.; Arai, M. Effect of High Ambient Pressure on Behavior and Structure of Diesel Spray. In Proceedings of the 11th International Annual Conference on Liquid Atomization and Spray Systems 2009, Vail, CO, USA, 26–30 July 2009; pp. 1–6. [Google Scholar]
- Gonzalez, R.C.; Woods, R.E.; Eddins, S.L. Digital Image Processing Using MATAB, 2nd ed.; Gatesmark Publishing: Knoxville, TN, USA, 2009. [Google Scholar]
- Mathworks. Image Processing Toolbox TM User’s Guide R2014b; The MathWorks, Inc.: Natick, MA, USA, 2014. [Google Scholar]
- Knothe, G. The Lubricity of Biodiesel; SAE Techical Paper; SAE International: Warrendale, PA, USA, 2005. [Google Scholar] [CrossRef]
- Hu, J.; Du, Z.; Li, C.; Min, E. Study on the lubrication properties of biodiesel as fuel lubricity enhancers. Fuel 2005, 84, 1601–1606. [Google Scholar] [CrossRef]
- Atadashi, I.M.; Aroua, M.K.; Aziz, A.A. High quality biodiesel and its diesel engine application: A review. Renew. Sustain. Energy Rev. 2010, 14, 1999–2008. [Google Scholar] [CrossRef]
- Bao, Y.; Chan, Q.N.; Kook, S.; Hawkes, E. Spray Penetrations of Ethanol Gasoline and Iso-Octane in an Optically Accessible Spark-Ignition Direct-Injection Engine. SAE Int. J. Fuels Lubr. 2014. [Google Scholar] [CrossRef]
- Khonsari, M.M.; Booser, E.R. Applied Tribology: Bearing Design and Lubrication, 2nd ed.; John Wiley & Sons: Hoboken, NJ, USA, 2008. [Google Scholar] [CrossRef]
- Park, S.H.; Youn, I.M.; Lim, Y.; Lee, C.S. Influence of the mixture of gasoline and diesel fuels on droplet atomization, combustion, and exhaust emission characteristics in a compression ignition engine. Fuel Process. Technol. 2013, 106, 392–401. [Google Scholar] [CrossRef]
- Ejim, C.E.; Fleck, B.A.; Amirfazli, A. Analytical study for atomization of biodiesels and their blends in a typical injector: Surface tension and viscosity effects. Fuel 2007, 86, 1534–1544. [Google Scholar] [CrossRef]
- Thielicke, W.; Stamhuis, E.J. PIVlab—Towards User-friendly, Affordable and Accurate Digital Particle Image Velocimetry in MATLAB. J. Open Res. Softw. 2014, 2. [Google Scholar] [CrossRef]
- Du, C.; Andersson, M.; Andersson, S. The Influence of Ethanol Blending in Diesel fuel on the Spray and Spray Combustion Characteristics. SAE Int. J. Fuels Lubr. 2014. [Google Scholar] [CrossRef]
- Huang, H.; Dabiri, D.; Gharib, M. On errors of digital particle image velocimetry. Meas. Sci. Technol. 1997, 8, 1427–1440. [Google Scholar] [CrossRef]
- Lee, K.H.; Lee, C.H.; Lee, C.S. An experimental study on the spray behavior and fuel distribution of GDI injectors using the entropy analysis and PIV method. Fuel 2004, 83, 971–980. [Google Scholar] [CrossRef]
- Payri, R.; Gimeno, J.; Viera, J.P.; Plazas, A.H. Schlieren visualization of transient vapor penetration and spreading angle of a prototype diesel direct-acting piezoelectric injector. In Proceedings of the 12th International Annual Conference on Liquid Atomization and Spray Systems 2012, Heidelberg, Germany, 2–6 September 2012; pp. 1–8. [Google Scholar]
- Payri, F.; Bermúdez, V.; Payri, R.; Salvador, F.J. The influence of cavitation on the internal flow and the spray characteristics in diesel injection nozzles. Fuel 2004, 83, 419–431. [Google Scholar] [CrossRef]
- Jeon, J.; Moon, S. Ambient density effects on initial flow breakup and droplet size distribution of hollow-cone sprays from outwardly-opening GDI injector. Fuel 2018, 211, 572–581. [Google Scholar] [CrossRef]
- Yokogawa, K.; Kobashi, Y.; Kato, S. Analysis of Turbulence in Diesel Spray Using Time-Resolved PIV. In Proceedings of the 13th International Annual Conference on Liquid Atomization and Spray Systems 2015, Tainan, Taiwan, 23–27 August 2015; pp. 1–7. [Google Scholar]
- Zhu, J.; Kut, O.A.; Nishida, K. An Investigation of the Effects of Fuel Injection Pressure, Ambient Gas Density and Nozzle Hole Diameter on Surrounding Gas Flow of a Single Diesel Spray by laer-induced fluorescence-particle image velocimetry Technique. Int. J. Engine Res. 2013. [Google Scholar] [CrossRef]
- Azetsu, A.; Dodo, S.; Someya, T.; Oikawa, C. A Study on the Structure of Diesel Spray (2-D Visualization of the Non-Evaporating Spray). In Proceedings of the International Symposium on Diagnostics and Modeling of Combustion in Internal Combustion Engines 1990, Kyoto, Japan, 3–5 September 1990; pp. 199–204. [Google Scholar]
- Zhu, J.Y.; Nishida, K.; Kuti, O.A. PIV Study on Flow Fields of Spray and Surrounding Gas under Non-Evaporating and Evaporating Conditions. In Proceedings of the 12th International Annual Conference on Liquid Atomization and Spray Systems 2012, Heidelberg, Germany, 2–6 September 2012; pp. 1–8. [Google Scholar]
- Lee, J.; Yamakawa, M.; Isshiki, S.; Nishida, K. An Analysis of Droplets and Ambient Air Interaction in a D.I. Gasoline Spray Using LIF-PIV Technique Reprinted From: SI Combustion and Flow Diagnostics; SAE Techical Paper; SAE International: Warrendale, PA, USA, 2016. [Google Scholar] [CrossRef]


© 2020 by the authors. Licensee MDPI, Basel, Switzerland. This article is an open access article distributed under the terms and conditions of the Creative Commons Attribution (CC BY) license (http://creativecommons.org/licenses/by/4.0/).