Article

A Frequency Estimation Method Based on a Revised 3-Level Discrete Fourier Transform with an Estimation Delay Reduction Technique

Department of Electrical Engineering, Myongji University, Yongin 17058, Korea
*
Author to whom correspondence should be addressed.
Energies 2020, 13(9), 2256; https://doi.org/10.3390/en13092256
Submission received: 27 February 2020 / Revised: 29 April 2020 / Accepted: 30 April 2020 / Published: 4 May 2020

Abstract

:
In this paper, a frequency estimation method based on a revised three-level discrete Fourier transform (DFT) with an estimation delay reduction technique is proposed. First, the input signal passes through a sine filter twice to improve the ability to decrease the level of harmonics and inter-harmonics. Secondly, the second sine-filtered signal is decomposed into two orthogonal components by DFT with a hamming window to enhance the ability to suppress inter-harmonics. The frequency of the signal is derived using orthogonal components without a zero-crossing problem, which can cause numerical estimation error. This process causes the estimation delay of three cycles and three samples in total. Therefore, the estimation delay reduction technique compensating for the phase delay of the phasor is proposed. To evaluate the performance of the proposed method, several frequency changes were considered when the test signals were generated according to the IEEE PMU Standards C37.118.1a-2014. The performance of the proposed method was also evaluated under dynamic and fault conditions in a five-bus transmission system modeled with PSCAD/EMTDC. The simulation results show that the proposed method accurately estimated the frequency of the signal.

1. Introduction

In electric power grids, frequency is one of the most important quantities, because frequency deviation is a good indicator of abnormal system operating conditions, so any deviation in power system frequency should be closely observed. For load shedding, islanding detection of distributed generators, and control of energy storage systems in the power grid, many real-time applications require accurate and fast estimation of power system frequency because an erroneous estimation may eventually result in a catastrophic grid failure due to inadequate or delayed load shedding [1].
Many techniques for more accurate frequency estimation have been proposed. The use of zero-crossing detection and calculation of the number of cycles that occur during a predetermined time interval is a simple and well-known methodology [2,3]. However, an actual signal that is measured in a real power system might contain harmonics. Since a huge error can be caused by distortion of a signal due to harmonics, modified zero-crossing methods have also been studied [4,5]. Phase-locked loop (PLL) techniques have been considered state-of-the-art methodology and widely used for synchronization [6,7,8,9]. PLL-based methods show good performance, but the implementation of these algorithms is complex, and the dynamic response is not fast. Besides, many approaches have been studied to estimate frequency in the scientific literature, such as recursive [10,11], Kalman filters [12,13], least-squares [1,14,15,16], artificial neural networks (ANN) [17,18], Prony [19,20], the Newton algorithm [21,22], and discrete Fourier transform (DFT) [23,24,25,26,27]. Among these, the DFT-based method is one of the most widely used ways of converting a time-domain signal into a fundamental frequency component phasor and estimating the frequency of a signal. While other methods require computationally intensive algorithms, the DFT-based method has a low computational burden, which is a great advantage over the others. Moreover, it has the ability to suppress harmonics and inter-harmonics at nominal frequencies. However, errors arise when the power system frequency deviates from the nominal frequency in the presence of harmonics. The more the total harmonic distortion (THD) increases, the bigger the frequency estimation error grows. Moore et al. [23] developed a new DFT-based numeric technique. This technique suffers from inaccuracy because of the harmonics. Frigo et al. [24] presented a reduced leakage synchrophasor estimation. It addresses the limitations of the DFT by proposing a joint application of the Hilbert transform and the interpolated DFT technique. Park et al. [25] studied a method for estimating the frequency using the differences between the neighboring input data. This method is very susceptible to the additive noise since the frequency is estimated using the difference between the neighboring data. The researchers in [26] introduced a three-level DFT (3LDFT)-based method. Nam et al. [26] defined the 3LDFT as the triple use of the DFT. The 3LDFT method allows accurate frequency estimation that is insensitive to harmonics and inter-harmonics by the triple use of DFT. However, there is a downside, because it uses three cycles, which results in an additional two-cycle delay compared with conventional DFT when calculating orthogonal components. Although 3LDFT is fast enough for rapid-response applications where the estimation delay should be no more than five cycles [26], it should be noted that the unintended estimation delay will occur, which is one of the causes of estimation errors.
The aim of this paper is to propose a frequency estimation method based on a revised 3LDFT with an estimation delay reduction technique for real-time applications. The main contributions of this paper can be listed as follows.
  • The revised 3LDFT can improve harmonic and inter-harmonic suppression performance.
  • The proposed frequency estimation method by adding four orthogonal components helps to suppress harmonics and inter-harmonics, which increases the frequency estimation accuracy. However, a potential weakness of the proposed method is the estimation delay error caused by three cycles and three samples.
  • Therefore, as a final step, the estimation delay error would be decreased tremendously using the estimation delay reduction technique, compensating for the phase delay of the phasor.
Several simulation results obtained using computer and PSCAD/EMTDC-generated signals have demonstrated the performance and effectiveness of the proposed method. The remainder of this paper is organized as follows. Section 2 contains details on the methodology for frequency estimation. Section 3 provides simulation results to demonstrate the performance of the proposed method. The result of the proposed method was compared with those of the 3LDFT and dual second-order generalized integrator(DSOGI)-PLL using computer-generated signals created according to IEEE PMU Standards C37.118.1a-2014 [28] and generated by PSCAD/EMTDC, which were used to verify the accuracy of the proposed method as well. Finally, the conclusions of the study are summarized in Section 4.

2. The Proposed Frequency Estimation Technique

2.1. Sine-Filtered Signals

An input signal v [ n ] sampled with the sampling frequency of f s can be represented by
v [ n ] = v m c o s ( 2 π f f 0 n N + θ ) = v m c o s ( 2 π f f s n + θ )
where f is the reference frequency, v m is the amplitude, θ is the initial phase, f 0 is the nominal frequency, N is the number of samples per cycle, and f s = f 0 N .
First of all, the input signal passes through a sine filter instead of a cosine filter to suppress harmonics and inter-harmonics that might be included in the input signal of a power system. Theoretically, this filtering process brings about a delay of one cycle. The respective coefficients of the cosine and sine filters are as follows:
Z c [ k ] = 2 N c o s ( 2 π k N + π N ) , k = 0 ,   1 , , N 1
Z s [ k ] = 2 N s i n ( 2 π k N + π N ) , k = 0 ,   1 , , N 1
where Z c [ k ] and Z s [ k ] are the coefficients of the cosine and sine filter respectively. The input signal may be decomposed into two components, each orthogonal in phase, by the use of two finite impulse response (FIR) filters based upon sine and cosine impulse responses. This technique is actually identical to the discrete Fourier transform evaluated for the fundamental component [21]. The magnitude and phase response of the cosine and sine filters can be respectively expressed as
| Z c ( f ) | = 4 N c o s ( π f 0 / f s ) s i n ( π f / f s ) s i n ( π N f / f s ) c o s ( 2 π f / f s ) c o s ( 2 π f 0 / f s )
Z c ( f ) = π π N 1 N f f 0
| Z s ( f ) | = 4 N s i n ( π f 0 / f s ) c o s ( π f / f s ) s i n ( π N f / f s ) c o s ( 2 π f / f s ) c o s ( 2 π f 0 / f s )
Z s ( f ) = π 2 π N 1 N f f 0
where | Z c ( f ) | and Z c ( f ) is the magnitude and phase response of the cosine filter, and | Z s ( f ) | and Z s ( f ) is the magnitude and phase response of the sine filter. The magnitude response for each filter is illustrated in Figure 1. The sine filter can decrease the level of the harmonics and inter-harmonics more effectively than the cosine filter, as shown in Figure 1, which is the reason why it is used in place of the cosine filter in this paper. The first sine-filtered signal can be obtained as
v s [ n ] = k = 0 N 1 v [ n k ] Z s [ k ] = v m | Z s ( f ) | c o s ( 2 π f f s n + θ + Z s ( f ) ) = v m | Z s ( f ) | c o s ( 2 π f f s n + θ + Z c ( f ) π 2 ) = K s s i n ( 2 π f f s n + θ c )
where K s = v m | Z s ( f ) | , θ c = θ + Z c ( f ) and v s [ n ] is the first sine filtered-signal.
To reduce the negative influence of harmonics and inter-harmonics on the accuracy of the proposed method, the sine filter is applied to the first sine-filtered signal again, which should give rise to an additional delay of one cycle. The second sine-filtered signal can be expressed as
v s s [ n ] = K s | Z s ( f ) | s i n ( 2 π f f s n + θ c + Z s ( f ) ) = K s s c o s ( 2 π f f s n + θ c c )
where K s s = K s | Z s ( f ) | , θ c c = θ c + Z c ( f ) and v s s [ n ] is the second sine-filtered signal.
After that, the second sine-filtered signal is decomposed into two orthogonal components through DFT, which, in other words, means it passes through the cosine and sine filters once more. The entire filtering procedure is described in Figure 2.
As previously mentioned, the second sine-filtered signal is divided into real and imaginary parts.
v s s c [ n ] = K s s | Z c ( f ) | c o s ( 2 π f f s n + θ c c + Z c ( f ) ) = K s s c c o s ( 2 π f f s n + θ c c c ) ,
v s s s [ n ] = K s s | Z s ( f ) | c o s ( 2 π f f s n + θ c c + Z s ( f ) ) = K s s s s i n ( 2 π f f s n + θ c c c ) ,
where v s s c [ n ]   and   v s s s [ n ] are the real and imaginary parts of the input signal, K s s c = K s s | Z c ( f ) | , K s s s = K s s | Z s ( f ) | , and θ c c c = θ c c + Z c ( f ) .
This filtering procedure can be considered as the DFT applied three times, which is similar to the 3LDFT method presented in [26]. As a result, the three-cycle delay comes about, which becomes a part of the estimation delay. A diagram of the revised 3LDFT is shown in Figure 3.
Each imaginary part from the first and second levels is used as the input signal in each next step, and it should be noted that the real part is only calculated at the third level. Therefore, in the DFT process, the revised 3LDFT method has half the computational burden of the 3LDFT. At the third level of the DFT, a hamming window works as a smoothing technology to improve the accuracy of the frequency estimation. The coefficient of the hamming window is given by
W [ k ] = 0.54 0.46 c o s ( 2 π k N 1 ) , k = 0 ,   1 , , N 1

2.2. The Novel Frequency Estimation Method

Now that there are only a few harmonics left in the orthogonal components thanks to the revised 3LDFT, most of the signal distortion will disappear, which means that the frequency estimation error is considerably decreased. In [25], a frequency estimation method by magnifying the harmonics and inter-harmonics using the difference between the neighboring input data was suggested. However, the difference might cause errors because the difference can be regarded as a high-pass filter. Hence, another frequency estimation method based on addition using four orthogonal components is proposed in this paper. Using the trigonometric identity c o s ( A ) + c o s ( B ) = 2 c o s ( ( A + B ) / 2 ) c o s ( ( A B ) / 2 ) yields the following equation:
v s s c [ n 1 ] + v s s c [ n 2 ] = K s s c { c o s ( 2 π f f s ( n 1 ) + θ c c c ) + c o s ( 2 π f f s ( n 2 ) + θ c c c ) } = 2 K s s c c o s ( 2 π f f s n + θ c c c 3 π f f s ) c o s ( π f f s )
The following expression can also be derived by using the same trigonometric identity:
v s s c [ n ] + v s s c [ n 1 ] + v s s c [ n 2 ] + v s s c [ n 3 ] = K s s c { c o s ( 2 π f f s n + θ c c c ) + c o s ( 2 π f f s ( n 1 ) + θ c c c ) + c o s ( 2 π f f s ( n 2 ) + θ c c c ) + c o s ( 2 π f f s ( n 3 ) + θ c c c ) } = 2 K s s c c o s ( 2 π f f s n + θ c c c 3 π f f s ) { c o s ( π f f s ) + c o s ( 3 π f f s ) } = 4 K s s c c o s ( 2 π f f s n + θ c c c 3 π f f s ) c o s ( π f f s ) c o s ( 2 π f f s )
Application of the trigonometric identity s i n ( A ) + s i n ( B ) = 2 s i n ( ( A + B ) / 2 ) c o s ( ( A B ) / 2 ) similarly yields the following equation:
v s s s [ n 1 ] + v s s s [ n 2 ] = K s s s { s i n ( 2 π f f s ( n 1 ) + θ c c c ) + s i n ( 2 π f f s ( n 2 ) + θ c c c ) } = 2 K s s s s i n ( 2 π f f s n + θ c c c 3 π f f s ) c o s ( π f f s )
The following expression can be derived in a similar manner:
v s s s [ n ] + v s s s [ n 1 ] + v s s s [ n 2 ] + v s s s [ n 3 ] = K s s s { s i n ( 2 π f f s n + θ c c c ) + s i n ( 2 π f f s ( n 1 ) + θ c c c ) + s i n ( 2 π f f s ( n 2 ) + θ c c c ) + s i n ( 2 π f f s ( n 3 ) + θ c c c ) } = 2 K s s s s i n ( 2 π f f s n + θ c c c 3 π f f s ) { c o s ( π f f s ) + c o s ( 3 π f f s ) } = 4 K s s s s i n ( 2 π f f s n + θ c c c 3 π f f s ) c o s ( π f f s ) c o s ( 2 π f f s )
Next, the frequency estimation equation can be obtained by dividing (14) by (13) as follows:
f c a l [ n ] = f s 2 π cos 1 { 1 2 v s s c [ n ] + v s s c [ n 1 ] + v s s c [ n 2 ] + v s s c [ n 3 ] v s s c [ n 1 ] + v s s c [ n 2 ] } = f s 2 π cos 1 { 1 2 4 K s s c c o s ( 2 π f f s n + θ c c c 3 π f f s ) c o s ( π f f s ) c o s ( 2 π f f s ) 2 K s s c c o s ( 2 π f f s n + θ c c c 3 π f f s ) c o s ( π f f s ) } = f s 2 π cos 1 { cos ( 2 π f f s ) }
Similarly, another frequency estimation equation can also be obtained as
f c a l [ n ] = f s 2 π cos 1 { 1 2 v s s s [ n ] + v s s s [ n 1 ] + v s s s [ n 2 ] + v s s s [ n 3 ] v s s s [ n 1 ] + v s s s [ n 2 ] } = f s 2 π cos 1 { 1 2 4 K s s s s i n ( 2 π f f s n + θ c c c 3 π f f s ) c o s ( π f f s ) c o s ( 2 π f f s ) 2 K s s s s i n ( 2 π f f s n + θ c c c 3 π f f s ) c o s ( π f f s ) } = f s 2 π cos 1 { cos ( 2 π f f s ) }
Both Equations (17) and (18) introduce the zero-crossing problem since v s s c [ n ] and v s s s [ n ] are instantaneous values. To solve this zero-crossing problem, the following equation is proposed:
( v s s c [ n ] + v s s c [ n 1 ] + v s s c [ n 2 ] + v s s c [ n 3 ] ) 2 + ( v s s s [ n ] + v s s s [ n 1 ] + v s s s [ n 2 ] + v s s s [ n 3 ] ) 2 ( v s s c [ n 1 ] + v s s c [ n 2 ] ) 2 + ( v s s s [ n 1 ] + v s s s [ n 2 ] ) 2 = { 4 K s s c c o s ( 2 π f f s n + θ c c c 3 π f f s ) c o s ( π f f s ) c o s ( 2 π f f s ) } 2 + { 4 K s s s s i n ( 2 π f f s n + θ c c c 3 π f f s ) c o s ( π f f s ) c o s ( 2 π f f s ) } 2 { 2 K s s c c o s ( 2 π f f s n + θ c c c 3 π f f s ) c o s ( π f f s ) } 2 + { 2 K s s s s i n ( 2 π f f s n + θ c c c 3 π f f s ) c o s ( π f f s ) } 2 = c o s 2 ( 2 π f f s ) 16 c o s 2 ( π f f s ) { K s s c 2 c o s 2 ( 2 π f f s n + θ c c c 3 π f f s ) + K s s s 2 s i n 2 ( 2 π f f s n + θ c c c 3 π f f s ) } 4 c o s 2 ( π f f s ) { K s s c 2 c o s 2 ( 2 π f f s n + θ c c c 3 π f f s ) + K s s s 2 s i n 2 ( 2 π f f s n + θ c c c 3 π f f s ) } = 4 c o s 2 ( 2 π f f s )
As a result, the frequency of the input signal f c a l [ n ] is calculated using Equation (20), but it may lead to a delay of three cycles and three samples.
f c a l [ n ] = f s 2 π cos 1 ( ( v s s c [ n ] + v s s c [ n 1 ] + v s s c [ n 2 ] + v s s c [ n 3 ] ) 2 + ( v s s s [ n ] + v s s s [ n 1 ] + v s s s [ n 2 ] + v s s s [ n 3 ] ) 2 4 { ( v s s c [ n 1 ] + v s s c [ n 2 ] ) 2 + ( v s s s [ n 1 ] + v s s s [ n 2 ] ) 2 } )

2.3. The Estimation Delay Reduction Technique

As previously stated, Equation (20) results in the estimation delay of three cycles and three samples. The estimation delay can be anticipated using Equation (5) which means phase response of the phasor. The Equation (5) represents how the phase of the phasor is delayed. Since Equation (5) is a frequency-dependent function, the phase delay of the phasor can be obtainable by using the previously calculated frequency. In the proposed method, a moving average filter with the length of one cycle is applied to achieve a stable response as shown in Equation (21).
f a v g [ n ] = i = 0 N 1 f c a l [ n i ] N
The phase delay of the phasor can be calculated by substituting f a v g [ n ] for f in Equation (5). Therefore, the phase delay of three cycles and three samples can be also determined from Equation (22) as follows:
θ d e l a y [ n ] = { Z c ( f a v g [ n ] ) } ( 3 + 3 / N ) .
where θ d e l a y [ n ] is the phase delay of three cycles and three samples.
The phase delay is the phase difference between the ideal phasor of the discrete-time input signal and the delayed phasor. Figure 4 illustrates what the phase delay means.
Where v m e j ( 2 π f n T s + θ ) is the ideal phasor of the discrete-time input signal whose phase delay is not included at all, v m e j ( 2 π f n T s + θ + θ d e l a y [ n ] ) is the delayed phasor, and T s is the sampling interval, which is the same as 1 / f s .
Since the phase delay is related to the estimation delay, the estimation delay can be got rid of by compensating for the phase delay of three cycles and three samples as follows:
θ = θ c c c θ d e l a y [ n ] .
This methodology can be easily implemented by using Euler’s formula as
( v s s c [ n ] + j v s s s [ n ] ) × e j θ d e l a y [ n ] = ( v s s c [ n ] + j v s s s [ n ] ) × { c o s ( θ d e l a y [ n ] ) j s i n ( θ d e l a y [ n ] ) } = { v s s c [ n ] c o s ( θ d e l a y [ n ] ) + v s s s [ n ] s i n ( θ d e l a y [ n ] ) } + j { v s s s [ n ] c o s ( θ d e l a y [ n ] ) v s s c [ n ] s i n ( θ d e l a y [ n ] ) } = V s s c [ n ] + j V s s s [ n ] = K s s c c o s ( 2 π f f s n + θ ) + j K s s s s i n ( 2 π f f s n + θ ) .
where V s s c [ n ] and V s s s [ n ] are the revised orthogonal components.
Then, the frequency, f e s t [ n ] , whose estimation delay is almost eliminated, can be estimated by
f e s t [ n ] = f s 2 π cos 1 ( ( V s s c [ n ] + V s s c [ n 1 ] + V s s c [ n 2 ] + V s s c [ n 3 ] ) 2 + ( V s s s [ n ] + V s s s [ n 1 ] + V s s s [ n 2 ] + V s s s [ n 3 ] ) 2 4 { ( V s s c [ n 1 ] + V s s c [ n 2 ] ) 2 + ( V s s s [ n 1 ] + V s s s [ n 2 ] ) 2 } ) .

2.4. A Flowchart of the Proposed Method

Figure 5 shows the flowchart of the proposed method. The proposed method starts with collecting the input voltage signal with the sampling frequency of 3840 Hz (i.e., 64 samples per cycle in a 60 Hz system). The sampled signal is decomposed into the two orthogonal components through the revised 3LDFT described in Section 2.1. Equation (20) is used to calculate the frequency f c a l [ n ] , in which the estimation delay of the three cycles and three samples is included.
Afterwards, f a v g [ n ] is obtained using Equation (21) to calculate the phase delay of the phasor. Then, the phase delay is decreased through Equations (22) and (24). Finally, the frequency with the reduced estimation delay is estimated by using, V s s c [ n ] and V s s s [ n ] , as in Equation (25).

3. Performance Evaluation

To verify the performance of the proposed method, computer-generated signals were used, and these signals were made according to IEEE PMU Standards C37.118.1a-2014. The PSCAD/EMTDC signal obtained in the modified IEEE five-bus 345 kV transmission system [26] was also used to test the accuracy of the proposed method under the dynamics and fault condition. The results of the proposed method were compared with those of the 3LDFT [26] and the DSOGI-PLL method [8].

3.1. Using Computer Generated Signals

With reference to [26] and IEEE C37.118.1a-2014, the three types of computer-generated frequency variation signals were created using
f 1 [ n ] = f 0 2 + n f s { u [ n ] u [ n 4 f s ] } + 4 u [ n 4 f s ] ,
f 2 [ n ] = f 0 + 2 n f s { u [ n ] u [ n 4 f s ] } 4 u [ n 4 f s ] ,
f 3 [ n ] = f 0 + 2 ( 1 n 4 f s ) s i n ( 2 π n 4 f s ) { u [ n ] u [ n 4 f s ] } ,
where f 1 is positive ramp frequency variation, f 2 is negative ramp frequency variation, and f 3 is sinusoidal frequency variation.
In accordance with IEEE C37.118.1a-2014, the positive ramp test starts at 58 Hz and ramps up to 62 Hz, whereas the negative ramp test starts at 62 Hz and ramps down to 58 Hz [28]. To evaluate the accuracy of the proposed method, the frequency estimation error is calculated as
Error   = reference   frequency estimated   frequency reference   frequency × 100   [ % ]
where Error is the frequency estimation error and expressed as both [Hz] and [%].

3.1.1. Tests for Basic Signals

The input signal was generated using Equation (1) with Equations (26)–(28).
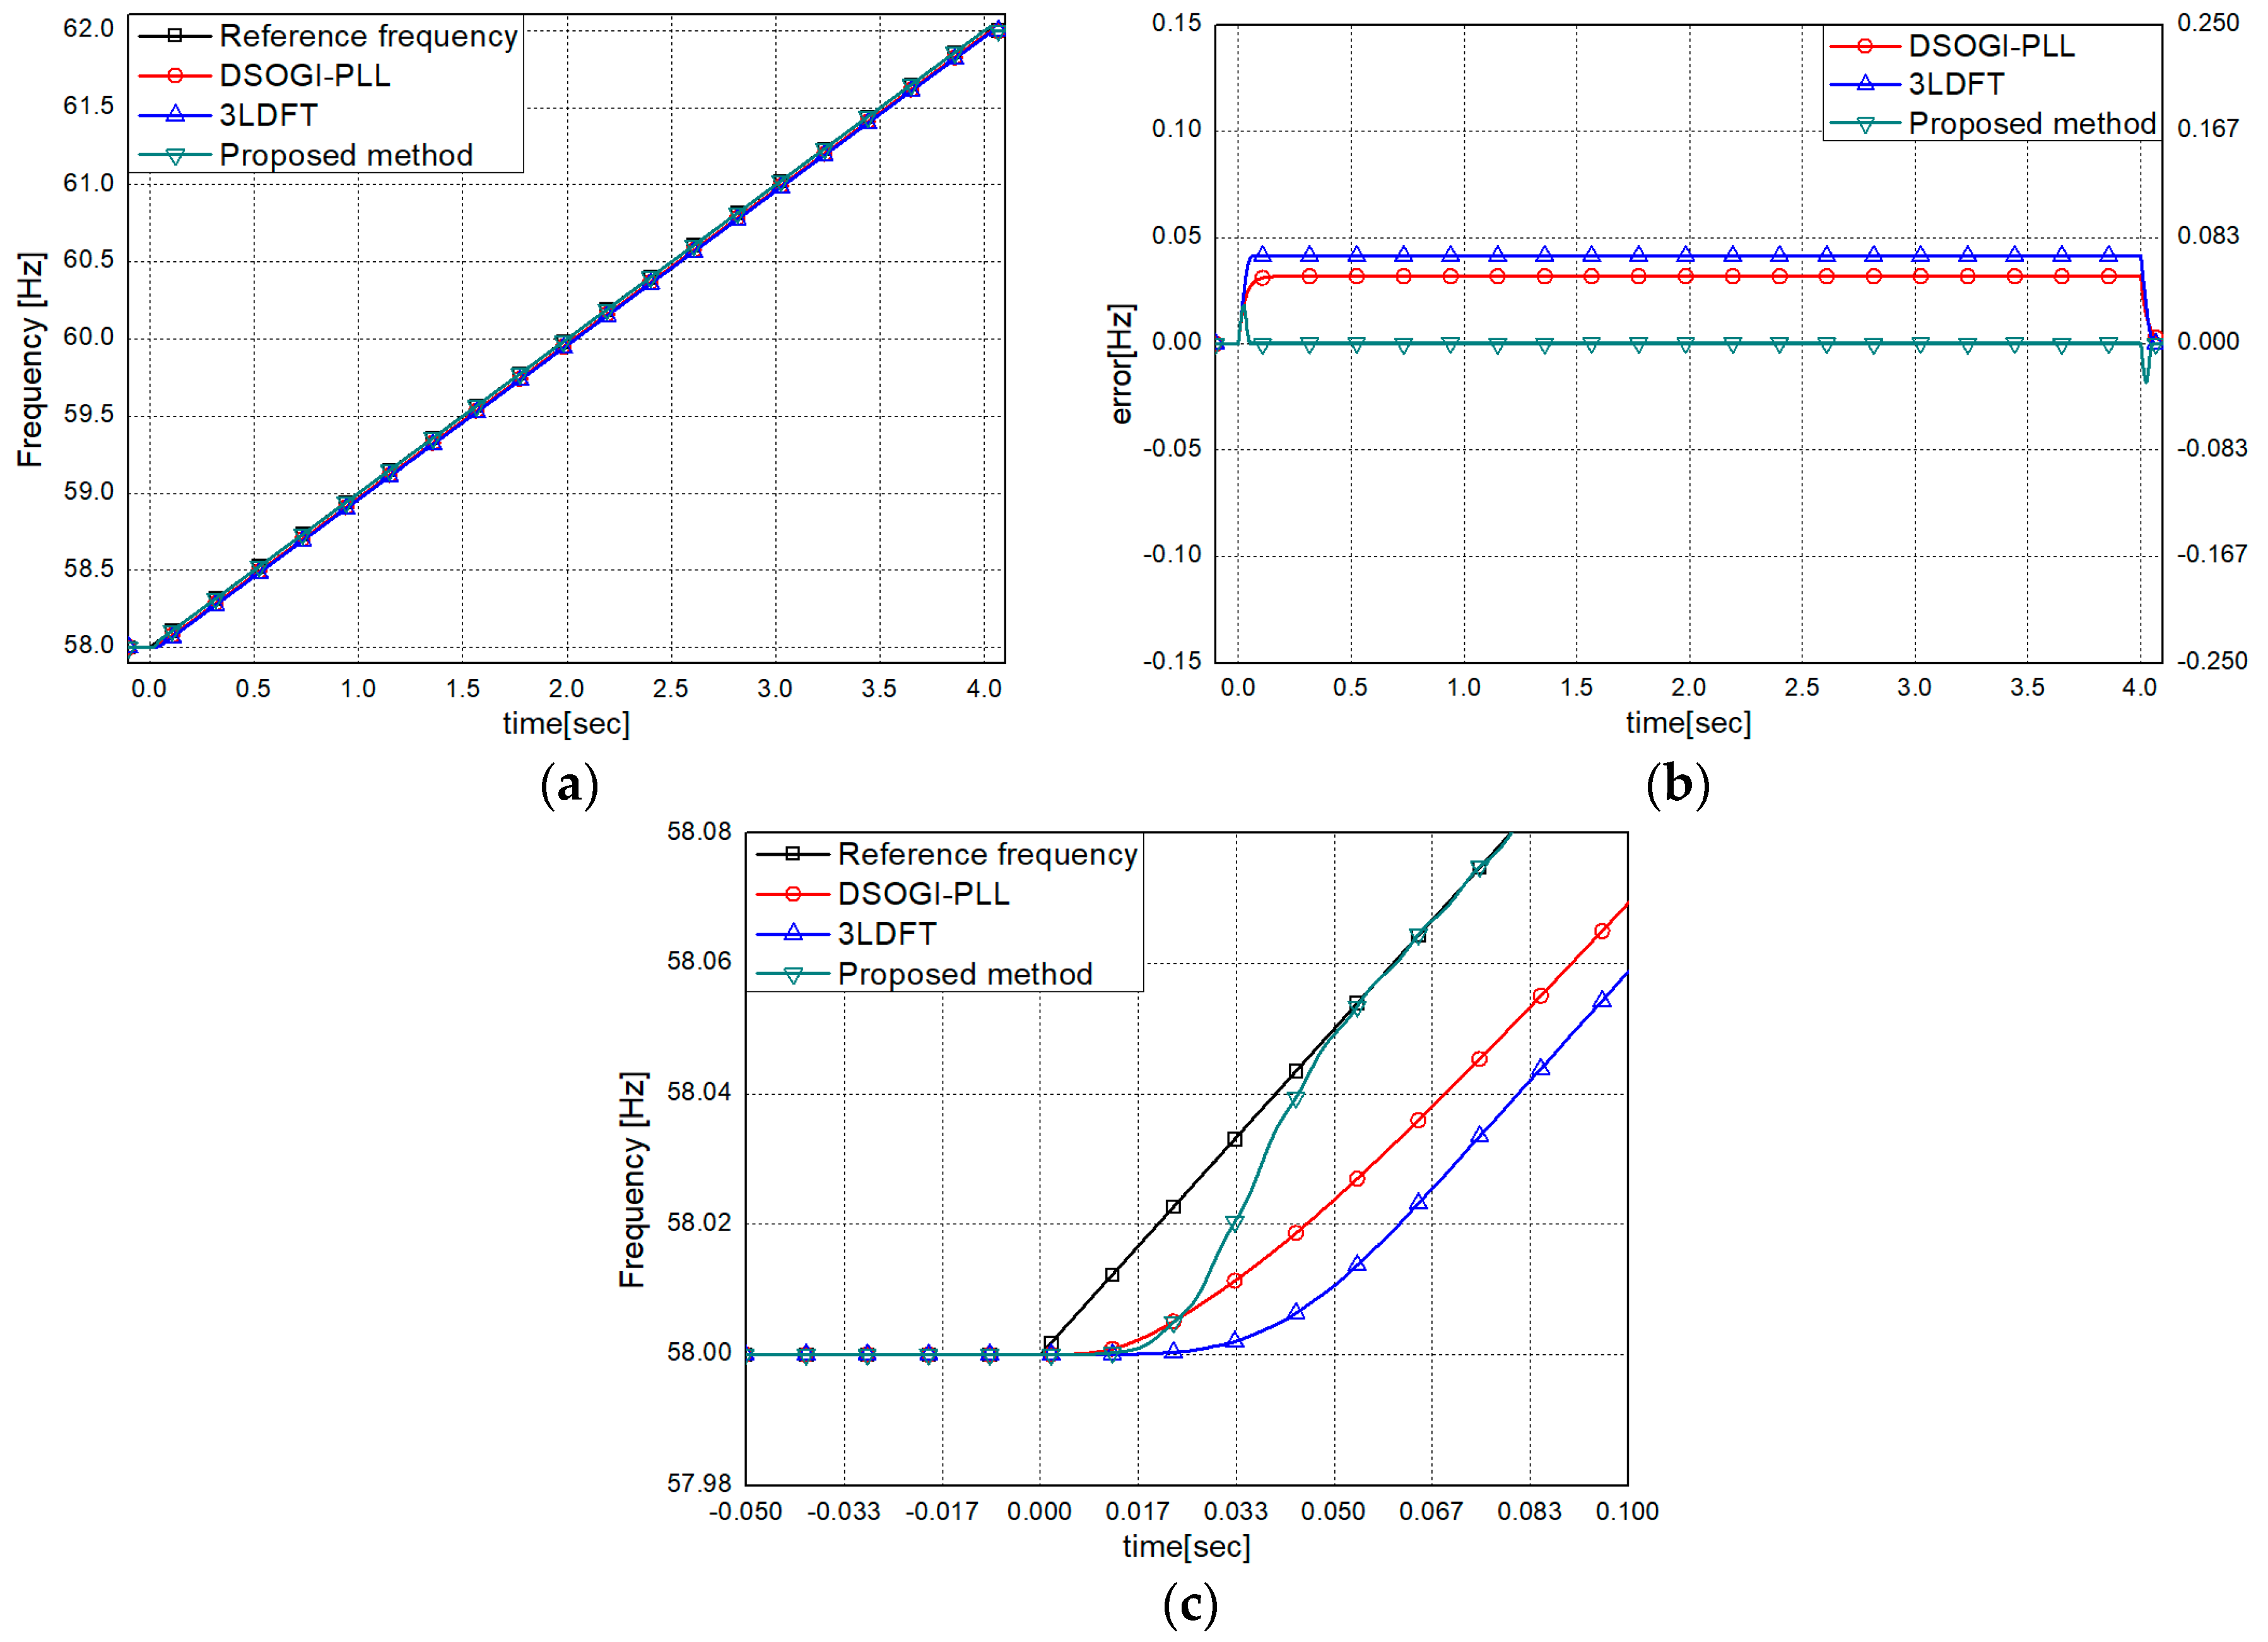
Figure 6 shows that the proposed method was able to estimate the frequency much more accurately than the 3LDFT and DSOGI-PLL under the positive ramp variation condition. Since the estimation delay of the proposed method was considerably eliminated, the frequency estimation error was close to zero. On the other hand, the 3LDFT had a frequency estimation error of 0.041 Hz due to the five cycles and DSOGI-PLL also had a frequency estimation error of 0.032 Hz. The proposed method had a slightly slow time response at the beginning of the frequency variation but was faster enough than 3LDFT and DSOGI-PLL as seen in Figure 6c. The proposed method had a small overshoot at the end of the frequency variation, as shown in Figure 6b.
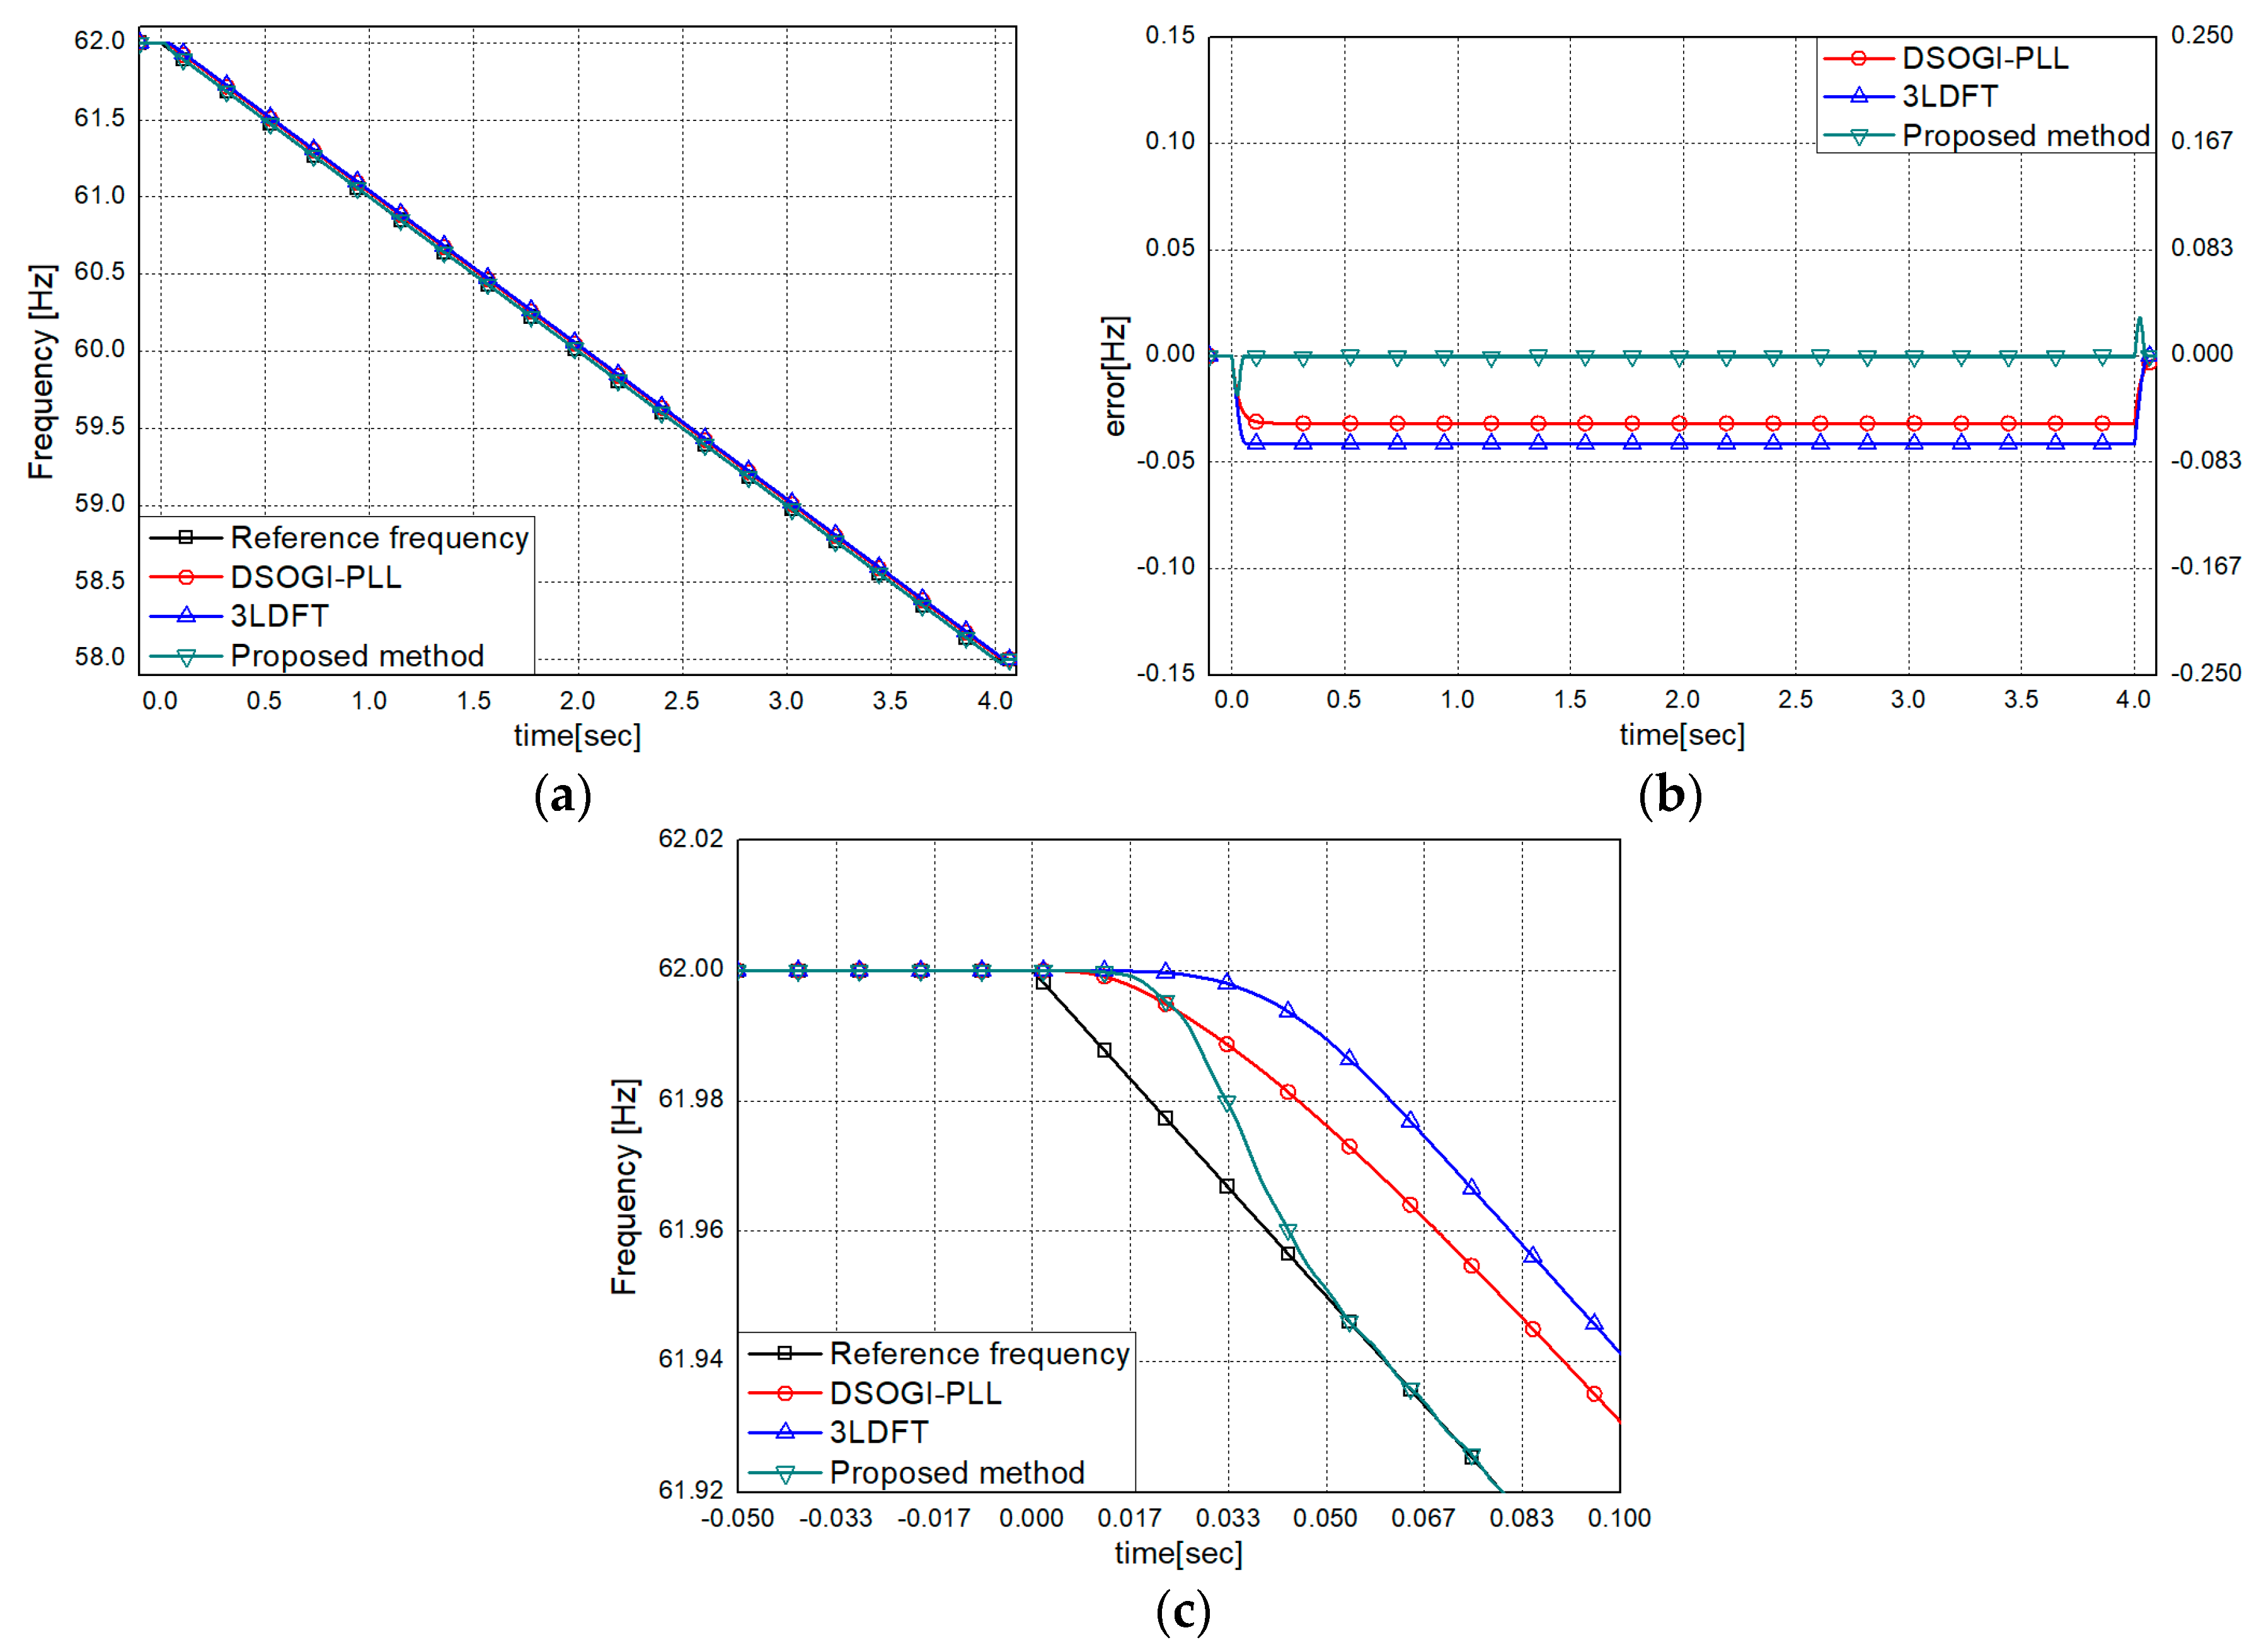
The test results under the negative ramp frequency variation condition are shown in Figure 7. Unlike 3LDFT and DSOGI-PLL, the proposed method estimated the frequency very accurately with reduced estimation delay, so the frequency estimation error was close to zero as seen in Figure 7b.
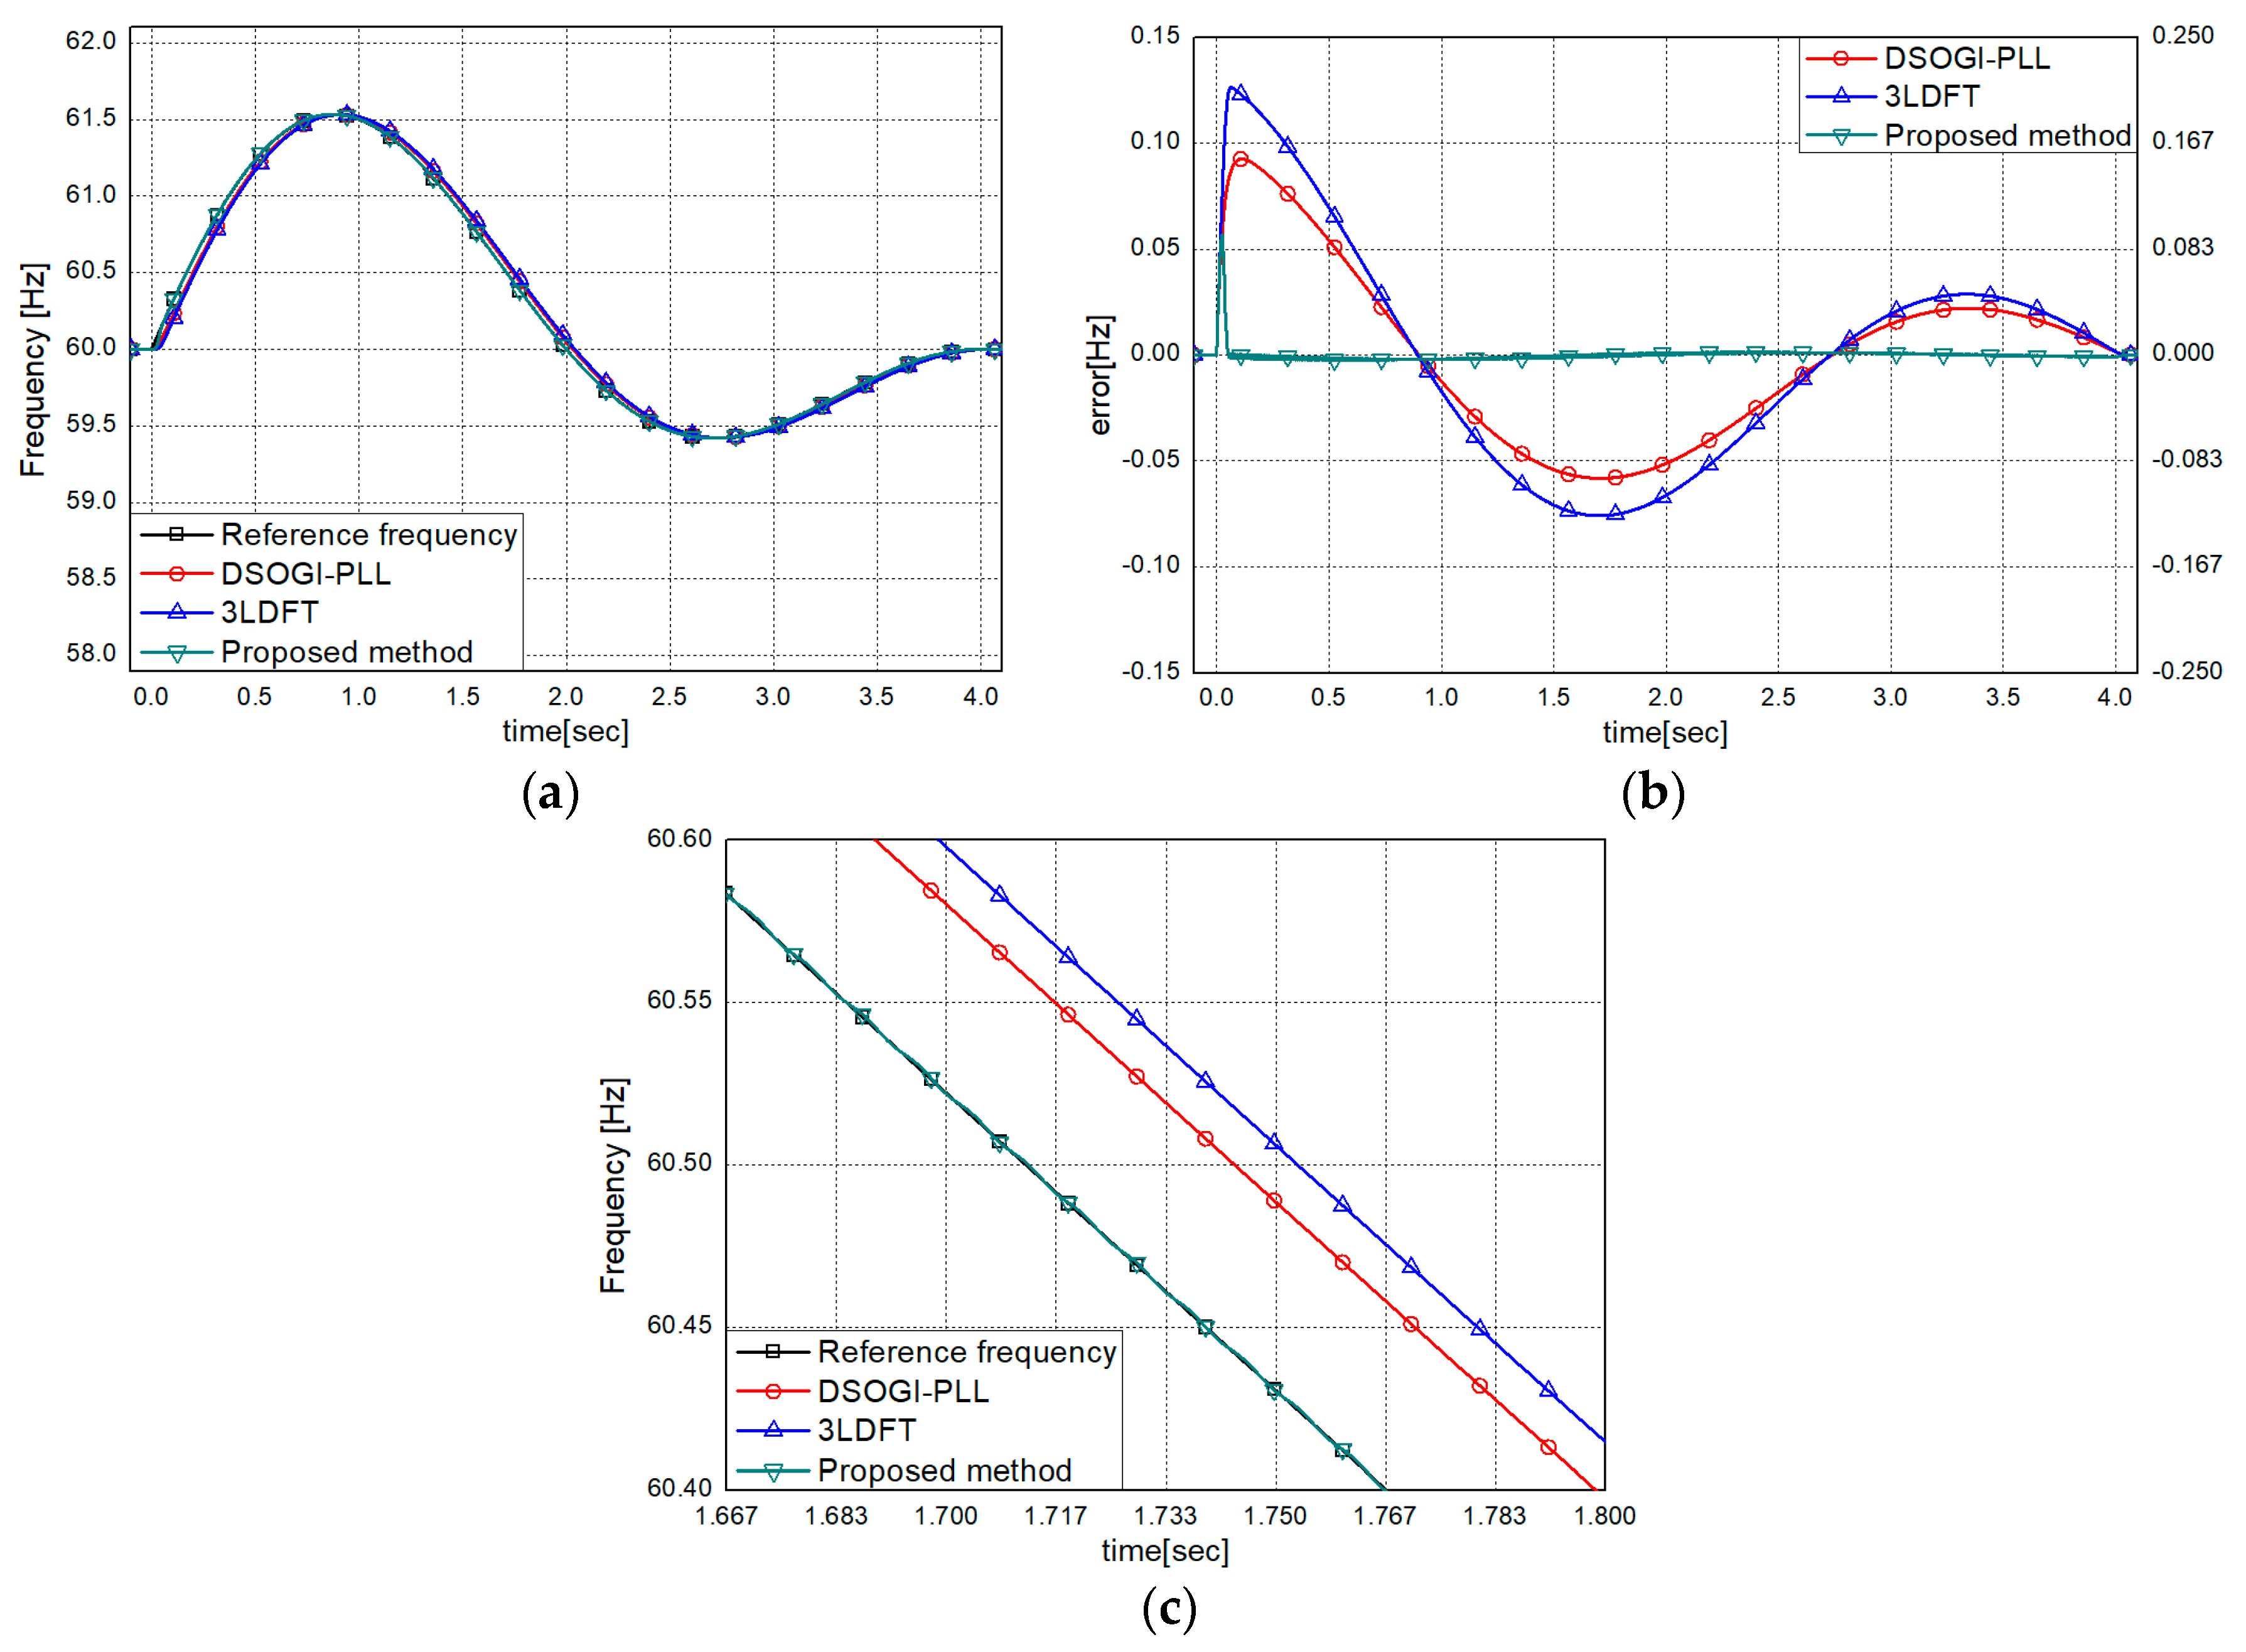
Figure 8 shows the results of the two methods under the sinusoidal wave frequency variation condition. Similar to the other tests, the frequency estimation error of the proposed method was much smaller than that of the 3LDFT and DSOGI-PLL, as shown in Figure 8b.

3.1.2. Tests for Harmonics and Inter-Harmonics

To investigate the performance of the proposed method under harmonic distortion condition, the following input signal, whose THD is 31.6%, was considered. The percentage of the harmonics are listed in Table 1.
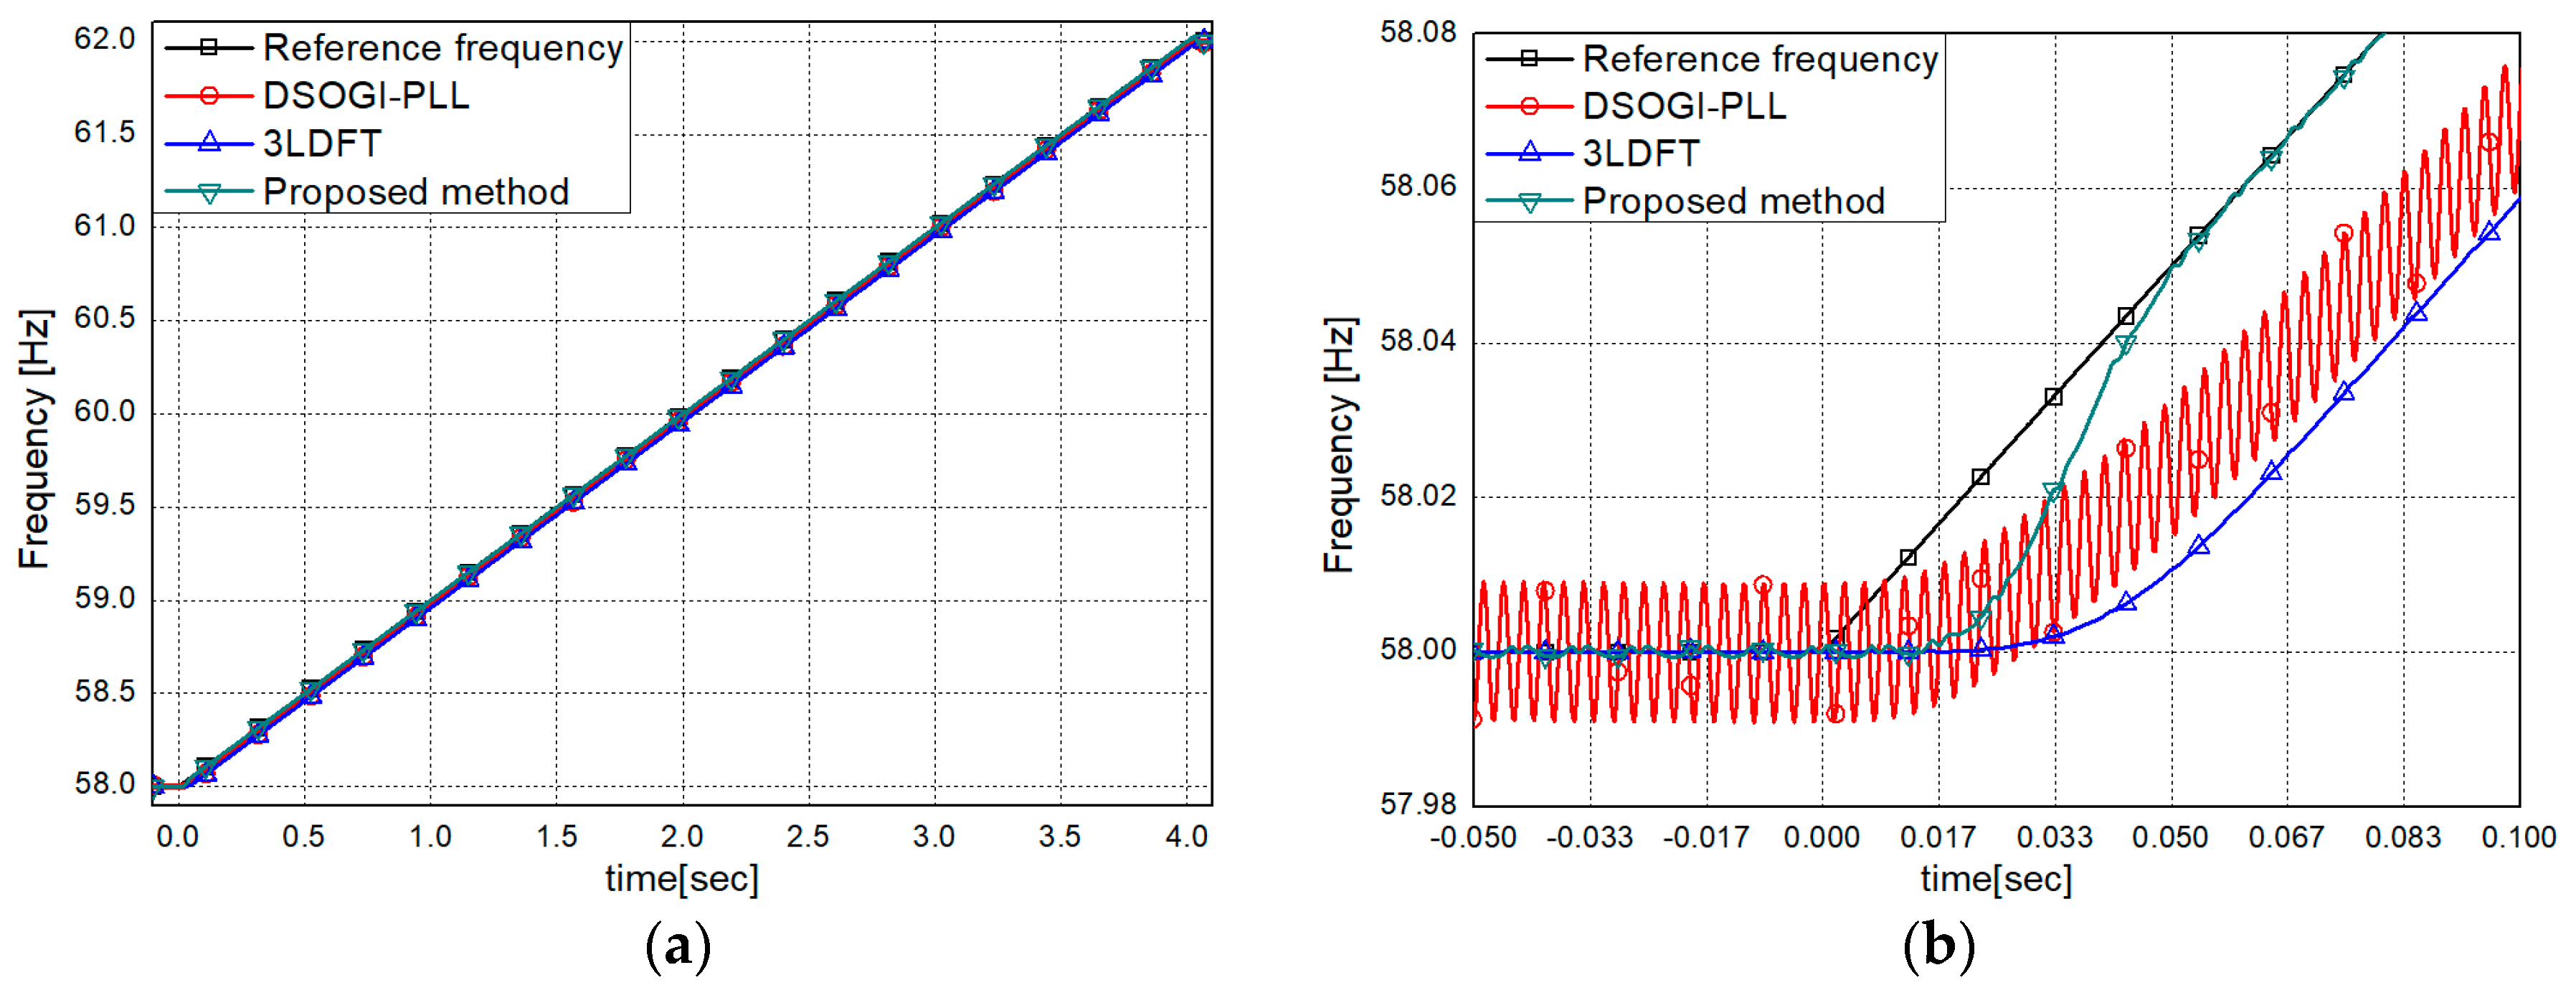
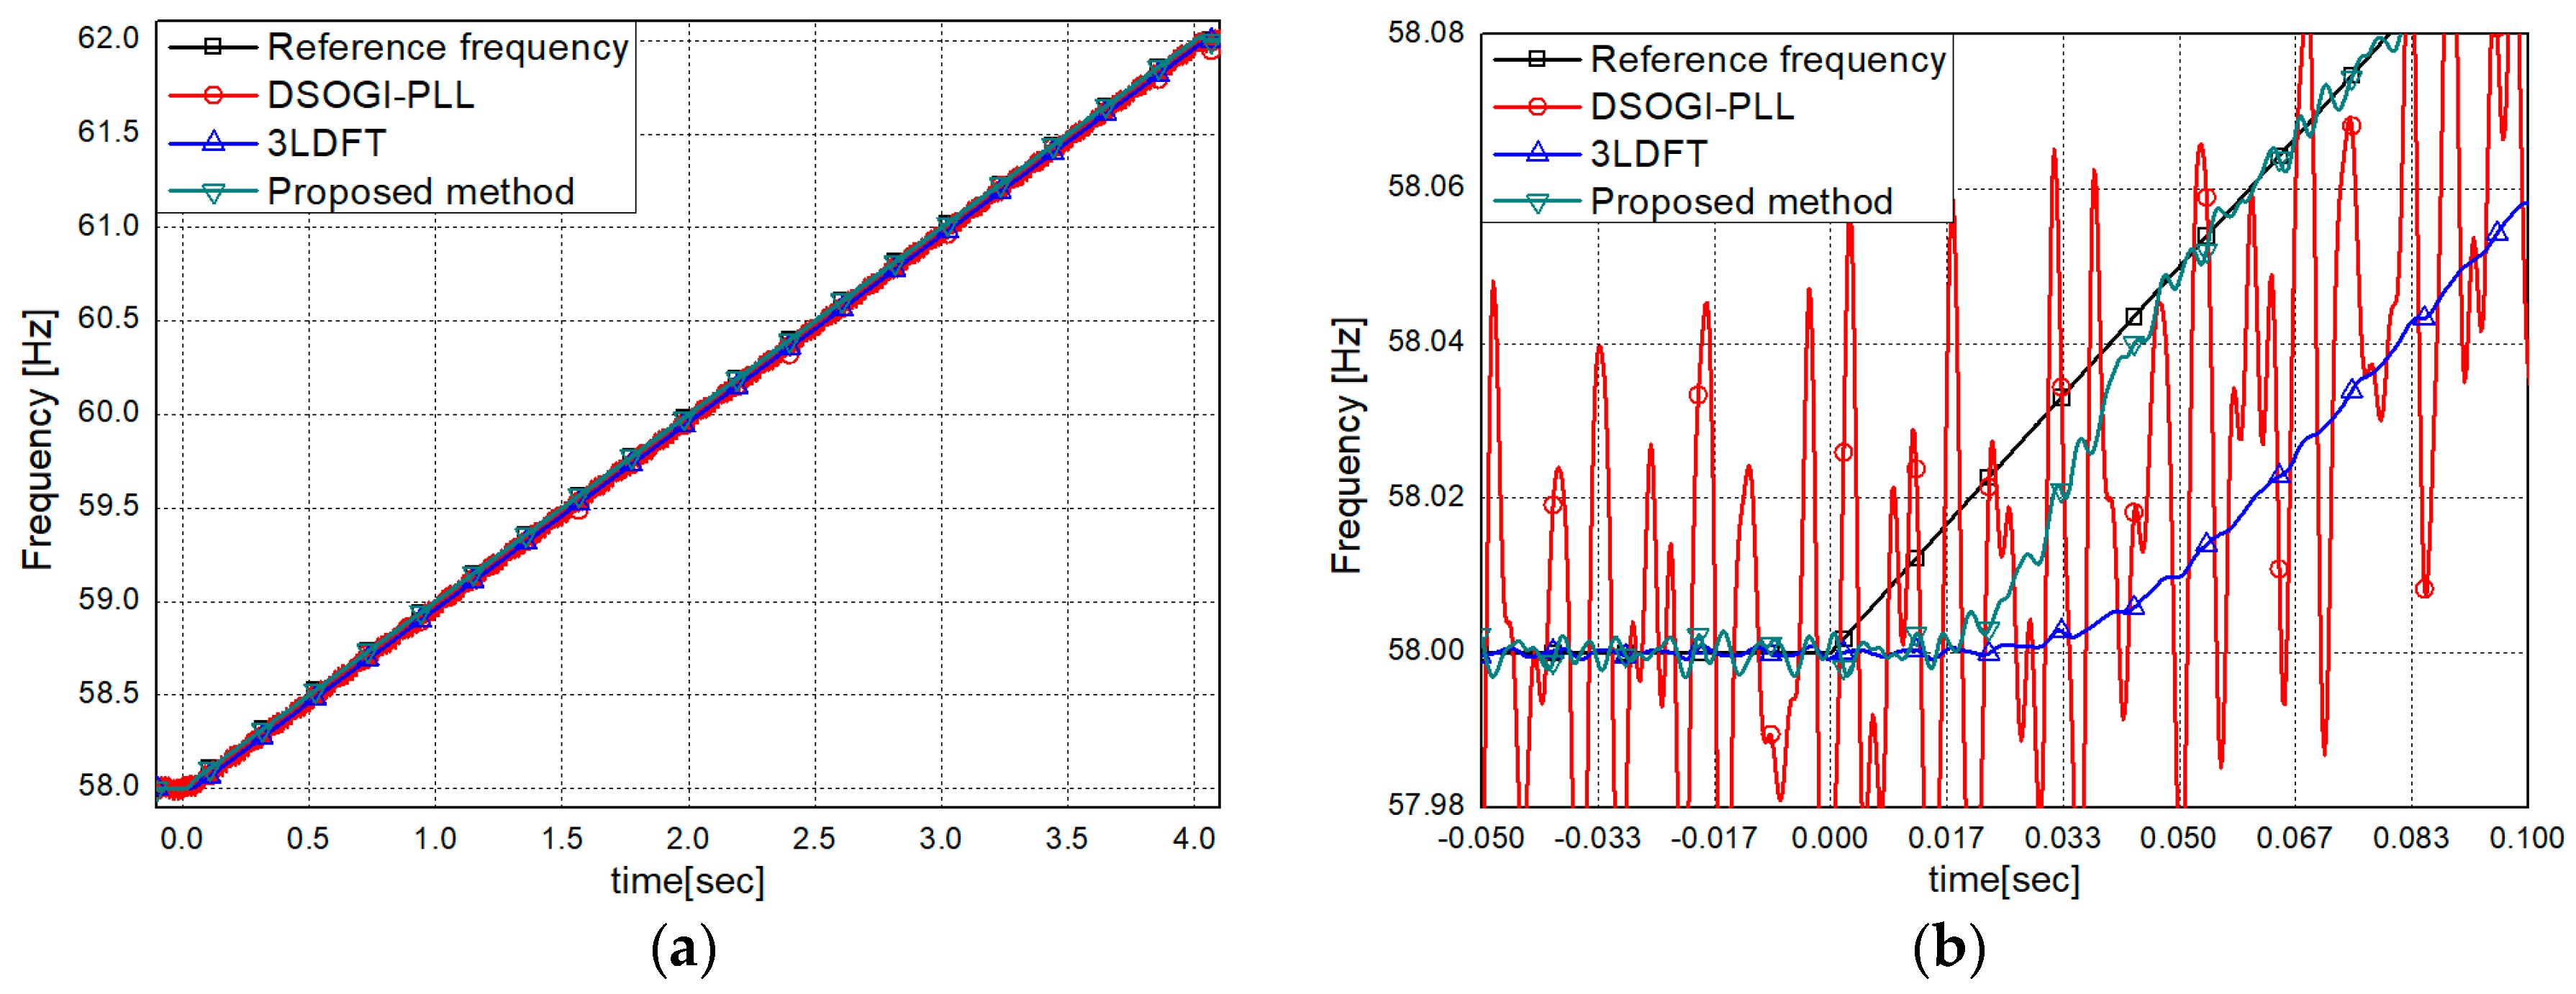
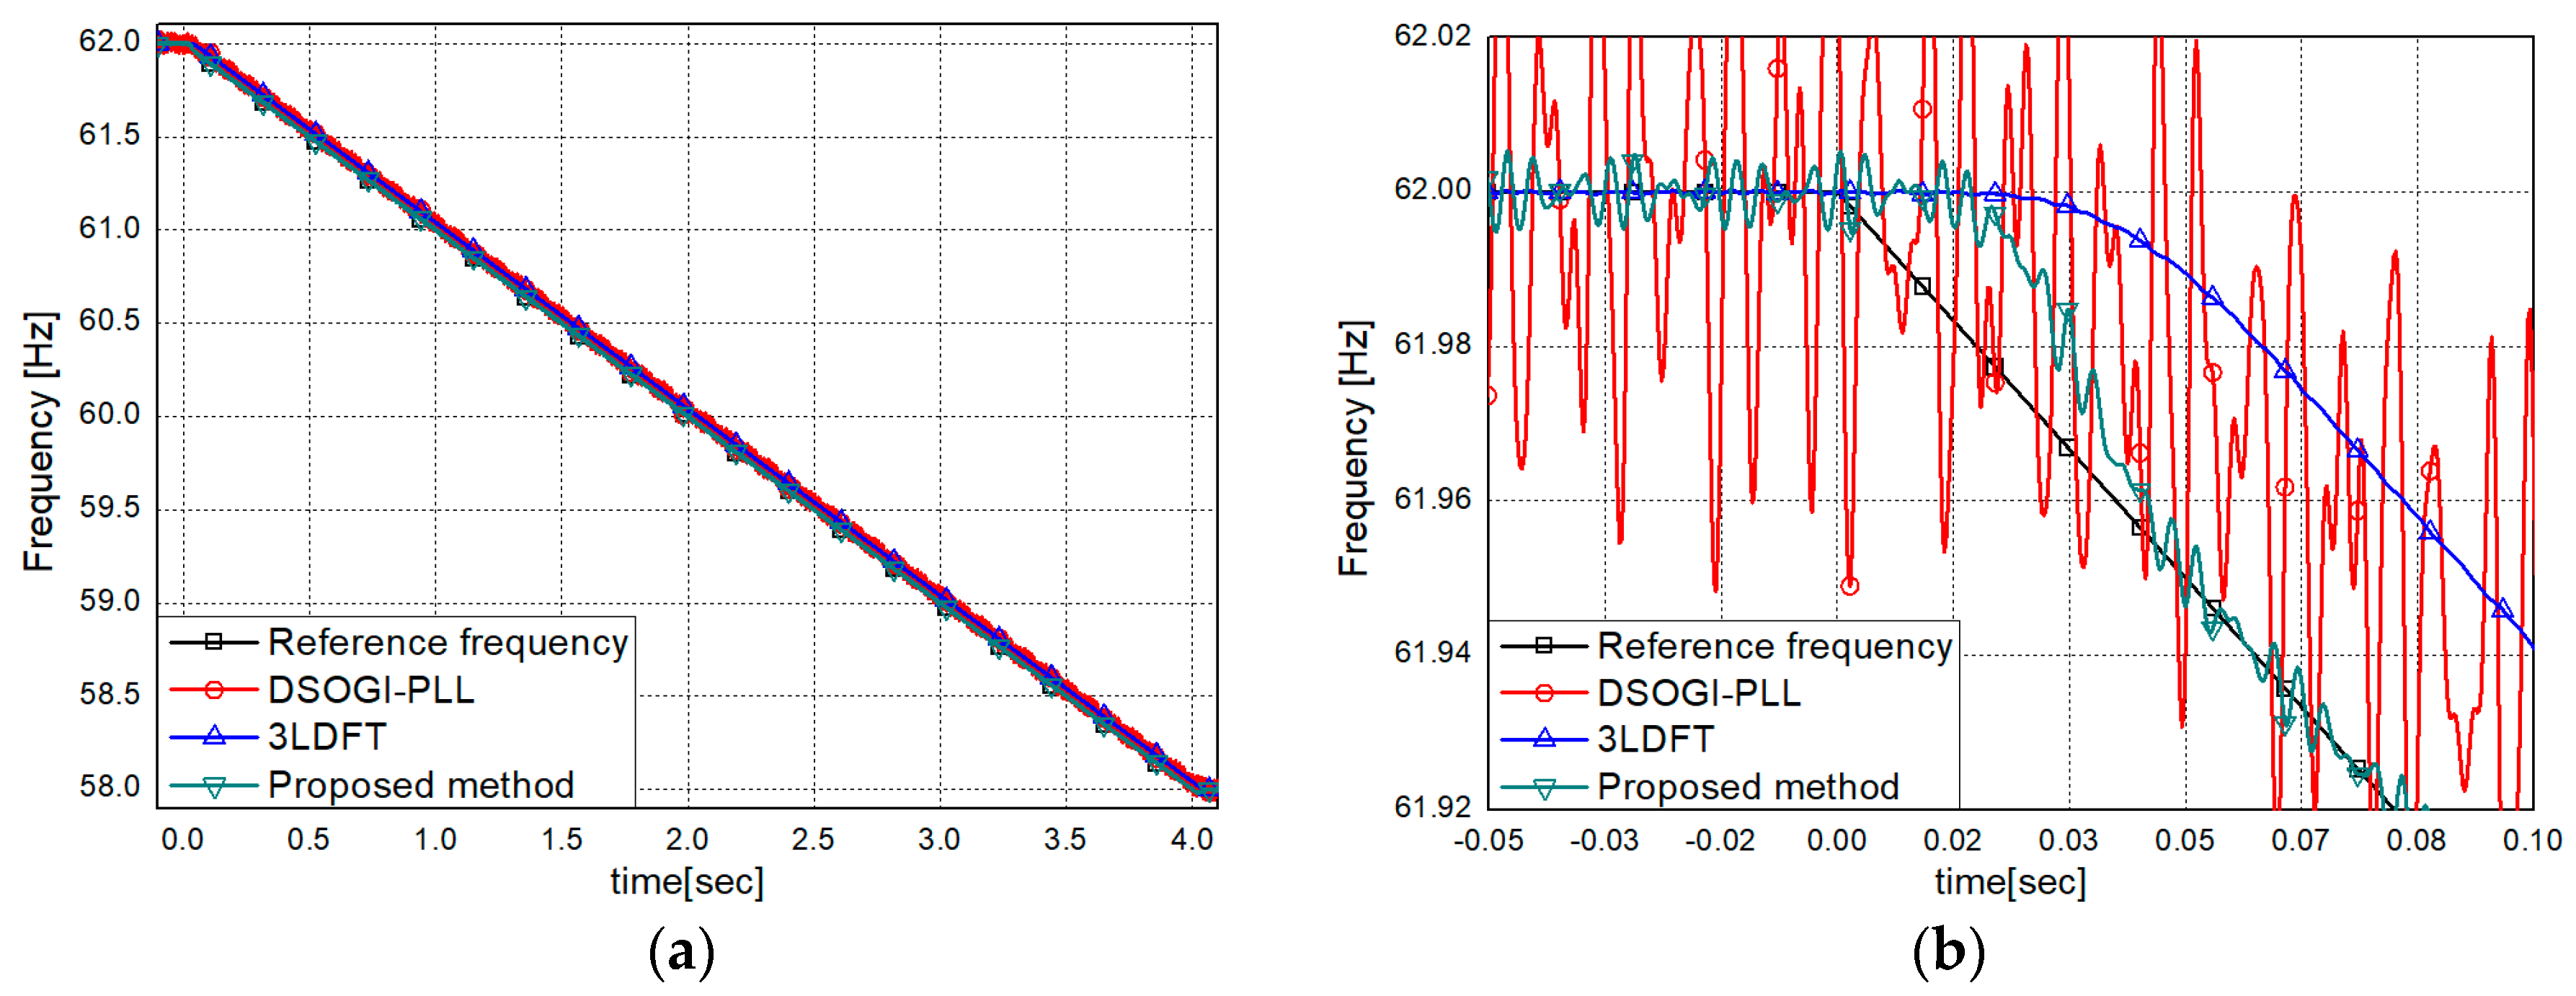
Figure 9 and Figure 10 show the frequency estimation results in the presence of the harmonics. The proposed method and 3LDFT are seen to efficiently remove the adverse influence of the harmonics because of the triple use of the DFT. Besides, the estimation delay of the proposed method was successfully eliminated under the harmonic conditions. The proposed method resulted in slight errors when the reference frequency was either at steady state or had deviated from the nominal frequency. However, the proposed method showed much better results than the others. The DSOGI-PLL demonstrated the worst performance under the harmonic conditions among the methods compared.
To investigate the performance of the proposed method under harmonics and inter-harmonics condition, the following input signal was considered. The percentage of the harmonics and inter-harmonics are listed in Table 2.
The estimated frequency in the presence of the harmonics and inter-harmonics is shown in Figure 11 and Figure 12. Compared with the previous simulation results in Figure 9 and Figure 10, inter-harmonics certainly resulted in the adverse effect on all three of method. Even though the effect of inter-harmonics on the frequency estimation created some error, the proposed method successfully eliminated the estimation delay even under the inter-harmonic conditions. Therefore, the proposed method demonstrated the improved frequency estimation results as shown in Figure 11 and Figure 12. The DSOGI-PLL demonstrated the worst performance under the harmonic conditions.

3.2. Using the PSCAD/EMTDC-Generated Signals

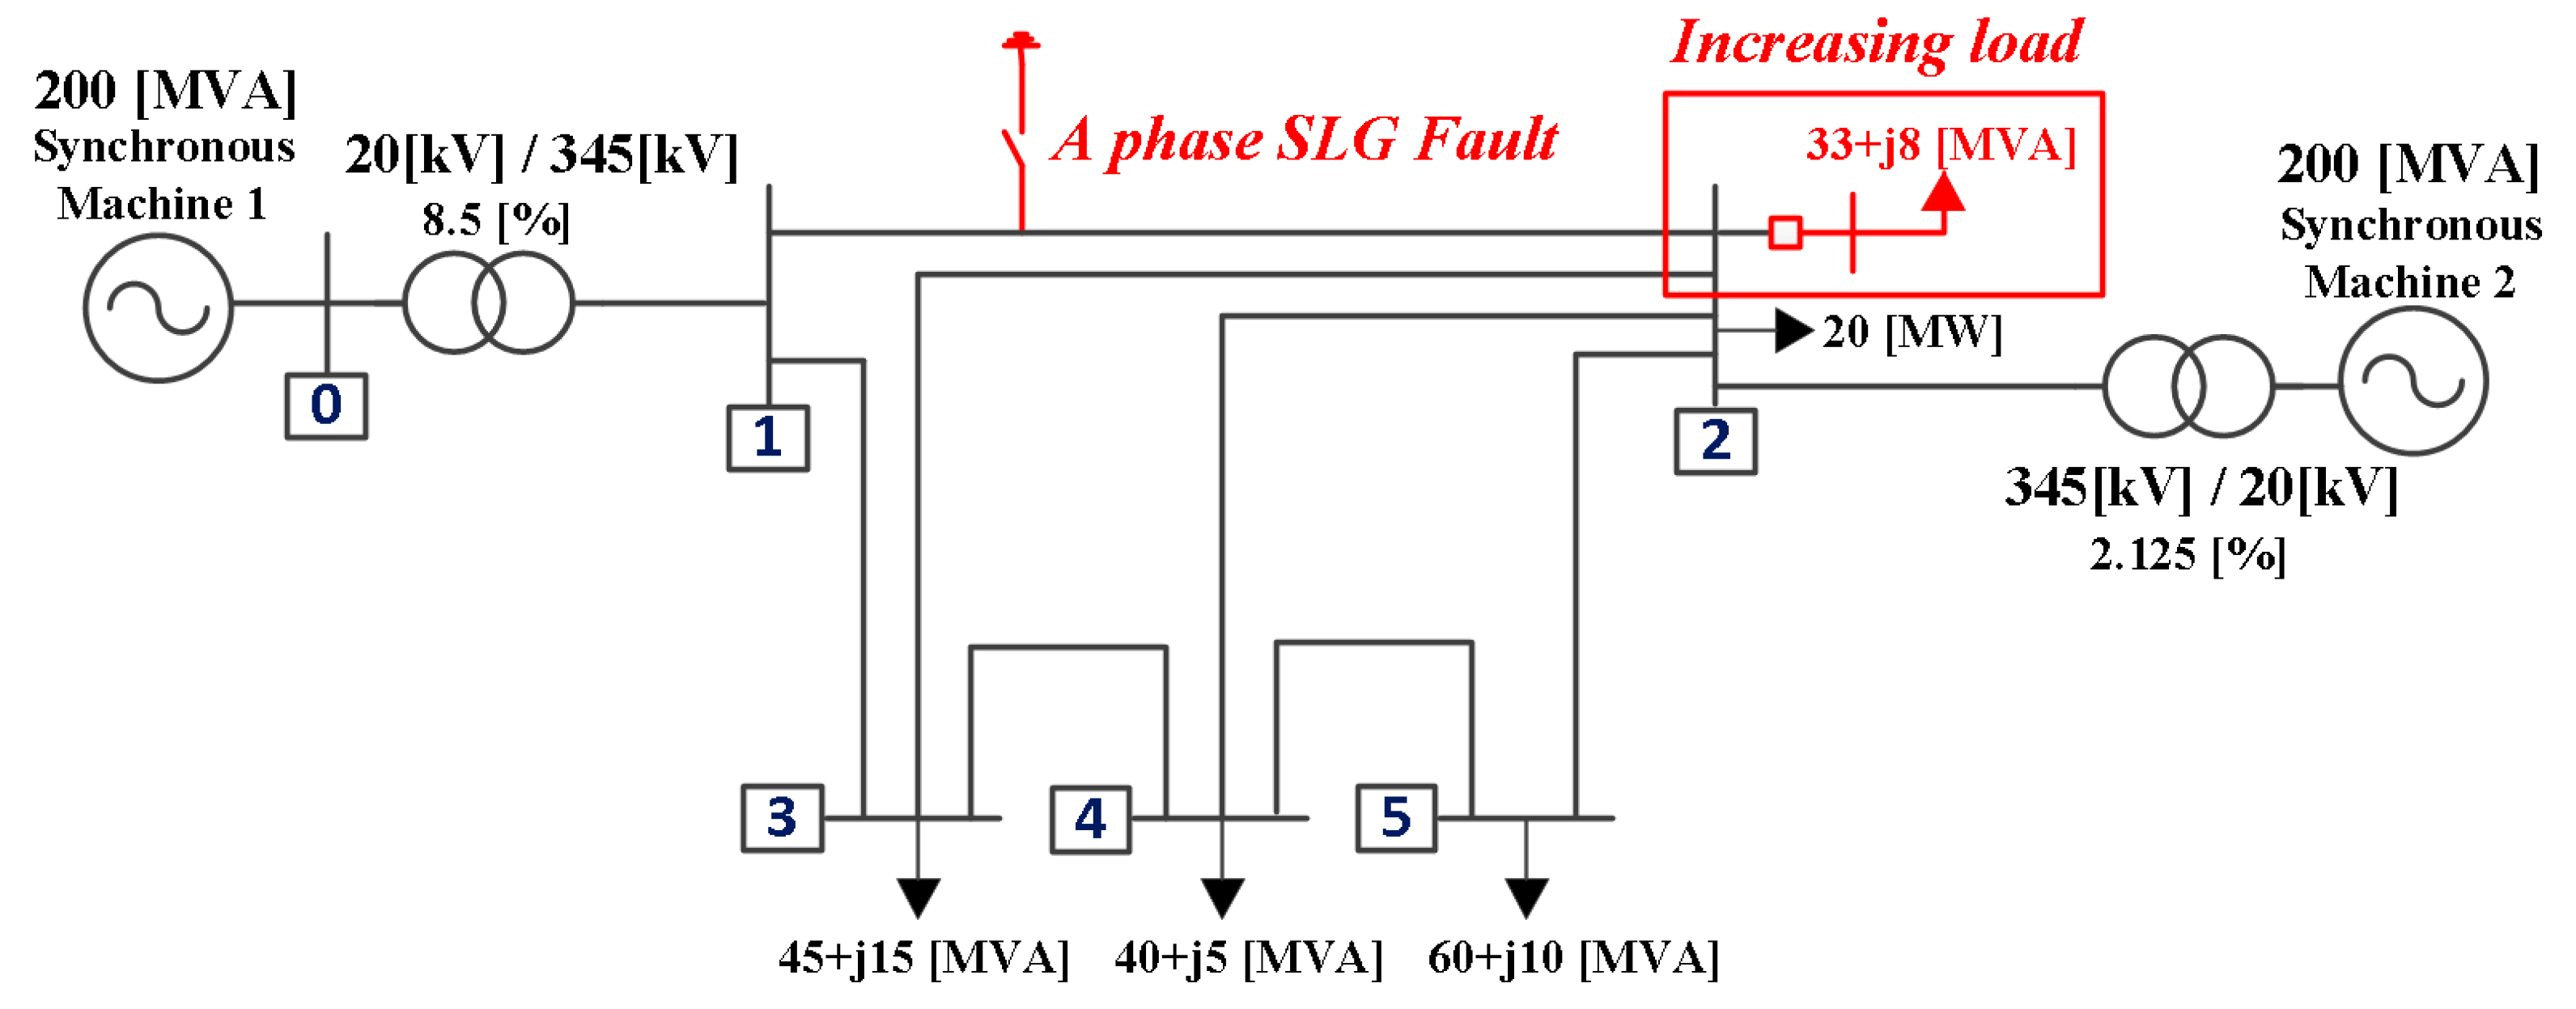
The performance of the proposed algorithm was also evaluated under several sets of conditions in a modified IEEE five-bus transmission system modeled by PSCAD/EMTDC as shown in Figure 13. The modified five-bus system modeled according to [26] was composed of two synchronous generators, and total electrical loads with a capacity and power factor of around 167.7 MVA and 0.984, respectively, were connected to the transmission system.
As mentioned previously, increasing the total load of the power system, which causes the dynamic condition, and a single line-to-ground fault were applied to create frequency deviation situations. In all cases, signals were acquired at 640 samples per cycle in a 60 Hz system and preprocessed by a second-order Butterworth low-pass filter with a gain of 0.1 at the stop-band cut-off frequency of 1920 Hz in order to get rid of aliasing errors. Afterwards, the filtered signals were used as the input signal of each algorithm after downsampling to 64 samples per cycle. Figure 14 shows the schematic diagram of down-sampling processing.

3.2.1. Dynamic Condition

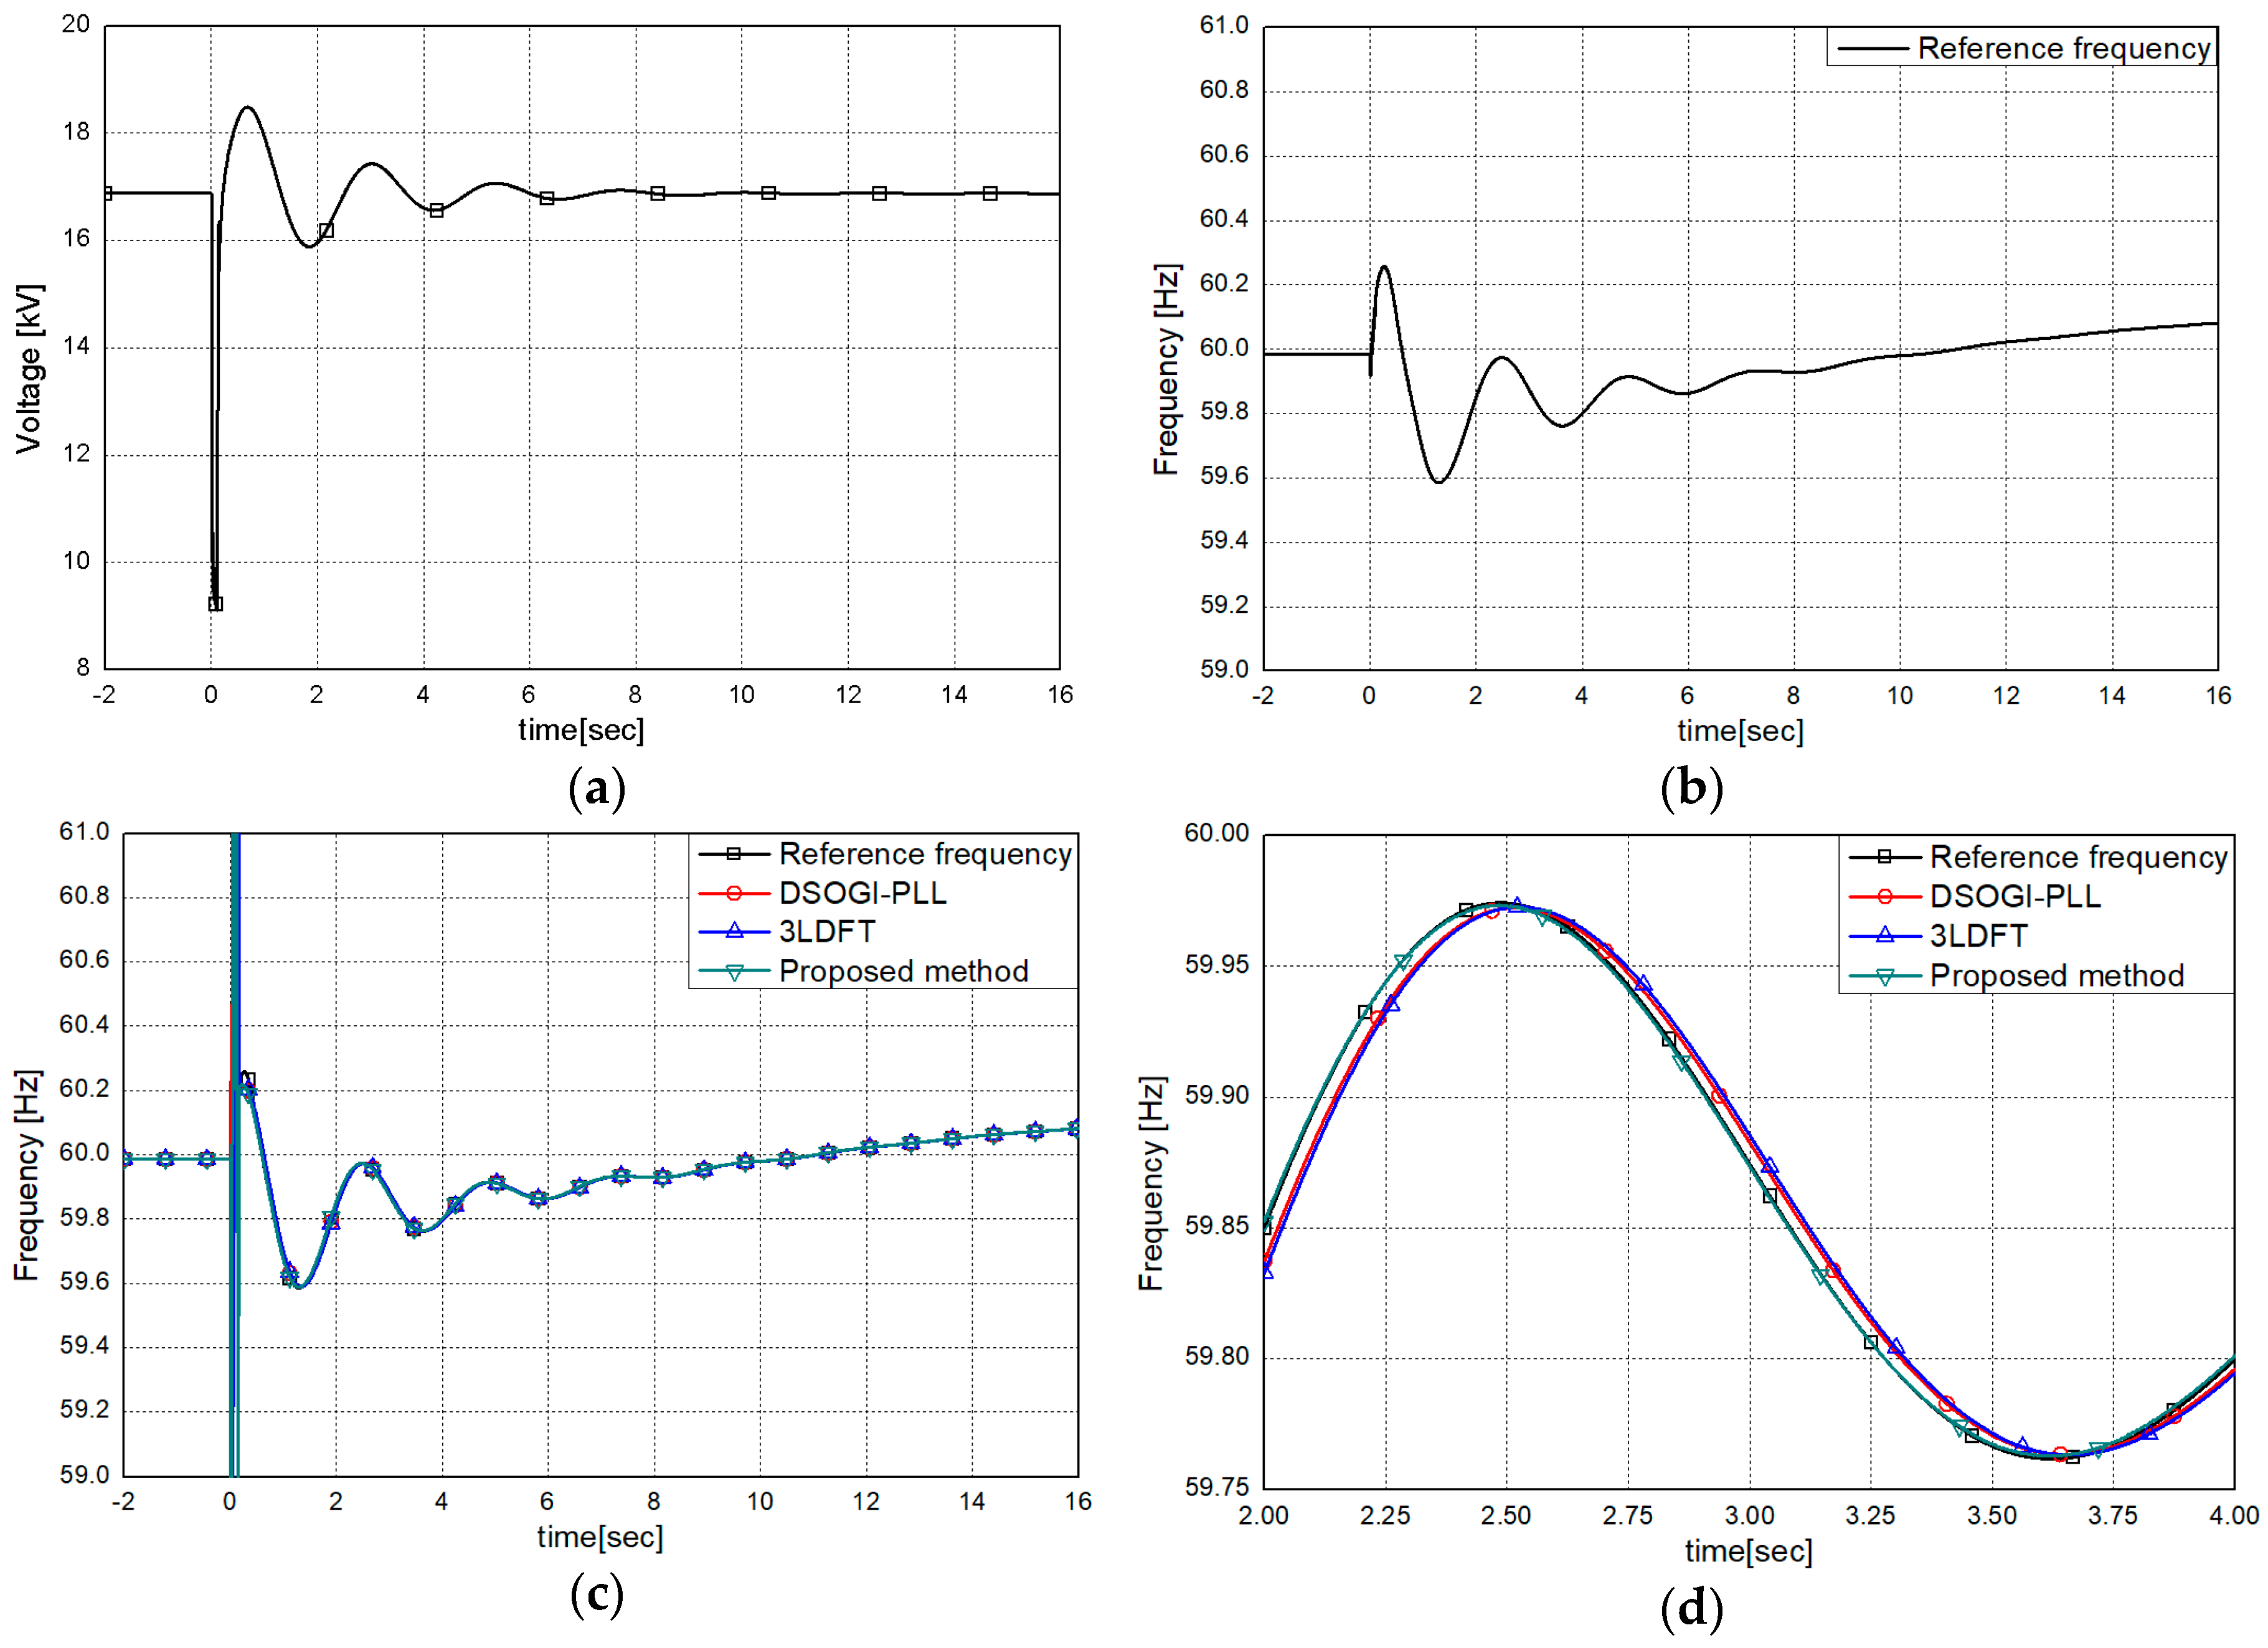
First, approximately 20% of the total load around 34 MVA was connected to the #2 bus to simulate dynamic conditions. As soon as the additional load was connected, the magnitude and frequency of the signal were changed concurrently, as shown in Figure 15. The envelope of the terminal voltage of #1 synchronous machine and the reference frequency of the input signal are shown in Figure 15a and Figure 16b, respectively.
The reference frequency corresponded to the rotor speed obtained from the PSCAD/EMTDC simulation [26]. Simulation results depicted in Figure 15c,d indicate that the proposed method was able to track the reference frequency much more accurately than the 3LDFT and DSOGI-PLL, although a spike up to 0.413 Hz occurred after the additional load was connected at 0 sec.

3.2.2. The Single Line-to-Ground Fault

Secondly, the single line-to-ground fault was simulated at 0 sec and cleared at 0.1 s, which means the fault lasted for 0.1 s. A fault inception angle of 90° was considered to create the maximum amount of noise. Figure 16a,b show the magnitude of the terminal voltage of the #1 synchronous machine and reference frequency, respectively, while Figure 16c,d show the respective results of each method using the PSCAD/EMTDC-generated signal. There was a large spike up after clearing the fault, as shown in Figure 16c. Apart from a period of transient errors, the proposed method estimated the frequency of the signal more closely than the 3LDFT and DSOGI-PLL, as shown in Figure 16d.

4. Conclusions

In this paper, a frequency estimation method based on revised 3LDFT with an estimation delay reduction technique was suggested. The revised 3LDFT, which uses hamming window as a smoothing technology, shows an outstanding ability to suppress the adverse influence of the harmonics and inter-harmonics. The frequency estimation method uses two orthogonal components obtained by the revised 3LDFT to estimate the frequency without the zero-crossing problem but induces an estimation delay caused by three cycles and three samples. To overcome this drawback, an estimation delay reduction technique was proposed. The estimation delay can be considerably eliminated by compensating the phase delay of the phasor, which is calculated by the phase response function of the phasor.
To evaluate the performance of the proposed method, computer-generated signals with harmonics and inter-harmonics were used. The results were compared to those of the previously reported DFT-based and PLL-based method. The results show that the proposed method was able to estimate the frequency accurately, even under harmonics and inter-harmonics polluted conditions. The PSCAD/EMTDC-generated signals were also used to test the performance under the disturbance, including the load increasing and the single line-to-ground fault. As for the results of comparing the proposed method with the previously reported DFT-based and PLL-based method, it can be seen that the proposed method is much more effective for estimating the frequency accurately.

Author Contributions

Conceptualization, W.-S.S. and S.-H.K.; methodology, W.-S.S., S.-H.K. and S.-R.N.; software, W.-S.S. and S.-R.N.; validation, W.-S.S., S.-H.K. and S.-R.N.; formal analysis, W.-S.S. and S.-H.K.; investigation, W.-S.S. and S.-H.K.; writing—original draft preparation, W.-S.S.; writing—review and editing, W.-S.S., S.-H.K. and S.-R.N.; visualization, W.-S.S.; supervision, S.-H.K.; funding acquisition, S.-H.K. All authors have read and agreed to the published version of the manuscript.

Funding

This research was supported by Korea Electric Power Corporation. (Grant number: R17XA05-2). This work was also supported by “Human Resources Program in Energy Technology” of the Korea Institute of Energy Technology Evaluation and Planning (KETEP), granted financial resource from the Ministry of Trade, Industry & Energy, Republic of Korea. (No. 20174030201790).

Conflicts of Interest

The authors declare no conflict of interest.

References

  1. Reza, A.; Kutluyıl, D.; Stefan, W. Recursive Total Least-Square Estimation of Frequency in Three-Phase Power Systems. In Proceedings of the 22nd European Signal Processing Conference, Lisbon, Portugal, 1–5 September 2014. [Google Scholar]
  2. Thomas, D.W.P.; Woolfson, M.S. Evaluation of Frequency Tracking Methods. IEEE Trans. Power Deliv. 2001, 16, 367–371. [Google Scholar] [CrossRef]
  3. Aghazadeh, R.; Lesani, H.; Pasand, S.M.; Ganji, B. New Technique for Frequency and Amplitude Estimation of Power System Signals. IEE Proc. Gener. Transm. Distrib. 2005, 152, 435–440. [Google Scholar] [CrossRef]
  4. Djuric, M.B.; Djurisic, Z.R. Frequency Measurement of Distorted Signals Using Fourier and Zero Crossing Techniques. Electr. Power Syst. Res. 2008, 78, 1407–1415. [Google Scholar] [CrossRef]
  5. Zheng, L.; Geng, H.; Yang, G. Fast and robust phase estimation algorithm for heavily distorted grid conditions. IEEE Trans. Ind. Electron. 2016, 63, 6845–6855. [Google Scholar] [CrossRef]
  6. Kaura, V.; Blasko, V. Operation of a Phase Locked Loop System under Distorted Utility Conditions. IEEE Trans. Ind. Appl. 1997, 33, 58–63. [Google Scholar] [CrossRef]
  7. Chung, S.K. A Phase Tracking System for Three Phase Utility Interface Inverters. IEEE Trans. Power Electron. 2000, 15, 431–438. [Google Scholar] [CrossRef] [Green Version]
  8. Rodríguez, P.; Luna, A.; Muñoz-Aguilar, R.S.; Etxeberria-Otadui, I.; Teodorescu, R.; Blaabjerg, F. A Stationary Reference Frame Grid Synchronization System for Three-Phase Grid-Connected Power Converters under Adverse Grid Conditions. IEEE Trans. Power Electron. 2012, 27, 99–112. [Google Scholar] [CrossRef]
  9. Ahmed, H.; Amamra, S.; Salgado, I. Fast Estimation of Phase and Frequency for Single-Phase Grid Signal. IEEE Trans. Ind. Electron. 2019, 66, 6408–6411. [Google Scholar] [CrossRef]
  10. Terzija, V.; Cai, D.; Stanojevic, V.; Strbac, G. Frequency and Power Components Estimation from Instantaneous Power Signal. IEEE Trans. Instrum. Meas. 2011, 60, 3640–3649. [Google Scholar] [CrossRef]
  11. Kusljevic, M.D. A Simple Recursive Algorithm for Simultaneous Magnitude and Frequency Estimation. IEEE Trans. Instrum. Meas. 2008, 57, 1207–1214. [Google Scholar] [CrossRef]
  12. Routray, A.; Pradhan, A.K.; Rao, K.P. A Novel Kalman Filter for Frequency Estimation of Distorted Signals in Power Systems. IEEE Trans. Instrum. Meas. 2002, 51, 469–479. [Google Scholar] [CrossRef]
  13. Dash, P.K.; Pardhan, A.K.; Panda, G. Frequency Estimation of Distorted Power System Signals Using Extended Complex Kalman Filter. IEEE Trans. Power Deliv. 1999, 14, 761–766. [Google Scholar] [CrossRef] [Green Version]
  14. Giray, M.M.; Sachdev, M.S. Off-Nominal Frequency Measurement in Electric Power Systems. IEEE Trans. Power Deliv. 1989, 4, 1573–1578. [Google Scholar] [CrossRef]
  15. Chudamani, R.; Vasudevan, K.; Ramalingam, C.S. Real-Time Estimation of Power System Frequency Using Nonlinear Least Squares. IEEE Trans. Power Deliv. 2009, 24, 1021–1028. [Google Scholar] [CrossRef]
  16. Rao, A.V.K.; Soni, K.M.; Sinha, S.K.; Nasiruddin, I. Accurate phasor and frequency estimation during power system oscillations using least squares. IET Sci. Meas. Technol. 2019, 13, 989–994. [Google Scholar]
  17. Dash, P.K.; Swain, D.P.; Routray, A.; Liew, A.C. An Adaptive Neural Network Approach for the Estimation of Power System Frequency. Electr. Power Syst. Res. 1997, 41, 203–210. [Google Scholar] [CrossRef]
  18. Lai, L.L.; Chan, W.L.; Tse, C.T.; So, A.T.P. Real-Time Frequency and Harmonic Evaluation Using Artificial Neural Networks. IEEE Trans. Power Deliv. 1999, 14, 52–59. [Google Scholar] [CrossRef]
  19. Lobos, T.; Rezmer, J. Real-Time Determination of Power System Frequency. IEEE Trans. Instrum. Meas. 1997, 46, 877–881. [Google Scholar] [CrossRef] [Green Version]
  20. Nam, S.R.; Lee, D.G.; Kang, S.H.; Ahn, S.J.; Choi, J.H. Fundamental Frequency Estimation in Power Systems Using Complex Prony Analysis. J. Electr. Eng. Technol. 2011, 6, 154–160. [Google Scholar] [CrossRef] [Green Version]
  21. Vladimir, V.T.; Milenko, B.D.; Branko, D.K. Voltage Phasor and Local System Frequency Estimation Using Newton Type Algorithm. IEEE Trans. Power Deliv. 1994, 9, 1368–1374. [Google Scholar]
  22. Vladimir, V.T.; Dragan, M. Symmetrical Components Estimation through Nonrecursive Newton-Type Numerical Algorithm. IEEE Trans. Power Deliv. 2003, 18, 359–363. [Google Scholar]
  23. Moore, P.J.; Carranza, R.D.; Johns, A.T. A New Numeric Technique for High-Speed Evaluation of Power System Frequency. IEE Proc. Gener. Transm. Distrib. 1994, 141, 529–536. [Google Scholar] [CrossRef]
  24. Frigo, G.; Derviškadić, A.; Paolone, M. Reduced Leakage Synchrophasor Estimation: Hilbert Transform Plus Interpolated DFT. IEEE Trans. Instrum. Meas. 2019, 68, 3468–3483. [Google Scholar] [CrossRef] [Green Version]
  25. Park, S.Y.; Song, Y.S.; Kim, J.H.; Park, J.S. Improved Method for Frequency Estimation of Sampled Sinusoidal Signals without Iteration. IEEE Trans. Instrum. Meas. 2011, 60, 2828–2834. [Google Scholar] [CrossRef]
  26. Nam, S.R.; Kang, S.H.; Kang, S.H. Real-Time Estimation of Power System Frequency Using a Three-Level Discrete Fourier Transform Method. Energies 2015, 8, 79–93. [Google Scholar] [CrossRef]
  27. Seo, W.S.; Kang, S.H.; Nam, S.R. Non-recursive Discrete Fourier Transform-Based Frequency Estimation of the Power System. J. Electr. Eng. Technol. 2019, 14, 1505–1515. [Google Scholar] [CrossRef]
  28. IEEE Standard for Synchrophasor Measurements for Power Systems. IEEE Standard C.37.118.1a-2014; IEEE Standard for Synchrophasor Measurements for Power Systems: Piscataway, NJ, USA, 2014. [Google Scholar]
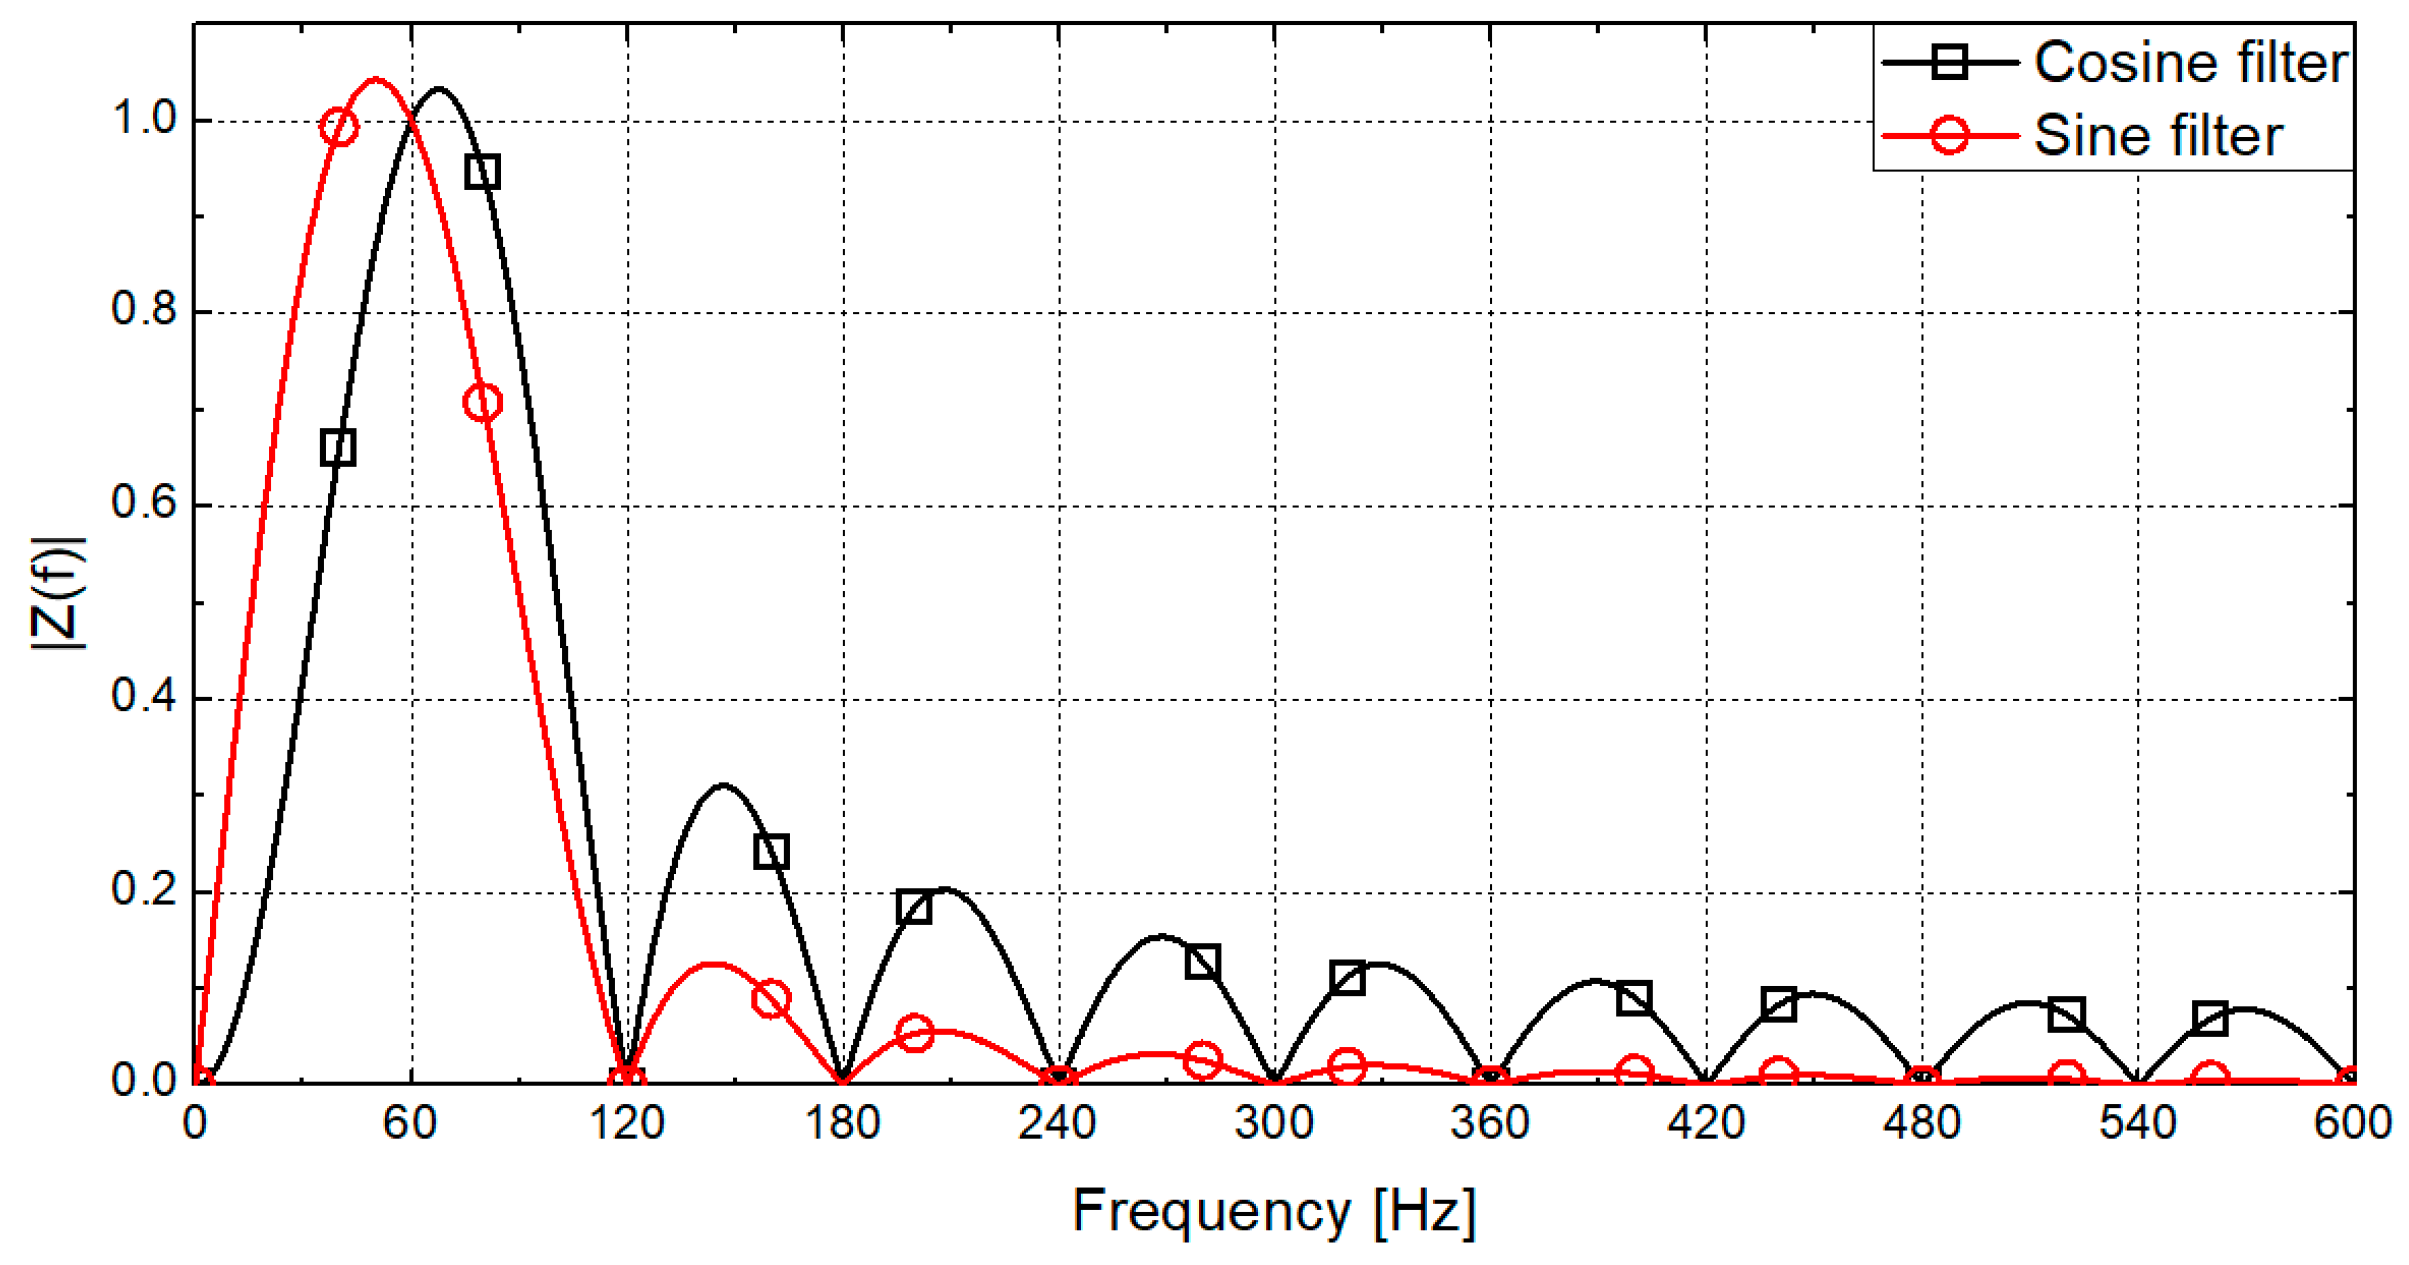
Figure 1. Magnitude of the responses of the cosine and sine filters.
Energies 13 02256 g001
Figure 2. Schematic diagram of the filtering procedure.
Energies 13 02256 g002
Figure 3. The revised 3LDFT with the amplitude and phase relationships of the output signals.
Energies 13 02256 g003
Figure 4. Phase difference between the ideal and delayed phasors.
Energies 13 02256 g004
Figure 5. Flowchart of the proposed frequency estimation method.
Energies 13 02256 g005
Figure 6. Estimation results in the case of the positive ramp frequency variation: (a) the estimated frequency, (b) the frequency estimation error, and (c) magnification of Figure 6a.
Energies 13 02256 g006
Figure 7. Estimation results in the case of the negative frequency variation: (a) the estimated frequency, (b) the frequency estimation error, and (c) magnification of Figure 7a.
Energies 13 02256 g007
Figure 8. Estimation results in the case of the sinusoidal frequency variation: (a) the estimated frequency, (b) the frequency estimation error, and (c) magnification of Figure 8a.
Energies 13 02256 g008
Figure 9. Estimation results in the case of the positive ramp frequency variation with harmonics: (a) the estimated frequency, (b) magnification of Figure 9a.
Energies 13 02256 g009
Figure 10. Estimation results in the case of the negative ramp frequency variation with harmonics: (a) the estimated frequency, (b) magnification of Figure 10a.
Energies 13 02256 g010
Figure 11. Estimation results in the case of negative ramp frequency variation with harmonics and inter-harmonics: (a) the estimated frequency, (b) magnification of Figure 11a.
Energies 13 02256 g011
Figure 12. Estimation results in the case of sinusoidal frequency variation with harmonics and inter-harmonics: (a) the estimated frequency, (b) magnification of Figure 12a.
Energies 13 02256 g012
Figure 13. Modified IEEE five-bus transmission system.
Energies 13 02256 g013
Figure 14. Schematic diagram of down-sampling processing.
Energies 13 02256 g014
Figure 15. Estimation results in the case of a load increase of 20%: (a) the envelope of the terminal voltage of #1 synchronous machine, (b) the reference frequency, (c) the estimated frequency, and (d) magnification of the squared region in (c).
Energies 13 02256 g015
Figure 16. Estimation results in the case of a single line-to-ground fault at an inception angle of 90 ° : (a) the envelope of the terminal voltage of #1 synchronous machine; (b) the reference frequency; (c) the estimated frequency; and (d) magnification of the squared region in (c).
Energies 13 02256 g016
Table 1. Percentage of harmonics included in the input signal.
Harmonics order13579
Percentage10020201010
Table 2. Percentage of harmonics and inter-harmonics included in the input signal.
Harmonics order133.44.4579
Percentage100201010201010