Article

Determination of Various Parameters during Thermal and Biological Pretreatment of Waste Materials

Faculty of Chemistry and Chemical Engineering, University of Maribor, Smetanova ulica 17, SI-2000 Maribor, Slovenia
*
Author to whom correspondence should be addressed.
Energies 2020, 13(9), 2262; https://doi.org/10.3390/en13092262
Submission received: 3 April 2020 / Revised: 29 April 2020 / Accepted: 1 May 2020 / Published: 4 May 2020

Abstract

:
Pretreatment of waste materials could help in more efficient waste management. Various pretreatment methods exist, each one having its own advantages and disadvantages. Moreover, a certain pretreatment technique might be efficient and economical for one feedstock while not for another. Thus, it is important to analyze how parameters change during pretreatment. In this study, two different pretreatment techniques were applied: thermal at lower and higher temperatures (38.6 °C and 80 °C) and biological, using cattle rumen fluid at ruminal temperature (≈38.6 °C). Two different feedstock materials were chosen: sewage sludge and riverbank grass (Typha latifolia), and their combinations (in a ratio of 1:1) were also analyzed. Various parameters were analyzed in the liquid phase before and after pretreatment, and in the gas phase after pretreatment. In the liquid phase, some of the parameters that are relevant to water quality were measured, while in the gas phase composition of biogas was measured. The results showed that most of the parameters significantly changed during pretreatments and that lower temperature thermal and/or biological treatment of grass and sludge is suggested for further applications.

Graphical Abstract

1. Introduction

Depletion of the world’s natural resources and an increase in the environmental footprint [1] has stimulated the increased utilization of renewable energy sources, resource efficiency, better waste management, circular economy and sustainability. Among the solutions is greater utilization of waste materials, which could partially address the challenges of resource depletion and ecosystem health. Waste materials are widely available and often mismanaged [2]. Developed and developing countries produce large amounts of waste per capita, with a significant increase in recent decades, owing to a higher level of consumption [3]. Waste management continues to improve in several countries; however, significant amounts of potential secondary raw materials are lost, such as metals, wood, paper and other waste streams [4]. Waste could also be a potential source of several value-added products, such as enzymes, fuels, fertilizers, pesticides, polymers, and plastics [5].
The use of several waste types is limited, despite their vast availability. Waste materials such as sewage sludge and organic waste contain significant amounts of elements such as carbon, nitrogen, phosphorus that could be efficiently used by thermal or biological processes [6]. The EU’s Landfill Directive [7] requires that waste should be pretreated by physical, thermal, chemical or biological processes to reduce its negative impact on the environment and to help increase the scope of waste recycling and recovery. However, there are several limitations to their use, such as their complex structure, the non-homogeneity of waste and the presence of hazardous waste. On the other hand, advances in microbiology, biotechnology and genetic engineering are leading to new concepts for converting these materials into valuable products [8].
Several solid waste products and waste from municipal sources have higher shares of lignocelluloses [9]. Such examples are agricultural residues, forest woody residues, industrial waste, microalgae and municipal solid waste [10]. Lignocellulosic materials are also widely abundant renewable materials, and are composed mainly of cellulose, hemicellulose, and lignin [11]. Pretreatment of waste materials facilitates further hydrolysis and fermentation [11] for the production of fuels, chemicals and other materials [12]. Pretreatment can partially remove lignin and hemicellulose, and often also cellulose (such as by cellulose-degrading enzymes [13], rumen fluid [14], white rot fungi [15], etc.). Ideally, pretreatment should be simple, with a low environmental footprint [16] and should be economically efficient [17], while it should produce pretreated substrate that is easily hydrolyzed/fermented, and should avoid the loss of the desirable fraction of the material and the formation of inhibitory compounds [18].
Pretreatment of waste materials could help in reducing the amount of waste, in stabilizing waste, overcoming the recalcitrance of lignocellulosic waste, and in more efficient utilization of waste materials as fuels and/or chemicals. Various pretreatment methods exist, which can be classified into chemical, physical, physico-chemical, biological and combined or multiple pretreatment methods. However, each pretreatment method acts differently on lignocellulosic structures [12]. Each method has only limited applications, as no pretreatment technique suits all types of waste material. Commonly used pretreatment techniques still do not meet sustainable industrial production requirements despite being studied for a number of years [17]. A combination of more than one pretreatment technique and/or novel techniques has the potential to significantly improve the efficiency of the process [17]. In order to better understand and improve specific pretreatment process(es), it is important to analyze the changes in the properties of waste materials during pretreatment [19].
The literature review has shown that there has been limited research on analyzing changes in the various parameters during pretreatment that are typical in related fields, such as wastewater characterization, anaerobic digestion and composting. Further, to the best of the authors knowledge, no studies have been performed on pretreatment of sewage sludge, grass and rumen fluid. The aim of this work was to examine the change of parameters during thermal pretreatment of sewage sludge and grass Typha latifolia and to investigate the impact of cattle rumen fluid (microbial consortium) presence on pretreatment.
In this work, various parameters have been measured during thermal and biological pretreatment of two waste materials, sewage sludge and riverbank grass (Typha latifolia), and their combination (1:1 ratio on a dry basis). Thermal pretreatment was studied at both an elevated temperature of 80 °C, which lasted for 5 days, and at milder conditions of 38.6 °C, which lasted for 8 days. Biological pretreatment was also studied at 38.6 °C by adding an enzyme mixture (cattle rumen fluid) to the waste materials. An analysis of various parameters in the liquid phase was conducted before and after pretreatment and in the gas phase after pretreatment. In the liquid phase, the following parameters were measured: nitrogen, phosphorus and potassium (NPK) content, total organic carbon (TOC), chemical oxygen demand (COD), pH and conductivity, and in the gas phase concentrations of CH4, CO2 and H2S were measured.

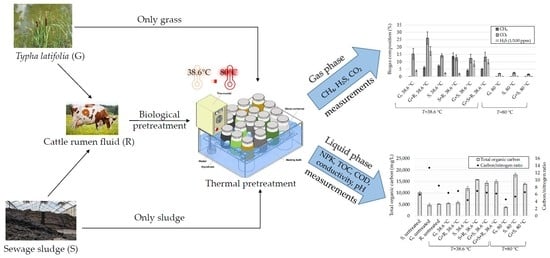
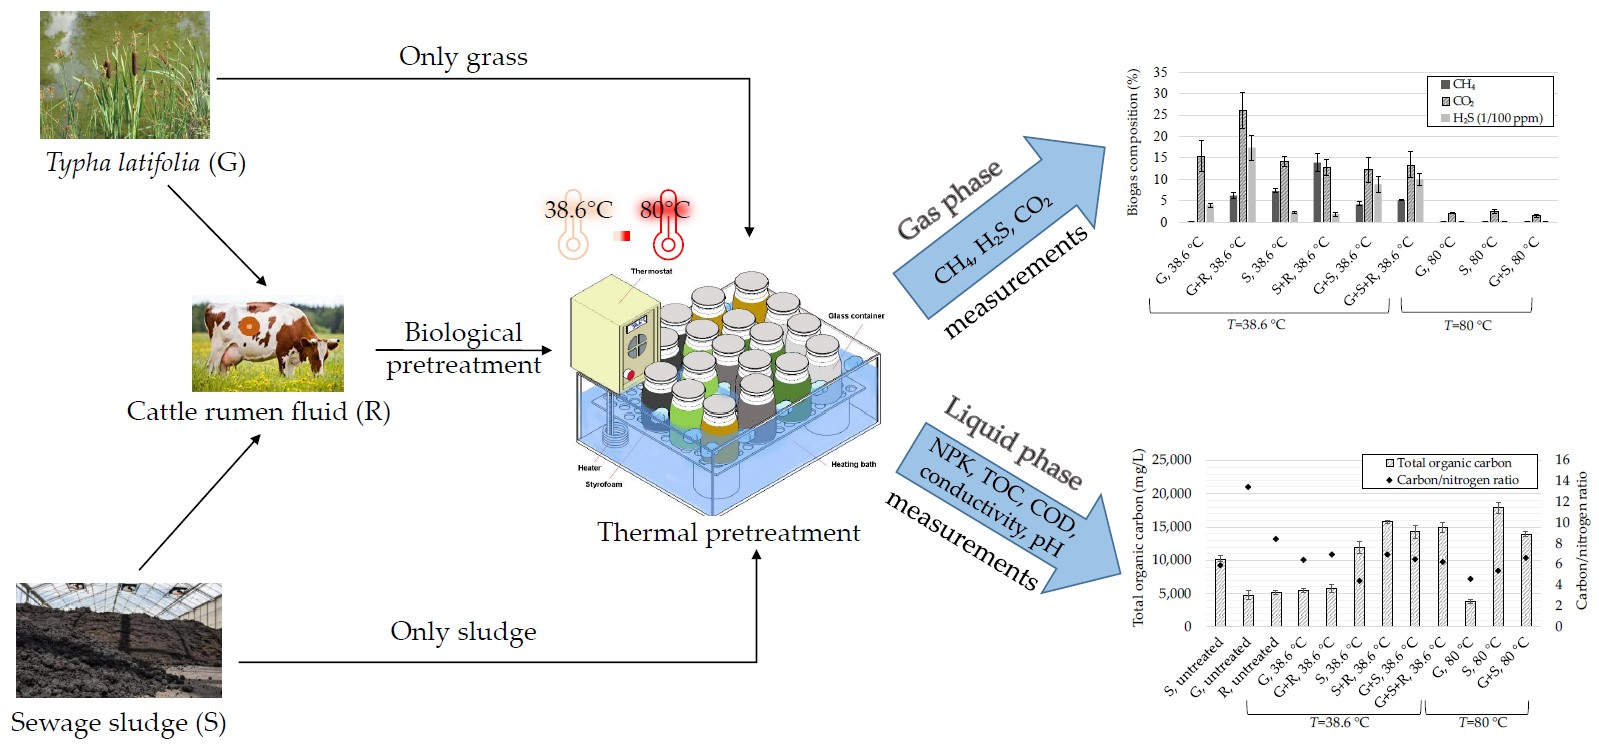
2. Materials and Methods

In this section, applied materials and methods are described. First, collection of samples, their preparation for analysis and characterization are described, and then the experimental setup is presented, where two experiments were conducted under various conditions. The chemical analyses performed to determine various parameters during pretreatment are then described.

2.1. Feedstock Preparation and Characterization

The following feedstock materials were used in the experiments: riverbank grass Typha latifolia (G), sewage sludge (S) and rumen fluid (R). Sewage sludge was taken from a local municipal wastewater treatment plant (latitude and longitude coordinates of 46°24′29.3″ N and 15°52′51.0″ E) employing a tertiary biological treatment of wastewater in sequential basins with the capacity of 68,000 population equivalents (PE) and a maximal inflow of 350 L/s wastewater. The Typha latifolia grass (cattail) was gathered near the Dravinja riverbank near city Ptuj, Slovenia (coordinates of 46°21′01.5″ N and 15°49′48.8″ E). The Typha latifolia grass was chopped into pieces smaller than 1 · 0.5 cm before being used in experiments. Rumen fluid was acquired from a nearby slaughterhouse. Before it was used in experiments, it was filtered through fabric in order to remove larger particles. All feedstock materials were gathered in the middle of May 2019.
For the characterization of feedstock materials, the following analytical methods were used: SIST EN 16168:2013 for determining total nitrogen content using dry combustion [20], SIST EN ISO 11885:2009 by the inductively coupled plasma optical emission spectrometry (ICP-OES) analyzer for the total phosphorus content [21], SIST EN 13137:2002 for total organic carbon content based on catalytic oxidation combustion technique [22] and SIST EN 14346:2007 for the dry matter content [23]. The content of heavy metals was determined by the ICP-OES analyzer according to the EN 16170:2016 method [24]. For the determination of total dry solids content (TS), substrates were dried in a laboratory drying chamber (ED 115, producer Binder) at 105 °C until constant weight.

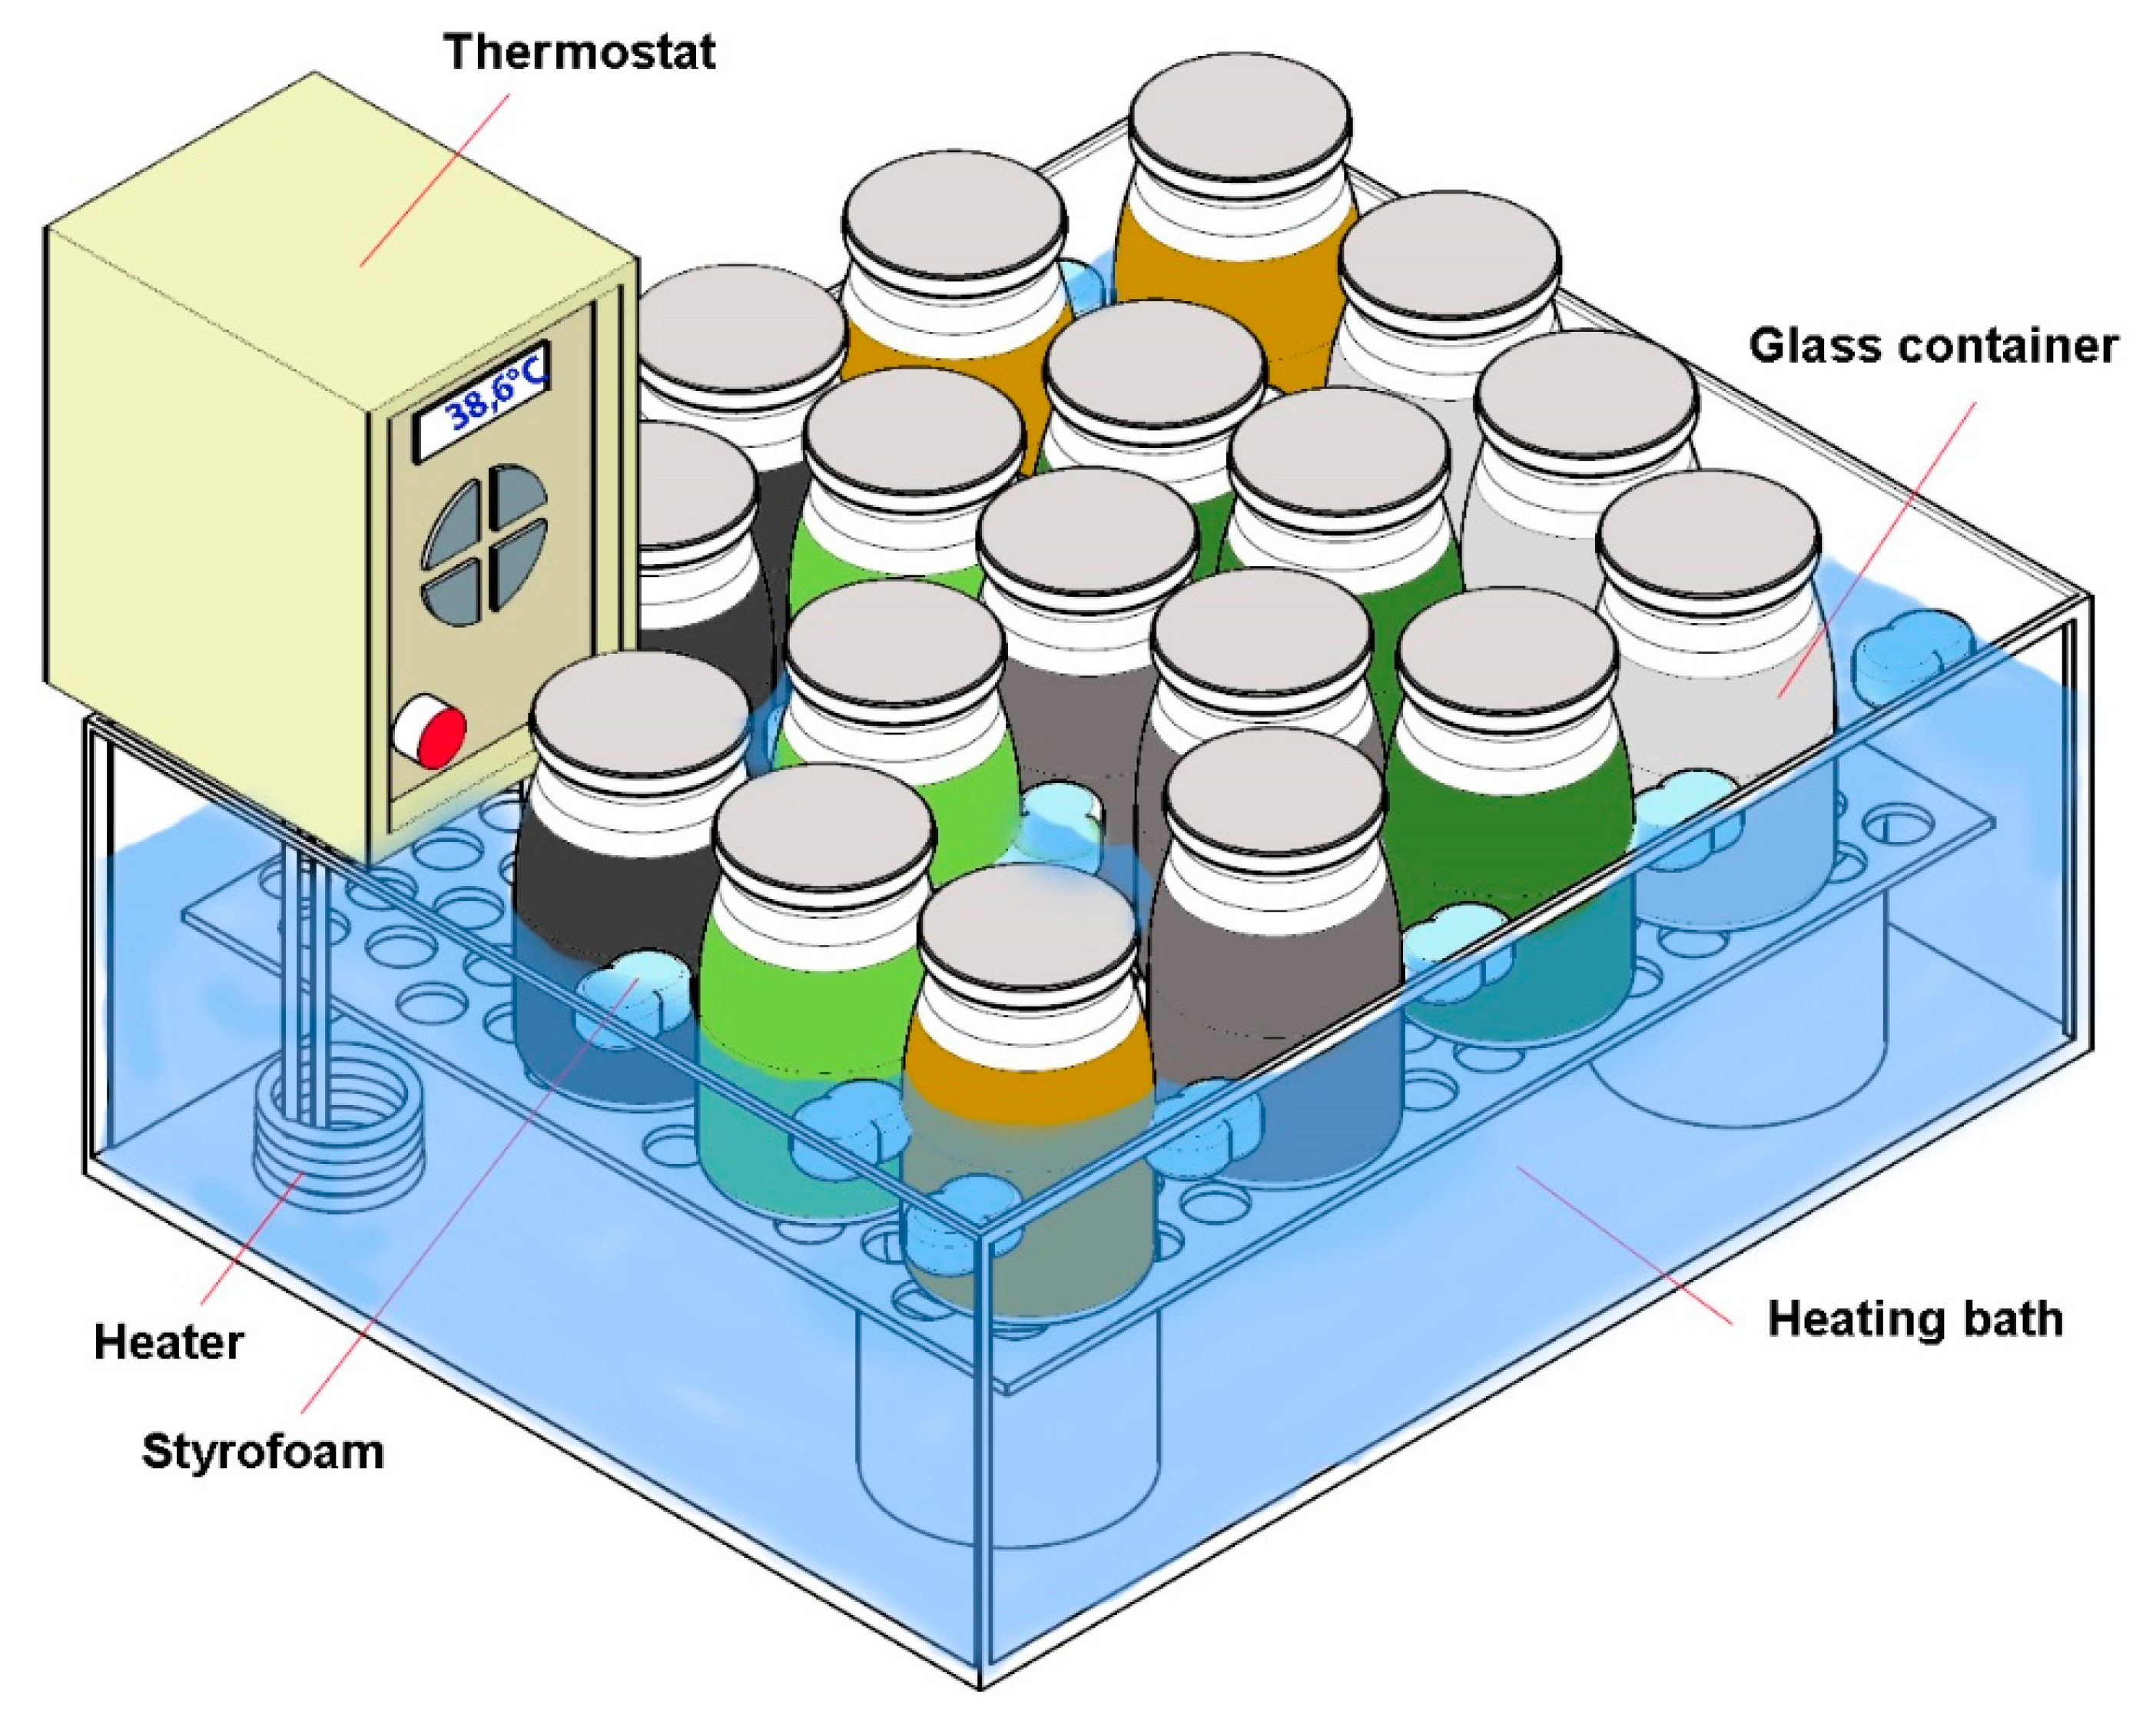
2.2. Experimental Setup

Two pretreatment methods were tested on selected waste: biological pretreatment with the addition of an enzyme mixture (i.e., cattle rumen fluid) and lower and higher temperature thermal pretreatment (at 38.6 and 80 °C). For biological pretreatment, the temperature was set at a ruminal temperature of about 38.6 °C [25]. The temperature of 38.6 °C was chosen, since it is within the mesophilic temperature range that is optimal for microorganisms’ growth and metabolism, and it is an optimal temperature for microorganisms present in the rumen fluid.
For lower temperature thermal pretreatment (mesophilic temperature range, 38.6 °C) and biological pretreatment with rumen fluid, batch assays were maintained by using a Thermo Scientific™ SC100 immersion circulator in a heated bath filled with deionized water. Samples placed in 1 L glass containers were exposed to pretreatment conditions for 8 days. Assays in containers were hand-mixed two to three times during pretreatments. If necessary, to reduce the pressure in containers, the gases were released to the atmosphere and containers were closed shortly afterwards. Figure 1 shows schematic representation of the experimental set-up for lower temperature thermal and biological pretreatment.
Higher temperature thermal pretreatment at 80 °C was performed in a laboratory drying chamber (ED 115, Binder), where the pretreatment time was 5 days.
All samples were prepared in triplicate, containing 6 wt.% of solids based on average dry matter (DM) content. The samples were prepared on a 500 g wet basis (30 g dry basis) and are shown in Table 1. Reaction mixture G contains only grass substrate, while reaction mixture S contains only sludge (both were diluted by distilled water to 6 wt.%). Other samples represent mixtures of the chosen substrates. For example, sample G + S was a mixture of grass and sewage sludge in a ratio of 1:1. For biological pretreatment, in addition to 500 g of material (G, S and G+S) 50 mL of rumen fluid was added. The addition of rumen fluid in reaction mixtures is denoted as R.

2.3. Chemical Analyses

Before and after pretreatment studies, various parameters were measured in the liquid phase of the samples. Chemical oxygen demand (COD), total organic carbon (TOC), and the amounts of nitrogen, phosphorus and potassium (NPK) content were analyzed by cuvette tests. The following NANOCOLOR® (Macherey-Nagel) cuvette tests were used: CSB 160 and 1500, TOC 300, TNb220, ortho-Phosphate 15 and Potassium 50. Digestion of samples was performed with a NANOCOLOR® VARIO C2 (Macherey-Nagel) heating block. Analyses of COD, TOC and NPK in filtered samples were determined photometrically using a compact photometer PF-12Plus (Macherey-Nagel). The conductivity and pH were measured by using wireless pH and conductivity sensors (Pasco), which were connected through a tablet computer and recorded via the SPARKvue app.
Untreated samples were analyzed on the first day of the experiments (day zero) and are denoted in the next section as “untreated”. Samples from lower temperature thermal pretreatment at 38.6 °C and biological pretreatment (at the same temperature) were analyzed on the 8th day of the experiments, while samples from higher temperature thermal pretreatment at 80 °C were analyzed on the 5th day. The concentration of gases (CH4, CO2 and H2S) formed during pretreatment in the gas phase was monitored by an Optima 7 Biogas analyzer. Measurements in the gas phase were performed on the last day of each experiment (on the 5th or 8th day of the experiments).
The results of chemical analyses for treated and untreated samples were statistically tested (in Excel) for significant differences using the t-test (90% confidence level, two tailed, homoscedastic type). The deviations of the results between parallel samples were expressed with standard deviation and error bars (error bar represents one standard deviation).

3. Results and Discussion

In this section, results and discussion regarding the characterization of feedstock materials and pretreatment analysis are presented. First, results for the liquid phase are shown in Section 3.2.1, Section 3.2.2, Section 3.2.3 and Section 3.2.4 (NPK, TOC, C/N ratio, COD, pH and conductivity) and results for the gas phase are presented in Section 3.2.5 (concentrations of CH4, CO2 and H2S).

3.1. Feedstock Characterization Results

The basic characteristics of sewage sludge, Typha latifolia grass and cattle rumen fluid, such as total dry solids content (TS), water content, total nitrogen (TN) content, total phosphorus (TP) content and total carbon (TC) content are gathered in Table 2. Sewage sludge contained 18.6% of dry solids, grass 7.4% and rumen fluid 2.3%. The content of heavy metals and the content of TN were higher in sewage sludge samples than in the grass samples. As expected, grass contained high amounts of potassium (K), but did not contain much phosphorus (TP). Among heavy metals, the concentration of Zn ions stands out from the results for sewage sludge. Other values were in the range typical of sewage sludge [26] and grass samples [27].

3.2. Results of the Pretreatment Tests

In this section the results for the liquid phase are first given (they are shown before and after pretreatment), and subsequently the results for the gas phase are presented (shown after pretreatment).

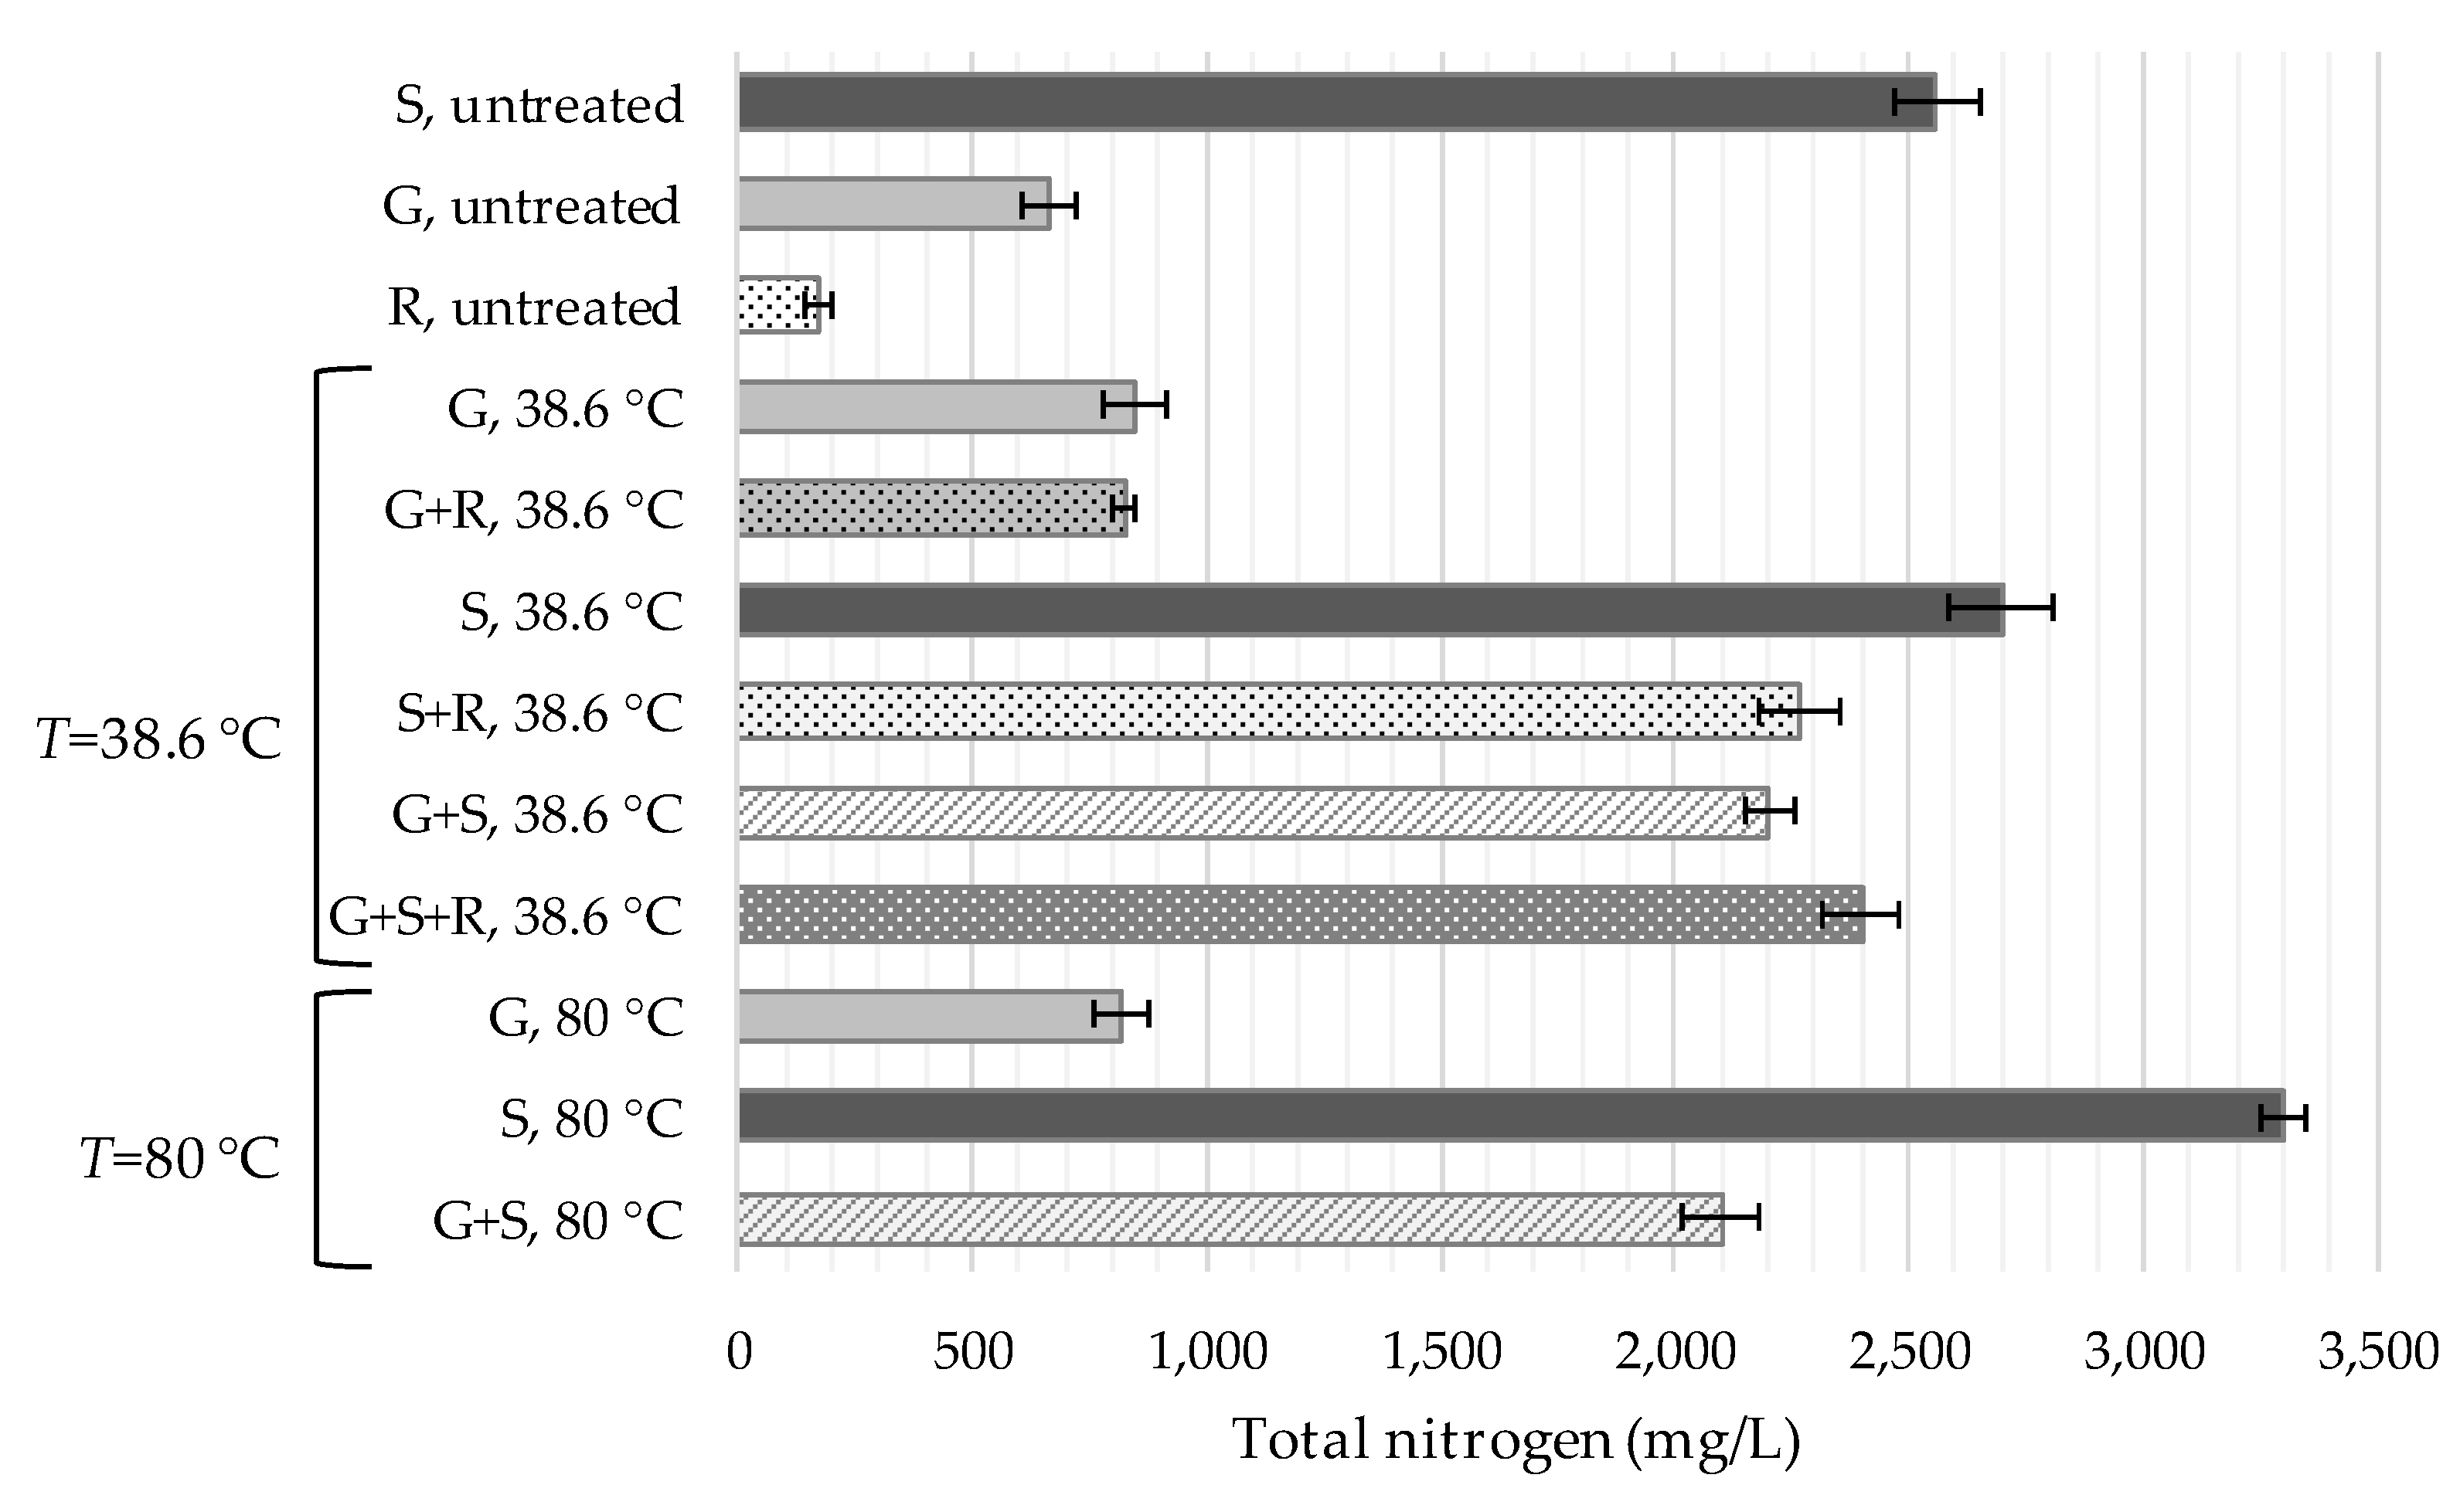
3.2.1. Results of N, P and K Analysis

Concentrations of nitrogen, potassium and phosphorus (NPK) in the samples are expressed in the form of N, P2O5 and K2O, since NPK values in the organic substrates are often expressed in that way [28]. Table 3 shows the results for P2O5 and K2O content, and Figure 2 shows the content of TN.
Results in Table 3 show that the lowest concentrations of K2O and P2O5 values were generally obtained in untreated samples (samples G or S). After lower temperature thermal pretreatment at 38.6 °C, concentrations of K2O and P2O5 in all samples increased as compared to untreated samples (Table 3). The highest values of K2O were obtained in the mixture of grass and sludge (sample G + S), while the highest P2O5 value occurred in the sludge sample (S). It is also interesting to note that in the case of biologically-pretreated samples with the addition of rumen fluid (samples G + R and G + S + R), the K2O and P2O5 content decreased, compared to the same samples without rumen fluid. Based on these results, it can be concluded that enzymes and bacteria in rumen fluid break down the cell membranes and degrade these nutrients [29]. In addition, if anaerobic fermentation occurs because of the presence of enzymes in the sewage sludge, any released polyphosphate can be completely degraded to PO43−−P [30].
In the case of higher temperature thermal pretreatment (80 °C), concentrations of K2O decreased, while the concentration of P2O5 increased slightly in comparison with the lower temperature pretreatment. Among all samples, the concentration of P2O5 was highest in the samples treated at 80 °C, especially for the S and G + S samples; this shows that thermal pretreatment deformed the chemical bonds in the sludge and grass, and thus P is released from the raw substrates. According to Zou and Li [30], the cell membranes of sludge could be disrupted via thermal pretreatment, so that P (mainly in the form of polyphosphate) could easily diffuse out of the cytoplasm. Kuroda et al. [31], on the other hand, discovered that nearly all the polyphosphate could be released from activated sludge simply by heating it at 70 °C for only a few hours.
For the purpose of the further use of these substrates for biofuels and biochemicals (e.g., for production of biogas and biofertilizer), a combination of grass and sludge is suggested rather than using mono substrates, owing to the high NPK content, which is efficient for biofertilizer production. However, it should be noted that such pretreated materials that contain sewage sludge have restricted further applications [32]. Figure 2 shows the results for total nitrogen concentrations (TN). The highest amount of TN was observed in the sewage sludge sample and its mixtures, which is in accordance with the fact that the raw sewage sludge contained more TN than grass or rumen fluid (as shown in Table 2).
With thermal pretreatment of samples at 38.6 °C, the amount of TN increased. The increase can be explained by the decomposition of proteins under the effect of heat and the action of microorganisms [33]. In the case of sewage sludge, the higher the temperature, the higher the TN concentration. The presence of anammox and denitrifying bacteria in the sludge (and also rumen fluid [34]) contribute importantly to the conversion of ammonium and nitrite into N2 [35].
For mixtures of sludge and rumen fluid (S + R), concentration of TN decreased, compared to the sample containing only sludge (S) under the same conditions (38.6 °C). On the other hand, in the case of mixtures of grass, sludge and rumen fluid (G + S + R), the concentration of TN after pretreatment was higher than in the same mixture without rumen fluid (G + S). This indicates that rumen fluid actively participated in the degradation of grass, although the degradation mechanisms are still quite unclear, since the composition of rumen fluid is complex [36]. The main microbial population of rumen fluid includes bacteria, fungi, archaea, and protozoa, of which bacteria and fungi are mainly involved in lignocellulose degradation, while archaea are related to CH4 formation [37]. The degradation process occurs via lignocellulolytic enzymes that are capable of digesting lignocellulosic materials (mainly consisting of cellulose, hemicellulose and lignin) into proteins, volatile fatty acids (VFAs) and gases [38].
At the highest pretreatment temperature (80 °C), TN concentrations were similar to those at the lower temperature (38.6 °C), while in the sample of sewage sludge (S) the concentrations were even higher. Similar results regarding TN release during thermal pretreatment have been reported previously [39].
Statistical t-tests performed for TN concentration show significant differences in the values between treated and untreated samples (at 90% confidence interval). The tests also showed significant differences among the different feedstock materials (sludge, grass, and rumen fluid). On the other hand, less significant differences were found in the case of biologically treated samples when compared to the same biologically untreated samples. The t-tests comparing results of the higher and lower temperature thermal pretreatment provided similar results, since in many cases the differences were insignificant.

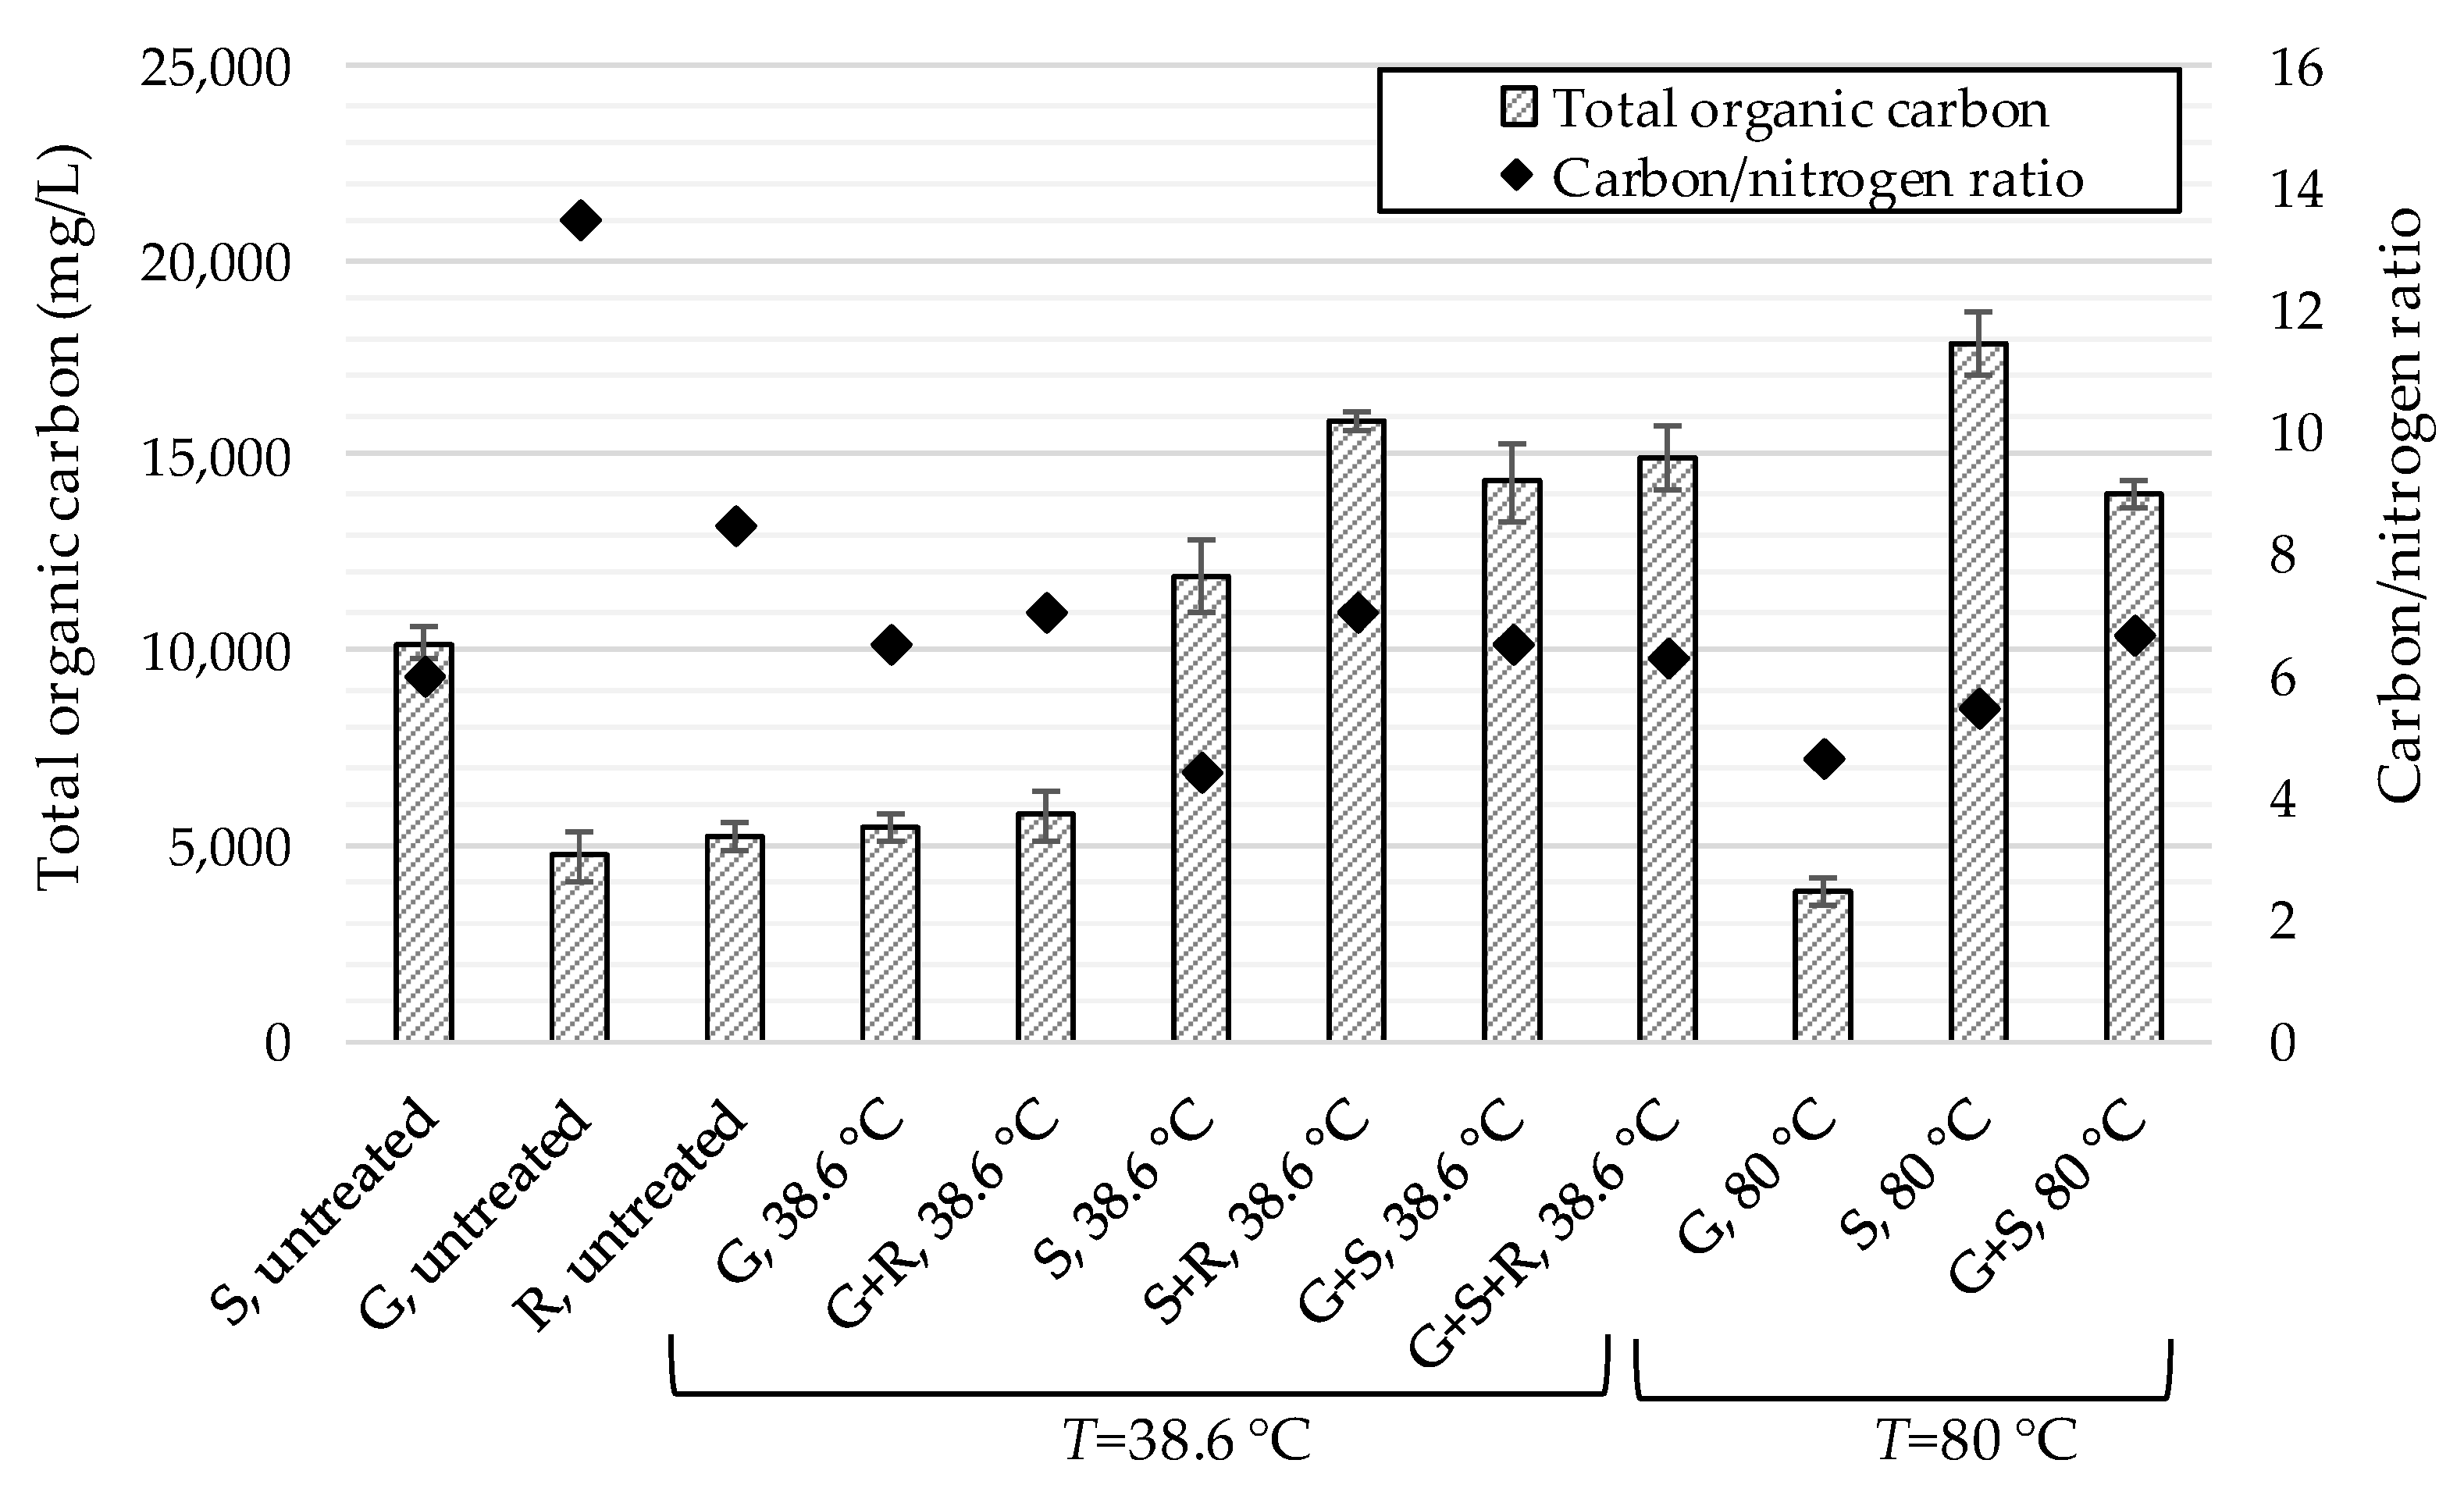
3.2.2. TOC Values and C/N Ratio

An optimal C/N ratio in the feedstocks is important for the optimal growth of microorganisms [40], for the reduction of VFA accumulation [41], to prevent inhibition [39], to mitigate C and N emissions [42], to analyze organic matter in aquatic ecosystems [43], and for the production of lipids in yeasts [44], among other effects. For example, the optimal C/N ratio for anaerobic digestion [45] and composting [46] is between 20 and 30.
Sewage sludge is known for its lower C/N ratios due to high losses through ammonia emissions [47]. Similarly, low C/N ratios occur in slurries [41], manures [48] and slaughterhouse waste [49]. On the other hand, grass has a higher C/N ratio, between 10 and 25 [50]. For some biomass and waste sources, significantly higher values of C/N ratios have also been reported, up to more than 500 for wood shavings [50]. The C/N ratio is defined as the ratio between organic carbon (TOC) and total nitrogen (TN). Figure 3 shows the results for TOC values and the C/N ratio.
From Figure 3, it can be seen that the C/N ratios for untreated samples are within ranges as reported previously. As expected, the highest values were found in untreated grass samples (C/N ratio of 13.5). After thermal or biological pretreatment of the grass (G) samples, the C/N ratio decreased. There are various reasons for this decrease, one being that the C/N ratio decreased as a result of increased TN. Another reason for C/N decrease after biological pretreatment is that micro-organisms consume more carbon than nitrogen. The decrease in the C/N ratio could also be the result of a loss of carbon as CO2 by mineralization during the process [33].
The C/N ratio for all pretreated samples at both temperatures was between 4 and 7. For the mixtures with sludge (S + R, G + S, G + S + R) after thermal treatment, the C/N ratios were still higher compared to those from the sludge samples (S), indicating that the presence of grass and rumen fluid did positively affect the C/N ratio. However, C/N ratios in all samples after pretreatment were significantly lower than is suitable for anaerobic digestion and composting processes. Thus, the problem could be solved by mixing different organic substrates, such as grass and other organic waste.
TOC values in all samples containing sewage sludge (S) increased after thermal or biological pretreatment, and the highest value was detected in the sample thermally treated at 80 °C. These results confirmed that thermal pretreatment accelerates the biodegradation of materials such as sewage sludge and grass, and thus increases the TOC content in the liquid samples [39]. At a lower temperature (38.6 °C), the highest amount of organic carbon was released in the cases when rumen fluid was added to the reaction mixtures (S + R and G + S + R). This is in accordance with previous studies, where it has been reported that microbial cultures from rumen fluid have a great capacity to increase the hydrolysis of lignocellulosic substrates [51] such as grass [52]. Therefore, it can be concluded that rumen fluid significantly affects the biodegradation of organic materials. Thus, a combination of lower temperature thermal treatment and biological treatment could be interesting for such a purpose. Similar conclusions could be adopted for both the t-tests performed with the results of TOC measurements and those performed for TN concentration.

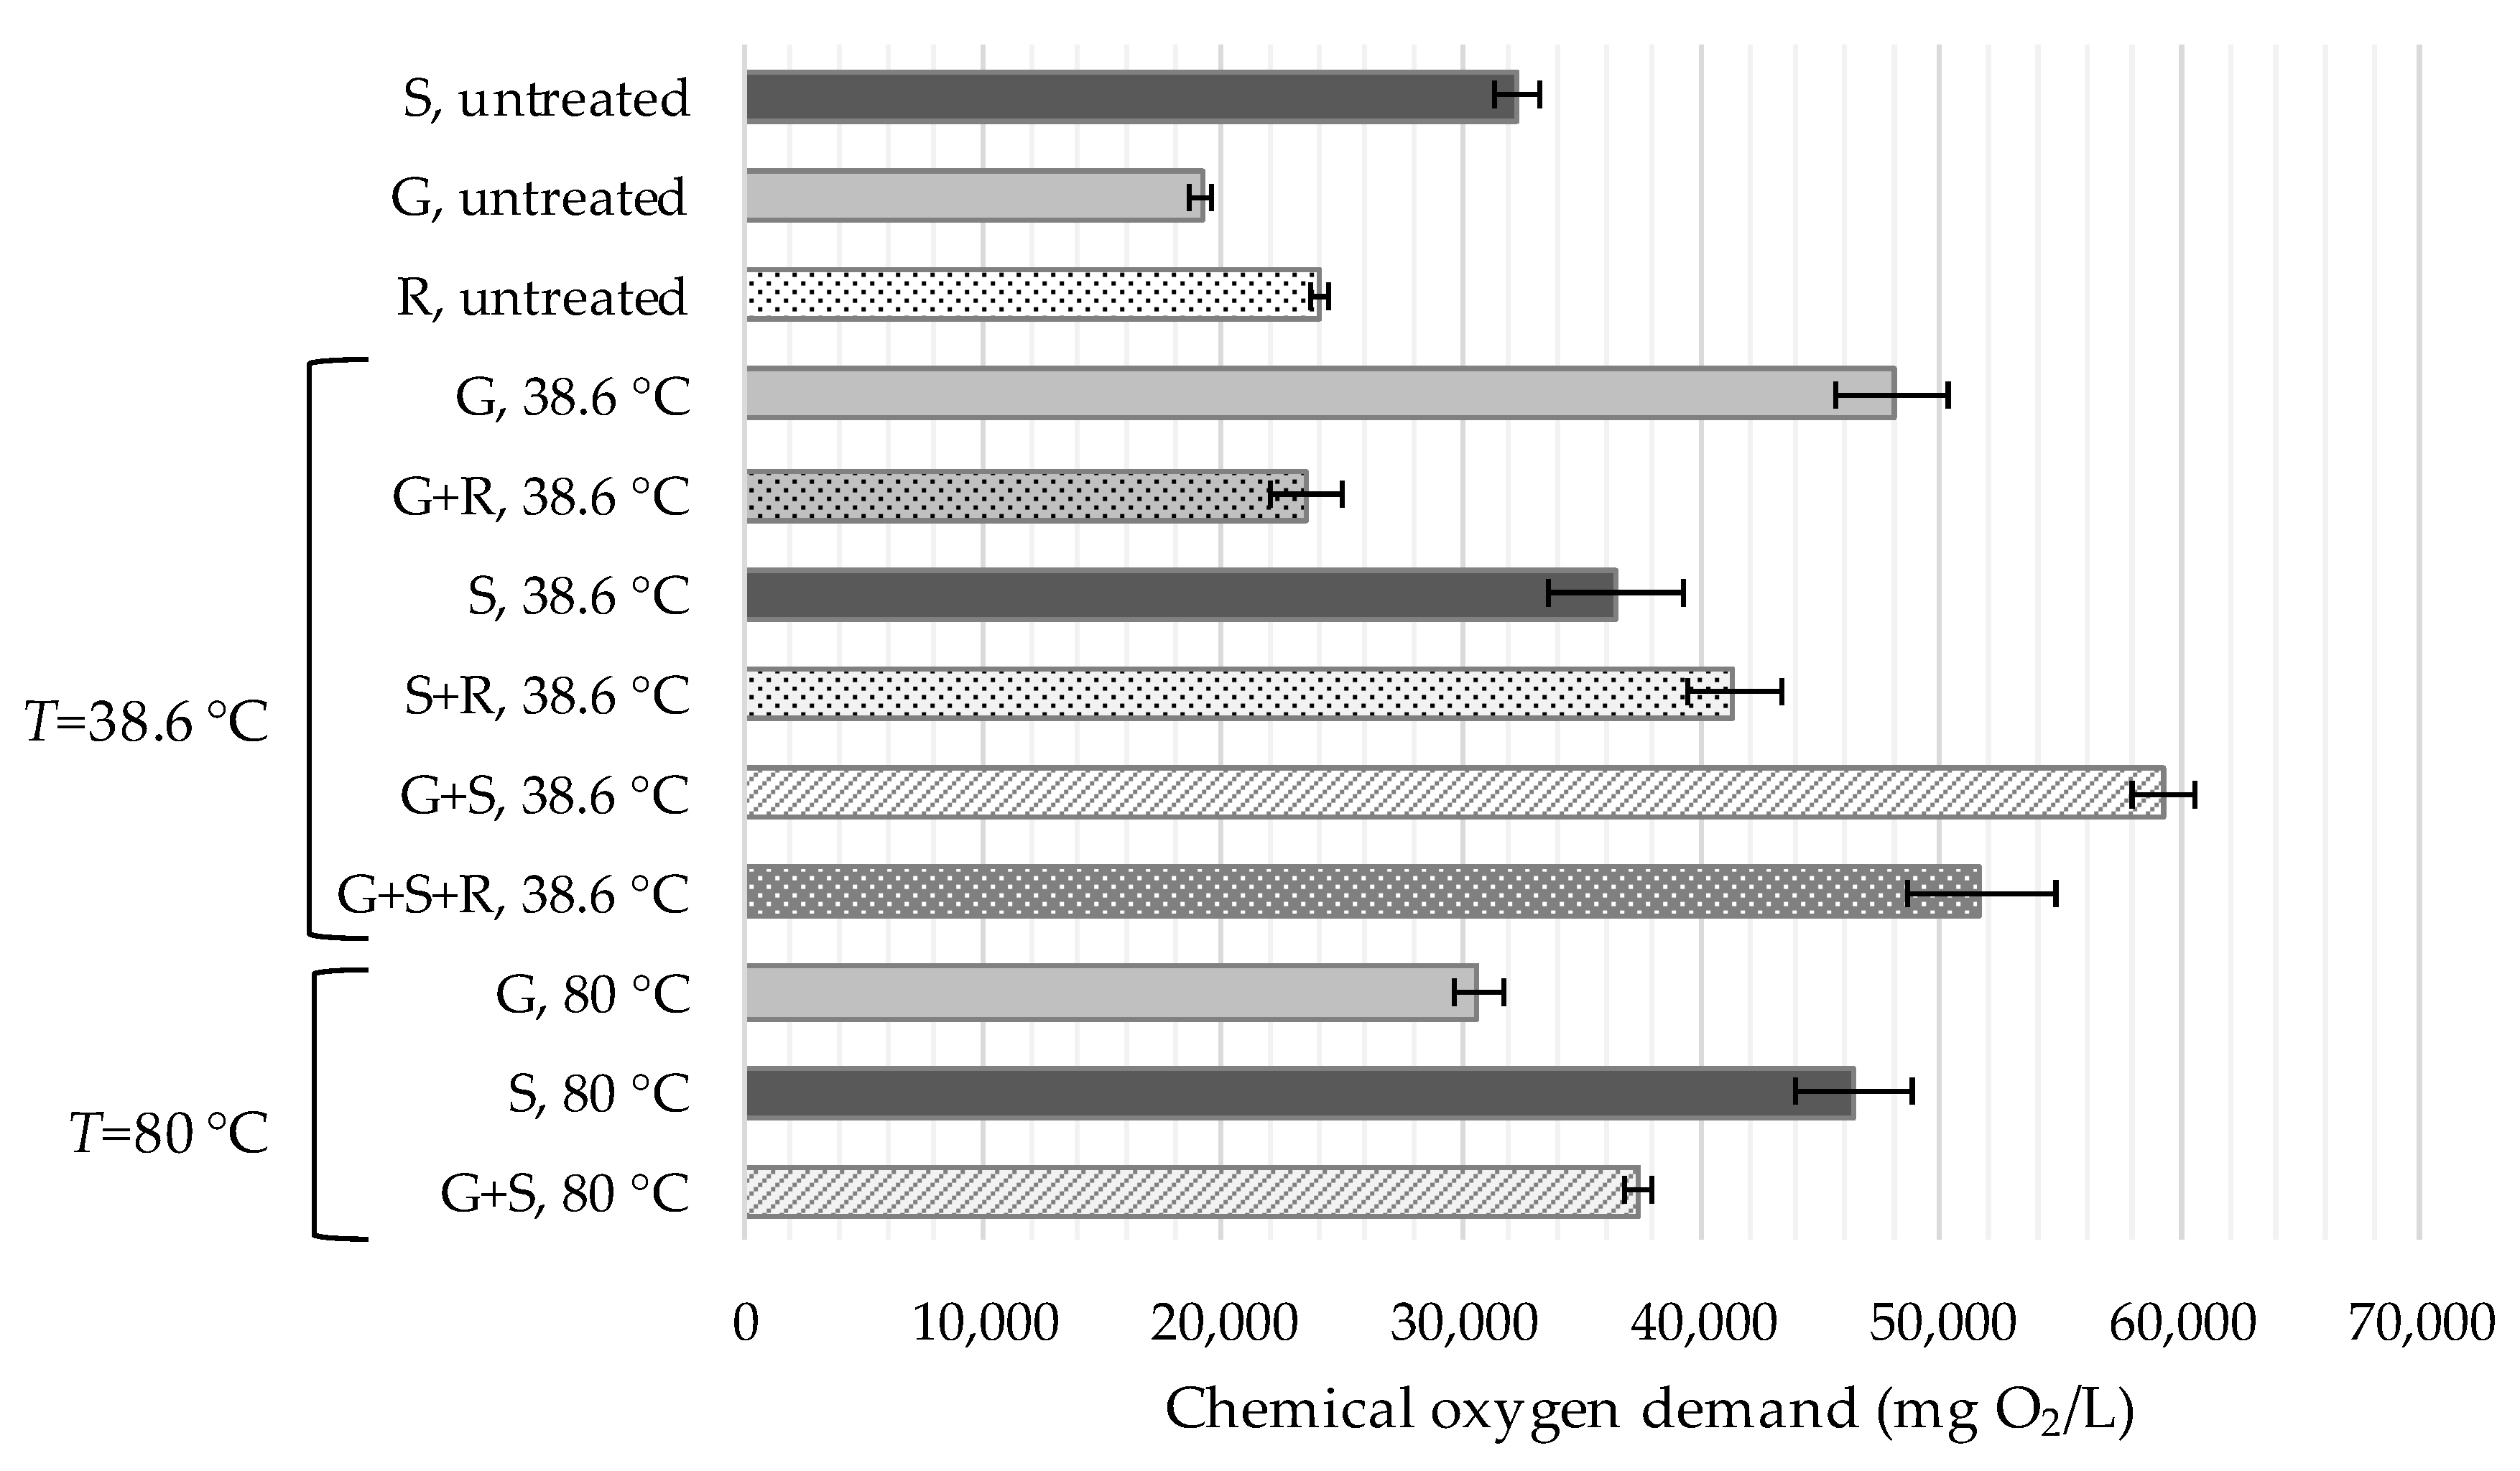
3.2.3. Chemical Oxygen Demand (Soluble COD) Measurements

The COD represents the amount of oxygen required to oxidize organic material into water and CO2 and is therefore a measure of the quantity of organic material present in the material. Values of soluble COD measurements before and after pretreatment are shown in Figure 4. In general, as shown, the highest COD values were measured in all the samples exposed to thermal pretreatment at 38.6 °C, while at 80 °C the values were lower (except for sewage sludge).
The COD values for the grass samples significantly increased after thermal pretreatment at 38.6 °C as compared to the untreated sample and decreased after thermal pretreatment at 80 °C as compared to the value at 38.6 °C. However, both values were higher than in the untreated sample.
This increase is in agreement with the findings of previous studies, which state that thermal pretreatment breaks down the cell walls, which enables the transfer of organic material to the liquid phase and consequently increases the COD [39]. A study by Ariunbaatar et al. [53] also confirmed that thermal pretreatment increased solubilization of organic solids and/or increased hydrolysis, making the substrates more available for anaerobic microorganisms; thus, in the subsequent anaerobic digestion process, biomethane production was enhanced.
As in the grass samples, the sewage sludge samples also yielded increased COD values after thermal pretreatment. After pretreatment at 38.6 °C, the highest COD was detected in the mixture of grass and sewage sludge (G + S). On the other hand, the presence of rumen fluid in the samples with grass (biological pretreatment at 38.6 °C) caused a slight drop in COD values. This can be explained by the fact that the microorganisms from the rumen fluid hydrolyze the macromolecules (lignocellulose and proteins) in the grass, thus reducing the amount of organic material [54]. Again, statistical hypothesis testing showed similar conclusions for TN and TOC measurements.

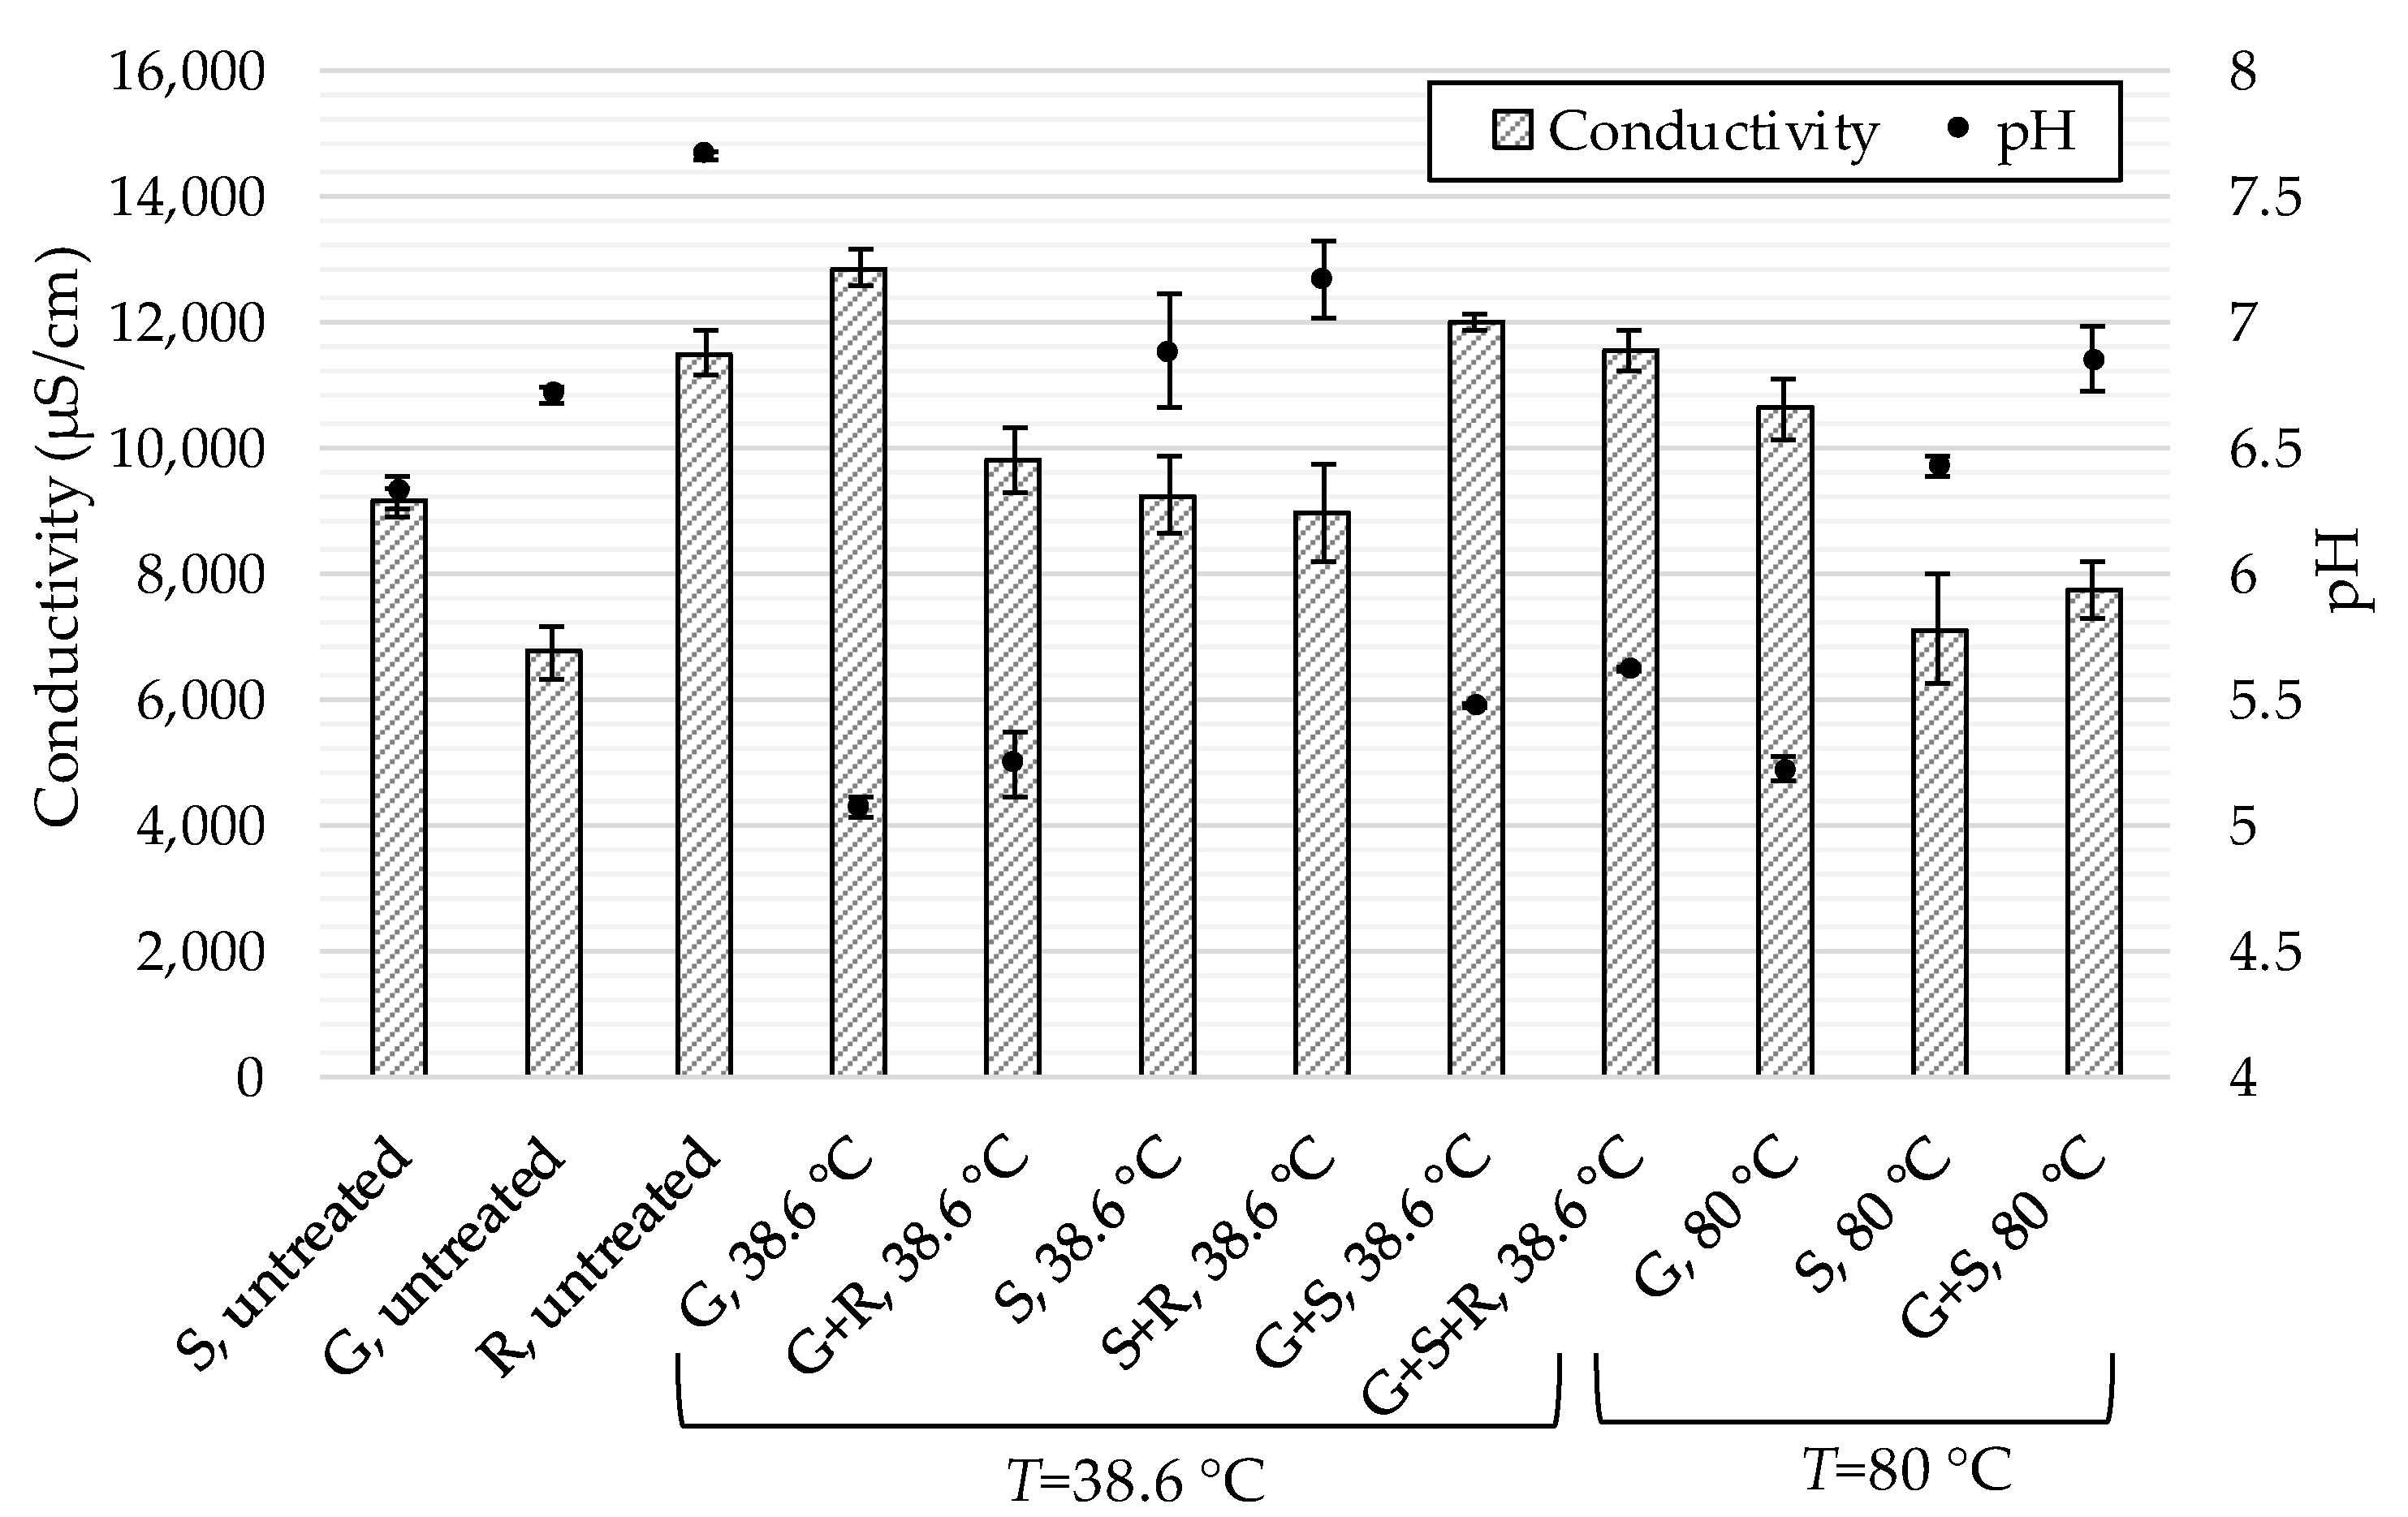
3.2.4. pH and Conductivity

Monitoring pH value is an indicator of the degree of biological and biochemical decomposition [33]. Electrical conductivity is a commonly used parameter for monitoring the amounts of nutrients, salts and impurities in the solution [55]. Since the composition of substrates could significantly change during pretreatment, pH and conductivity values could also significantly fluctuate. pH and conductivity measurements in the analyzed samples are shown in Figure 5.
pH values were generally higher in the untreated samples, and decreased during pretreatment, especially for the grass samples. This can be explained by the fact that, because of the degradation of organic compounds during thermal pretreatment, amino acids, ammonia and fatty acids are formed, which cause a drop in pH [29]. At higher temperatures, amino acids could also be degraded, and the pH increases again [56]. This can be clearly noticed in the sample with the combination of sewage sludge and grass (G + S), where an increase in pH is noticed at 80 °C, as compared with the pH value at 36.8 °C. Another interesting observation is that, in the case of samples containing only sewage sludge (S), the pH value after thermal pretreatment at 38.6 °C increased slightly and decreased after pretreatment at a higher temperature (80 °C). This could be related to the release of NH4+, which could increase the pH of the solution when present in higher concentrations.
When biological pretreatment was performed, pH increased slightly with the addition of rumen fluid, most likely because of the slightly alkaline environment of rumen fluid (the pH of untreated sample was 7.5). For high degradation efficiency, maintaining a pH value in the optimal range is important, and the natural buffering ability of rumen fluid plays a major role in that process [57]. However, the optimal pH for most lignocellulose-degrading enzymes should be between 4.5 and 6.0 [58], and for methanogenic bacteria, the optimal range is between 6.6 and 7.6 [59], although a wider range (between 6.5 and 8.2) has also been reported [60]. Hu et al. [52] reported that acidogenesis of cattail by rumen cultures is possible at higher pH (pH of 6.9). Similar values for treated samples were found in the present study (pH values between 5.1 and 7.2).
Conductivity of the samples increased with pretreatment at lower temperatures (38.6 °C) and decreased with pretreatment at higher temperatures (80 °C). This can be confirmed by the findings of some authors who stated that electrical conductivity increases at temperatures up to 50 °C and becomes linear over time with any further increase in temperature [61].
The highest conductivity was measured in the grass sample (G) after pretreatment at 38.6 °C, because ions were dissolved from the grass, which thus increased conductivity. In one of the previous studies [61], it was likewise found that with the temperature increase, the conductivity in vegetable materials increases up to four times. Since the composition of these materials is comparable to grass, similar findings could be expected.
High conductivity values were also noted in the case of a mixture of grass and sludge (G + S), and a combination of grass, sludge and rumen fluid (G + S + R). This is due to the presence of grass, since sludge exhibits smaller conductivity values. In all the samples with rumen fluid (G + R, S +R and G + S + R), conductivity decreases as compared to the samples without rumen fluid (G, S and G + S). On the other hand, the conductivity of untreated rumen fluid is relatively high, owing to dissolved ions. The decrease in conductivity in mixtures with rumen fluid could be connected to the buffering capacity of rumen fluid [62].

3.2.5. Gas Phase Composition

The composition of the gas phase in the samples is shown in Table 4. In the samples containing sewage sludge and/or rumen fluid pretreated at 38.6 °C, significant concentrations of CH4 were observed in the gas phase. The addition of rumen fluid increases cell wall degradation and thus allows microorganisms easier access to nutrients; therefore, more CH4 is formed [56].
Besides CH4, other gases such as CO2 and H2S were also analyzed and detected in the gas phase of the samples. The mixture of grass and rumen fluid (G + R) contains the highest amount of CO2. Rumen fluid degrades the lignocellulosic fibers in the grass and consumes oxygen, which leads to CO2 increase [63]. Accordingly, CO2 production could be used as an indicator of the degradation efficiency of lignocellulosic biomass during rumen fermentation [30].
The concentrations of H2S were more significant in the samples containing rumen fluid (G + R and G + S + R). Slightly higher concentrations of this gas were found in mixtures containing grass. The production of H2S comes mostly from microbial degradation of organic matter [64].
On the other hand, when pretreatment was performed at 80 °C, production of the gases under analysis was negligible. The reason for such results is that bacteria in materials are highly active only in mesophilic ranges (between 25 and 42 °C) [65] and thermophilic ranges (between 50 and 65 °C) [66]. At temperatures below 15 °C and above 70 °C, methanogenic bacteria are limited in activity [67].

4. Conclusions and Future Research

In this study, thermal and biological pretreatment techniques were applied to two waste materials: sewage sludge and riverbank grass (Typha latifolia) and their combination (in the ratio 1:1). Lower and higher temperature thermal pretreatments (at 38.6 and 80 °C) and biological pretreatments (at a ruminal temperature of 38.6 °C) were studied. Various parameters were measured in the liquid and gas phases.
NPK, TOC and COD values, and the C/N ratio showed that low temperature thermal treatment is preferred, because of its better biodegradation characteristics of waste materials. pH values were mainly in the optimal range, while pretreated grass samples exhibited pH values below the optimal, which could be improved by biological pretreatment and mixing with other waste materials. Additionally, the results of the gas phase showed that the most suitable pretreatment technique(s) for further applications are low temperature thermal and/or biological treatment. The best result in the gas phase was obtained for biologically pretreated sludge, as it yielded the highest concentration of CH4 and the lowest concentration of H2S. Based on the results, it was found that pretreatment technique(s) should be carefully chosen, owing to some inhibitory effects at elevated temperatures, which could exert a negative impact on the further treatment of waste materials.
However, an important consideration for future studies is the further use of pretreated materials which contain sewage sludge, as it may contain heavy metals, pathogens and persistent organic pollutants (POPs). Thus, further handling of these materials is suggested, such as removal of heavy metals, extraction of POPs from sludge, reduction of pathogens and so on. Future studies could be aimed at further hydrolysis and fermentation of pretreated materials, and at identifying and reducing contaminants from treated sewage sludge.

Author Contributions

Conceptualization, L.Č. and M.S.; methodology, L.Č. and A.P; investigation, R.H. and A.P.; writing—original draft preparation, R.H. and A.P.; writing—review and editing, L.Č. and M.S.; visualization, R.H. and A.P.; supervision, L.Č.; project administration, A.P. and L.Č.; funding acquisition, L.Č. and A.P. All authors have read and agreed to the published version of the manuscript.

Funding

The authors acknowledge financial support from the Slovenian Research Agency (research core funding No. P2-0412 and P2-0032 and project No. J7-1816) and the Slovenian Ministry of Education, Science and Sport (project No. C3330-19-952041). The authors also acknowledge support in chemical analytics and consultancy in the field of sewage sludge management from the IKEMA d.o.o. company.

Conflicts of Interest

The authors declare no conflict of interest.

Nomenclature

CODChemical oxygen demand
C/NCarbon/Nitrogen ratio
DMDry matter
GGrass Typha latifolia
ICP-OESInductively coupled plasma optical emission spectrometry
NPKNitrogen (N), phosphorus (P2O5) and potassium (K2O)
PEPopulation Equivalent
POPPersistent organic pollutants
RRumen fluid
SSewage sludge
TCTotal carbon
TNTotal nitrogen
TOCTotal organic carbon
TPTotal phosphorus
TSTotal solids
VFAVolatile fatty acid

References

  1. Čuček, L.; Klemeš, J.J.; Varbanov, P.S.; Kravanja, Z. Significance of environmental footprints for evaluating sustainability and security of development. Clean Technol. Environ. Policy 2015, 17, 2125–2141. [Google Scholar] [CrossRef]
  2. Bezama, A.; Agamuthu, P. Addressing the Big Issues in Waste Management; SAGE: London, UK, 2019. [Google Scholar]
  3. Ferronato, N.; Torretta, V. Waste Mismanagement in Developing Countries: A Review of Global Issues. Int. J. Environ. Res. Public Health 2019, 16, 1060. [Google Scholar] [CrossRef] [PubMed] [Green Version]
  4. European Commission. Waste. Available online: ec.europa.eu/environment/waste/index.htm (accessed on 28 March 2020).
  5. Balasubramanian, S.; Tyagi, R.D. 2—Value-Added Bio-products From Sewage Sludge. In Current Developments in Biotechnology and Bioengineering; Wong, J.W.C., Tyagi, R.D., Pandey, A., Eds.; Elsevier: Amsterdam, The Netherlands, 2017; pp. 27–42. [Google Scholar]
  6. Alibardi, L.; Cossu, R. Composition variability of the organic fraction of municipal solid waste and effects on hydrogen and methane production potentials. Waste Manag. 2015, 36, 147–155. [Google Scholar] [CrossRef] [PubMed]
  7. European Parliament and the Council of the European Union. Directive (EU) 2018/850 of the European Parliament and of the Council of 30 May 2018 Amending Directive 1999/31/EC on the Landfill of Waste. Available online: https://eur-lex.europa.eu/legal-content/EN/TXT/PDF/?uri=CELEX:32018L0850&from=EN (accessed on 3 May 2020).
  8. Behera, S.; Arora, R.; Nandhagopal, N.; Kumar, S. Importance of chemical pretreatment for bioconversion of lignocellulosic biomass. Renew. Sustain. Energy Rev. 2014, 36, 91–106. [Google Scholar] [CrossRef]
  9. Anawar, H.M.; Strezov, V. Technical and Economic Assessment of Biogas and Liquid Energy Systems from Sewage Sludge and Industrial Waste: Lifecycle Assessment and Sustainability. In Renewable Energy Systems from Biomass; CRC Press: Boca Raton, FL, USA, 2018; pp. 57–73. [Google Scholar]
  10. Fatma, S.; Hameed, A.; Noman, M.; Ahmed, T.; Shahid, M.; Tariq, M.; Sohail, I.; Tabassum, R. Lignocellulosic biomass: A sustainable bioenergy source for the future. Protein Pept. Lett. 2018, 25, 148–163. [Google Scholar] [CrossRef]
  11. Kumar, A.K.; Sharma, S. Recent updates on different methods of pretreatment of lignocellulosic feedstocks: A review. Bioresour. Bioprocess. 2017, 4, 7. [Google Scholar] [CrossRef] [Green Version]
  12. Seidl, P.R.; Goulart, A.K. Pretreatment processes for lignocellulosic biomass conversion to biofuels and bioproducts. Curr. Opin. Green Sustain. Chem. 2016, 2, 48–53. [Google Scholar] [CrossRef]
  13. Kumar, A.K.; Parikh, B.S. Cellulose-degrading enzymes from Aspergillus terreus D34 and enzymatic saccharification of mild-alkali and dilute-acid pretreated lignocellulosic biomass residues. Bioresour. Bioprocess. 2015, 2, 7. [Google Scholar] [CrossRef] [Green Version]
  14. Zhang, H.; Zhang, P.; Ye, J.; Wu, Y.; Fang, W.; Gou, X.; Zeng, G. Improvement of methane production from rice straw with rumen fluid pretreatment: A feasibility study. Int. Biodeterior. Biodegrad. 2016, 113, 9–16. [Google Scholar] [CrossRef]
  15. Rouches, E.; Herpoël-Gimbert, I.; Steyer, J.P.; Carrere, H. Improvement of anaerobic degradation by white-rot fungi pretreatment of lignocellulosic biomass: A review. Renew. Sustain. Energy Rev. 2016, 59, 179–198. [Google Scholar] [CrossRef]
  16. Mahmud, N.; Rosentrater, K.A. Life-Cycle Assessment (LCA) of Different Pretreatment and Product Separation Technologies for Butanol Bioprocessing from Oil Palm Frond. Energies 2020, 13, 155. [Google Scholar] [CrossRef] [Green Version]
  17. Hassan, S.S.; Williams, G.A.; Jaiswal, A.K. Emerging technologies for the pretreatment of lignocellulosic biomass. Bioresour. Technol. 2018, 262, 310–318. [Google Scholar] [CrossRef] [PubMed] [Green Version]
  18. Agbor, V.B.; Cicek, N.; Sparling, R.; Berlin, A.; Levin, D.B. Biomass pretreatment: Fundamentals toward application. Biotechnol. Adv. 2011, 29, 675–685. [Google Scholar] [CrossRef] [PubMed]
  19. Karimi, K.; Taherzadeh, M.J. A critical review on analysis in pretreatment of lignocelluloses: Degree of polymerization, adsorption/desorption, and accessibility. Bioresour. Technol. 2016, 203, 348–356. [Google Scholar] [CrossRef] [PubMed] [Green Version]
  20. SIST EN 16168:2013. Sludge, Treated Biowaste and Soil—Determination of Total Nitrogen Using Dry Combustion Method; Slovenian Institute for Standardization (SIST): Ljubljana, Slovenia, 2013. [Google Scholar]
  21. SIST EN ISO 11885:2009. Water Quality—Determination of Selected Elements by Inductively Coupled Plasma Optical Emission Spectrometry (ICP-OES) (ISO 11885:2007); Slovenian Institute for Standardization (SIST): Ljubljana, Slovenia, 2009. [Google Scholar]
  22. SIST EN 13137:2002. Characterization of Waste—Determination of Total Organic Carbon (TOC) in Waste, Sludges and Sediments; Slovenian Institute for Standardization (SIST): Ljubljana, Slovenia, 2002. [Google Scholar]
  23. SIST EN 14346:2007. Characterization of Waste—Alculation of Dry Matter by Determination of Dry Residue or Water Content; Slovenian Institute for Standardization (SIST): Ljubljana, Slovenia, 2007. [Google Scholar]
  24. EN 16170:2016. Sludge, Treated Biowaste and Soil—Determination of Elements Using Inductively Coupled Plasma Optical Emission Spectrometry (ICP-OES); European Committee for Standardization: Brussels, Belgium, 2016. [Google Scholar]
  25. Turbill, C.; Ruf, T.; Mang, T.; Arnold, W. Regulation of heart rate and rumen temperature in red deer: Effects of season and food intake. J. Exp. Biol. 2011, 214, 963–970. [Google Scholar] [CrossRef] [PubMed] [Green Version]
  26. Fijalkowski, K.; Rorat, A.; Grobelak, A.; Kacprzak, M.J. The presence of contaminations in sewage sludge—The current situation. J. Environ. Manag. 2017, 203, 1126–1136. [Google Scholar] [CrossRef] [PubMed]
  27. Bedoić, R.; Čuček, L.; Ćosić, B.; Krajnc, D.; Smoljanić, G.; Kravanja, Z.; Ljubas, D.; Pukšec, T.; Duić, N. Green biomass to biogas—A study on anaerobic digestion of residue grass. J. Clean. Prod. 2019, 213, 700–709. [Google Scholar] [CrossRef]
  28. Marliah, A.; Anhar, A.; Hayati, E. Combine organic and inorganic fertilizer increases yield of cucumber (Cucumissativus L.). IOP Conf. Ser. Earth Environ. Sci. 2020, 425, 012075. [Google Scholar] [CrossRef]
  29. Nguyen, L.N.; Nguyen, A.Q.; Johir, M.A.H.; Guo, W.; Ngo, H.H.; Chaves, A.V.; Nghiem, L.D. Application of rumen and anaerobic sludge microbes for bio harvesting from lignocellulosic biomass. Chemosphere 2019, 228, 702–708. [Google Scholar] [CrossRef]
  30. Zou, J.; Li, Y. Anaerobic fermentation combined with low-temperature thermal pretreatment for phosphorus-accumulating granular sludge: Release of carbon source and phosphorus as well as hydrogen production potential. Bioresour. Technol. 2016, 218, 18–26. [Google Scholar] [CrossRef]
  31. Kuroda, A.; Takiguchi, N.; Gotanda, T.; Nomura, K.; Kato, J.; Ikeda, T.; Ohtake, H. A simple method to release polyphosphate from activated sludgefor phosphorus reuse and recycling. Biotechnol. Bioeng. 2002, 78, 333–338. [Google Scholar] [CrossRef] [PubMed]
  32. Hudcová, H.; Vymazal, J.; Rozkošný, M. Present restrictions of sewage sludge application in agriculture within the European Union. Soil Water Res. 2019, 14, 104–120. [Google Scholar] [CrossRef]
  33. Boutchich, G.E.K.; Tahiri, S.; Mahi, M.; Gallart-Mateu, D.; de la Guardia, M.; Aarfane, A.; Lhadi, E.; El Krati, M. Characterization of activated sludge from domestic sewage treatment plants and their management using composting and co-composting in aerobic silos. J. Mater. Env.. Sci. 2015, 6, 2206–2220. [Google Scholar]
  34. Liu, L.; Xu, X.; Cao, Y.; Cai, C.; Cui, H.; Yao, J. Nitrate decreases methane production also by increasing methane oxidation through stimulating NC10 population in ruminal culture. AMB Express 2017, 7, 76. [Google Scholar] [CrossRef]
  35. Wang, X.; Yang, R.; Guo, Y.; Zhang, Z.; Kao, C.M.; Chen, S. Investigation of COD and COD/N ratio for the dominance of anammox pathway for nitrogen removal via isotope labelling technique and the relevant bacteria. J. Hazard. Mater. 2019, 366, 606–614. [Google Scholar] [CrossRef]
  36. Henderson, G.; Cox, F.; Ganesh, S.; Jonker, A.; Young, W.; Abecia, L.; Angarita, E.; Aravena, P.; Nora Arenas, G.; Ariza, C.; et al. Rumen microbial community composition varies with diet and host, but a core microbiome is found across a wide geographical range. Sci. Rep. 2015, 5, 14567. [Google Scholar] [CrossRef]
  37. Campanaro, S.; Treu, L.; Cattani, M.; Kougias, P.G.; Vendramin, V.; Schiavon, S.; Tagliapietra, F.; Giacomini, A.; Corich, V. In vitro fermentation of key dietary compounds with rumen fluid: A genome-centric perspective. Sci. Total Environ. 2017, 584–585, 683–691. [Google Scholar] [CrossRef]
  38. Xing, B.-S.; Han, Y.; Wang, X.C.; Ma, J.; Cao, S.; Li, Q.; Wen, J.; Yuan, H. Cow manure as additive to a DMBR for stable and high-rate digestion of food waste: Performance and microbial community. Water Res. 2020, 168, 115099. [Google Scholar] [CrossRef]
  39. Risberg, K.; Sun, L.; Levén, L.; Horn, S.J.; Schnürer, A. Biogas production from wheat straw and manure–impact of pretreatment and process operating parameters. Bioresour. Technol. 2013, 149, 232–237. [Google Scholar] [CrossRef]
  40. Baba, Y.; Tada, C.; Fukuda, Y.; Nakai, Y. Improvement of methane production from waste paper by pretreatment with rumen fluid. Bioresour. Technol. 2013, 128, 94–99. [Google Scholar] [CrossRef]
  41. Karthikeyan, O.P.; Visvanathan, C. Bio-energy recovery from high-solid organic substrates by dry anaerobic bio-conversion processes: A review. Rev. Environ. Sci. Bio/Technol. 2013, 12, 257–284. [Google Scholar] [CrossRef]
  42. Brassard, P.; Godbout, S.; Raghavan, V.; Palacios, J.H.; Grenier, M.; Zegan, D. The Production of Engineered Biochars in a Vertical Auger Pyrolysis Reactor for Carbon Sequestration. Energies 2017, 10, 288. [Google Scholar] [CrossRef] [Green Version]
  43. Venkatesh, M. Appraisal of the carbon to nitrogen (C/N) ratio in the bed sediment of the Betwa River, Peninsular India. Int. J. Sediment Res. 2020, 35, 69–78. [Google Scholar] [CrossRef]
  44. Yang, S.; Wang, W.; Wei, H.; Van Wychen, S.; Pienkos, P.T.; Zhang, M.; Himmel, M.E. Comparison of Nitrogen Depletion and Repletion on Lipid Production in Yeast and Fungal Species. Energies 2016, 9, 685. [Google Scholar] [CrossRef] [Green Version]
  45. Zheng, Z.; Liu, J.; Yuan, X.; Wang, X.; Zhu, W.; Yang, F.; Cui, Z. Effect of dairy manure to switchgrass co-digestion ratio on methane production and the bacterial community in batch anaerobic digestion. Appl. Energy 2015, 151, 249–257. [Google Scholar] [CrossRef]
  46. Zhu, N. Effect of low initial C/N ratio on aerobic composting of swine manure with rice straw. Bioresour. Technol. 2007, 98, 9–13. [Google Scholar] [CrossRef]
  47. Żukowska, G.; Mazurkiewicz, J.; Myszura, M.; Czekała, W. Heat Energy and Gas Emissions during Composting of Sewage Sludge. Energies 2019, 12, 4782. [Google Scholar] [CrossRef] [Green Version]
  48. Neshat, S.A.; Mohammadi, M.; Najafpour, G.D.; Lahijani, P. Anaerobic co-digestion of animal manures and lignocellulosic residues as a potent approach for sustainable biogas production. Renew. Sustain. Energy Rev. 2017, 79, 308–322. [Google Scholar] [CrossRef]
  49. Zver, A.; Bernik, R.; Mihelič, R. Effect of Pressure on the Removal of NH3 from Hydrolyzed and Pre-Fermented Slaughterhouse Waste for Better Biomethanization. Energies 2019, 12, 1868. [Google Scholar] [CrossRef] [Green Version]
  50. Steffen, R.; Szolar, O.; Braun, R. Feedstocks for Anaerobic Digestion; Institute of Agrobiotechnology Tulin, University of Agricultural Sciences: Vienna, Austria, 1998. [Google Scholar]
  51. Čater, M.; Zorec, M.; Logar, R.M. Methods for improving anaerobic lignocellulosic substrates degradation for enhanced biogas production. Springer Sci. Rev. 2014, 2, 51–61. [Google Scholar] [CrossRef] [Green Version]
  52. Hu, Z.-H.; Yu, H.-Q. Anaerobic digestion of cattail by rumen cultures. Waste Manag. 2006, 26, 1222–1228. [Google Scholar] [CrossRef] [PubMed]
  53. Ariunbaatar, J.; Panico, A.; Yeh, D.H.; Pirozzi, F.; Lens, P.N.L.; Esposito, G. Enhanced mesophilic anaerobic digestion of food waste by thermal pretreatment: Substrate versus digestate heating. Waste Manag. 2015, 46, 176–181. [Google Scholar] [CrossRef] [PubMed] [Green Version]
  54. Dölle, K.; Wagmüller, F. Determination of the Chemical Oxygen Demand (COD) of Hydrothermal Pretreated Hay Samples. Curr. J. Appl. Sci. Technol. 2015, 8, 356–360. [Google Scholar] [CrossRef]
  55. Zhang, J.; Li, D.; Wang, C.; Ding, Q. An Intelligent Four-Electrode Conductivity Sensor for Aquaculture. In Proceedings of the Computer and Computing Technologies in Agriculture VI, Zhangjiajie, China, 19–21 October 2012; pp. 398–407. [Google Scholar]
  56. Budiyono, B.; Widiasa, I.N.; Johari, S.; Sunarso, S. Increasing biogas production rate from cattle manure using rumen fluid as inoculums. Int. J. Sci. Eng. 2014, 6, 31–38. [Google Scholar] [CrossRef] [Green Version]
  57. Xing, B.-S.; Han, Y.; Wang, X.C.; Wen, J.; Cao, S.; Zhang, K.; Li, Q.; Yuan, H. Persistent action of cow rumen microorganisms in enhancing biodegradation of wheat straw by rumen fermentation. Sci. Total Environ. 2020, 715, 136529. [Google Scholar] [CrossRef] [PubMed]
  58. Lange, L.; Pilgaard, B.; Herbst, F.-A.; Busk, P.K.; Gleason, F.; Pedersen, A.G. Origin of fungal biomass degrading enzymes: Evolution, diversity and function of enzymes of early lineage fungi. Fungal Biol. Rev. 2019, 33, 82–97. [Google Scholar] [CrossRef]
  59. Bermúdez-Penabad, N.; Kennes, C.; Veiga, M.C. Anaerobic digestion of tuna waste for the production of volatile fatty acids. Waste Manag. 2017, 68, 96–102. [Google Scholar] [CrossRef] [PubMed]
  60. Carotenuto, C.; Guarino, G.; Morrone, B.; Minale, M. Temperature and pH effect on methane production from buffalo manure anaerobic digestion. Int. J. Heat Technol. 2016, 34, S425–S429. [Google Scholar] [CrossRef]
  61. Wang, W.C.; Sastry, S.K. Changes in electrical conductivity of selected vegetables during multiple thermal treatments. J. Food Process Eng. 1997, 20, 499–516. [Google Scholar] [CrossRef]
  62. Le Ruyet, P.; Tucker, W. Ruminal buffers: Temporal effects on buffering capacity and pH of ruminal fluid from cows fed a high concentrate diet. J. Dairy Sci. 1992, 75, 1069–1077. [Google Scholar] [CrossRef]
  63. Qiao, W.; Yan, X.; Ye, J.; Sun, Y.; Wang, W.; Zhang, Z. Evaluation of biogas production from different biomass wastes with/without hydrothermal pretreatment. Renew. Energy 2011, 36, 3313–3318. [Google Scholar] [CrossRef]
  64. Long, Y.; Fang, Y.; Shen, D.; Feng, H.; Chen, T. Hydrogen sulfide (H2S) emission control by aerobic sulfate reduction in landfill. Sci. Rep. 2016, 6, 38103. [Google Scholar] [CrossRef] [PubMed]
  65. Thomas, C.; Idler, C.; Ammon, C.; Herrmann, C.; Amon, T. Inactivation of ESBL-/AmpC-producing Escherichia coli during mesophilic and thermophilic anaerobic digestion of chicken manure. Waste Manag. 2019, 84, 74–82. [Google Scholar] [CrossRef] [PubMed]
  66. Sánchez-Ramírez, J.E.; Pastor, L.; Martí, N.; Claros, J.; Doñate, S.; Bouzas, A. Analysis of uncontrolled phosphorus precipitation in anaerobic digesters under thermophilic and mesophilic conditions. Environ. Technol. 2019, 1–10. [Google Scholar] [CrossRef]
  67. De Vrieze, J.; Hennebel, T.; Boon, N.; Verstraete, W. Methanosarcina: The rediscovered methanogen for heavy duty biomethanation. Bioresour. Technol. 2012, 112, 1–9. [Google Scholar] [CrossRef]
Figure 1. Schematic representation of set-up for thermal and biological pretreatment (illustration made by authors).
Energies 13 02262 g001
Figure 2. Concentrations of total nitrogen (mg/L).
Energies 13 02262 g002
Figure 3. Total organic carbon (TOC) results (mg/L) and the carbon to nitrogen ratio (C/N).
Energies 13 02262 g003
Figure 4. The soluble chemical oxygen demand (COD) results (mg O2/L).
Energies 13 02262 g004
Figure 5. pH and conductivity (µS/cm) measurements.
Energies 13 02262 g005
Table 1. Composition of samples used in pretreatment tests.
Reaction MixtureRumen Fluid (mL)Typha latifolia Grass (g)Sewage Sludge (g)Water (g)
G (grass)/405.40/94.60
S (sludge)//161.27338.73
G + S/202.7080.65216.65
G + R50405.40/94.60
S + R50/161.27338.70
G + S + R50202.7080.65216.65
Table 2. Basic characteristics of the materials in use.
ParameterSewage Sludge (S)Typha latifolia Grass (G)Rumen Fluid (R)
Total dry solids (TS, %)18.607.402.34
Water content (%)81.4092.6097.66
TN (% TS)7.853.463.70
TP (% TS)0.920.320.07
TC (% TS)45.6146.6231.22
Cd (mg/kg DM)1.011.03/
Cu (mg/kg DM)172.826.42/
Cr (mg/kg DM)46.361.39/
Zn (mg/kg DM)739.9927.03/
Ni (mg/kg DM)24.551.72/
Pb (mg/kg DM)27.061.91/
K (mg/kg DM)8,211.8034,398.43/
Table 3. Concentration of potassium in the form of K2O and phosphorus expressed as P2O5 in the samples.
SampleK2O (mg/L)P2O5 (mg/L)
G, untreated1486 ± 89476 ± 8
S, untreated1120 ± 433554 ± 95
R, untreated731 ± 191078 ± 21
G, 38.6 °C5823 ± 47679 ± 10
G + R, 38.6 °C3092 ± 151541 ± 26
S, 38.6 °C2015 ± 1134725 ± 77
S + R, 38.6 °C3193 ± 953974 ± 49
G + S, 38.6 °C11,747 ± 1244146 ± 128
G + S + R, 38.6 °C9940 ± 1683991 ± 85
G, 80 °C3855 ± 59497 ± 37
S, 80 °C1807 ± 625786 ± 152
G + S, 80 °C6024 ± 874874 ± 74
Table 4. Gas phase composition.
SampleH2S (ppm)CH4 (%)CO2 (%)
G, 38.6 °C397 ± 490.13 ± 0.0315.43 ± 3.60
G + R, 38.6 °C1744 ± 2936.26 ± 0.6526.16 ± 4.24
S, 38.6 °C237 ± 247.30 ± 0.4614.23 ± 1.15
S + R, 38.6 °C181 ± 4813.88 ± 2.0912.78 ± 1.88
G + S, 38.6 °C881 ± 1824.25 ± 0.4012.25 ± 2.87
G + S + R, 38.6 °C1003 ± 1405.15 ± 0.0813.42 ± 3.06
G, 80 °C22 ± 10.07 ± 0.022.06 ± 0.16
S, 80 °C24 ± 70.08 ± 0.032.45 ± 0.58
G+S, 80 °C18 ± 40.06 ± 0.021.43 ± 0.40

