Article

Operation of a PV Power Plant during Overpower Events Caused by the Cloud Enhancement Phenomenon

by
Markku Järvelä
* and
Seppo Valkealahti
Department of Electrical Engineering, Tampere University, P.O. Box 692, FI-33101 Tampere, Finland
*
Author to whom correspondence should be addressed.
Energies 2020, 13(9), 2185; https://doi.org/10.3390/en13092185
Submission received: 15 March 2020 / Revised: 22 April 2020 / Accepted: 23 April 2020 / Published: 1 May 2020
(This article belongs to the Special Issue Emerging Photovoltaic Technology in Northern Europe)

Abstract

:
Partly cloudy days possess two characteristics that can significantly increase the photovoltaic (PV) generator power: the operating temperature of the PV panels can cool down during the shade periods, and the irradiance can be enhanced due to the cloud enhancement phenomenon. If an overirradiance event is preceded by a long shade period, the maximum power of a PV generator can occasionally be much higher than the nominal nameplate power. During the overpower events, the inverter is operating in power-limiting mode whereby the operating voltage is increased to decrease the power of the PV generator. We created a simulation model of a 31.9 kW PV generator and used 12 months of irradiance and PV panel temperature measurement data to analyze its operation. We analyzed the PV generator power during the overirradiance events and applied various static power limits to calculate the operating voltage ranges in case of power curtailment. During the observation period, the maximum power produced by the PV generator was 1.42 times its nominal power. The duration of the overpower events was up to several minutes, but the typical duration was only some tens of seconds. The strongest overpower events occur seldom and their duration is only some seconds. Due to the overpower events, the operating voltage may receive high values, especially if the DC-to-AC power ratio is large.

1. Introduction

Clouds affect photovoltaic (PV) power generation in multiple ways. On partly cloudy days, cloud shadows are a source of fast power fluctuations. However, occasionally clouds can cause the irradiance to be enhanced. This is known as cloud enhancement (CE) phenomenon, and as the name implies, it is typically associated with partly cloudy weather. Simplistically, it is due to the redistribution of the photon flux by scattering from the water droplets inside the clouds so that enhanced irradiance areas are formed on the surface of the Earth [1]. The diameter of the focus areas of the enhanced irradiance can be several hundreds of meters, decreasing typically with increasing irradiance, and the strongest overirradiance events have a diameter of the order of some tens of meters [2]. When the cloud shadow speed is low, the duration of the longest overirradiance events can be several minutes [3]. The durations of the overirradiance events affecting the PV generators are typically from some seconds up to a minute [4]. The CE phenomenon can affect the operation from small residential [5] to large utility-scale PV generators [6].
The current–voltage (I–V) characteristics of a PV panel depend mainly on the irradiance, the PV cell temperature, and the PV panel type. When considering crystalline silicon (cSi) PV cells, the PV cell temperature affects mainly the open circuit voltage and the irradiance the short circuit current. Different PV cell technologies affect mostly the shape of the PV panel I–V curve, and in some cases have a totally different temperature response, but the current stays proportional to the irradiance. The number, configuration, and I–V curves of individual PV panels define the collective I–V curve of the PV generator. The nominal power of a PV panel is defined in standard test conditions (STC) with an irradiance of 1000 W/m2, a PV cell temperature of 25 °C, and an air mass of 1.5. The irradiance affecting the PV panel depends, for example, on the time of the day and year, cloud coverage, and orientation of the PV panel. The operating temperature of the PV panel is affected by ambient temperature, wind speed and direction, irradiance, mounting, and several other factors. Various models have been developed to estimate the PV panel operating temperature [7]. Under static operating conditions, there is a clear correlation between the irradiance and the operating temperature [8]. Under high irradiance conditions, the operating temperature can be considerably higher than the ambient temperature. Therefore, the nominal operating cell temperature (NOCT) gives a better picture of the actual PV panel performance. The NOCT is defined as the temperature of open circuited cells in a panel assuming 800 W/m2 irradiance, 20 °C ambient temperature, and wind speed of 1 m/s, with the PV panel at a tilt angle of 45°.
In practice, the operating conditions can change fast, but due to the thermal mass of the PV panel, changes in operating conditions are not immediately seen in the PV cell temperature [9,10]. On partly cloudy days, the irradiance has fast fluctuations, and due to the CE phenomenon, the irradiance affecting the PV generator can occasionally exceed the clear sky irradiance. Because overirradiance events are often associated with partly cloudy weather, it is possible that an overirradiance event is preceded by a shade period lasting for several minutes, so that the PV cell temperature is only slightly above the ambient temperature. Therefore, the maximum power point (MPP) power can be considerably higher than the nominal MPP power in STC, and even higher relative to the MPP power in NOCT conditions.
When a PV generator is connected to the power grid, an inverter is needed to transform the DC power from the PV generator to AC power. When the inverter is operating in maximum power point tracking (MPPT) mode, it tries to maximize the energy yield by operating the PV generator in its MPP. The operating point of the PV generator must be inside the safe operating area of the inverter. For single power stage inverters, AC side grid voltage defines the minimum DC side voltage. Maximum DC side voltage is limited by the rated voltage or characteristics of individual components, e.g., IGBTs, fuses, and switches. Maximum AC side current or power sets the upper limit for the DC side power. In some cases, maximum DC side current can further limit the safe operating area. Quite often, the MPPT range is narrower than the DC voltage range of the inverter. If the MPP power is higher than the allowed power, the inverter is operating in power-limiting mode. The PV generator power can be adjusted by controlling its operating voltage. Typically, power limiting is done by increasing the operating voltage, which reduces the current, and consequently, the power. The operating voltage affects the operation of the inverter and its efficiency. Typically, the conversion efficiency of single-power-stage inverters decreases with increasing DC side voltage. If the voltage increase is due to power limiting, it does not affect the energy yield, but it might affect the operating temperature and lifetime of certain components. For example, the DC side voltage affects the lifetimes of DC link capacitors [11] and the thermal losses of IGBTs [12].
The CE phenomenon itself is well known, and there are numerous publications of irradiance measurements from different geographic locations, e.g., Eastern Mediterranean [13], Norway [14], and Brazil [15]. Typically, the publications on the CE phenomenon report single point irradiance measurements, and therefore, the results cannot be directly applied to PV generators spread on large land areas. However, if the cloud shadow speeds are known, single point irradiance measurements can be used to estimate the operation of the PV generator to some extent [16]. The spatial extent of the phenomenon has been covered in some papers. For example, [5] used irradiance data from an array of pyranometers to analyze the P–V characteristics of a utility-scale PV generator affected by overirradiance events. In [6], the effect of overirradiance events by using irradiance and PV panel temperature data was used to analyze the energy losses of a PV panel operating in partly cloudy conditions when different DC-to-AC power ratios were assumed. The abovementioned papers briefly discussed the operation of the inverter during the overpower events and power limiting. However, the analysis was only cursory. The effect of CE events and power limiting to operating voltage was covered in [17] by analyzing operational data of a PV generator with different DC-to-AC power ratios, but the presentation of the results was not systematic and the paper focused on the analysis of energy yields.
Despite several publications on the topic, the effects of overirradiance events on PV systems have not been systematically studied previously. The goal of this paper is to study the overpower events caused by the CE phenomenon, and how the overpower events affect the operation of the PV generator and the inverter. The novelty is the analysis of the occurrence and duration of the overpower events as a function of the magnitude of the MPP power of the PV generator in Northern Europe, and how the overpower events affect the operation of the PV generator and the solar inverter with various DC-to-AC power ratios due to power curtailment. The analysis was done by using Matlab (R2019a, MathWorks, Natick, MA, USA) to simulate the operation of a 31.9 kW PV generator by using irradiance data from an array of pyranometers and temperature measurement data from the backside of a PV panel during the overirradiance events. We recognized the overpower events taking place during a 320-day observation period and analyzed their magnitude, duration, and occurrence. The maximum duration of the overpower events can be several minutes, but the mean duration is of the order of ten seconds. The strongest overpower events required periods of relative cool ambient temperatures or, alternatively, long shade periods before the overirradiance event to cool down the PV panels. To study the operation of the PV power plant during the overpower events, we also applied different static power limits for the power plant operation to analyze the increase of the operating voltage. On partly cloudy days, the operating voltage can even exceed the nominal open circuit voltage of the PV generator due to the combined effect of a cloud enhancement event of irradiance and low PV cell temperature—especially, if the PV generator is oversized in comparison to the inverter power.
The structure of the paper follows: Section 2 presents the measurement setup and the simulation models; Section 3 presents and discusses the operating conditions during the overpower events, the occurrence, duration, and power of the overpower events, and the effect of the overpower events to the operation of the PV generator and the solar inverter; and Section 4 summarizes the results.

2. Methods

2.1. Measurement Data

This study is based on irradiance measurements from an array of pyranometers and ambient and PV panel temperature measurements. The measurements were done at the solar PV research power plant at the rooftop of Tampere University in Finland in Northern Europe [18]. The data were collected between 1 May and 31 August from 2016 to 2018. The solar noon at the research plant is approximately 12:25 (UTC + 2), but because the power plant and PV panels are facing 23° east from due south, the panels are facing the sun around 11:20. Because of nearby trees and building structures, some of the irradiance sensors are shaded during early morning hours. The locations of the PV panels, the dimensions of the PV generator, and the locations of the pyranometers and the temperature sensor are presented in Figure 1.
Figure 2 presents the installation arrangement of the PV panels and location of one of the pyranometers. The PV panels are installed at a fixed 45° tilt angle. The irradiance was measured with photodiode-based pyranometers (Kipp & Zonen SP Lite 2), which were mounted to the frames of the PV panels. Because the pyranometers have fast response time (<500 ns to 90%), wide measurement range (up to 2000 W/m2), and high sampling frequency (10 Hz), the irradiance measurement data are well-suited when simulating the actual operation of a PV generator. The temperature of the PV panel was measured with a PT100 thermocouple pressed against the backside of the PV panel, providing the PV cell temperature with good accuracy. The gap between the PV panel front end and the rooftop is small, which reduces the cooling of the PV panels on windy days. The ambient temperature sensor (HMP155, Vaisala, Vantaa, Finland) was mounted on a pole a few meters above the rooftop in the center of the research power plant.
By using the linear interpolation method of Matlab’s griddata function to estimate the irradiance between the pyranometers, it is possible to create detailed images of the irradiance profile to analyze the movement of the cloud shadows. Figure 3 presents six irradiance profiles with two second intervals on the rooftop of Tampere University during an overirradiance event. The land area of the irradiance profile presented is approximately 1400 m2, i.e., on average there is one pyranometer per 60 m2. The movement of the overirradiance area is clearly visible, and the preceding cloud shadow had a clear and linear edge, which is not always the case. The irradiance varies a lot between different parts of the rooftop, causing potential mismatch losses depending on the configuration of the PV generator.

2.2. PV Panel Model

The analysis is based on a simulation model of the PV panel (NP190GKg, Naps, Helsinki, Finland). We used the single diode model to calculate the relationship between the current I and voltage V
I = I L I 0 ( exp ( q ( V + I R S ) A N S k B T ) 1 ) V + I R S R SH ,
where IL is photocurrent, I0 dark saturation current, q elementary charge, RS series resistance, RSH shunt resistance, A diode ideality factor, NS number of cells, kB Boltzmann constant, and T temperature. Table 1 presents the parameter values and their temperature dependency used in the simulations. The NP190GKg PV panel has the typical characteristics of polycrystalline silicon PV cell technology.

2.3. PV Generator Model

Based on the simulation model of one PV panel, we created a model of a PV generator consisting of seven parallel connected strings each having 24 series connected NP190GKg PV panels. The nominal open circuit voltage of the PV generator is 794 V, the short circuit current 56.1 A, and the MPP power 31.92 kW. The PV generator is square shaped, the side length is 20 m, and the PV panels are evenly distributed over the land area. The configuration of the PV panels and the location of the PV generator on the rooftop of Tampere University is presented on top of an irradiance profile example in Figure 4. The irradiance on a single PV panel was assumed to be uniform, and the same as at the center of the PV panel. The temperature of all the PV panels was assumed to be the same. This is a valid assumption because due to the small size of the PV generator, all PV panels are exposed to almost the same irradiance conditions during the day, even momentarily. In practice, the panels near the edges of the PV generator might have lower operating temperatures than the panels in the central region because of stronger cooling due to the wind leading to slightly higher MPP power.

2.4. Power Limiting and Inverter Model

The MPPT algorithm was assumed to be ideal, i.e., the operating point of the PV generator is always on the MPP, or in case of power limiting, on the right-hand side of the global MPP on the first possible occasion when the PV generator power equals the power limit. Even though the MPPT algorithms are relatively slow to follow the MPP, the control loops that limit the operating power or current are fast to react to overpower events, and therefore, assuming an ideal MPPT algorithm should not unduly affect the results. One consequence of using the ideal MPPT algorithm is that the operating point shifts fast compared to real MPPT applications between two or more voltage levels during partial shading conditions when there are more than one MPP.
Oversizing the PV generator power in comparison to the inverter power brings many operational and economic benefits, e.g., more stable grid feeding power and better utilization of all AC side components. Therefore, we included DC-to-AC power ratio as one parameter in the simulations. The effect of power limiting to the operating voltage of the PV generator was studied by keeping the PV generator configuration the same and varying the inverter power limit so that the DC-to-AC power ratio varied between 1.0 and 2.0.

3. Results

3.1. Operating Conditions

Figure 5 presents the occurrence of irradiance versus the PV cell temperature and versus the difference between the PV cell and the ambient temperature in one PV panel during the 320-day observation period. The resolution for measured irradiance is 0.25 W/m2 and for temperature 0.25 °C. In Figure 5a, the PV cell operating temperature exceeds the STC temperature of 25 °C frequently, even though the measurement site is in a moderately cool environment. The maximum PV cell temperature was 67.5 °C and the typical temperature during clear sky periods was 40–60 °C. A correlation between the increase of the PV cell temperature with respect to the ambient temperature and the irradiance is clearly visible in Figure 5b. The PV cell temperature increases on average by 1 °C as the irradiances increases by 30 W/m2. During the peak production hours with long, clear sky periods, the operating temperature of the PV panel is 25–35 °C higher than the ambient temperature. However, on partly cloudy days, high irradiance values can be observed when the PV cell temperature is low, and vice versa. This is due to the thermal mass of the PV panel, which is why the PV cell temperature does not immediately follow fast fluctuations in irradiance. Under typical stable diffuse irradiance of 200 W/m2, the PV cell temperature is only 5–10 °C above the ambient temperature. Therefore, if an overirradiance event is preceded by a long shade period, the PV cell temperature can drop close to the ambient temperature and a sudden increase in irradiance does not immediately affect the PV cell temperature. This kind of occurrence will further increase the PV panel output power up to 10% on top of the effect of overirradiance, since the panel efficiency (voltage) increases with decreasing temperature.
The probability density distribution of the MPP power of the studied PV generator is shown in Figure 6. For the analysis, we included only the operating points where the MPP power is more than 5% of the PV generator nominal power. The MPP power probability density plot has two distinct peaks: first in a low power region due to early morning, late evening, and shade periods; and second at 0.75 p.u., which is due to clear sky periods during peak production hours. The MPP power exceeds the nominal STC power only 0.46% of the time and the maximum MPP power is 1.42 p.u. (45.2 kW) due to the cloud enhancement phenomenon. With a DC-to-AC power ratio of 1.0, the system is operating in power-limiting mode only due to the overpower events, but with increasing DC-to-AC power ratio, power limiting becomes more frequent.

3.2. Overpower Events

An overpower event was defined to start when the MPP power exceeded a certain reference power and to end when the MPP power dropped below that power. We analyzed a range of reference power values exceeding the PV generator nominal STC power, recognized all the events where the MPP power exceeded the reference power value and calculated the durations of each individual event. The different reference power values were analyzed independently from each other. For example, if a certain overpower event exceeded both 1.1 p.u. and 1.2 p.u. reference power values, the event was counted as one overpower event for both reference power values with possibly a slightly different event duration. In addition, different overpower events were analyzed independently from each other. For example, if the MPP power was fluctuating around the reference power, all the events where the MPP power exceeded the reference power value were calculated as separate events, no matter how short the duration between the events, or how much the MPP power was below the reference power between the events. Simplistically, the analyses of the overpower events tell how many times and how long the MPP power of the PV generator exceeded a certain power value. We chose this simple method because a similar method was used with success in [4] to calculate the average irradiance during overirradiance events.
Figure 7 presents the number of overpower events as a function of power during the observation period. The number of overpower events decreases fast with increasing power. The number of overpower events exceeding 1.1 p.u. was approximately 1000, exceeding 1.2 p.u. around 100, exceeding 1.3 p.u. less than 10, and exceeding 1.4 p.u. only 2. Because the overpower events were counted by comparing the instantaneous power to set reference power, the MPP power can be higher during an overpower event than the reference power. Therefore, there can also be two or more separate power peaks of higher power than the reference power during an event, and consequently, the number of observed overpower events can increase when the reference power increases, which can be seen at high powers in Figure 7. This is because the MPP power can fluctuate so that when the set power reference is, e.g., 1.0 p.u., the MPP power remains above the power reference value for the duration of the CE event. However, increasing the power reference changes the analysis so that during the same CE event, the MPP power can briefly drop below the power reference value, and therefore, the same CE event causes now two or more overpower events depending on the power reference value.
The duration of overpower events exceeding a certain power value as compared to the nominal power in STC is presented Figure 8. Maximum, mean, and median duration of the overpower events decrease with increasing power value. Overpower events can last for several minutes, but the average duration is only some seconds. This is in line with the previously published results on overirradiance events [3,4]. The steplike behavior of the maximum duration curve is due to single overpower events, which have the longest duration within certain power ranges. The increase in mean and median durations at high power is due to one long-lasting event out of two to four events.
When reflecting Figure 7 and Figure 8 against the average irradiance received by the PV generator, the results are directly valid for PV generators up to 100 kW in size [4]. This is because the diameter of such PV generators is small when compared to the diameters of the enhanced irradiance areas. The number of the overirradiance events decreases slightly with increasing PV generator land area, but the distribution of the event durations is almost the same. The results are valid also for similar climatic conditions, e.g., Middle or North Europe. When the power of the PV generator increases from 100 kW, its land area might not be fully covered by the areas of the enhanced irradiance. In addition, the larger the PV generator, the more possible configurations there are, and the assumption of uniform operating temperature might not be fully valid. When considering PV systems with one or two axis trackers, the results are not directly applicable because the tracking would affect the number and the magnitude of the overpower events.
Figure 9 presents the maximum (100%), 90%, 50%, 10%, and minimum (0%) percentile values of the ambient temperature, the cell temperature, and the difference between the cell and ambient temperature as a function of PV generator power. The maximum ambient and PV cell temperatures, and especially their difference, have a decreasing trend with increasing power value, as is the case also for the 10% and 50% percentiles. The reason for this is that the PV panel efficiency increases with decreasing temperature of PV cells caused by a decreasing ambient temperature and decreased heating of the panel during shade periods before the enhanced irradiance events. Vice versa, the minimum temperatures increase with increasing power in line with Figure 5. This is related to the fact that the ambient temperature naturally rises as the irradiance increases and the highest irradiance enhancements occur at times when the clear sky irradiance is also high. The enhancement of irradiance alone can boost the MPP power, which can be observed as the relatively high maximum and 90% percentile values of the PV cell and the PV cell and ambient temperature difference on the lower end of the Figure 9. However, the highest PV generator power levels are occurring when the PV cell and ambient temperature difference is small, i.e., after the shade periods. This is because the cloud enhancement events have a practical upper irradiance limit, but the PV cell temperature can vary within a wide range. Therefore, the temperature of PV cells must also reach a practical lower limit for the PV generator to reach its maximum power.
An example of the PV cell temperature dependence on irradiance is shown in Figure 10. During this period of 40 min, the ambient temperature is approximately constant, but the PV cell temperature has strong fluctuations caused by irradiance fluctuations. During high irradiance periods starting at 11:49 and 12:02, the PV cell temperature increases approximately 2 °C per minute. During the shade periods starting at 11:55 and 12:05, the PV cell temperature decreases approximately 1 °C per minute and drops almost 8 °C. With the polycrystalline PV cell, an 8 °C drop in temperature translates to an increase in efficiency (power) of about 4%. Longer shade periods will cause the PV cell temperature to fall further below 20 °C, in accordance with Figure 5b.

3.3. Operating Voltages

Applied power limits of the PV system do not affect the I–V characteristics of a PV generator, so the open circuit voltage sets the upper limit for the operating voltage. Figure 11 presents the probability density of the open circuit and MPP voltages of the PV generator normalized to the nominal open circuit STC voltage when the MPP power was more than 5% of the nominal STC power. Most of the time, the operating temperature is higher, and the irradiance is lower than the corresponding STC values, and therefore, the average open circuit voltage is only 0.91 p.u. and the average MPP voltage is only 0.73 p.u. The probability density distribution of the open circuit voltage has a tail on the right-hand side, denoting that events causing high operating voltages are occurring but only seldom. The open circuit voltage was above the nominal STC value only 0.3% of the operating time and the maximum value was 1.063 p.u. The maximum MPP voltage was 0.917 p.u., meaning that the operating point voltage was then high close to the open circuit STC voltage when the inverter was operating in a power-limiting mode.
Figure 12 presents the probability density distributions of the operating voltage for different DC-to-AC power ratios when the MPP power was more than 5% of the nominal STC power. The operating voltage shifts to higher voltages with increasing DC-to-AC power ratio. This is because with increasing DC-to-AC power ratio, the PV system operates for longer periods of time in the power-limiting mode at higher operating voltages. Figure 13 presents the high-end operating voltage percentiles as a function of DC-to-AC power ratio. For example, the maximum operating voltage (100% percentile) is the highest observed operating voltage during the studied 320 days for an inverter with a set DC-to-AC power ratio. The maximum operating voltage increases fast with increasing DC-to-AC power ratio at low DC-to-AC ratios, but only slightly at high ratios. This is due to the P–V curve shape—when operating near the MPP area, a considerable increase of the reference voltage is needed to curtail the output power but, when operating already at high voltages close to the open circuit voltage, a small increase in the operating voltage can drastically decrease the power. The other high-end percentiles of the operating voltage behave the same way due to the same reasons, only at much lower voltages. In Nordic climatic conditions, the operating voltage can occasionally exceed the nominal open circuit voltage when the DC-to-AC power ratio is 1.6 or more. In [19], it was suggested that in similar operating conditions and for small PV systems it is economically feasible to have high DC-to-AC power ratio. Therefore, the varying operating conditions must be taken into consideration when designing the PV generator and choosing the inverter.
Figure 14 presents the operating and MPP power and voltage of a PV power plant with a DC-to-AC power ratio of 1.2 during the same partly cloudy period as presented in Figure 10. The power is normalized to the nominal STC power and the voltage to the nominal STC open circuit voltage of the PV generator. When comparing the MPP power to the irradiance in Figure 10, it can be observed that the power and irradiance profiles are not quite the same since the varying PV cell temperature affects the efficiency of PV panels. PV panel efficiency and, thereby, MPP power decreases with increasing PV cell temperature and vice versa. The effect of varying PV cell temperature can be seen also in the MPP voltage as well as in the operating voltage when the system is operating in power-limiting mode. Both voltages are significantly reduced due to increasing PV cell temperature. When the inverter enters the power-limiting mode after a shade period, there is a fast increase in the operating voltage. The power-limiting mode and the shape of the P–V curve explains the behavior of the high-end percentiles shown in the Figure 13.

4. Conclusions

We analyzed the overpower events of PV systems caused by enhanced irradiance due to cloud enhancement phenomenon during a 320-day observation period. PV panel temperature data and irradiance measurements from 21 pyranometers were used to simulate the operation of a 33.1 kW PV generator on the rooftop of Tampere University. We recognized the overpower events caused by the enhanced irradiance, calculated their magnitude, occurrence and duration, and analyzed their operating conditions. Finally, we analyzed the operation of the PV power plant during the overpower events.
The MPP voltage and power of the PV generator are affected by the temperature of the PV cells, which is almost linearly dependent on the irradiance. However, due to the thermal mass of the PV panel, the change in operating temperature is slow in comparison to the changes in irradiance. Therefore, if an overirradiance event is preceded by a long shade period, the PV cell temperature can drop near the ambient temperature. The enhancement of the irradiance increases the PV generator power, but to achieve the highest PV generator power, the cooling of the PV panels was found the be a prerequisite. While on clear sky days, the PV cell temperature is 25–35 °C higher than the ambient temperature; on partly cloudy days the PV cell temperature can be less than 10 °C above the ambient temperature after a long shade period before an overirradiance event. This 20 °C temperature drop can increase the efficiency and power of the polycrystalline PV panel by 10%, when compared to the operation of the same PV panel under steady high irradiance conditions.
The occurrence of the overpower events decreases fast with increasing PV generator power. While we observed 1000 separate events exceeding the PV generator power of 1.1 p.u., the number of events exceeding 1.2 p.u. was 100, and exceeding 1.3 p.u. only 10. The peak power of the simulated PV generator was 1.42 times the nominal STC power. While the maximum duration of the overpower events can be several minutes, the mean duration of typical overpower events is 10 to 20 s, and median duration only some seconds. The duration of the strongest overpower events is only some seconds, as the focus areas of the corresponding overirradiance events are only tens of meters in diameter.
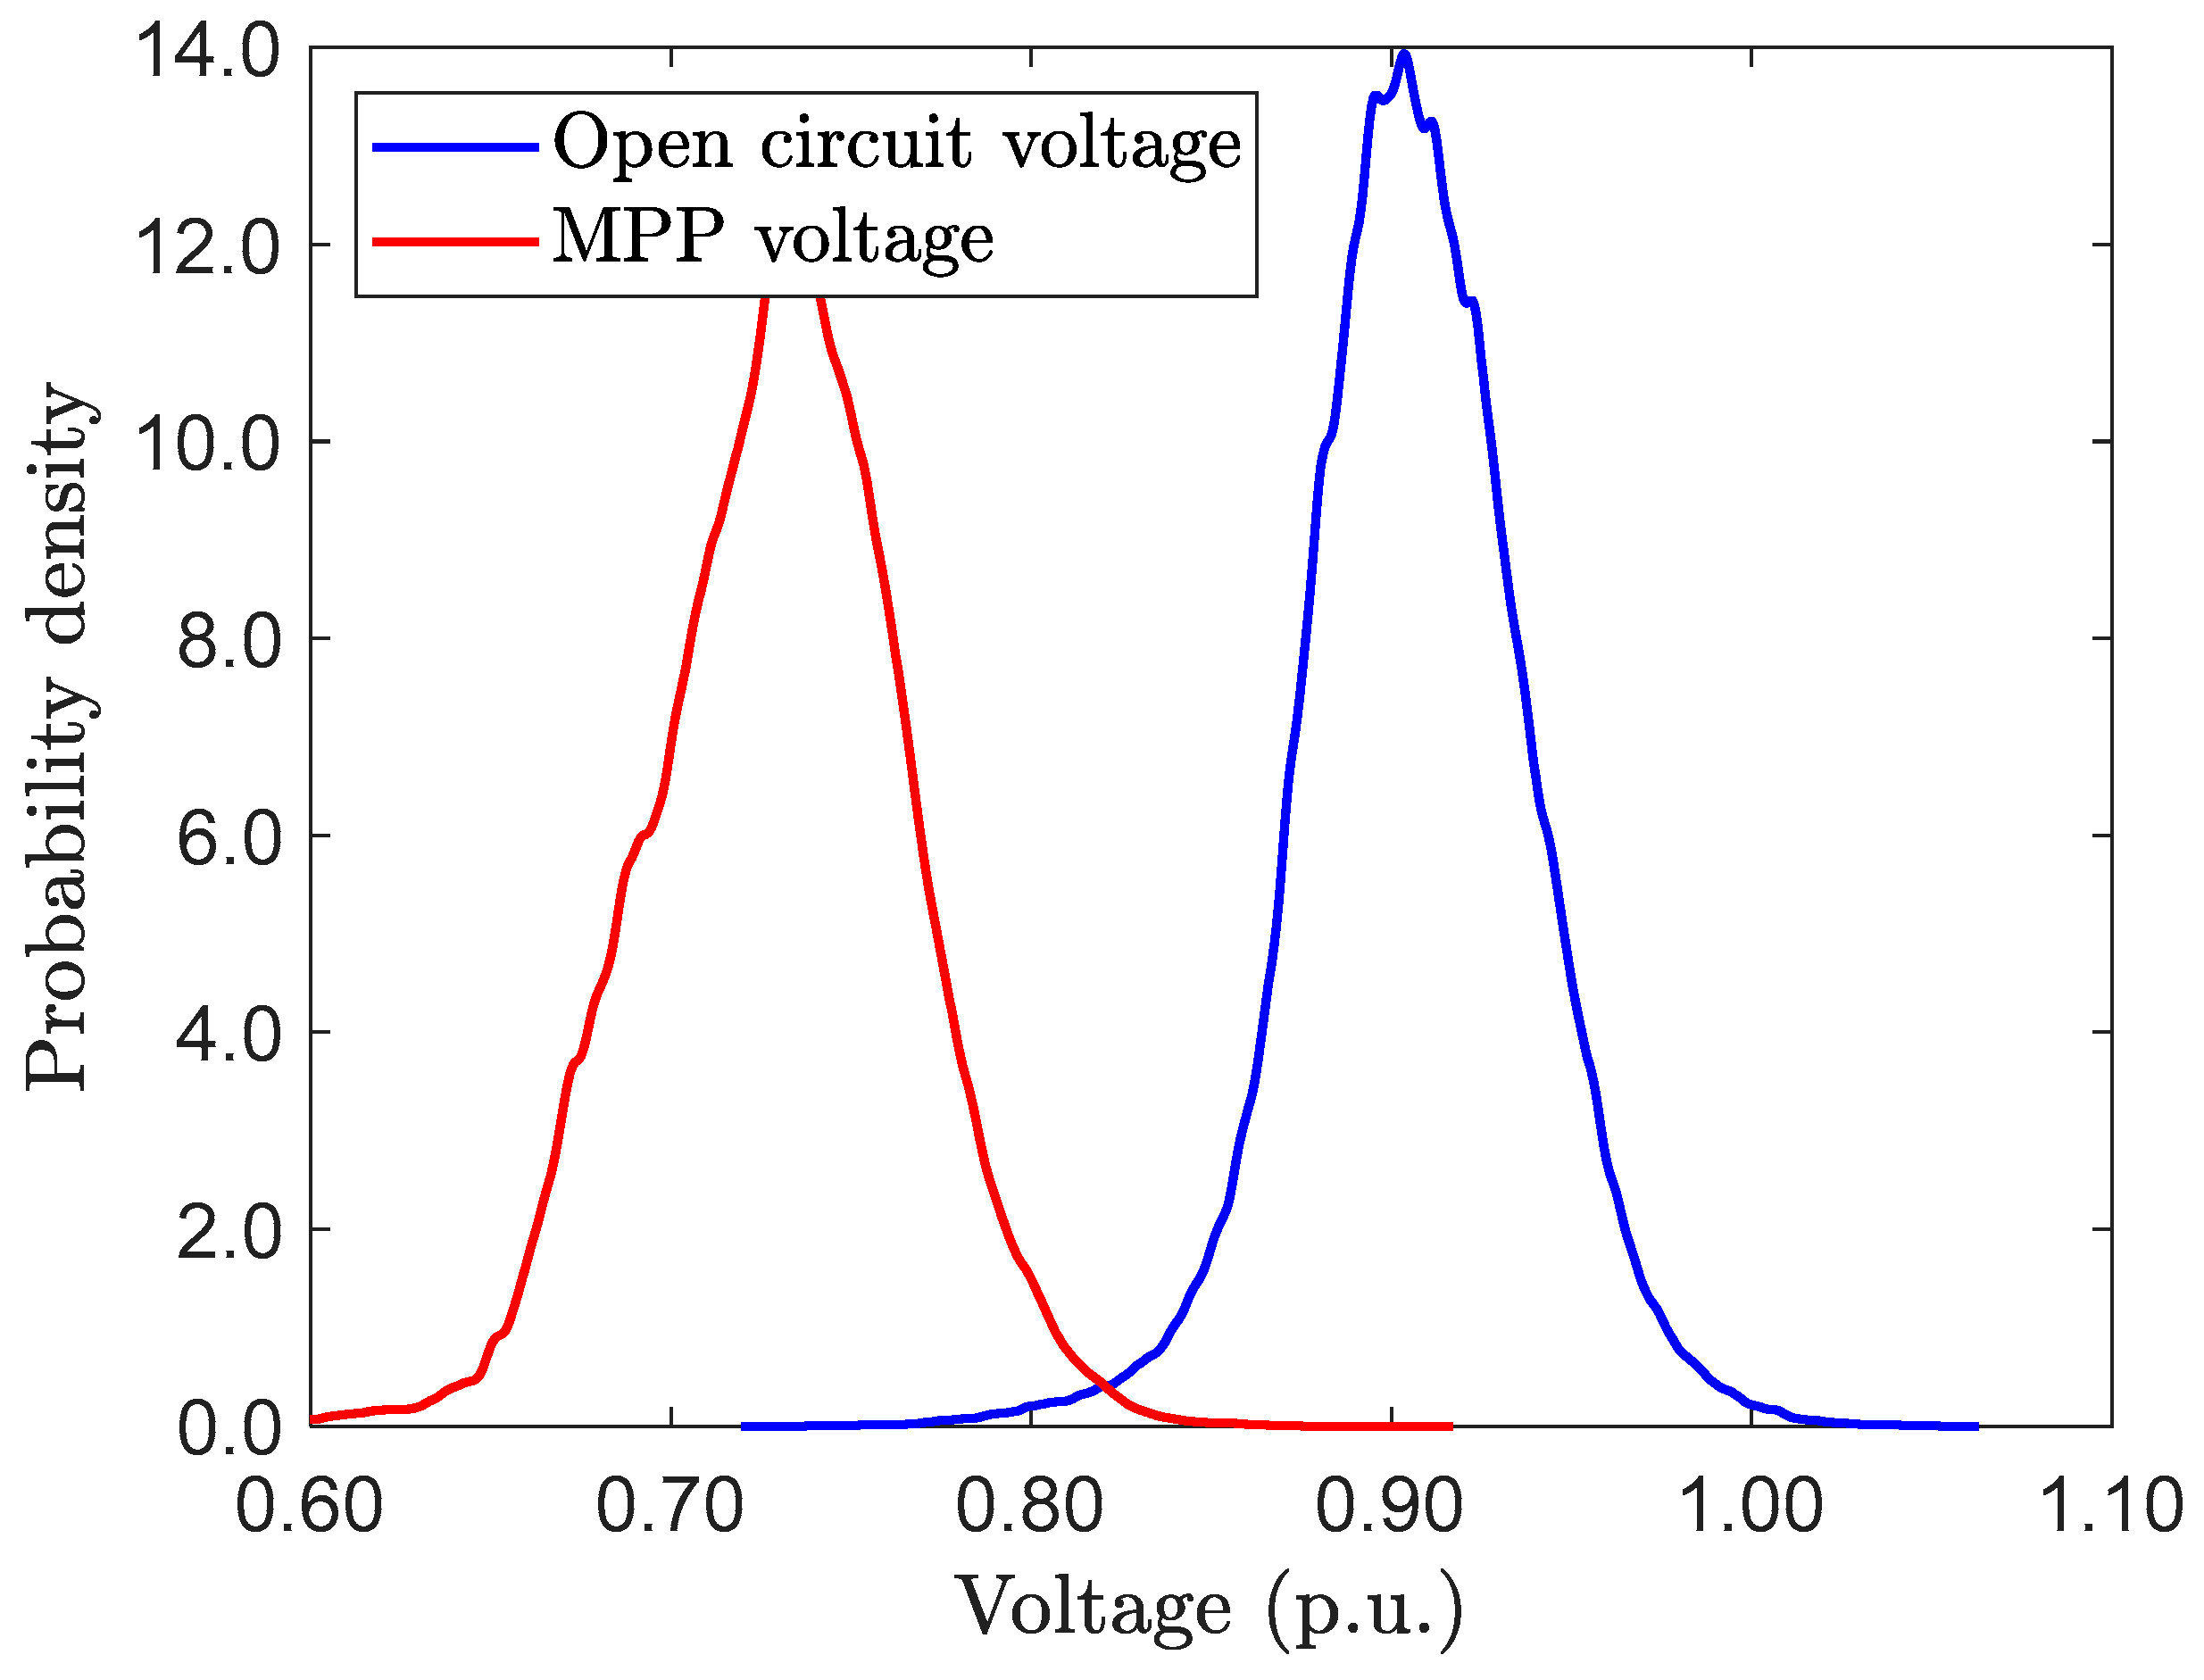
During the overpower events, the PV system is operating in power-limiting mode. This increases the operating voltage considerably during the events, but the total duration of the overpower events is so short that the effect on the average operating voltage is marginal. However, the increase of the DC-to-AC power ratio increases the time the system is operating in power-limiting mode. At first, the maximum operating voltage increases fast with increasing DC-to-AC power ratio, but after a certain point, further increase of the DC-to-AC power ratio does not affect the maximum operating voltage much. This is because the open circuit voltage of the PV generator is ultimately setting the upper limit for the operating voltage.

Author Contributions

M.J. performed the simulations. M.J. and S.V. both participated in the analysis of the results and writing of the paper. All authors have read and agreed to the published version of the manuscript.

Funding

This work was funded by Business Finland.

Conflicts of Interest

Conflicts of interest do not exist.

References

  1. Gueymard, C.A. Cloud and albedo enhancement impacts on solar irradiance using high-frequency measurements from thermopile and photodiode radiometers. Part 1: Impacts on global horizontal irradiance. Sol. Energy 2017, 153, 755–765. [Google Scholar] [CrossRef]
  2. Järvelä, M.; Lappalainen, K.; Valkealahti, S. Cloud Enhancement Phenomenon and Its Effect on PV Generators. In Proceedings of the 35th European Photovoltaic Solar Energy Conference and Exhibition, Brussels, Belgium, 24–28 September 2018; pp. 1964–1968. [Google Scholar]
  3. Yordanov, G.H.; Midtgård, O.-M.; Saetre, T.O.; Nielsen, H.K.; Norum, L.E. Overirradiance (Cloud Enhancement) Events at High Latitudes. IEEE J. Photovolt. 2013, 3, 271–277. [Google Scholar] [CrossRef]
  4. Järvelä, M.; Lappalainen, K.; Valkealahti, S. Characteristics of the cloud enhancement phenomenon and PV power plants. Sol. Energy 2020, 196, 137–145. [Google Scholar] [CrossRef]
  5. Zehner, M.; Weigl, T.; Thaler, S.; Schrank, O.; Czakalla, M.; Mayer, B.; Betts, T.R.; Gottschalg, R.; Behrens, K.; Langlo, G.K.; et al. Energy Loss Due to Irradiance Enhancement. In Proceedings of the 26th European Photovoltaic Solar Energy Conference and Exhibition, Hamburg, Germany, 5–11 September 2011; pp. 3935–3938. [Google Scholar]
  6. Weigl, T.; Nagl, L.; Weizenbeck, J.; Zehner, M.; Augel, M.; Öchsner, P.; Giesler, B.; Becker, G.; Mayer, O.; Betts, T.; et al. Modelling and Validation of Spatial Irradiance Characteristics for Localised Irradiance Fluctuations and Enhancements. In Proceedings of the 27th European Photovoltaic Solar Energy Conference and Exhibition, Frankfurt, Germany, 24–28 September 2012; pp. 3801–3804. [Google Scholar]
  7. Skoplaki, E.; Palyvos, J.A. Operating temperature of photovoltaic modules: A survey of pertinent correlations. Renew. Energy 2009, 34, 23–29. [Google Scholar] [CrossRef]
  8. Koehl, M.; Heck, M.; Wiesmeier, S.; Wirth, J. Modeling of the nominal operating cell temperature based on outdoor weathering. Sol. Energy Mater. Sol. Cells 2011, 95, 1638–1646. [Google Scholar] [CrossRef]
  9. Tsai, H.-F.; Tsai, H.-L. Implementation and verification of integrated thermal and electrical models for commercial PV modules. Sol. Energy 2012, 86, 654–665. [Google Scholar] [CrossRef]
  10. Torres-Lobera, D.; Valkealahti, S. Inclusive dynamic thermal and electric simulation model of solar PV systems under varying atmospheric conditions. Sol. Energy 2014, 105, 632–647. [Google Scholar] [CrossRef]
  11. Hasegawa, K.; Tsuzaki, K.; Nishizawa, S. DC-bias-voltage dependence of degradation of aluminum electrolytic capacitors. Microelectron. Reliab. 2018, 83, 115–118. [Google Scholar] [CrossRef]
  12. Miao, Y.; Lei, W.; Li, S.; Lv, X.; Li, B.; Wang, P.; Xu, J.; Li, H. Influence of inverter DC voltage on the reliability of IGBT. AIP Conf. Proc. 2018, 1967, 020023. [Google Scholar]
  13. Tapakis, R.; Charalambides, A.G. Enhanced values of global irradiance due to the presence of clouds in Eastern Mediterranean. Renew. Energy 2014, 62, 459–467. [Google Scholar] [CrossRef]
  14. Yordanov, G.H.; Saetre, T.O.; Midtgård, O.M. Extreme overirradiance events in Norway: 1.6 suns measured close to 60° N. Sol. Energy 2015, 115, 68–73. [Google Scholar] [CrossRef]
  15. de Andrade, R.C.; Tiba, C. Extreme global solar irradiance due to cloud enhancement in northeastern Brazil. Renew. Energy 2016, 86, 1433–1441. [Google Scholar] [CrossRef]
  16. Luoma, J.; Kleissl, J.; Murray, K. Optimal inverter sizing considering cloud enhancement. Sol. Energy 2012, 86, 421–429. [Google Scholar] [CrossRef]
  17. Macêdo, W.N.; Zilles, R. Operational results of grid-connected photovoltaic system with different inverter’s sizing factors (ISF). Prog. Photovolt. Res. Appl. 2007, 15, 337–352. [Google Scholar] [CrossRef]
  18. Torres Lobera, D.; Mäki, A.; Huusari, J.; Lappalainen, K.; Suntio, T.; Valkealahti, S. Operation of TUT solar pv power station research plant under partial shading caused by snow and buildings. Int. J. Photoenergy 2013, 1–13. [Google Scholar] [CrossRef]
  19. Väisänen, J.; Kosonen, A.; Ahola, J.; Sallinen, T.; Hannula, T. Optimal sizing ratio of a solar PV inverter for minimizing the levelized cost of electricity in Finnish irradiation conditions. Sol. Energy 2019, 185, 350–362. [Google Scholar] [CrossRef]
Figure 1. The dimensions of the PV generator and the locations of the PV panels (blue rectangles), pyranometers (yellow triangles), PV panel temperature sensor (red dot), and the ambient temperature sensor (green square) on the rooftop of Tampere University (TAU).
Energies 13 02185 g001
Figure 2. PV panel mounting and the pyranometer.
Energies 13 02185 g002
Figure 3. Irradiance profile of a leading edge of an overirradiance area moving approximately from north to south on the rooftop of Tampere University on 11 June 2016.
Energies 13 02185 g003
Figure 4. The dimensions and configuration of the PV generator, and its location on the rooftop.
Energies 13 02185 g004
Figure 5. Occurrence of (a) irradiance and PV cell temperature Tcell, and (b) irradiance and the difference between Tcell and the ambient temperature Tambient during the observation period in one PV panel.
Energies 13 02185 g005
Figure 6. The probability density distribution of the maximum power point (MPP) power of the PV generator normalized to the 31.9 kW standard test conditions (STC) power during the observation period.
Energies 13 02185 g006
Figure 7. The number of overpower events as a function of power during the observation period when the power of the PV generator exceeds that power value.
Energies 13 02185 g007
Figure 8. Maximum, mean, and median durations of overpower events caused by overirradiance events exceeding the power value.
Energies 13 02185 g008
Figure 9. Maximum (100%), 90%, 50%, 10%, and minimum (0%) percentile values (from top to bottom) of the ambient temperature, the PV panel temperature, and the temperature difference between the PV panel and the ambient air during the overpower events, as a function of PV generator power.
Energies 13 02185 g009
Figure 10. An example of irradiance, and ambient and PV cell temperatures during a partly cloudy period.
Energies 13 02185 g010
Figure 11. Probability density distributions of the MPP and open circuit voltages of the PV generator during the observation period.
Energies 13 02185 g011
Figure 12. The probability density distributions of the operating voltage for DC-to-AC power ratios between 1.0 and 2.0 with a step of 0.1 during the observation period.
Energies 13 02185 g012
Figure 13. Operating voltage percentiles as a function of DC-to-AC power ratio.
Energies 13 02185 g013
Figure 14. The MPP and operating point power and voltage of a PV power plant with a DC-to-AC power ratio of 1.2 during a partly cloudy period.
Energies 13 02185 g014
Table 1. Electrical characteristics of the NP190GKg PV panel in STC.
ParameterUnitValue
Series resistance, RSOhm0.3
Shunt resistance, RSHOhm177
Diode ideality factor, A 1.3
Cells in series, NSPcs.54
Short circuit current, ISCA8.02
Open circuit voltage, VOCV33.1
Nominal power, PNOMW190
MPP voltage, VMPPV29.9
MPP current, IMPPA6.35
Temperature coefficient of VOCV/°C−0.1242
Temperature coefficient of ISCA/°C0.0047

