Abstract
Research on the development of plants grown for energy purposes is important for ensuring the global energy supply and reducing greenhouse gas emissions, and simulation is an important method to study its potential. This paper evaluated the marginal land that could be used to grow sugarcane in the Guangxi Zhuang Autonomous Region. Based on the meteorological data from 2009 to 2017 in this region and field observations from sugarcane plantations, the sensitivity of the APSIM (Agricultural Production Systems sIMulator) model parameters was analyzed by an extended Fourier amplitude sensitivity test, and the APSIM model was validated for sugarcane phenology and yields. During the process of model validation, the value of the determination coefficient R2 of the observed and simulated values was between 0.76 and 0.91, and the consistency index D was between 0.91 and 0.97, indicating a good fit. On this basis, the APSIM sugarcane model was used to simulate the sugarcane production potential of the marginal land on a surface scale, and the distribution pattern of sugarcane production potential in the marginal land was obtained. The simulation results showed that if sugarcane was planted as an energy crop on the marginal land in Guangxi, it would likely yield approximately 42,522.05 × 104 t of cane stalks per year. It was estimated that the sugarcane grown on the marginal land plus 50% of the sugarcane grown on the cropland would be sufficient to produce approximately 3847.37 × 104 t of ethanol fuel. After meeting the demands for vehicle ethanol fuel in Guangxi, 3808.14 × 104 t of ethanol fuel would remain and could be exported to the ASEAN (Association of Southeast Asian Nations).
1. Introduction
Since 2011, China has been the largest energy consumer in the world. Due to the rapid growth of its population and GDP (gross domestic product), the foreign dependence rates for oil and natural gas are approximately 61% and 33%, respectively [1]. The long-term exploitation and utilization of fossil energy in China, especially coal and oil, has caused a large amount of greenhouse gas emissions, which will inevitably impact the ecological environment in China and that of the rest of the world [2]. Therefore, China will face two major problems in the future, namely, fossil energy shortages and environmental pollution. To meet energy needs and ensure sustainable development, China is in urgent need of bioliquid fuels, including ethanol liquid fuel [3,4]. However, due to the Sino–US trade war, China has not imported US ethanol fuel since July 2018. The ethanol fuel imports of China are severely constrained, and the demand is high. Therefore, the bioliquid ethanol fuel industry is still the focus of future biomass energy development in China. Since 2007, China has issued a series of policies emphasizing the developmental needs and plans for ethanol fuel from non-grain plants [5,6]. In this context, Guangxi vigorously promotes the industrialization and development of non-grain ethanol fuel plants, such as cassava and sugarcane. Due to its subtropical climate conditions and rich biological resources, Guangxi has been at the forefront of the non-grain biomass energy industry in China. In November 2019, Zhanjiang Customs of Guangdong Province reported that 3062.17 t of ethanol fuel was exported by a bioenergy company to Vietnam and was issued a China-ASEAN (Association of Southeast Asian Nations) Certificate of Origin. China signed the ASEAN Free Trade Agreement in 2002 [7], and this was the first zero-tariff export of Chinese ethanol fuel producers to the international market. As a bridgehead to the ASEAN, the non-grain ethanol fuel industry in Guangxi will be further developed through border trade.
Although the development and utilization of biomass energy in China has started late, its development has been relatively fast. Research on distribution, selection, cultivation, improvement, and processing technology and equipment for biomass energy crops has made great achievements which will benefit the further development of biomass energy in China [8,9,10]. Sugarcane is a high biomass crop, which has many advantages as a biomass energy crop, such as a high yield per unit area, high light energy storage efficiency, and a relatively low processing cost. Therefore, it is necessary to study the production potential and energy efficiency of sugarcane.
Few studies have evaluated the potential bioenergy that can be produced from sugarcane. At present, there are two main methods of sugarcane yield prediction, namely, by remote sensing data combined with a geographic information system (GIS) and secondly by model evaluation. Cervi et al. used a spectral ratio of remote sensing data for vegetation assessment, i.e., the normalized difference vegetation index, in order to estimate the spatial yield of sugarcane [11]. Singels et al. used a land surface energy balance algorithm (SEBAL) to estimate the biomass yield of sugarcane from remote sensing data [12]. Yawson et al. used satellite remote sensing data and geographic information systems to assess sugarcane yield supply potential [13]. These studies only focused on the spatial distribution of potential bioenergy and failed to study the potential effects of land use and climate change. Lisboa et al. developed a prediction model of sugarcane yield based on a normalized difference vegetation index (NDVI) and leaf tissue nutrient concentration data to help the Brazilian sugarcane sector monitor crop yield changes [14]. Based on the statistical analysis of the data, Satiro et al. established a model to predict sugarcane yield from soil properties [15]. Dias et al. used three different sugarcane simulation models (FAO (Food and Agriculture Organization) agroecological Zone, DSSAT (Decision Support System for Agrotechnology Transfer)/CANEGRO and APSIM (Agricultural Production Systems sIMulator) sugarcane) to estimate potential and water-restricted yields and production gaps for 30 locations in Brazil [16]. These studies provide a point-scale accurate estimation of sugarcane yield by establishing mathematical models, but it is difficult to achieve surface-scale simulations. Other researchers have considered land and water properties in order to assess sugarcane growth potential. Rodriguez et al. assessed the potential for biofuel crop expansion by combining the water footprint, water availability, and land availability [17]. Sanches et al. used soil attributes to estimate sugarcane yield, and their research showed that the soil ECa (apparent electrical conductivity) in sugarcane fields when mapped by electromagnetic induction sensors could reflect the potential yield well [18]. However, these studies have failed to consider the sustainable development of bioenergy. The main objective of this paper is to simulate and evaluate the production potential of the sugarcane as an energy crop on the marginal land of the Guangxi Zhuang Autonomous Region by combining an APSIM sugarcane model and GIS spatial analysis technology.
2. Methods and Data
In this study, eight years of meteorological, soil, and field observation data were collected for the APSIM model parameter sensitivity analysis, parameter calibration, and verification and surface scale simulation. See Section 2.2 for details concerning the data. On this basis, the paper first extracts the marginal land suitable for sugarcane cultivation in Guangxi, and then performs parameter sensitivity analysis, parameter calibration, and model validity verification of the APSIM sugarcane model. Then, the APSIM sugarcane model is used to simulate sugarcane production on marginal land on a surface scale. Finally, the distribution of sugarcane production potential on the marginal land in Guangxi is obtained, and the sustainable development of bioenergy from sugarcane is analyzed. The analysis framework for the potential production of bioenergy from sugarcane is shown in Figure 1.
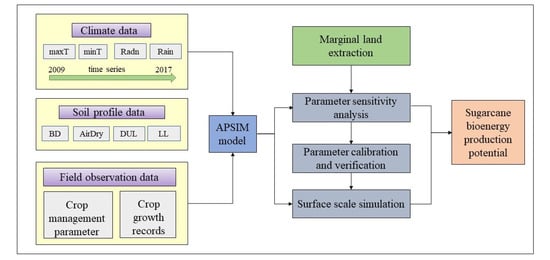
Figure 1.
Analysis framework used in the current study for the potential production of bioenergy from sugarcane. The meanings of the abbreviations maxT, minT, Radn, and Rain refer to the maximum temperature, minimum temperature, solar radiation, and rainfall, respectively. The abbreviations BD, AirDry, DUL, and LL refer to the bulk density, air-dried soil moisture content, field capacity and wilting coefficient, respectively.
2.1. Study Sites
As the region with the highest proportion of sugarcane planting area in China [19], the Guangxi Zhuang Autonomous Region was chosen here to study the growth potential of sugarcane as an energy crop with the APSIM model. The study area is located in Southern China (see Figure 2) and exists at a low altitude and has a subtropical monsoon climate [20]. The area of cultivated land in Guangxi is about 59,724 km2, of which 8864 km2 is planted with sugarcane, and the area of unused land (mainly including shrub forest land, sparse forest land, and grassland) is about 85,938 km2. The introduction of the extraction of marginal land suitable for sugarcane cultivation from unused land is located in Section 2.2.1. In the following research, the existing cultivated and unused land in Guangxi will be combined to analyze the potential of sugarcane as an energy crop.
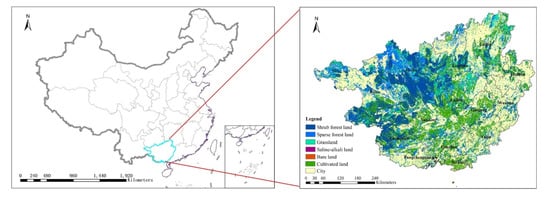
Figure 2.
Geographical location and land cover distribution of the Guangxi Zhuang Autonomous Region.
2.2. Methodology and Data Sources
The data used in this study are the marginal land suitable for sugarcane growth and the inputs for running the APSIM model, including information on the soil, weather, crop variety, and field management.
2.2.1. Marginal Land Data
The Department of Science and Technology of the Ministry of Agriculture of China has defined the marginal land for energy crops as winter fallow fields and wastelands. Suitable wasteland refers to open forest land, natural grassland, shrublands, and unused land that is suitable for cultivating energy crops [21].
The quantity and spatial distribution of land resources that are suitable for growing non-grain ethanol fuel raw sugarcane in China were extracted by a multi-factor comprehensive evaluation method and socioeconomic factor limitation method that considers the growth characteristics of sugarcane. The specific technical methods are as follows [22]:
- (1)
- According to the principle of avoiding biofuel development that competes with people for food and that which competes with grain for land, as issued by the Ministry of Agriculture in 2007, arable land was excluded.
- (2)
- To protect the ecological environment and prevent the destruction of ecosystems, land types such as nature reserves, landscape, historical sites, and protected zones were excluded.
- (3)
- Taking into account the development needs for animal husbandry in China, the high- and medium-coverage grasslands of the five pasture areas in China were excluded.
- (4)
- According to the characteristics of land resources suitable for energy crop development, land use types such as swamp land, water bodies, and construction land were excluded. Land use types suitable for the cultivation of energy crops include shrub forest land, sparse forest land, grassland, mudflats, saline-alkali land, and bare land.
- (5)
- Based on the relevant literature [23], the growth characteristics of sugarcane were analyzed (see Table 1) and an index system of the natural conditions for sugarcane growth was established. Setting the lower limit of sugarcane requirements for soil, temperature, moisture, slope, and other conditions, the GIS technology was used to extract the land resources that were suitable for sugarcane planting.
 Table 1. Sugarcane growth conditions based on the relevant literature [23].
Referring to the above steps, the marginal land resources suitable for planting sugarcane in China were extracted (see Figure 3). The marginal land resources suitable for planting sugarcane in the Guangxi Zhuang Autonomous Region were obtained by the cutting operation of the ArcGIS (https://developers.arcgis.com/) software, as shown in Figure 4.
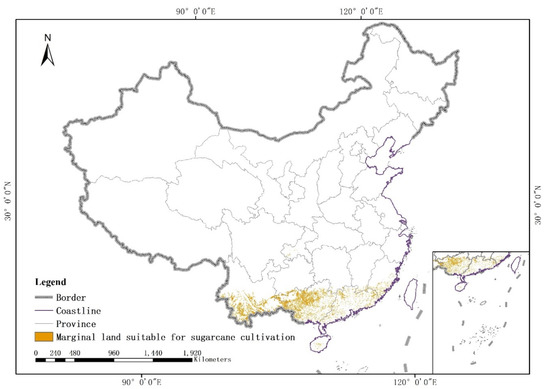
Figure 3.
Spatial distribution of marginal land suitable for growing sugarcane in China.
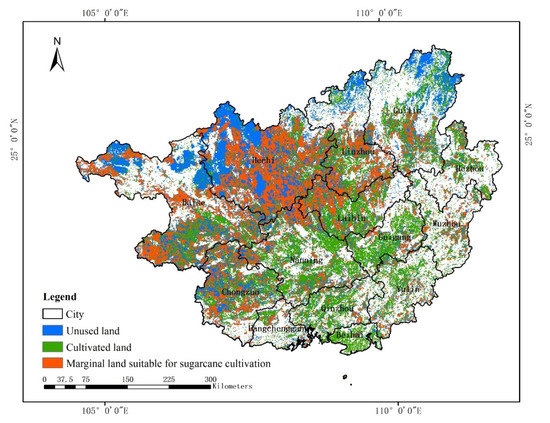
Figure 4.
Spatial distribution of marginal land suitable for growing sugarcane, cultivated land, and remaining unused land in the Guangxi Zhuang Autonomous Region.
2.2.2. Field Observation Data
This study uses field observation data from Ruan [24] to calibrate the crop variety parameters. The sugarcane variety tested in the field was Guitang 32 (Guitang 02-208) cultivated by the Sugarcane Research Institute of the Guangxi Academy of Agricultural Sciences. The female parent of this variety is Yuetang 91-976 and the male parent is Xintaitang 1. Guitang 32 is an early-maturing sugarcane cultivar. It grows vigorously and needs sufficient basic fertilizer for cultivation. Its suitable planting time is from late February to mid-March [25].
The field test period was from 2015 to 2017, and there were four test plots. For each plot, the planting area was 6 m wide and 20 m long, and the plot area was 120 m2. Each plot was planted with five rows, the row spacing was 1.2 m, and the planting density was 105,000 buds·ha−1. The field management measures for each plot were the same and 300 kg·ha−1 of nitrogen fertilizer was used during the whole growth period. The base and topdressing fertilizers were applied at a 1:1 ratio, while the potash (330 kg·ha−1) and phosphate (150 kg·ha−1) fertilizers were applied once, with the base fertilizer. The other field management measures were the same as those used in conventional agricultural production, and there was no irrigation during the growth period.
Field observations included the crop growth period, the leaf area index of each growth stage, the dry weight of the aboveground part, the yield of the sugarcane stem, etc. The sugarcane growth records are shown in Table 2.
Table 2.
Growth parameters measured at the sugarcane field experiment from 2015 to 2017.
After the completion of the model crop variety parameter calibration, the parameters of the APSIM sugarcane model needed to be verified, so more sugarcane field observation records were needed. In this study, the sugarcane field observation data from Zu et al. [26] were used to verify the results of the model parameter calibration, mainly to verify the sugarcane stalk yield and the phenological period of the sugarcane. Model calibration and validation data can be seen in Table 3.
Table 3.
Model calibration and validation data [24,26].
2.2.3. Meteorological Data
The APSIM sugarcane model requires daily meteorological data as an input. The time span needs to cover the entire growth period of the crop. The meteorological file in the APSIM model contains 10 data items, including the site name, latitude, and eight meteorological data items (see Table 4). The daily solar radiation, maximum temperature, minimum temperature, and precipitation were obtained by interpolating the meteorological station data through the ANUSPLIN version 4.3 software [27]. The data from 2009 to 2017 were collected from the National Meteorological Science Data Sharing Service Platform (http://data.cma.cn/).
Table 4.
Meteorological file data items of the APSIM (Agricultural Production Systems sIMulator) sugarcane model.
2.2.4. Soil Profile Data
The soil profile data used in this paper mainly include soil hydrological properties and soil nitrogen. Soil hydrological properties include the saturated water content, field capacity, permanent wilting coefficient, and air-dried soil moisture content of each soil profile. Soil nitrogen properties include the nitrate nitrogen content, ammonia nitrogen content, pH value, and organic carbon content (see Table 5). In the process of model calibration and verification, soil parameters were derived from field observation data [24]. In the process of model surface scale simulation, soil hydraulic parameters were obtained from the database of soil hydraulic parameters established by Dai et al. [28], and soil nitrogen parameters used the soil nitrogen values of field observation data. The soil profile attribute data are divided into seven layers at depths of 4.5, 9.1, 16.6, 28.9, 49.3, 82.9, and 138.3 cm.
Table 5.
Soil characteristic parameters of the APSIM sugarcane model.
2.3. APSIM Module
2.3.1. APSIM and Sugarcane Module
The APSIM model is a comprehensive mechanistic model that was developed by CSIRO (Commonwealth Scientific and Industrial Research Organisation) and APSRU (Agricultural Production System Research Unit) in 1991 to simulate the biophysical processes of agricultural production systems. The APSIM sugarcane model is a built-in sugarcane module in the APSIM model. It can interact with the soil, agricultural residue, and agricultural management modules to automatically simulate the water, fertilizer, and nutrient cycling between soil and sugarcane crops.
2.3.2. Model Localization Settings
The APSIM model used in this paper was version 7.10. The input parameters include three aspects, namely, the meteorological, soil, and crop variety parameters.
Meteorological Data
The meteorological data used in the study were obtained from the National Meteorological Information Center and the APSIM meteorological data files were processed in R and Python.
Soil Data
The soil parameters for the process of parameter adjustment and model validation were derived from the data collected from the experimental sites [24], as shown in Table 6. See Table 5 for the description of the parameters in Table 6.
Table 6.
Soil properties observed in the field experiment.
Crop Variety Data
This study used the Australian sugarcane variety Q138 because this variety is suitable for planting in high temperature and rainy areas, featuring good vitality and strong adaptability. The crop variety parameters of the APSIM sugarcane model and the default values of Q138 are shown in Table 7.
Table 7.
Default values of sugarcane variety parameters for the Q138 sugarcane variety in the APSIM model.
2.4. Simulation of Sugarcane Production Process
The APSIM model was spatially expanded by GIS technology to achieve surface-scale simulation of sugarcane on the marginal land in Guangxi. According to the scheme in Section 2.2.1, the surface vector data (polygon shapefile format) of the marginal land suitable for sugarcane planting were obtained in the ArcGIS (version 10.3.1) software. Since the APSIM model can only perform point simulation, it is necessary to convert the surface into points. Therefore, the “raster extracted by mask” and “raster resample” GIS technologies were used to rasterize the marginal land (into raster format). Python (version 3.7.4) and R (version 3.6.1) [29] were used to process the meteorological and soil data and connect these attributes to the grid point of the marginal land. Program modules such as “etree”, “pandas”, and “data.table” were utilized in this process. Then, “raster to point” GIS technology was used to transform the raster data into point vector data (point shapefile format). As a consequence, the surface simulation of the APSIM model in the study area was transformed into tens of thousands of point simulations. The Python programming language was used for data formatting, batch operation, and model output sorting during the model operation. Finally, the “vector to raster”, “hierarchical rendering”, and “thematic map drawing” GIS technologies were used to visualize the running results of the model. The technical process of the model space extension is shown in Figure 5.
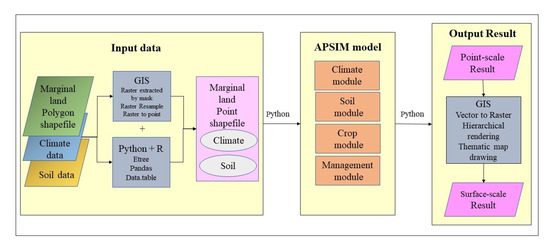
Figure 5.
APSIM model spatial expansion technology flow chart.
2.5. Global Sensitivity Analysis Method
The sensitivity analysis method used in this paper was the extended Fourier amplitude sensitivity test (EFAST), which was proposed by Saltelli et al. in 2006 [30]. The algorithm is briefly introduced as follows [30]:
Model can be converted to by an appropriate conversion function, and a Fourier transform is performed on the as follows:
where and are the Fourier amplitude, is the number of samples, and is the Fourier change parameter, where .
The spectral curve of the Fourier series is defined as , and by calculating the frequency , the variance of the model output result caused by the change of the input parameter is given as follows:
The total variance of the model output is thus decomposed into the following:
where is the independent variance caused by the change of the i-th input parameter , is the coupling variance caused by the interaction between the i-th input parameter and the j-th parameter , and by analogy, is the variance contributed by the interaction of all input parameters, and k is the number of parameters. After data normalization, the first sensitivity index of the parameter is defined as follows:
The total sensitivity index of the parameter is defined as follows:
where is the sum of the contribution variances of all parameters excluding the i-th parameter .
2.6. Sensitivity Analysis
The APSIM models use many cultivar parameters to simulate crop growth. These parameters usually cannot be directly measured and need to be calibrated when the crop model is applied to a new environment or a new cultivar. Sensitivity analysis can quantify the impact of the model input parameters on the model output, thereby simplifying the calibration for new cultivars. We performed sensitivity analysis on eight crop variety parameters. The description and range of selected parameters are shown in Table 8. The variety parameters were obtained from the APSIM official website (http://www.apsim.info/) and Mao et al. [31]. The upper and lower limits of the crop variety parameters were set to be ±50% according to the default value of the model here, and all variables are subject to a uniform distribution. The additional input parameters for the model, such as the meteorological data, soil data, and crop management (e.g., seeding, fertilization) data, can be found in Section 2.2 of this paper.
Table 8.
Upper and lower limits of sugarcane variety parameters for the sensitivity analysis.
In this study, four outputs of the model were considered, namely, the sugarcane stem dry weight, sugarcane stem fresh weight, sucrose dry weight, and leaf area index. The specifications of the output indicators are shown in Table 9.
Table 9.
Explanation of the selected output indicators for the parameter sensitivity analysis.
We used the SIMLAB software for parameter sensitivity analysis [32]. We set the simulation number at N = 3000 for the sensitivity analysis in order to attain a stable convergence. Therefore, a total of 24,000 (3000 × 8) simulations were run, with eight cultivar parameters and four output indexes. The sensitivity analysis was operated using the following steps:
- (1)
- In the statistical preprocessing module of SIMLAB software, input the range and distribution of eight crop variety parameters, use Monte Carlo method to sample all parameters 3000 times, and get the parameter sample set;
- (2)
- Python is used to input the generated parameter sample set into the configuration file of APSIM sugarcane model, then run APSIM model from the command line, and 3000 model output results are obtained;
- (3)
- The output of the previous step is input to the model processing module of SIMLAB, and the sensitivity analysis results of each parameter are calculated by EFAST method.
A “trial and error method” was used in this study to modify the sugarcane variety parameters. When the results of the model simulation were close to the field observation data to a greatest extent, the adjusted parameters can be set as the most appropriate parameters of the research area.
3. Results and Analysis
3.1. Sensitivity Analysis
Figure 6a shows that for cane_wt, the first three parameters with the largest first sensitivity index were green_leaf_no, cane_fraction, and tt_emerg_to_begcane, with values of 46.58%, 20.72%, and 8.16%, respectively, and the values of other parameters were less than 1%. The first three parameters with the largest global sensitivity index were the same as the first sensitivity index, with values of 68.93%, 59.22%, and 25.50%, respectively. The global sensitivity index of min_sstem_sucrose_redn was also large, ranking fourth with value of 9.52%, and the remaining parameters were less than 1%. According to Figure 6b, the sensitivity analysis results of canefw were almost the same as that of cane_wt. The first three parameters with the largest first sensitivity index were green_leaf_no, cane_fraction, tt_emerg_to_begcane, with values of 51.19%, 25.56%, and 3.85%, respectively. The first three parameters with the largest global sensitivity index were the same as the first sensitivity index, with values of 67.76%, 52.24%, and 16.97%, respectively. The global sensitivity index of min_sstem_sucrose_redn was also large, ranking fourth with value of 6.86%, and the remaining parameters were less than 1%. According to Figure 6c, for sucrose_wt, the first four parameters with the largest first sensitivity index were min_sstem_sucrose, green_leaf_no, cane_fraction, tt_emerg_to_begcane, with values of 46.27%, 11.50%, 6.51% and 2.12%, respectively, and other parameters were less than 1%. The first four parameters with the largest total sensitivity index were the same as the first sensitivity index, with values of 67.19%, 32.20%, 25.79%, 15.28%, respectively, and other parameters were less than 1%. Figure 6d shows that for lai_sum, the first three parameters with the largest first sensitivity index were cane_fraction, green_leaf_no, tt_emerg_to_begcane, with values of 60.85%, 30.18%, and 8.85%, respectively, and other parameters were less than 1%. The first three parameters with the largest global sensitivity index were the same as the first sensitivity index, with values of 65.80%, 31.62%, and 13.79%, respectively. The global sensitivity index of min_sstem_sucrose_redn ranked fourth with value of 1.71%, and the remaining parameters were less than 1%.
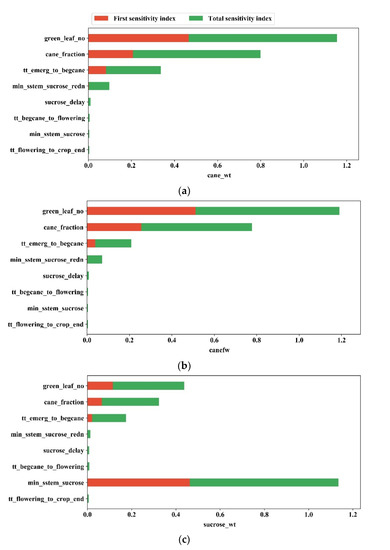
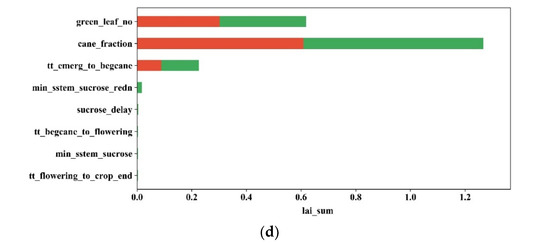
Figure 6.
The first and total sensitivity indices for the four outputs to eight cultivar parameters in the APSIM sugarcane model. (a–d) Stacked bar graphs of two sensitivity indices of cane_wt, canefw, sucrose_wt, lai_sum, respectively.
In conclusion, four sugarcane yield outputs (the dry weight of the sugarcane stalk, the fresh weight of the sugarcane stalk, the dry weight of sugarcane sugar, and the leaf area index) were most sensitive to the maximum number of green leaves before plant maturation (green_leaf_no), the percentage of daily biomass allocated to cane stems (cane_fraction), and the accumulated temperature from emergence to jointing (tt_emerg_to_begcane). The dry weight of sugarcane sugar was particularly sensitive to the minimum cane stalk biomass before sugar accumulation began (min_sstem_sucrose).
3.2. Model Parameter Calibration
The results of the model parameter calibration based on the field observation data are shown in Table 10.
Table 10.
Values of crop variety parameters after model parameter calibration.
3.3. Model Validation
Figure 7 shows a linear regression graph and residual analysis graph of the observed and simulated values. The determination coefficient (R2), the root mean square error (RMSE), and the consistency index (D index) between observed and simulated values [33] were used as statistical indicators here. In Figure 7a–c, the points in the linear regression graphs fall evenly on both sides of the 1:1 line. For the sugarcane fresh weight, emergence date and jointing date, the values of R2 are 0.91, 0.76 and 0.89, the values of the RMSE are 9.32, 15.54 and 13.81, respectively, and the values of D are 0.97, 0.91 and 0.97. The confidence intervals of the residuals in Figure 7d–f all include zero, which indicates that the model performed correctly. In general, the model simulates the fresh weight yield of sugarcane and the phenological period well. The model validation results show that the parameters of the sugarcane varieties are ideal and that the simulation results of the APSIM model are reliable to a certain extent.
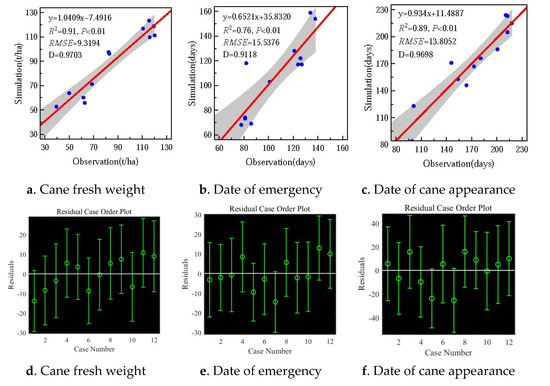
Figure 7.
The linear regression diagrams ((a) cane fresh weight; (b) date of emergency; (c) date of cane appearance) and the residual analysis diagrams ((d) cane fresh weight; (e) date of emergency; (f) date of cane appearance) of the observed and simulated values.
3.4. Model Simulation
The results for the sugarcane biomass on the marginal lands in the Guangxi Zhuang Autonomous Region of China are shown in Figure 8. The simulated sugarcane fresh weight yield in the marginal lands is ≈24.7–137.3 t·ha−1, and the sugarcane fresh weight yield is distributed from low to high along the northeast to the southwest. However, the yield is nonuniformly distributed, which fully reflects the topography and meteorological factors. This is also in line with previous research on the climate divisions for sugarcane planting in the Guangxi Zhuang Autonomous Region [34].
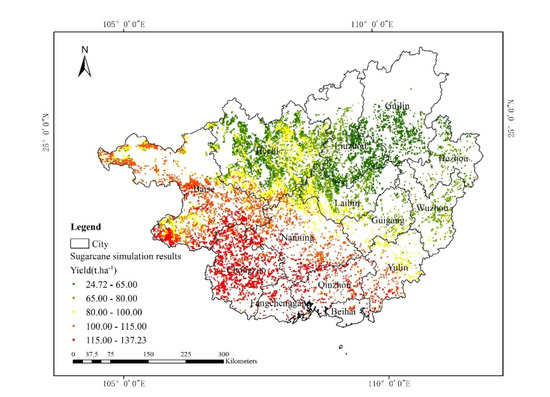
Figure 8.
Spatial distribution of simulated sugarcane yield on the marginal lands in the Guangxi Zhuang Autonomous Region.
3.5. Fuel Ethanol Production Potential
The relevant literature shows that the conversion rate of sugarcane stem yield to ethanol fuel production is 12:1 [35,36] and that 50% of sugarcane produced in cropland can be used for ethanol production after meeting the demands of the sugar industry [37]. Therefore, the spatial distribution of sugarcane ethanol production could be estimated according to the administrative divisions of the Guangxi Zhuang Autonomous Region, as shown in Table 11. The total sugarcane output of Guangxi Zhuang Autonomous Region can be obtained by summing the sugarcane produced on the marginal land and cropland, as shown in Figure 9. Table 11 shows that the total area of marginal land in the Guangxi Zhuang Autonomous Region is 53,124 km2, accounting for 22.36% of the total area. The total yield of sugarcane on marginal land is 42,522.05 × 104 t. The total yield of ethanol is estimated to be 3847.37 × 104 t when combining marginal land ethanol with cropland ethanol. According to the Guangxi Statistical Yearbook [19], the number of cars owned in Guangxi is 590.4 × 10⁴, the consumption of gasoline is 392.29 × 10⁴ t, and replacing 10% of gasoline with ethanol fuel requires 392.29 × 10³ t of ethanol fuel. After deducting vehicle ethanol fuel, there are still 3808.14 × 104 t of ethanol fuel that can be exported to the ASEAN.
Table 11.
Statistics of sugarcane-based ethanol energy potential in cities of Guangxi Zhuang Autonomous Region.
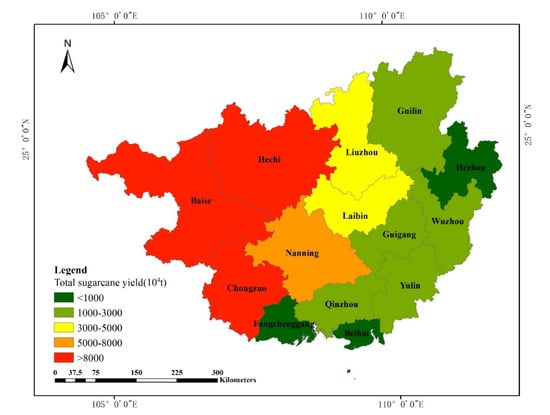
Figure 9.
Total sugarcane yield in the Guangxi Zhuang Autonomous Region.
4. Discussion
Guangxi is a pilot region in China that vigorously promotes the development of the non-grain biomass energy industry [38]. The results of this study show that the average yield of sugarcane on marginal land is about 80 t·ha−1, and that on cultivated land is about 82 t·ha−1 (calculated by dividing the total output by the total area), which indicates that Guangxi has great potential for planting sugarcane as an energy crop, as Guangxi has a large amount of unused shrub forest lands, sparse forest lands, and grasslands suitable for planting sugarcane [39], and the local climate is also suitable. Moreover, the distribution of sugarcane production in marginal land in Guangxi (Figure 8) indicates that the sugarcane production potential in marginal land in southwestern Guangxi is large. Considering the scattered distribution of unused land, ecological safety, and other factors, the development of sugarcane as a non-grain biomass energy should be prioritized in the marginal land in the west and southwest.
This paper uses a surface-to-point method to predict sugarcane yield in marginal land by combining the APSIM sugarcane model and GIS spatial analysis technology, which not only overcomes the difficulty of unpredictable yields in marginal land but also considers the hydrothermal conditions and physiological characteristics of sugarcane when compared with other research [24,40,41,42]. However, there are some limitations that need to be addressed in this study. First, due to the vast amount of land and the varying environmental conditions in the study area, the crop growth model was verified by only a limited number of sites, and the accuracy of the parameters thus cannot be ensured. Secondly, this study has not taken into account all the impact factors on the growth and development of sugarcane in the APSIM sugarcane model, such as the impact of pests and other disasters caused by meteorological factors in the real production process. In addition, this paper creates a spatial resolution problem when the GIS spatially expands the crop growth model. It is unknown at what resolution the model can be extended spatially and at what resolution the effect is best. Therefore, the feasibility and optimal parameters for the spatial expansion of the crop growth model should be further studied. Furthermore, regarding the feasibility of planting sugarcane on marginal land, due to the high planting density, long growing period, poor soil conditions of the planting area, and the large amount of rainfall in Guangxi, the large-scale utilization of idle forest land, grassland, and other unused land to plant sugarcane can cause serious soil and water loss, and even lead to the risk of landslides over time. Moreover, if sugarcane is planted on a large scale, the lack of adequate management measures will inevitably lead to a decline in soil fertility and thus a decline in soil production potential. Therefore, it is necessary to further evaluate the impact of sugarcane cultivation on the ecological environment in subsequent studies.
5. Conclusions
This study assessed the production potential of sugarcane as an energy crop in the Guangxi Zhuang Autonomous Region. First, the marginal land resources suitable for sugarcane were extracted. Next, a sensitivity analysis, a calibration, and a verification of the APSIM model were carried out to confirm its applicability. Finally, the growth process of sugarcane was simulated for the study area.
The results show that the APSIM sugarcane model simulates the sugarcane stem yield and phenological period of sugarcane in Guangxi Zhuang Autonomous Region well, and that the related statistical graphics and indicators also perform well. Assuming that sugarcane is planted as an energy crop on the marginal lands of the study region, approximately 42,522.05 × 104 t of sugarcane stems can be harvested each year. It is estimated that the sugarcane produced on the marginal land plus 50% of the sugarcane from croplands can produce about 3847.37 × 104 t of ethanol fuel. After meeting the demands for vehicle ethanol fuel in Guangxi, 3808.14 × 104 t of ethanol fuel remain that can be exported to the ASEAN.
Due to the many uncertainties mentioned in Section 4, the next step should be to consider more factors that affect the sustainable development of sugarcane bioenergy, including ecological security, the technology to produce bioenergy from sugarcane, energy efficiency, and the increase of greenhouse gas efficiency. In general, the sustainable development of sugarcane bioenergy should be analyzed in conjunction with life cycle assessments and biogeochemical process models.
Author Contributions
Conceptualization, J.F. and D.J.; Data curation, J.D.; Investigation, J.D.; Methodology, T.P. and J.F.; Project administration, D.J.; Resources, J.D.; Writing–original draft, T.P.; Writing–review & editing, J.F. and D.J. All authors have read and agreed to the published version of the manuscript.
Funding
This work was supported by National Natural Science Foundation of China (Grant No. 41971250), Youth Innovation Promotion Association (Grant No. 2018068).
Acknowledgments
We greatly thank “MDPI English editing” (English-42266) for the editing assistance.
Conflicts of Interest
The authors declare no conflict of interest.
References
- Tian, C. Analysis of China’s Oil and Gas Import and Export in 2013. China Oil Gas 2014, 21, 36–41. [Google Scholar]
- Liu, Q.; Gu, A.; Teng, F.; Song, R.; Chen, Y. Peaking China’s CO2 Emissions: Trends to 2030 and Mitigation Potential. Energies 2017, 10, 209. [Google Scholar] [CrossRef]
- Chen, W.-H.; Lee, K.T.; Ong, H.C. Biofuel and Bioenergy Technology. Energies 2019, 12, 290. [Google Scholar] [CrossRef]
- Han, Y.; Kagawa, S.; Nagashima, F.; Nansai, K. Sources of China’s Fossil Energy-Use Change. Energies 2019, 12, 699. [Google Scholar] [CrossRef]
- National Energy Administration. Implementation Plan on Expanding Biofuel Ethanol Production and Promoting the Use of Automobile Ethanol Gasoline; National Energy Administration: Beijing, China, 2017.
- National Development and Reform Commission. “Eleventh Five-Year Plan” Development Special Plan for Biofuel Ethanol and Automobile Ethanol Gasoline; National Development and Reform Commission: Beijing, China, 2007.
- Ministry of Commerce. China-ASEAN Comprehensive Economic Cooperation Framework Agreement; Ministry of Commerce: Beijing, China, 2002.
- Li, Y.; Hou, H.; Wang, X.; Kuang, Z. Research Status and Prospect of Energy Plant. J. Anhui Agric. 2013, 41, 1682–1683. [Google Scholar]
- Shi, S.; Cheng, D.; Ma, F. Exploitation and Utilization of Biomass Energy Crop-Energy Beet. Chin. Agric. Sci. Bull. 2007, 23, 416–419. [Google Scholar]
- Xie, L.; Li, P.; Zhang, W.; Yang, M. A review on the development potential of bioenergy rapeseed. Chin. J. Bioprocess Eng. 2005, 1, 32–35. [Google Scholar]
- Cervi, W.R.; Camargo Lamparelli, R.A.; Abel Seabra, J.E.; Junginger, M.; van der Hilst, F. Bioelectricity potential from ecologically available sugarcane straw in Brazil: A spatially explicit assessment. Biomass Bioenergy 2019, 122, 391–399. [Google Scholar] [CrossRef]
- Singels, A.; Jarmain, C.; Bastidas-Obando, E.; Olivier, F.C.; Paraskevopoulos, A.L. Monitoring water use efficiency of irrigated sugarcane production in Mpumalanga, South Africa, using SEBAL. Water SA 2018, 44, 636–646. [Google Scholar] [CrossRef]
- Yawson, D.O.; Adu, M.O.; Osei, K.N. Spatial assessment of sugarcane (Saccharurn spp. L.) production to feed the Komenda Sugar Factory, Ghana. Heliyon 2018, 4, e00903. [Google Scholar] [CrossRef]
- Lisboa, I.P.; Damian, J.M.; Cherubin, M.R.; Silva Barros, P.P.; Fiorio, P.R.; Cerri, C.C.; Pellegrino Cerri, C.E. Prediction of Sugarcane Yield Based on NDVI and Concentration of Leaf-Tissue Nutrients in Fields Managed with Straw Removal. Agronomy 2018, 8, 196. [Google Scholar] [CrossRef]
- Satiro, L.S.; Cherubin, M.R.; Lisboa, I.P.; Noia Junior, R.S.; Cerri, C.C.; Pellegrino Cerri, C.E. Prediction of Sugarcane Yield by Soil Attributes under Straw Removal Management. Agron. J. 2019, 111, 14–23. [Google Scholar] [CrossRef]
- Dias, H.B.; Sentelhas, P.C. Sugarcane yield gap analysis in Brazil-A multi-model approach for determining magnitudes and causes. Sci. Total Environ. 2018, 637, 1127–1136. [Google Scholar] [CrossRef] [PubMed]
- Rodriguez, R.G.; Scanlon, B.R.; King, C.W.; Scarpare, F.V.; Xavier, A.C.; Pruski, F.F. Biofuel-water-land nexus in the last agricultural frontier region of the Brazilian Cerrado. Appl. Energy 2018, 231, 1330–1345. [Google Scholar] [CrossRef]
- Sanches, G.M.; Nonato de Paula, M.T.; Graziano Magalhaes, P.S.; Duft, D.G.; Vitti, A.C.; Kolln, O.T.; Montes Nogueira Borges, B.M.; Junqueira Franco, H.C. Precision production environments for sugarcane fields. Sci. Agric. 2019, 76, 10–17. [Google Scholar] [CrossRef]
- Guangxi Zhuang Autonomous Region Statistics Bureau. Guangxi Statistical Yearbook; Guangxi Zhuang Autonomous Region Statistics Bureau: Beijing, China, 2019.
- Huang, X.; Zhou, H.; Huang, M.; Zhao, J. Climate and temperature changes in Guangxi in the past 50 years. Guangxi Meteorol. 2005, 26, 9–11. [Google Scholar]
- Ministry of Agriculture and Rural Affairs. Opinions of the Ministry of Agriculture on Strengthening Energy Conservation and Emission Reduction in Agriculture and Rural Areas; Ministry of Agriculture and Rural Affairs: Beijing, China, 2007.
- Fu, J.; Jiang, D.; Hao, M. Research on the Development Potential of Non-Grain Fuel Ethanol in China; China Meteorological Press: Beijing, China, 2017.
- Li, R.; Zhang, Y.; Yang, D.; Qu, Y.; Guo, J. Study on development potential of full mechanization in diversity terrain of Yunnan sugarcane region. Chin. Agric. Mech. 2012, 4, 71–74. [Google Scholar]
- Ruan, H. Simulation Study on the Impact of Climate Change on Sugarcane Production Potential in Guangxi. Ph.D. Thesis, Guangxi University, Guangxi, China, 2018. [Google Scholar]
- He, H.; Luo, C.; Tang, L.; Ma, W.; Chen, H.; Wei, H.; Huang, Z. High-yield Cultivation Techniques of Guitang 32 in Chongzuo Cane Area. Chin. Trop. Agric. 2016, 3, 69–71. [Google Scholar]
- Zu, Q.; Mi, C.; Liu, D.L.; He, L.; Kuang, Z.; Fang, Q.; Ramp, D.; Li, L.; Wang, B.; Chen, Y.; et al. Spatio-temporal distribution of sugarcane potential yields and yield gaps in Southern China. Eur. J. Agron. 2018, 92, 72–83. [Google Scholar] [CrossRef]
- Xu, T.; Hutchinson, M.F. New developments and applications in the ANUCLIM spatial climatic and bioclimatic modelling package. Environ. Model. Softw. 2013, 40, 267–279. [Google Scholar] [CrossRef]
- Dai, Y.; Wei, S.; Duan, Q.; Liu, B.; Niu, G. Development of a China Dataset of Soil Hydraulic Parameters Using Pedotransfer Functions for Land Surface Modeling. J. Hydrometeorol. 2013, 14, 869–887. [Google Scholar] [CrossRef]
- Zuur, A.F.; Ieno, E.N.; Meesters, E.H.W.G. A Beginner’s Guide to R; Springer: New York, NY, USA, 2009. [Google Scholar]
- Saltelli, A.; Ratto, M.; Tarantola, S.; Campolongo, F. Sensitivity analysis practices: Strategies for model-based inference. Reliab. Eng. Syst. Saf. 2006, 91, 1109–1125. [Google Scholar] [CrossRef]
- Mao, J.; Inman-Bamber, N.G.; Yang, K.; Lu, X.; Liu, J.; Jackson, P.A.; Fan, Y. Modular Design and Application of Agricultural System Simulating Model for Sugarcane (APSIM-Sugar). Sugar Crop. China 2017, 39, 44–50. [Google Scholar]
- Tarantola, S.; Becker, W. Simlab 4.0 for Global Sensitivity Analysis. In Handbook of Uncertainty Quantification; Springer: New York, NY, USA, 2016; pp. 1–21. [Google Scholar]
- Willmott, J.C. Some Comments on the Evaluation of Model Performance. Bull. Am. Meteorol. Soc. 1982, 63, 1309–1313. [Google Scholar] [CrossRef]
- Su, Y.; Li, Z.; Sun, H. Climate Division of Sugarcane Planting Based on GIS in Guangxi. Chin. J. Agrometeorol. 2006, 27, 252–255. [Google Scholar]
- Li, Q.; Qi, R.; Zhang, Y. Development prospects of energy sugarcane to produce fuel ethanol. Sugarcane Canesugar 2004, 5, 29–33. [Google Scholar]
- Zeng, L.; An, Y.; Li, Q. Technical, Economic and Environmental Analysis of Fuel Ethanol Production from Sugarcane in China. Sugarcane Canesugar 2006, 2, 15–19. [Google Scholar]
- Li, Y.; Tan, Y.; Li, S.; Yang, R. Analyses on the potential of sugarcane as a bioenergy crop in China. Southwest China J. Agric. Sci. 2006, 19, 742–746. [Google Scholar]
- Xie, G. Progress and direction of non-food biomass feedstock supply research and development in China. J. China Agric. Univ. 2012, 17, 1–19. [Google Scholar]
- Zhang, J. Land potential analysis of biomass energy development in Guangxi. Mark. Forum 2008, 2, 9–14. [Google Scholar]
- Xu, Y.; Zhang, W. The Application on the Sugar Cane Forecast with the Neural Networks Using Improved Genetic Algorithms. J. South China Agric. Univ. 2010, 31, 102–104. [Google Scholar]
- Mao, J.; Wang, J.; Huang, M.; Lu, X.; Dao, J.; Zhang, Y.; Tao, L.; Yu, H. Effects of sowing date, water and nitrogen coupling management on cane yield and sugar content in sugarcane region of Yunan. Trans. Chin. Soc. Agric. Eng. 2019, 35, 134–144. [Google Scholar]
- Peng, Q.; Feng, L.; Deng, J.; Fan, X.; Zhang, Y. Application of BP Neural Network in Predication of Sugarcane Yield in Yunnan Province. Sugar Crop. China 2019, 41, 54–57. [Google Scholar]


© 2020 by the authors. Licensee MDPI, Basel, Switzerland. This article is an open access article distributed under the terms and conditions of the Creative Commons Attribution (CC BY) license (http://creativecommons.org/licenses/by/4.0/).