1. Introduction
Biomass is currently regarded as one of the most important sources of renewable energy that will allows the global energy goals to be met [
1]. Today biomass represents nearly 8% of the total primary energy supply in Europe [
2]. The main conversion pathway for converting biomass to bioenergy carriers is anaerobic digestion (AD) [
3]. During AD biogas is produced, which is a renewable energy source that can be used for the production of electricity, heat, or in vehicle transportation [
4]. At present, the biomass used in agricultural biogas plants is mainly terrestrial plants [
5,
6,
7], whose an intensive cultivation may negatively affect the global supply of food and feed [
8]. Thus, there is a need to search for alternative sources of biomass to replace food feedstocks.
Previous studies indicate that microalgae biomass has a potential for use as an organic substrate for bioenergy production. [
9]. Microalgae biomass for biogas production can be obtained from closed photobioreactors, open ponds, and from natural water reservoirs [
10]. Previous reports indicate that the biomass of
Scenedesmus sp. [
11],
Spirulina sp. [
12,
13],
Euglena sp. and
Chlorella vulgaris [
14],
Melosira sp. and
Oscillatoria sp. [
15], as well as the benthic multicellular algae including
Laminaria sp.,
Macrocystis sp. [
16],
Gracilaria ceae [
17],
Ulva sp. [
18] and
Macrosystis pyrifera,
Tetraselmis,
Gracilaria tikvahiae, and
Hypnea sp. [
19,
20] are good sources to produce biomethane.
Microalgae biomass has many advantages over conventional energy crops. Microalgae accumulate large amounts of polysaccharides and lipids in their cells, and are deprived of hardly degradable lignocellulosic compounds [
21]. They are characterized by a high growth rate and do not compete with crops for nutritional and feed purposes [
22,
23]. Thus, algae biomass offers great potential as a resource for the production of various energy carriers, such as biohydrogen, bioethanol, biodiesel, and biogas [
24,
25]. The operating problems in anaerobic digestion of algae biomass are associated with the biochemical composition of biomass, where high protein concentration reduces the value of the C/N ratio. However, it can be effectively corrected by co-digestion of algal biomass with feedstock rich in carbon compounds [
11].
The combined treatment of several substrates in AD may improve the efficiency of biogas production comparing the yields achieve for each substrate separately. This is due to the positive synergistic effects establish in the digestion feedstock [
26,
27]. In this way, many missing microelements and nutrients necessary for anaerobic microflora are supplied to the reactor [
28]. Additional benefits associated with co-digestion of the selected substrates may also relate to other factors, such as technological, economic and environmental aspects [
29,
30]. Finally, the increasing interest in developing microalgae-to-biofuel technology requires a detailed assessment of technological parameters of AD with a process optimization.
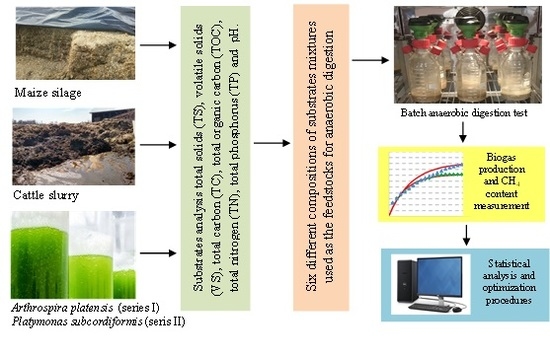
The aim of this research was to investigate the potential of Arthrospira platensis and Platymonas subcordiformis microalgae biomass as the feedstock for anaerobic co-digestion with the common feedstock of agricultural biogas plants, i.e., maize silage and cattle manure, to enhance biogas/methane yield.
2. Materials and Methods
2.1. Feedstock Origin and Characteristics
The microalgal biomass used in this study was collected from our own culture. The two vertical and tubular photobioreactors made of transparent plexiglass were used for separate cultivation of Arthrospira platensis and Platymonas subcordiformis. The working volume of each reactor was 50 L (inner diameter 200 mm, height 1700 mm). The light was provided with white reflectors (700 lux, Osram, Germany). The algal biomass was cultivated for 15 days. After the cultivation process was ended, the microalgae biomass was harvested, and then dehydrated by preliminary sedimentation followed by centrifugation (3000 rpm for 6 min). Dehydrated biomass was later mixed with other substrates (i.e., cattle slurry and maize silage).
Substrates for AD (cattle slurry, maize silage) originated from the Research Station of University of Warmia and Mazury in Olsztyn in Bałdy (Poland). Samples of substrates were collected in 5 kg amounts from five different places in storage fields; 1 kg from each place. They were subsequently mixed in order to obtain a homogenous sample of cattle slurry and sample of maize silage.
In the study, the substrates selected were the model organic substrates of maize silage and cattle slurry commonly used in agricultural biogas plants, as well as microalgae species characterized by high growth rate, which is an important factor for industrial applications. The characteristics of the feedstock substrates used in the study are presented in
Table 1.
2.2. Experimental Setup
Two different experimental series were performed, where either
Arthrospira plantensis (series 1) or
Platymonas subcordiformis (series 2) was added as algal biomass, and the feedstock was investigated in batch AD assays. In each series six different setups, based on the different composition of the substrate mixtures added, were investigated (
Table 2). The characteristics of the different substrate mixtures used in the batch AD assays are presented in
Table 3.
2.3. Batch Anaerobic Digestion Assays
Batch anaerobic digestion assays were carried out with respirometers (WTW, Germany) that consisted of bottles with reaction chamber volume of 0.5 L and measuring heads as the pressure sensors. The pressure increasing in the bottles caused by biogas production was measured and recorded every 180 min.
The bottles were filled with anaerobic inoculum to the volume of 200 mL and the feedstock mixture to a volume that ensured the set organic loading rate (OLR). The inoculum was taken from the closed fermentation chamber of municipal wastewater treatment plant operating at OLR of 2.0 kg volatile solids (VS)/m
3·d, hydraulic retention time (HRT) of 20 days and under mesophilic conditions of 35 °C. The anaerobic inoculum characteristic is shown in
Table 4. The mixture volume of inoculum and feedstock in the bottles ensured an initial OLR of 5.0 g VS/L. At the beginning of assays, anaerobic conditions inside the respirometers were obtained by purging nitrogen gas to remove atmospheric air. Batch AD assays were carried out for a period of 20 days and at a constant temperature of 35 °C ± 0.5 °C.
For the determination of biogas potential the ideal gas law was used, and the pressure changes inside the bottles were converted to the biogas volumes produced under normal conditions. The biogas production rate (r) was determined for each experimental setup. The non-linear regression and iterative method were used to determine reaction rate constants (k), (Statistica 13.1 PL software). In the iterative method, at each iterative step, the function is replaced with the linear differential for the designated parameters. The curve fitting test (φ2 coefficient) was performed to find the best fit of designated parameters to the experimental data points. It was assumed that the model was adapted to the experimental data when φ2 value did not exceed 0.2.
2.4. Analytical Methods
The gravimetric method enabled the determination of TS (total solids) and VS (volatile solids) concentrations. The samples of feedstock mixtures and anaerobic inoculum were dried at 105 °C and then determined for the total carbon (TC), total organic carbon (TOC) and total nitrogen (TN) concentrations by Flash 2000 analyzer (Thermo Fisher Scientific Inc.). The concentrations of total phosphorus (TP) were measured with a spectrophotometer DR 2800 with mineralizer (HACH Lange, Germany). The aqueous solution for pH determination was prepared by weighing 10 g of the homogenized air-dried sample in a 100 mL glass beaker, and then adding 50 mL distilled water and mixing.
The biogas composition (CH4, CO2, O2, H2, H2S and NH3) was analyzed every 24 h using gas chromatography (GC). A gastight syringe was used to inject gas sample volume of 20 mL into a gas chromatograph (GC, 7890A Agilent) equipped with a thermal conductivity detector (TCD). For separation of gases, the two Hayesep Q columns (80/100 mesh), two molecular sieve columns (60/80 mesh), and a Porapak Q column (80/100) operating at a temperature of 70 °C were used. The operational temperatures of injection and detector ports were respectively 150 °C and 250 °C. Helium and argon were applied as the carrier gases, both at the flow of 15 mL/min. The biogas composition was additionally evaluated using a GMF 430 analyzer (Gas Data).
2.5. Statistical Methods
The data obtained in the study were statistically processed by using Statictica 13.1 PL package (StatSoft, Inc.). The W Shapiro–Wilk’s test was used to see if variables were normally distributed. One way analysis of variance (ANOVA) was used to determine whether there were any statistically significant differences between the means. The dependent variables were the amount of biogas and the methane content in biogas, while the grouping variable was the feedstock composition. The relationship between the different composition of the feedstock was determined using Pearson’s correlation. The Levene’s test was used to determine if the comparing groups had equal variances. The Tukey’s HSD (honest significant difference) test was used to examine the significance of differences between the analyzed variables. The differences were considered significant at p = 0.05. To assess the biogas components depending on the feedstock characteristic, the F test and t test were used. The significance level was 0.01 for F test and 0.025 for t.
A stepwise regression was used to find the best multiple regression model with only statistically significant predictors from a set of potential predictive variables. The predictors with significant impact on changes in the biogas production B (L/kgVS) in models were TN (g/kg TS) and VS (%TS). The fit of the models to the empirical data was assessed using determination coefficients. The significance of polynomial regression models was verified using F-statistic and reference to the critical values. Lack-of-fit test was performed to check if the proposed statistical models fitted well. The test involved comparing the proposed models with models containing the remainder of the explanatory variables omitted in the proposed models. The models were subjected to the estimation tests. Examination of residuals to check for the model and the accuracy of assumptions was assessed. The assumption of normality of residuals distribution was verified and the correctness of models was assessed by plotting the value of residuals against predicted values (Statistica 13.1 PL).
3. Results and Discussion
The studies revealed that mixing the microalgae biomass belonging to Arthrospira platensis and Platymonas subcordiformis species and the biogas plant feedstock (cattle slurry and maize silage) caused improvements to to biogas yield and composition. In the study, the biogas and methane yields coming from the mixture of maize silage and cattle slurry achieved respectively 620.5 ± 14.6 Lbiogas/kgVS and 343.1 ± 16.4 LCH4/kgVS. The addition of the Arthrospira platensis biomass (up to a concentration of 10%) enhanced biogas production to 714.4 ± 16.1 Lbiogas/kgVS while the addition of 80% resulted in 923.6 ± 25.1 Lbiogas/kgVS. The methane yield also increased from 390.1 ± 11.8 LCH4/kgVS (10% of microalgal biomass) to 581.0 ± 24.5 LCH4/kgVS (40% of microalgal biomass). When Platymonas subcordiformis biomass was tested, the biogas and methane yields ranged from 918.0 ± 23.6 Lbiogas/kgVS and 487.5 ± 19.6 LCH4/kgVS, respectively (for 10% of microalgal biomass) to 1058.8 ± 25.2 Lbiogas/kgVS and 577.1 ± 24.3 LCH4/kgVS, respectively (for 80% of microalgal biomass).
Giuliano et al. studied co-digestion of energy crops and cattle manure [
31]. Biogas production obtained varied from 320 to 370 L
biogas/kgVS
fed in mesophilic conditions. In turn, Amon et al. (2007) achieved the methane production from maize and dairy cattle manure in the range of 312–365 L
CH4/kgVS (milk ripeness) and 268–286 L
CH4/kgVS (full ripeness) [
32]. Kalamaras and Kotsopoulos found the methane potential of 267 L
CH4/kgVS from the same substrate co-digestion [
33]. The higher efficiencies of biogas production during co-digestion of algae biomass and others organic feedstocks are attributed to the synergistic effects established in anaerobic reactors. In anaerobic digestion of mixed organic substrates, algae biomass is a source of nitrogen and microelements for the growth of microorganisms. This has been confirmed by the studies of others authors [
27]. Similar conclusions have also been made by Matsui et al. [
34], who operated a pilot-scale reactor where macroalgae of Laminaria sp. and Ulva sp. were mixed with others organic waste feedstocks.
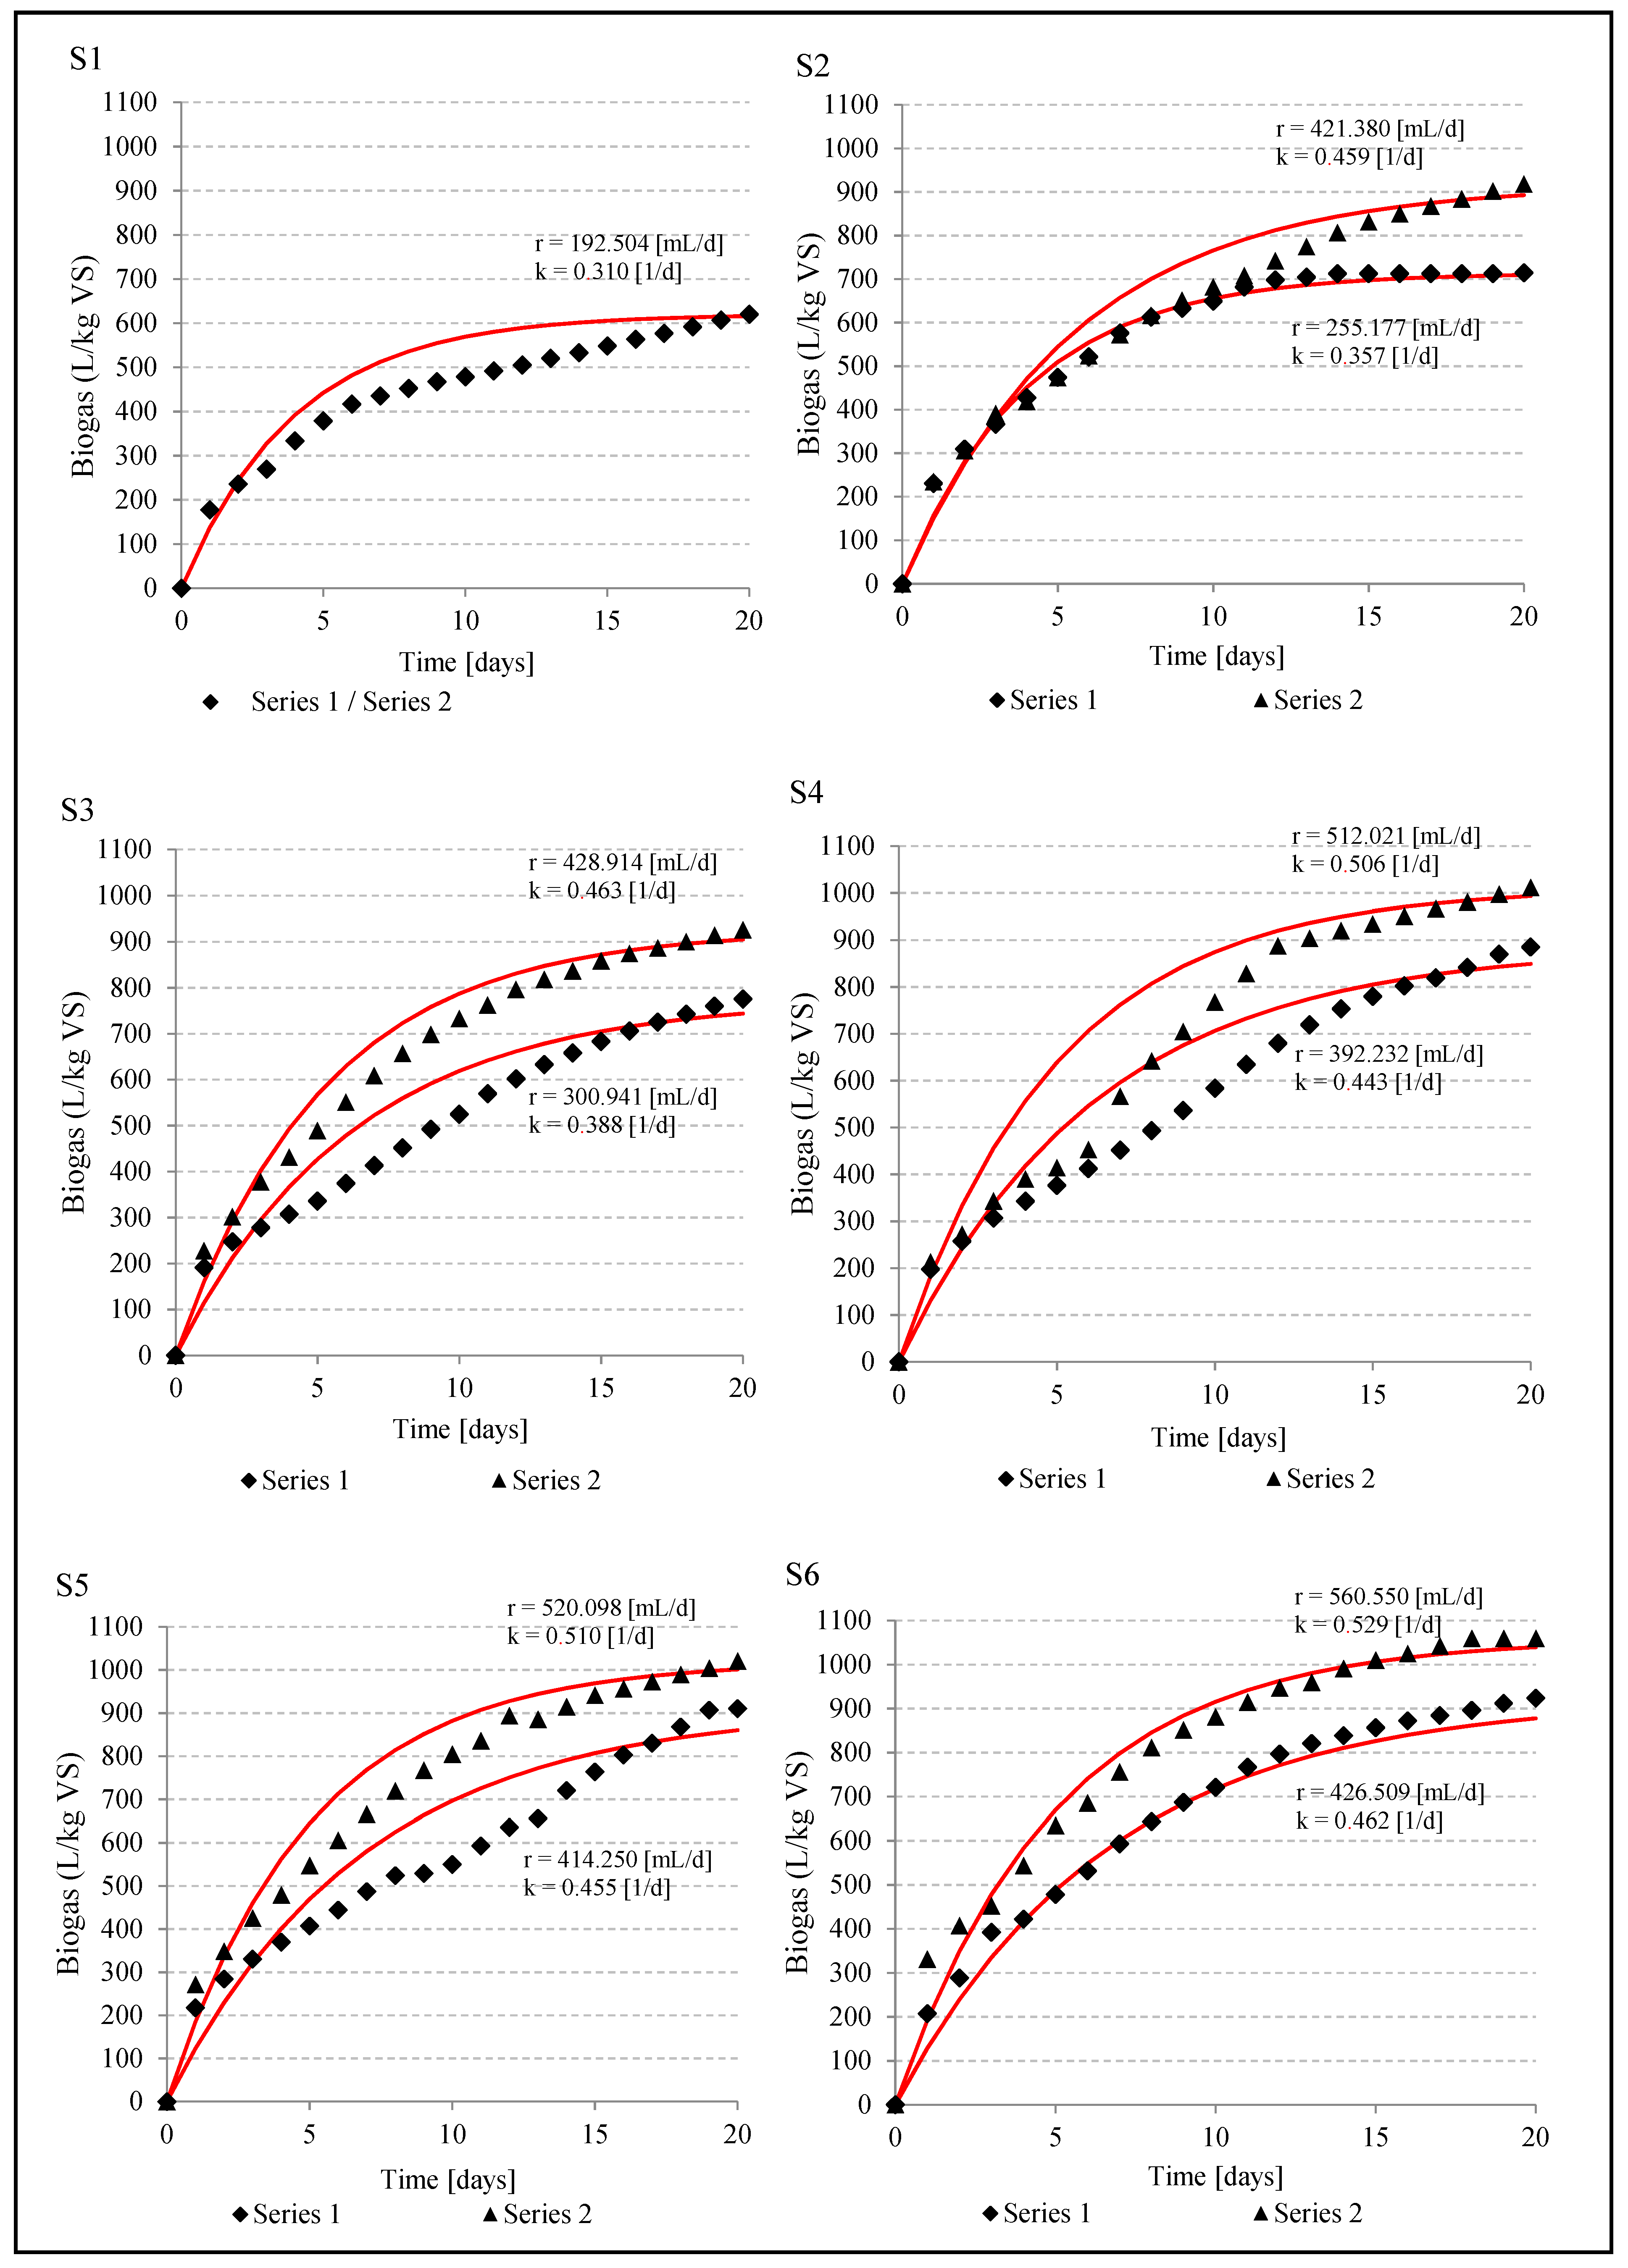
In both series of the experiment, the maximum biogas production was observed in setups with microalgae content in feedstock ranged from 40% to 80% (%VS). In series 1, the highest biogas production was within the range of 885.7 ± 20.2 L/kg VS - 923.6 ± 25.1 L/kg VS, while the rate of reaction varied from r = 392 mL/d to r = 426 mL/d (
Table 5,
Figure 1). In turn, in series 2, the results oscillated between 1012.0 ± 24.1 mL/kg VS and 1058.8 ± 25.2 mL/kg VS with the rate from r = 512 mL/d to r = 560 mL/d (
Table 5,
Figure 1). It was significantly higher (
p < 0.05) than in series 1. The methane content in biogas of series 1 averaged: 65.6 ± 1.3% in setup 4, 57.0 ± 1.8% in setup 5 and 53.4 ± 0.8% in setup 6. In series 2 it was 52.9 ± 1.05% in setup 4, 54.5 ± 1.08% in setup 5 and 54.5 ± 0.98% in setup 6 (
Table 6). Significantly lower biogas production of 620.49 ± 14.55 L/kg VS (
p < 0.05) was noted in setup 1, where the feedstock for anaerobic digestion consisted only of maize silage and cattle slurry (
Figure 1,
Table 5). The methane content in biogas obtained in setup 1 averaged 55.29 ± 1.32% (
Table 6).
Others authors [
35] have indicated that the potential of biogas production depends directly on microalgae species. However, no correlation was found between the taxonomic group of alage and the process efficiency in the experiments with six phytoplankton species (
Chlamydomonas reinwardtii,
Dunaliella salina and
Scenedesmus obliquus of the class
Chlorophyceae,
Chlorella kessleri of the class
Trebouxiophyceae,
Euglena gracilis of the class
Euglenoidea and cyanobacteria
Arthrospira platensis of the class
Cyanophyceae). The biogas production obtained from
Chlamydomonas reinhardtii reached 587 ± 8.8 L/kg VS, while the biomass of
Dunaliella salina achieved 505 ± 24.8 L/kg VS. Anaerobic digestion of cyanobacteria
Arthrospira platensis and
Euglena gracilis resulted in a lower biogas production, which was 481 ± 13.8 L/kg VS and 485 ± 3.0 L/kg VS respectively. The biogas production from
Chlorella kessleri and
Scenedesmus obliquus biomass was the lowest, and attained 335 ± 7.8 L/kg VS and 287 ± 10.1 L/kg VS, respectively [
35]. Singh and Gu [
36] and Parmar et al. [
37] emphasized the impact of the algal species on biogas production efficiency.
The necessity of selecting the appropriate proportions of co-substrates in the feedstock mixture results from the fact that an improper C/N ratio may limit (or even completely inhibit) the growth of anaerobic microflora in AD [
14]. Feedstock based on terrestrial energy crops is characterized by a high C/N ratio. Elser et al. (2000) determined the C/N ratio in terrestrial plants to be 36.0 [
38]. In turn, the C/N ratio of maize mixture achieved the value of 33.6 and for giant cane mixture it was 35.3 [
39]. The C/N ratio ranging from 32.6 to 44.5 was found in maize silage [
40]. On the other hand, the feedstock consisted only of microalgae biomass has low C/N ratio (about 10) [
41]. Decreasing biogas production in low C/N ratio is attributed to the high concentration of ammonia nitrogen and volatile fatty acids in the chamber of anaerobic reactors. That may cause the inhibition of biochemical pathways [
41]. The way to reduce this effect is to mix the organic substrates in appropriate proportions [
29]. However, literature review doesn’t provide the exact ranges of C/N ratio for undisturbed course of anaerobic digestion. It is assumed that the optimal C/N ratio should be in the range of 16 to 25 [
42], although according to others authors it may vary in a wider range from 20 to 70 [
43], or even in a narrower range from 12 to 16 [
44]. A range of 20 to 30 is also given [
45].
In these studies it was found that the presence of microalgae biomass in the feedstock for anaerobic digestion significantly improved the value of the C/N ratio. Nevertheless, the increase in microalgae biomass above 40% of VS content in the feedstock did not have a significant impact on biogas production, despite the correct C/N ratio. In series 1, the C/N ratio ranged from 13.1 ± 0.7 in setup 6 to 30.1 ± 1.3 in setup 1, and the biogas production varied from 620.5 ± 14.6 L/kg VS in setup 1 to 923.6 ± 25.1 L/kg VS in setup 6. However in series 2, the C/N ratio achieved went from 15.1 ± 0.6 in setup 6 to 30.1 ± 1.3 in setup 1, and the biogas production increased from 620.5 ± 14.6 L/kg VS in setup 1 to 1058.8 ± 25.2 L/kg VS in setup 4.
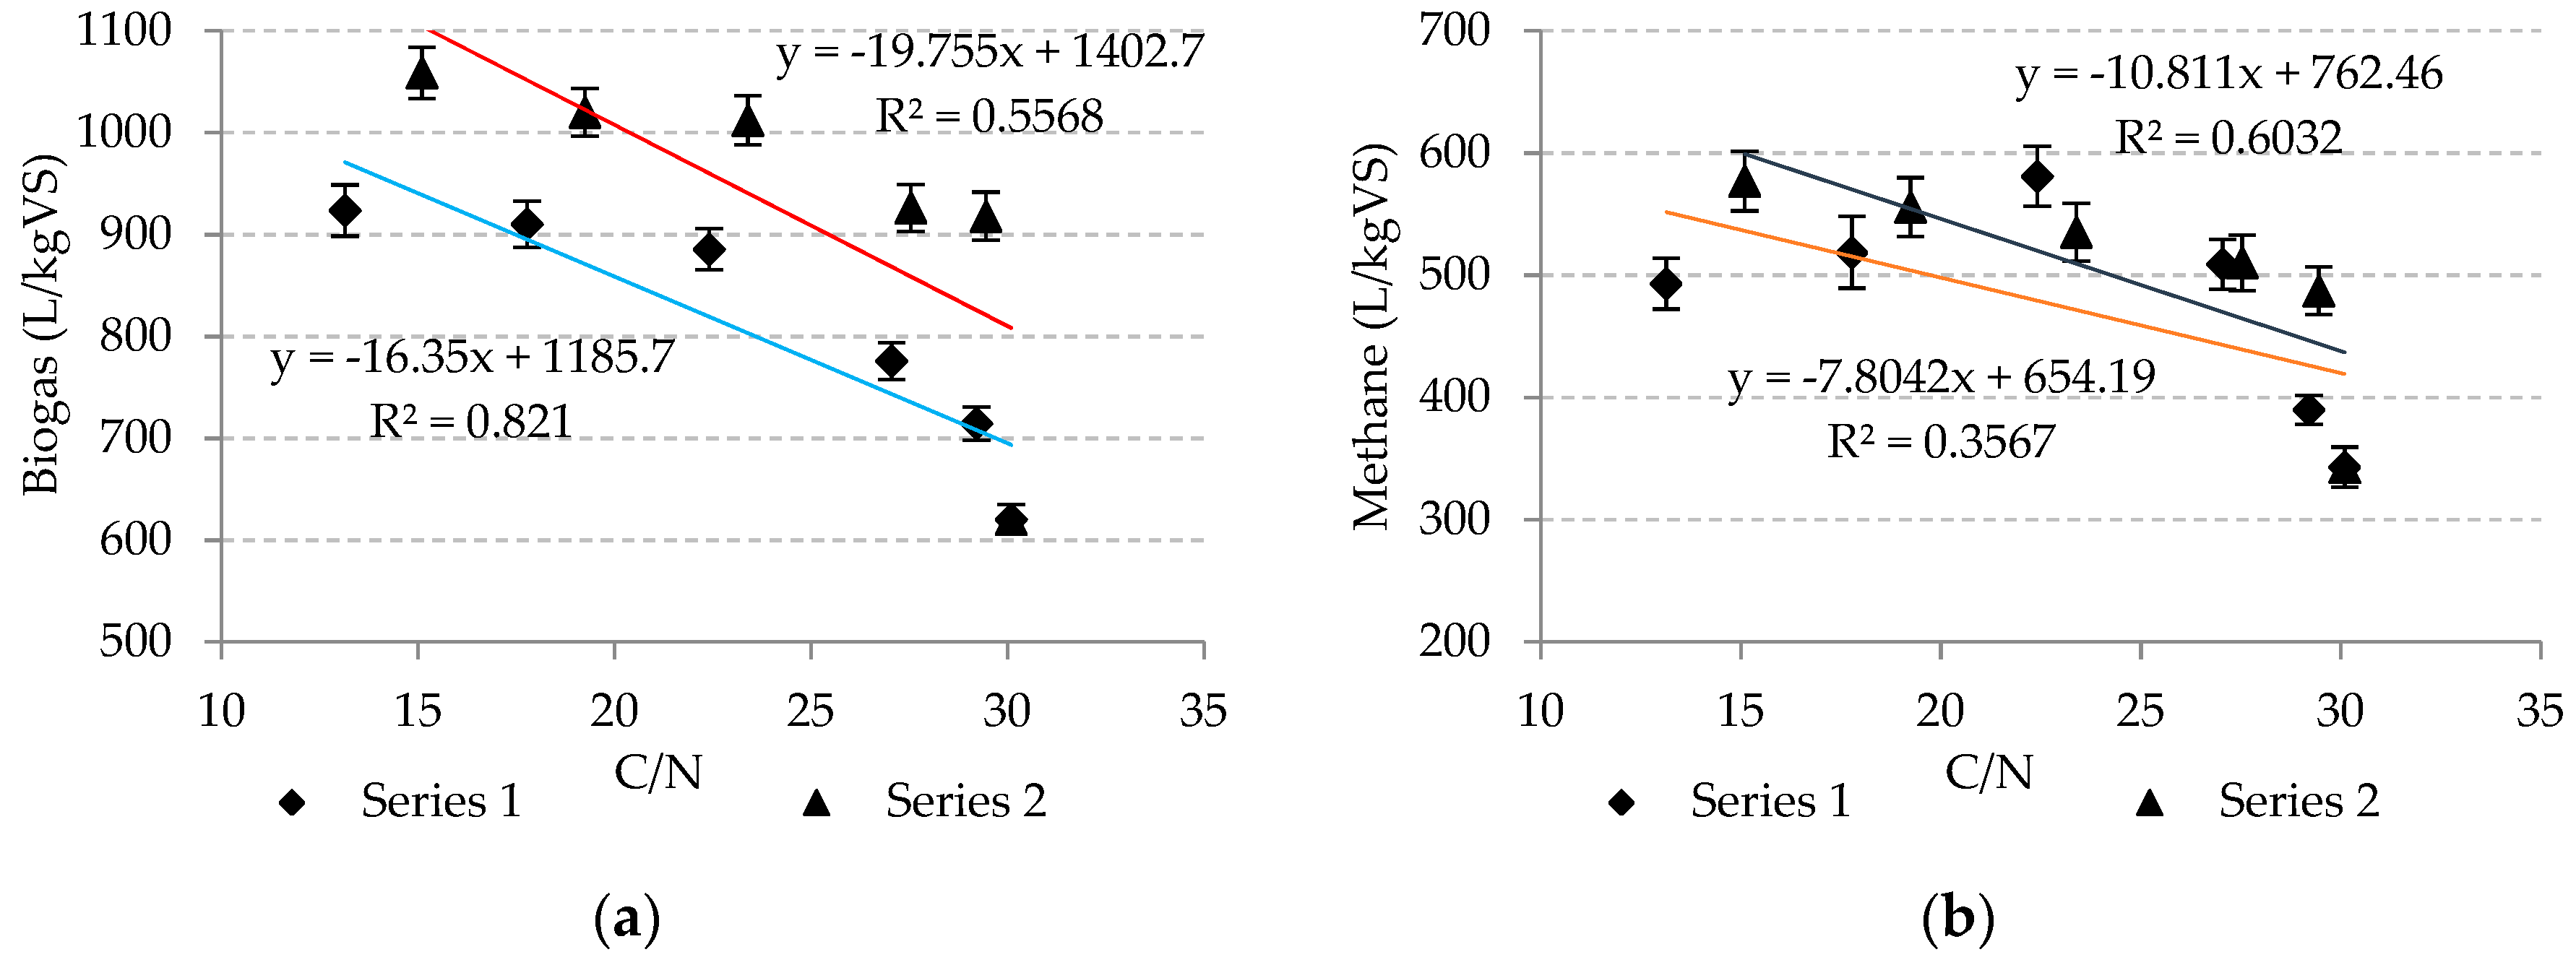
In series 1, there was a very strong correlation between the biogas production efficiency and the C/N ratio (r
2 = 0.8219), (
Figure 2a). However, in series 2 this relationship was less coherent (r
2 = 0.5568), (
Figure 2a). In turn, the variation of methane production was strongly dependent on the value of the C/N ratio in series 2 (r
2 = 0.6032), (
Figure 2b), and only moderately dependent in series 1 (r
2 = 0.3367), (
Figure 2b).
The effect of C/N ratio has been also demonstrated in studies on algae co-digestion with maize silage [
46]. The highest level of biogas production (varying from 922 to 1184 mL over 30 days of anaerobic digestion) was achieved with a C/N ratio from 16 to 25. The highest content of methane in biogas of 54.9% was observed when the C/N ratio was 20, while in others setups it was about 51.0% [
46].
The multiple regression models indicated that biogas production is strongly affected by the total nitrogen (TN) concentration, as well as by the amount of volatile solids (%TS) in the feedstock for anaerobic digestion. The estimated values of biogas production in the equations in relation to the results obtained in the experimental studies are very high, which indicates the correctness of the assumptions that were made, as well as the useful value of the optimization model. The regression equations for the estimation of biogas production (B) in both series of the experiment are shown in
Table 7.
4. Conclusions
It is widely claimed that the demand for renewable energy can be largely met by anaerobic digestion of biomass with different characteristics and origins. However, there are analyses that deny this claim. Unreasonable management of biomass resources may lead to an increase in greenhouse gas emissions, as well as negatively affecting the global food supply by increasing prices. Thus, there is a need to look for other sources of biomass for energy purposes that will meet the economic and ecological criteria. Microalgal biomass is an alternative to typical energy crops due to high photosynthetic efficiency of microalgae, fast rate of growth, the potential to utilize CO2 emissions, resistance to various types of contamination, and the fact that microalgae can be cultured in areas that cannot be used for other purposes. In this study, the effect on anaerobic digestion performance of microalgae biomass added to feedstock mixture was analyzed.
The study showed that mixing the substrates commonly used in agricultural biogas plants (i.e., cattle slurry and maize silage) with microalgae biomass of Arthrospira platensis and Platymonas subcordiformis positively affected the final biogas production and the methane concentration in biogas.
A systematic increase was found in the biogas production with an increasing concentration of microalgae biomass ranging from 0% to 40% of VS content in the feedstock mixture for anaerobic digestion. Above this concentration, no significant increase in the biogas production was observed, and the production remained at a stable level. This was probably related to the decreasing C/N ratio in the feedstock.
It was shown that the addition of Platymonas subcordiformis biomass to the substrate mixture allowed us to achieve higher maximum biogas production (1058.8 ± 25.2 L/kg VS) than was obtained with Arthrospira platensis biomass (923.6 ± 25.1 L/kg VS). In turn, the highest methane content in biogas (over 65%) was observed in setups in which the amount of Arthrospira platensis biomass ranged from 20% to 40% (%VS).
There was a strong correlation between the biogas and methane production efficiencies and C/N ratio of r2 = 0.5568 and r2 = 0.6032 respectively, when the biomass of Platymonas subcordiformis was used. In turn, the relationship between biogas production and the C/N ratio was very strong (r2 = 0.8219), and there was a moderate relationship between the methane production and C/N ratio (r2 = 0.3367) in series with Arthrospira platensis biomass.

 ,
, 


