1. Introduction
The penetration of grid-connected distributed generators (DGs) has increased rapidly due to economic incentives and technological maturity. In particular, small- and medium-sized DGs in low voltage systems are more frequently installed due to their low investment costs and short construction period. However, the high penetration of DGs may cause reverse load flow and over-voltage in the power system [
1,
2,
3,
4,
5,
6]. Voltage rises impair power quality and cause system losses, and in severe cases, DGs can be tripped by protection systems. These problems can limit the hosting capacity to expand the spread of DGs to the grid.
The reactive power supply capability of inverter-based distributed generation power sources, which can easily control the reactive power, can be used to solve the voltage rise problem [
4,
5,
6,
7,
8,
9]. Reactive power control of inverter-based DGs is preferred, not only due to the fast response time, but also due to its reduced cost compared to output power reduction or system expansion.
Most grid codes require reactive power control capabilities for individual DGs, and recently, most DGs have been designed to meet the requirements of grid code. For example, Verband Deutscher Elektrotechniker (VDE) in Germany proposed several reactive power control methods [
9,
10,
11]. The reactive power control methods proposed by VDE include the fixed reactive power method, fixed power factor (PF) method, PF control of active power output PF(P), and voltage-dependent reactive power control Q(V) method [
9,
10,
11,
12,
13,
14,
15,
16].
Among the reactive power control methods, the power factor control method determines the reactive power output according to the active power output of the DG. The power factor control method is effective to mitigate voltage fluctuations caused by the output of the DGs. However, it cannot cope with changes in external DG, such as load fluctuations or substation voltage fluctuations. In situations where voltage rise is low due to external factors, reactive power support through power factor control can increase system losses.
The Q(V) method determines the reactive power according to the connection point voltage of the DG. Since the voltage varies depending on the location, the reactive power support depends on the connection point of the DG. Reactive power support is mainly focused on the feeder terminals with high voltage fluctuations, resulting in small system losses but weak voltage regulation ability.
In this study, the reactive power control technique of distributed generation to prevent overvoltage in low voltage system [
5], the reactive power control method using local voltage information and active power output variable of PV (hereinafter referred to as PF(P,V) method) are proposed. The PF(P,V) method proposed in [
5] controls the reactive power by adjusting the parameters of the PF (P) method, according to the voltage at point of connection of a PV. The PF(P,V) method showed higher voltage regulation ability than the Q(V) method, while reducing system losses than the PF(P) method.
Another reactive power control method of Q(V) with additional adjustment of offset voltage according to the active power output of DG is studied to improve the voltage regulation ability [
17]. However, the reactive power output of the DG installed at a location with low voltage variation may not be sufficient to support the voltage because the method is affected by the location of the DG installation in the grid.
In this paper, a hybrid reactive power control method which combines PF(P) and Q(V) is proposed to achieve not only the voltage regulation performance, but also the high efficiency operation. The proposed method determines the reactive power reference of the DG as a weighted sum of the reactive power references from both PF(P) and Q(V) controllers. The variable weight of each reactive power reference is designed as a function of the active power output of the DG because the appropriate control method can be utilized according to the level of active power output of the DG. When the active power is high, the PF(P) controller is dominant and enhances the voltage regulation ability. On the other hand, the Q(V) controller is dominant when the active power is low to minimize the system losses caused be reactive currents. The performance of the proposed method was compared and evaluated with the existing methods in the test feeder model using MATLAB tools.
Section 2 describes the voltage variation characteristics of low-voltage network systems using voltage sensitivity analysis.
Section 3 reviews the existing reactive power control method and describes the proposed reactive power control method based on analysis of the existing reactive power control method.
Section 4 compares the performance of the proposed reactive power control method with that of the existing reactive power control method through simulation.
2. Voltage Sensitivity Analysis
In the grid model, assuming that the voltage on the slack bus is constant, the bus voltage inside the grid is affected by fluctuations in power flow [
18,
19,
20]. Voltage sensitivity analysis can be used to analyze the relationship between active or reactive power fluctuations and the voltage fluctuations of the internal buses [
19]. Voltage sensitivity can be derived using the Newton-Raphson method. The voltage sensitivity matrix
is defined as the inverse of the Jacobian matrix
obtained by iterative calculations using the Newton-Raphson method until the voltage equation solution of Equations (1) and (2) satisfies the tolerance
[
5,
19]. In Equations (1) and (2),
and
are the magnitude and phase of voltage,
and
are the magnitude and phase of admittance:
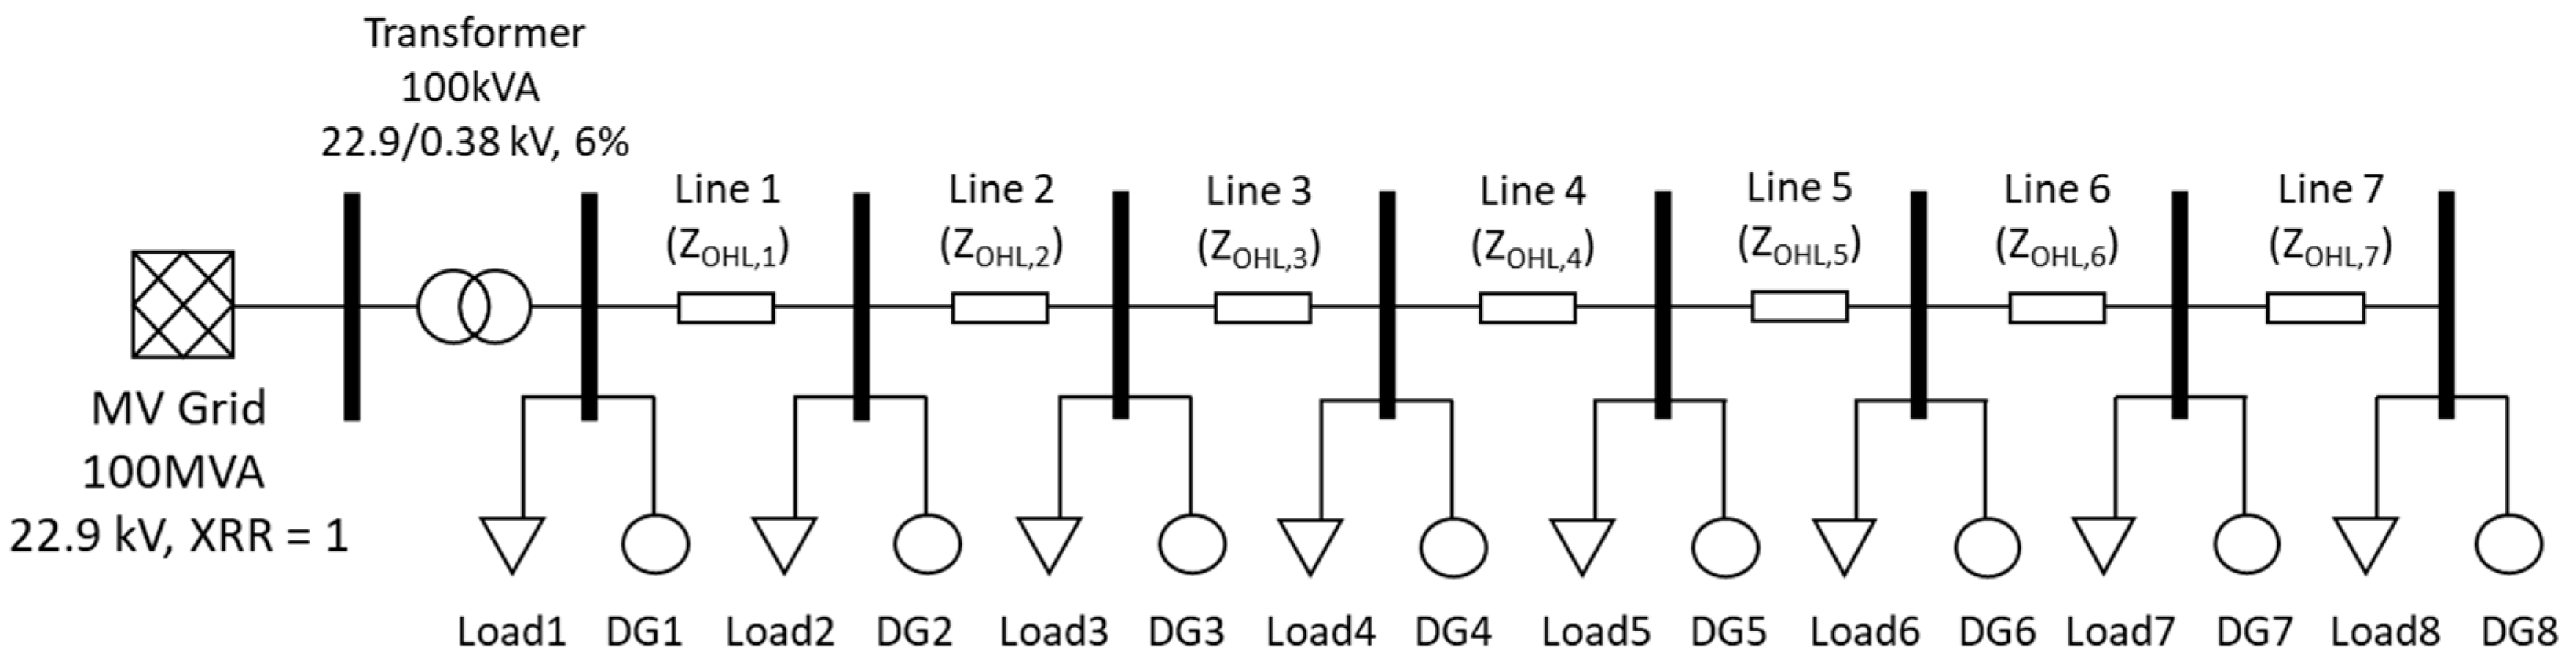
The radial feeder model shown in
Figure 1 and
Table 1 was implemented in MATLAB to analyze the voltage sensitivity based on the location of the generator or load. In the radial feeder model, the voltage sensitivity matrices
and
for the 10 kW active power fluctuations are given by Equations (3) and (4). The voltage sensitivity analysis for the radial feeder model in
Figure 1 shows that the voltage sensitivity at each node is lowest at the DG1 node directly connected to the substation transformer. It was the highest at the DG8 node connected through the substation transformer and the long-distance line (line 1 through Line 7 in
Figure 1). It is highest in connected DG8 nodes. This means that the voltage variation is the smallest in the DG1 node and the voltage variation is the largest in the DG8 node for the active and reactive power variations of each node.
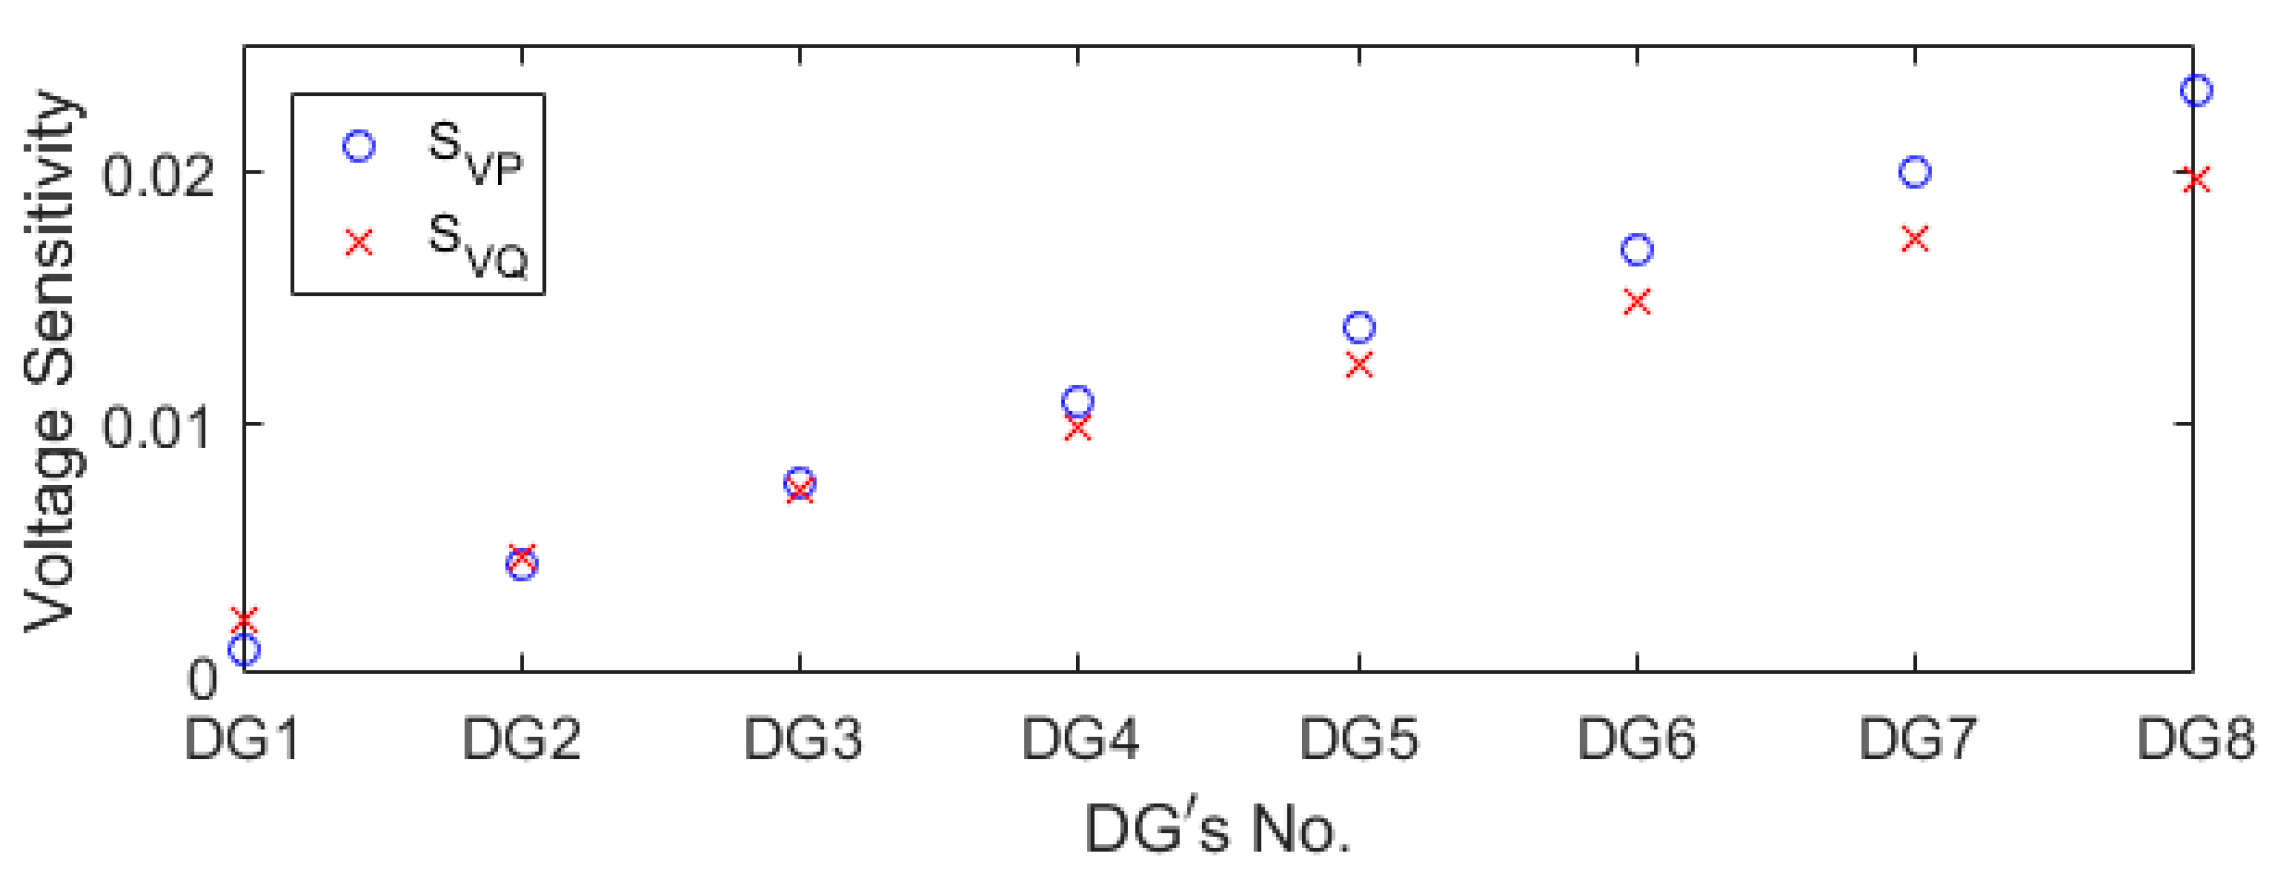
Figure 2 shows the voltage sensitivity for the DG8 node, which exhibits the largest voltage fluctuations with power flow in the radial feeder model of
Figure 1. In
Figure 2, the blue circle represents the voltage sensitivity of the DG8 node to the active power of each node, and the red x represents the voltage sensitivity of node DG8 to the reactive power of each node. In
Figure 2, the voltage sensitivity for active power is higher than that for reactive power. This means that the short circuit ratio (SCR) and X/R ratio of the feeder model are low, so that the grid voltage fluctuation is greatly influenced by the active power. The longer the line length between the substation transformer and the node, the higher the voltage sensitivity to reactive power. This means that for the same reactive power injection, the contribution to voltage regulation is high in the DG connected to the node with the long length of line between the substation transformer and the node.
3. Q(V) and PF(P) Control Methods
The existing reactive power control methods of the DG for voltage regulation include the fixed PF method, PF(P) based on the active power output, and the voltage dependent Q(V) method [
9,
10,
11,
12,
13]. In this section, the existing reactive power control methods are described, along with the Q(V) and PF(P) hybrid reactive power control method model, which overcomes the disadvantages and inherits the advantages of existing reactive power control methods.
3.1. Power Factor Control Methods Based on Active Power
The fixed PF and PF(P) methods determine the amount of reactive power output according to active power
, assuming that the voltage rises according to the
of the DG regardless of the load variation. Equation (5) is an equation for calculating the reactive power reference
of the DG according to the P when the PF reference
is determined:
The fixed PF method maintains constant PF and absorbs reactive power proportional to the active power output. However, if the power generation of the DGs is low, the risk of potential over-voltage is small because the produced power can be consumed locally. In this case, reactive power absorption unnecessarily increases system losses [
5]. The PF(P) method improves the disadvantage of the fixed PF method by increasing the PF in the low active power output section and reducing the PF in the high active power output region. Equation (6) is power factor reference formula for active power output of PF(P) and
Figure 3 shows characteristic curve of PF(P) in
Figure 3, where
is the active power of DG, PF is power factor of output of DG and
is the power factor limit value of DG, which is related to the minimum requirements specified in the grid code.
Figure 3 shows the PF-P characteristic curve:
3.2. Voltage Dependent Reactive Power Q(V) Control Method
The Q(V) method directly uses the voltage at the connection point of DG to determine the reactive power output. Equation (7) is the reactive power reference formula for the voltage of Q(V) control, and
Figure 4 shows the Q-V characteristic curve for the Q(V) method, where
is the reactive power reference of DG,
is the voltage at the connection point of DG, and
is the limit value of DG.
3.3. Characteristics of Existing Reactive Power Control Methods
Voltage varies not only with the production of power, but also with the consumption. The power factor control method, which can be called an open loop control method, determines the reactive power output using only the active power output information of the DG, and thus does not respond to load fluctuations.
On the other hand, the Q(V) method is a kind of closed loop control method that directly uses the grid voltage information to determine the reactive power output, and thus responds to the grid state (voltage) including load fluctuations, as well as DG output fluctuations. However, the voltage fluctuation, according to power flow, varies depending on the location where the DG is installed, and the voltage fluctuation increases in the region where the voltage sensitivity to power is high. Therefore, when using the Q(V) method for a low voltage feeder with multiple DGs connected, the reactive power support of each DG is focused on DGs in location with high voltage sensitivity. And DGs located in low voltage sensitivity may have low reactive power support even when the critical bus voltage rises close to the limit.
In order to analyze the characteristics of the existing reactive power control methods, Radial grid model with multiple DGs in
Figure 1 is simulated using parameters of reactive power control methods as shown in
Table 2.
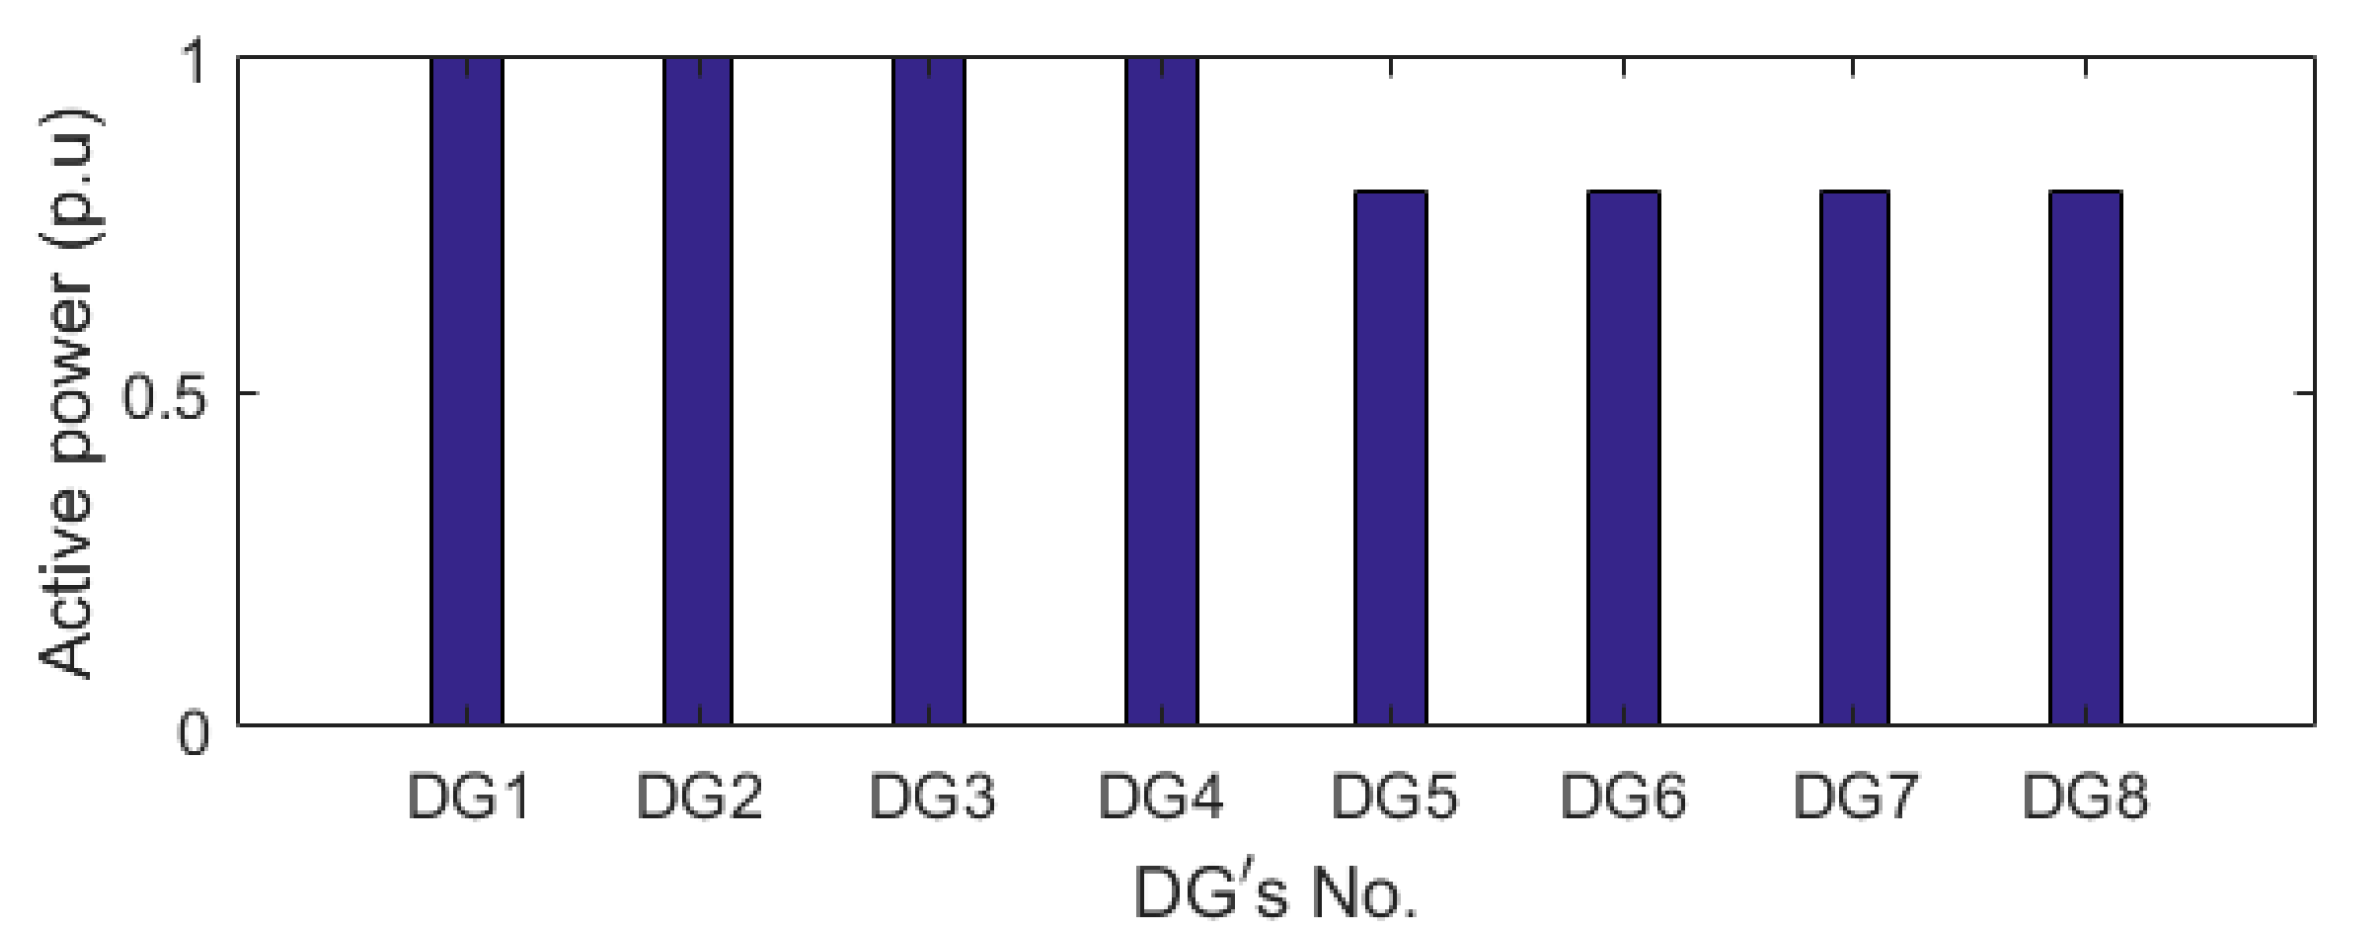
In order to analyze the reactive power characteristics according to the power generation and consumption in the system, the active power output of DG1~DG4 distributed power supply is set to 1.0 p.u. and DG5~DG8 distributed power is set to 0.8 p.u. as shown in
Figure 5. In this study, and all loads in the feeder model were simulated by dividing the case of not consuming active power and consuming 30% of the DG rated active power.
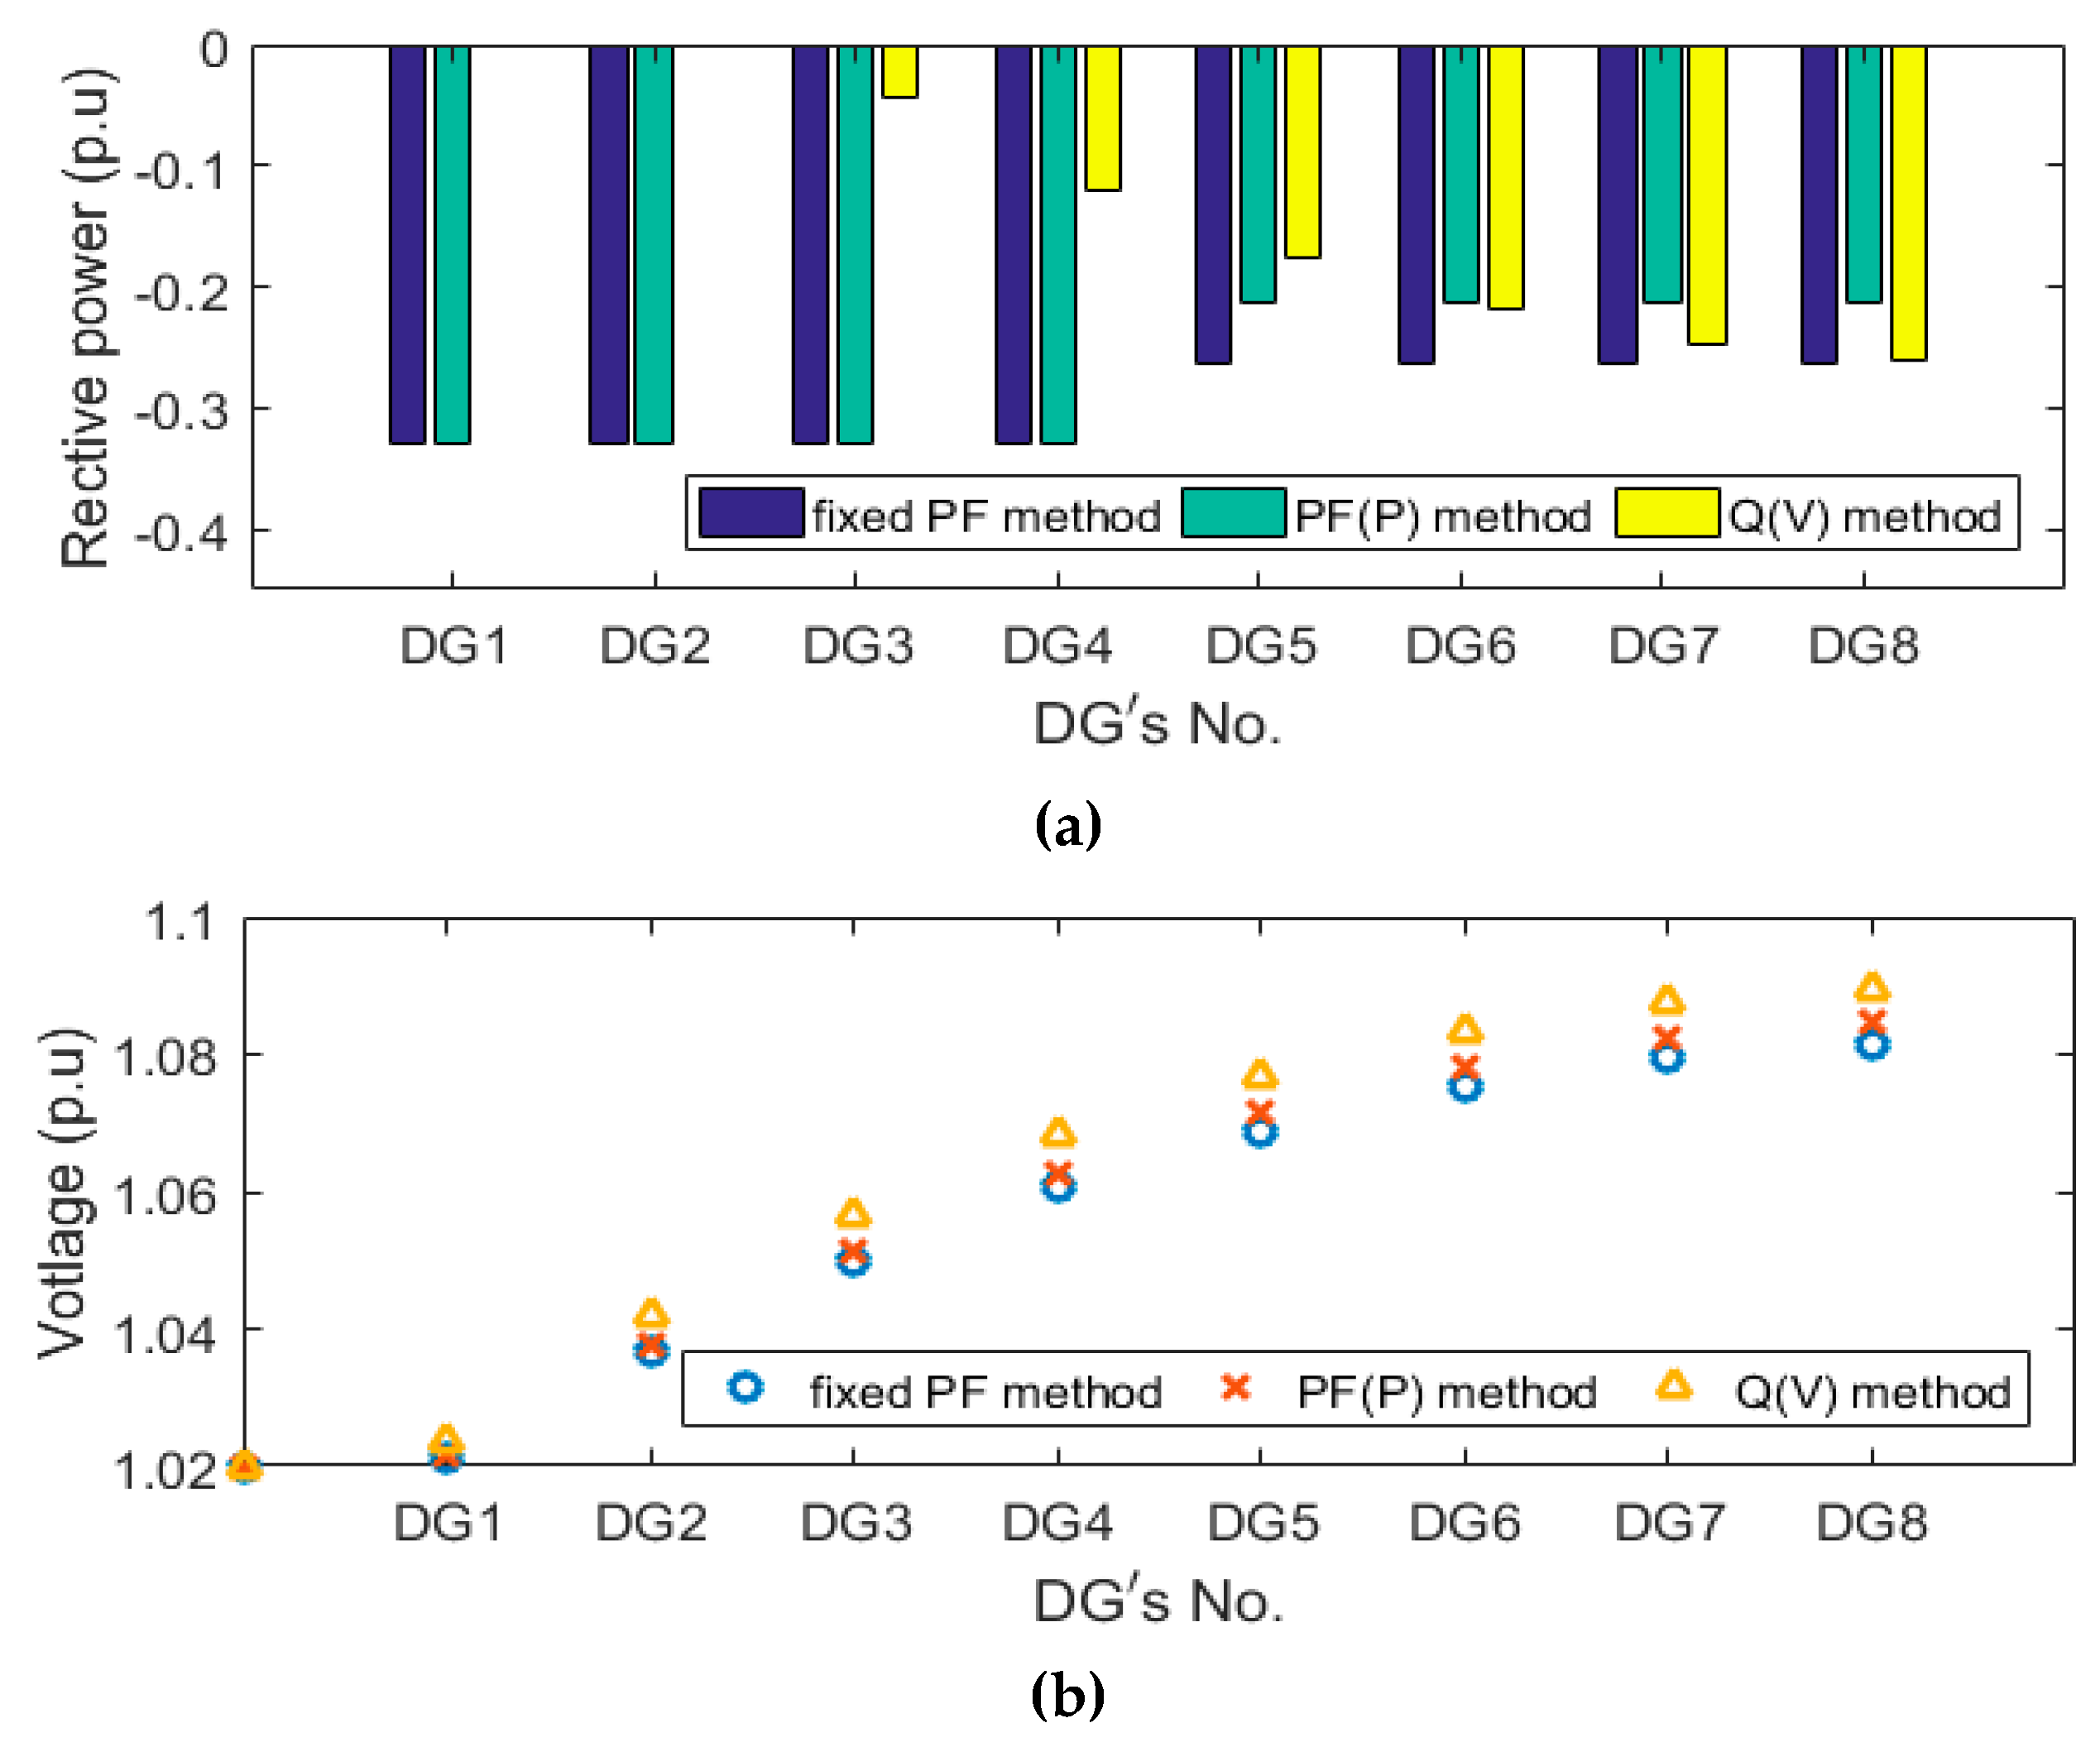
Figure 6 shows the reactive power output of the DG and the bus voltage when all loads consume 0.0 p.u. In this case, the voltage rise is large because the power consumption of the load is very low. In
Figure 6a, the fixed PF and PF(P) method output reactive power according to the active power output regardless of the position of DGs. In the case of fixed PF, all DGs output reactive power with a PF of 0.95, and for PF(P), DG1 through DG4 output reactive power with a PF of 0.95 and PF of 0.97 from DG5 to DG8, so that The total reactive power of the DGs is reduced compared to the fixed PF. In the Q (V) method, the DGs in the high voltage sensitive area had high reactive power output, and the DG1 and DG2 located in the very low voltage sensitivity did not output the reactive power.
In
Figure 6b, the voltage rise is the lowest for the fixed PF method with the highest total reactive power of the DGs. When operating in the Q(V) method, the voltage rise was the highest, and the voltage of the DG8 located at the highest voltage sensitivity increased close to the voltage limit value (1.1 p.u.).
Figure 7 shows the reactive power output of the DG and the bus voltage when all loads in the system are set to 30% of the rated power of the DG. In
Figure 7a, when operating with fixed power factor and PF(P) method, DG outputs reactive power in the same way as when load is 0 p.u. On the other hand, in the Q (V) method, the reactive power output is significantly reduced compared to the case where all loads are 0 p.u. In
Figure 7b, the bus voltage showed the largest increase in the Q(V) method, but the voltage of DG8 was about 1.06 p.u. lower than the voltage limit value due to the power consumption of the load.
In summary, the fixed PF method outputs reactive power that is proportional to the active power output of the DG regardless of the load, and the highest amount of reactive power of the entire DG results in the highest system losses but the lowest voltage rise. In the PF(P) method, DG that outputs active power lower than the rated power outputs reactive power smaller than the fixed PF method, so that the system losses can be expected to be lower than the fixed PF. The Q(V) method regulates the amount of reactive power according to the load, as well as the active power output of the DG, and the reactive power support is concentrated on the DGs in areas with high voltage sensitivity, resulting in the lowest total reactive power of the DGs. However, even when the bus voltage in the area with high voltage sensitive rose close to the limit value, the DGs in the area with low voltage sensitive supported little reactive power.
4. Proposed Reactive Power Control Method
In the previous section, the characteristics of the power factor method and the Q(V) method were analyzed in terms of system losses and voltage regulation ability. In this paper, a reactive power control method combining PF control and Q(V) method was proposed to highlight the advantages and to complement the disadvantages of the existing reactive power control method.
The proposed reactive power control method calculates the reference of reactive power through the Q(V) controller and the PF(P) controller, and the reactive power of the DG is determined by applying a weighting factor to the references of reactive power calculated from each controller, as shown in Equation (8). In Equation (8), and are the reactive power reference calculated through the PF and Q(V) controllers, and is the weighting factor. The weighting factor is set in the region of 0 to 1. The proposed model works similar to Q(V) as approaches 0 and similar to PF(P) as approaches 1.
When the load on the system is light and the output power of the DGs are high, the risk of overvoltage is high. Therefore, when the output of the distributed generation is high, it is advantageous to mitigate the voltage rise by setting the K factor close to 1 and operating close to the power factor control method. Moreover, during periods of low risk of overvoltage, setting the K factor close to zero and operating in a Q(V) method is beneficial to lower system losses. The proposed method is designed to adjust the
factor, according to the active power output of DG.
is set close to 0 so that the weight of
can be increased when the active power is low, and
is set close to 1 so that the weight of
can be increased when the active power is high. In order to implement the above operation, the weighting factor
can be set according to the active power interval as shown in Equation (9). In this paper,
is recommended to be set to 0 because Q(V) has less system losses than PF(P).
is recommended to be set to less than 1 because PF (P) has a strong voltage regulation ability but cannot respond to a load, increasing system losses under heavy load. When DG outputs high active power, DGs located in low voltage sensitivity region outputs less reactive power as
is smaller.
Figure 8 shows an example profile of the weighting factor
and the block diagram of the proposed reactive power control method.
Performence Analysis of the Proposed Method
In order to evaluate the characteristics of the proposed method, the reactive power control methods and test feeder model of
Figure 1 were implemented in MATLAB/Simulink(R2016a, MathWorks, Natick, MA, USA) with parameters in
Table 1. The power flow simulation model for evaluating the performance of the reactive power control method was developed, as shown in the flow chart of
Figure 9. The power flow simulation model iterates the power flow calculation until all
and
mismaches are less than the convergence tolerance
. In the case of simulating the reactive power control for the voltage, the reactive power of the DGs was calculated with the updated voltage through repetitive calculation in the power flow analysis. The parameters of reactive power control implemented in the simulation are set as shown in
Figure 10.
The performance criteria for the reactive power control method can be defined in terms of the grid losses and increased amounts of DG capacity for the grid [
5]. In order to analyze the performance of the reactive power control method, the active power output data of the DG was applied to the annual solar power output data of 2017 measured in Yeongam-gun, Jeollanam-do, Korea.
Figure 11a,b shows the PV inverter output profile for January and July and
Figure 11c shows the annual histogram of output data in 2017.
Figure 12 shows a daily profile of reactive power output according to the active power profile for DG1 (located in the lowest voltage sensitivity region) and DG8 (located in the highest voltage sensitivity region). The PF(P) control method absorbs the reactive power according to the active power output regardless of the voltage sensitivity of the point of connection, so that they absorb the same amount of reactive power. On the other hand, in the Q(V) control method, DG1 does not absorb reactive power in the whole range of active power variation, and DG8 has an absorption amount similar to the PF(P) method. In the proposed method, the reactive power is the same as that of the Q(V) method in the section where the active power is less than 0.8 p.u. The reactive power absorption amounts for the DGs located near the transformer were increased compared to amount with the Q(V) method in the section where the active power is above 0.8 p.u.
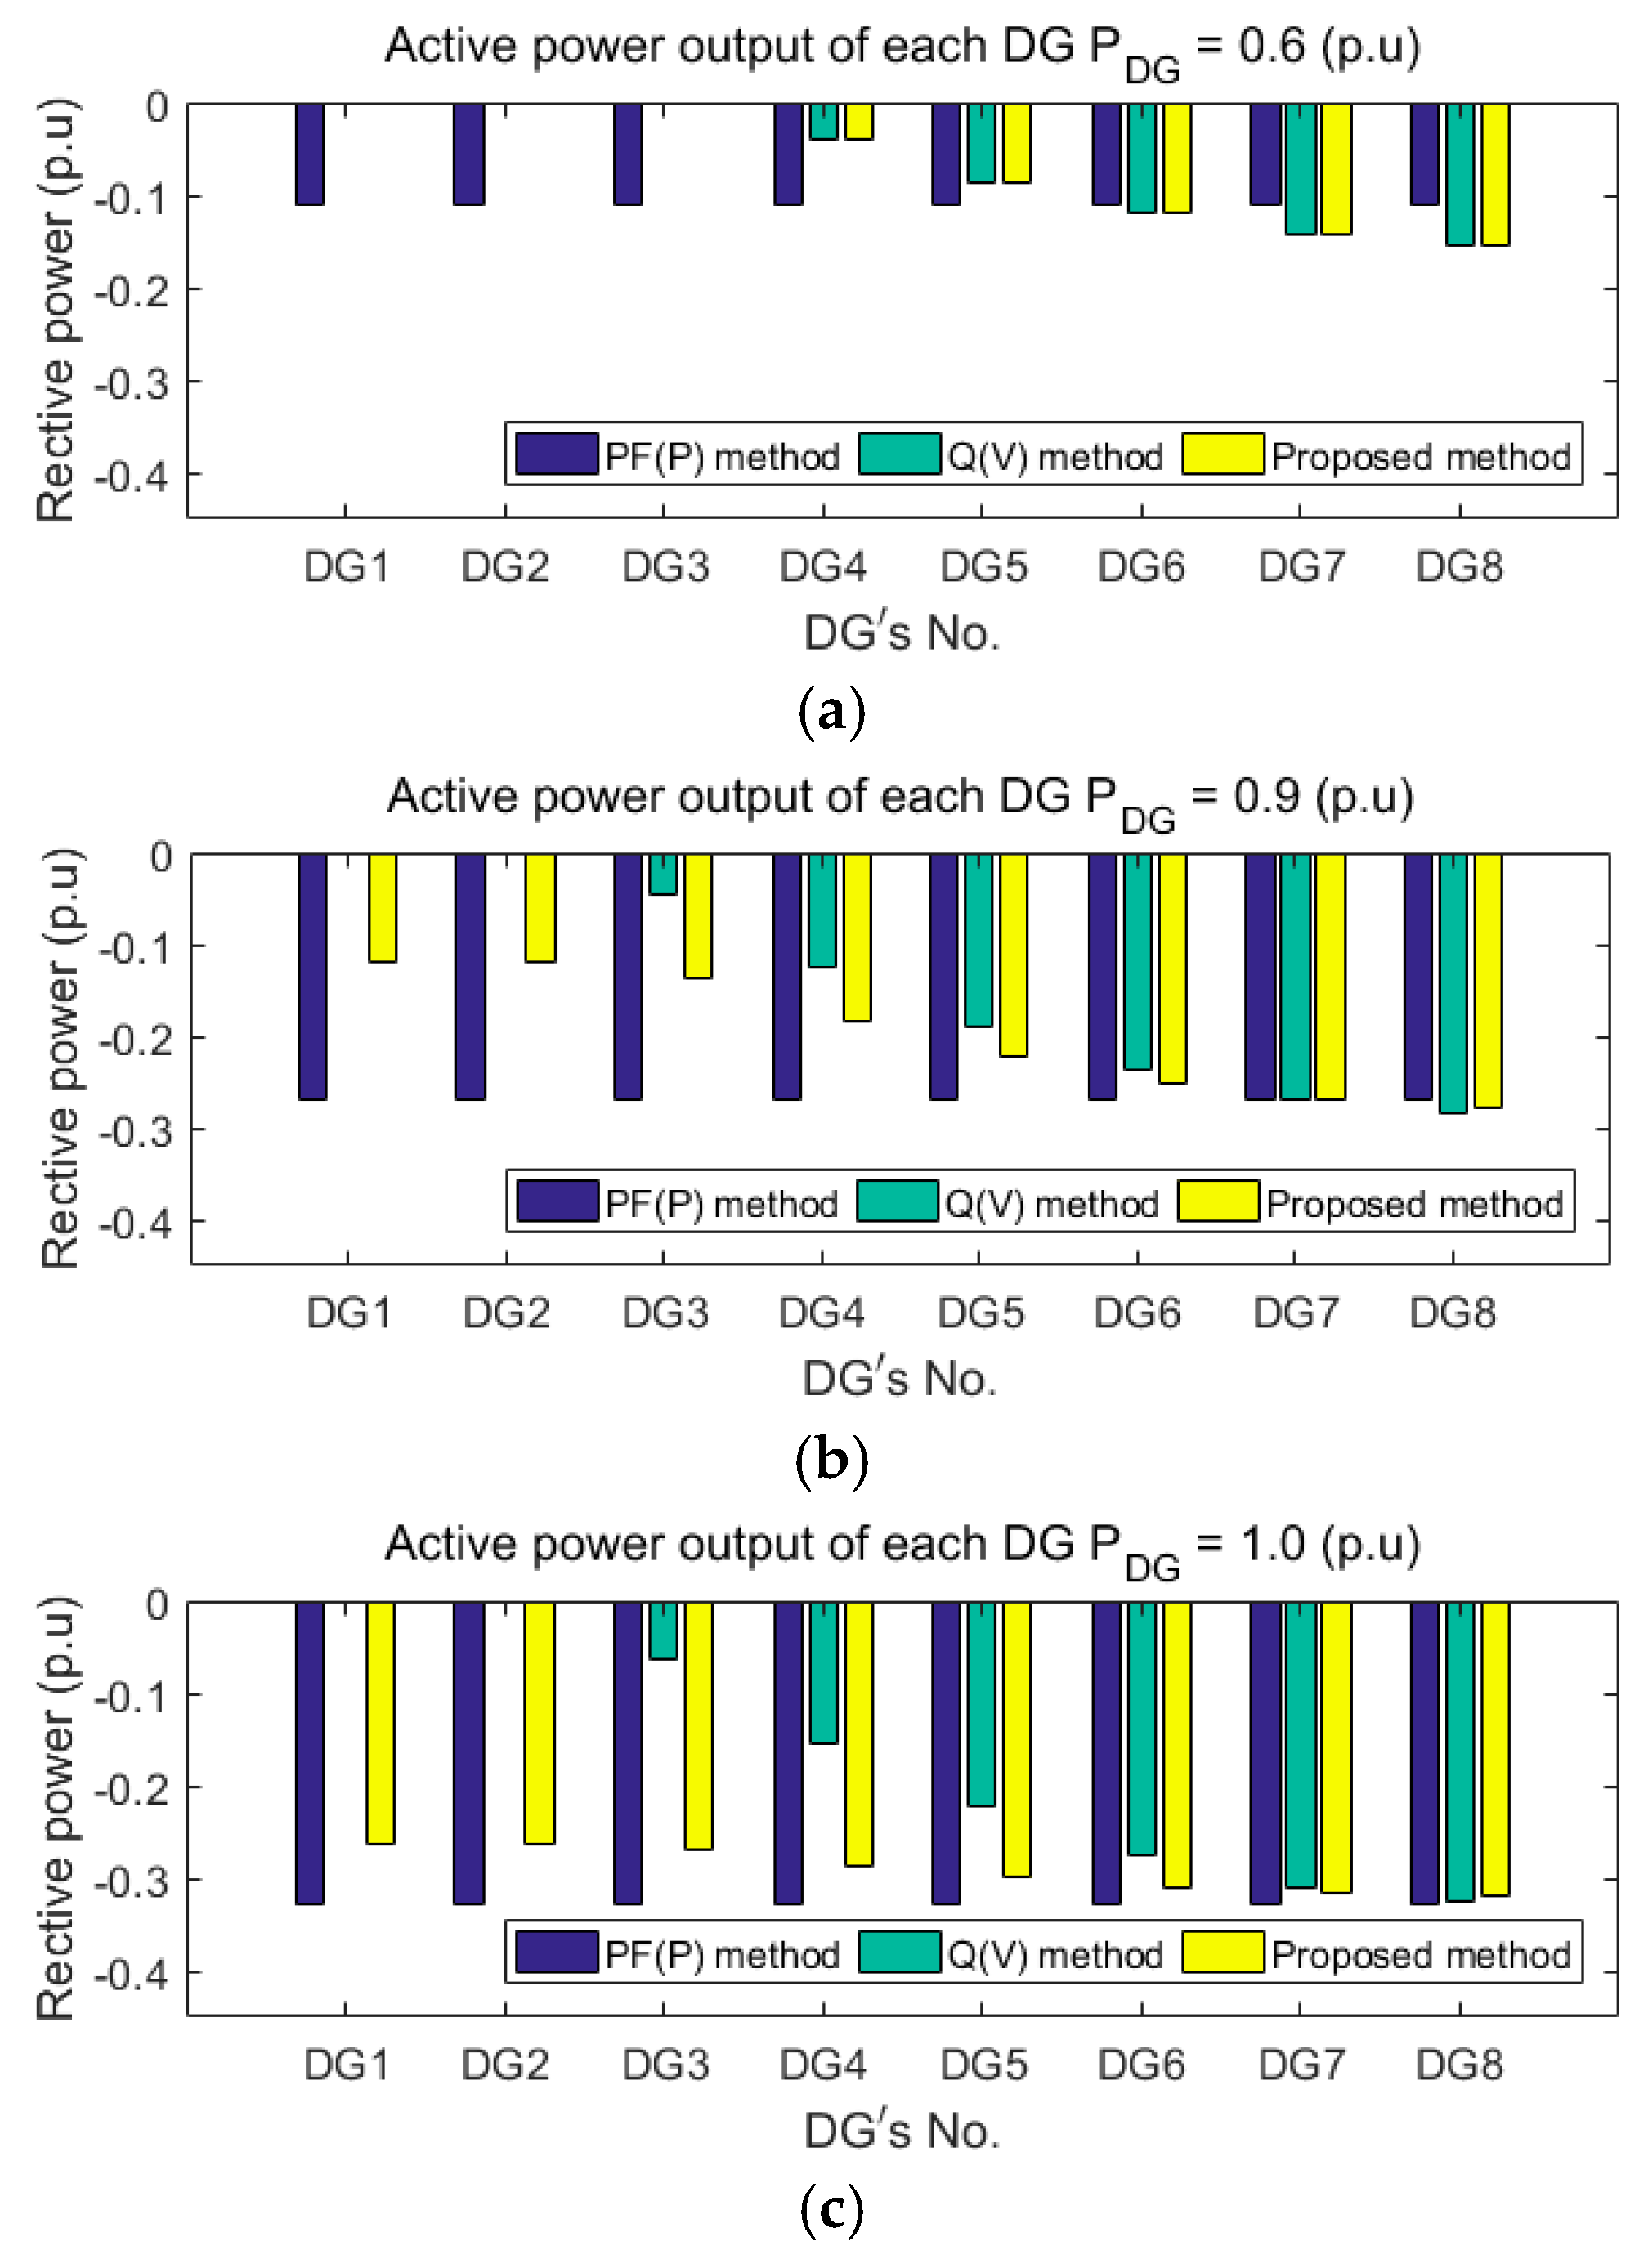
Figure 13 shows the reactive power output for each DG, according to the active power output and the reactive power control mode of the DG. In the case of PF(P) in
Figure 13, the DGs at all positions output the same amount of reactive power, whereas with the Q(V) method, the DGs near the transformer have almost no contribution to the reactive power support. It can be confirmed that it contributes to the support. In the proposed method, the reactive power is absorbed in the same manner as Q(V) in the section below the output of 0.8 p.u. In the section above the output of 0.8 p.u., the reactive power absorption of the DGs in the area with low voltage sensitivity is increased in comparison to Q(V).
Figure 14 shows the voltage at the critical bus (connection point of DG8) which is the most critical bus with the different reactive power control methods. In
Figure 14, dotted line represents the voltage limit value of the test feeder model. In
Figure 14, when the DGs does not absorb reactive power, the critical bus voltage exceeds the over-voltage limit (1.1 p.u.). In the Q(V) method, the critical bus voltage did not exceed the over-voltage limit, but was close to 1.1 p.u. The voltage rise in the PF(P) method was the lowest, and the voltage rise of the proposed method was between the voltage levels for the Q(V) and PF(P) methods.
Table 3 shows the analysis results for 2017 annual data under different reactive power control methods. As shown in
Table 3, the PF(P) method mitigates the voltage rise through high reactive power absorption, whereas the Q(V) method shows the lowest reactive power absorption, but the maximum voltage of the critical bus approaches the over-voltage limit. The PF(P) and Q(V) hybrid method maintains the maximum voltage at the voltage level between Q(V) and PF(P) while the reactive power absorption amount is similar to that of Q(V). The annual grid losses were highest with the PF(P) method and lowest with the Q(V) method. The grid loss for the Q(V) and PF(P) hybrid method was higher than that for the Q(V) method, but the difference was insignificant.
Figure 15 was obtained by schematizing system losses and the maximum voltage at the critical bus by the reactive power control method of
Table 3 on a plane coordinate. In
Figure 15, the horizontal axis represents the active power losses and the vertical axis represents the maximum voltage of the critical bus. In terms of the losses for the reactive power control system, the better the performance, the closer the marker is to the vertical axis, and the better the voltage regulation performance, the closer the marker is to the horizontal axis. Better performance brings the marker closer to the point where the vertical and horizontal axes intersect. The proposed reactive power control method is closest to the point where the vertical and horizontal axes intersect with other reactive power control methods, and the efficiency and voltage adjustment ability from the viewpoint of the system loss are generally excellent overall.
Compared with the base voltage in
Table 3, the maximum voltage reduction in the critical bus due to reactive power control is very small. However, comparing the maximum voltage magnitude in critical bus according to reactive power with the voltage limit value (10% of base voltage) as shown in Equation (10). In addition, the efficiency of reactive power control can be easily compared by calculating an increase rate of system losses due to reactive power control in contrast with the system loss when the reactive power control is not performed as shown in Equation (11).
Table 4 shows the result of re-arranging the result of
Table 3 according to Equation (10) and Equation (11):
In the proposed method in
Table 4, the increase rate of system losses was increased by 0.12% compared to Q (V), but the maximum voltage reduction was about 0.062 lager. By comparing the proposed method with the PF(P) method, it appears that the proposed method lowered the maximum voltage reduction by 0.025 less, but the system losses were reduced by 2.36%. Among the reactive power control methods, the proposed method has the largest reduction of the maximum voltage compared to the increased system losses.
5. Conclusions
In this paper, existing reactive power control methods of DG for mitigating the voltage rise in low voltage systems were analyzed. A reactive power control method has been proposed that improves the disadvantages of voltage regulation and system loss reduction of existing methods. Existing reactive power control methods use only active power information or point of connection voltage information, and thus, have advantages and disadvantages in terms of voltage regulation ability and system losses. In case of PF(P) method that determines reactive power output using only active power output information of DG, voltage regulation performance is strong, but it does not respond to external variables such as loads. In the Q(V) method, the network losses are low, but the reactive power support of the DG is focused on the DG at the location where the voltage sensitivity is high.
In this paper, a reactive power control method is proposed that calculates the reactive power command by adjusting the ratio of reactive power references, calculated by PF(P) controller and Q(V) controller by applying weights according to the active power output of DG. In addition, the proposed method improves the performance of voltage regulation ability and system losses in comparison with the existing reactive power control methods by using output of DG and point of connection voltage together. In order to evaluate the performance of the proposed method, the output data of the photovoltaic power plant measured in Yeongam, Jeollanam-do in 2017, was applied to the radial grid system simulation model to compare the performance with the existing reactive power control methods. As a result of simulation, the proposed method has a small difference of 0.12%, compared to the Q(V) method with low system losses, but the maximum voltage reduction on the critical bus is about 0.062 larger. Compared with PF(P), which has a strong voltage regulating ability, the proposed method has a small difference of 0.025, but the increase rate of system losses is 2.36% larger. Among the reactive power control methods, the proposed method has the highest maximum voltage reduction at critical bus, compared to the increase rate of system losses.
The proposed method can lower the maximum voltage due to the output of the DGs with a strong voltage regulation capability with reducing network losses, thereby enabling the additional power generation of the DGs in the low voltage system. This is expected to contribute to the expansion of renewable power generation and efficient voltage management in low voltage network systems.
Author Contributions
Conceptualization, S.-B.K. and S.-H.S.; Methodology, S.-B.K.; Software, S.-B.K.; Validation, S.-B.K. and S.-H.S.; Data curation, S.-B.K.; Writing—original draft preparation, S.-B.K.; Writing—review and editing, S.-B.K. and S.-H.S.; Visualization, S.-B.K. and S.-H.S.; Supervision, S.-H.S. All authors have read and agreed to the published version of the manuscript.
Funding
This research was supported by the Human Resources Program in Energy Technology (No. 20194010201830) and New and Renewable Energy Research Program (No. 201530100244470) of the Korea Institute of Energy Technology Evaluation and Planning (KETEP) granted financial resource from the Ministry of Trade, Industry and Energy, Republic of Korea.
Conflicts of Interest
The authors declare no conflict of interest.
References
- Stetz, T.; Marten, F.; Braun, M. Improved low voltage grid-integration of photovoltaic systems in Germany. IEEE Trans. Sustain. Energy 2013, 4, 534–542. [Google Scholar] [CrossRef]
- Shayani, R.; Oliveira, M. Photovoltaic generation penetration limits in radial distribution systems. IEEE Trans. Power Syst. 2011, 26, 1625–1631. [Google Scholar] [CrossRef]
- Tonkoski, R.; Lopes, L.; El-Fouly, T. Coordinated active power curtailment of grid connected PV inverters for overvoltage prevention. IEEE Trans. Sustain. Energy 2011, 2, 139–147. [Google Scholar] [CrossRef]
- Fandi, G.; Ahmad, I.; Igbinovia, F.O.; Mulle, Z.; Tlusty, J. Voltage Regulation and Power Loss Minimization in Radial Distribution Systems via Reactive Power Injection and Distributed Generation Unit Placement. Energies 2018, 11, 1399. [Google Scholar] [CrossRef]
- Demirok, E.; Gonzalez, P.C.; Frederiksen, K.; Sera, D.; Rodriguez, P.; Teodorescu, R. Local reactive power control methods for overvoltage prevention of distributed solar inverters in low-voltage grids. IEEE J. Photovolt. 2011, 1, 174–182. [Google Scholar] [CrossRef]
- Stanelyte, D.; Radziukynas, V. Review of Voltage and Reactive Power Control Algorithms in Electrical Distribution Networks. Energies 2020, 13, 58. [Google Scholar] [CrossRef]
- Braun, M. Reactive power supply by distributed generators. In Proceedings of the IEEE Power and Energy Society General Meeting-Conversion and Delivery of Electrical Energy in the 21st Century, Pittsburgh, PA, USA, 20–24 July 2008; pp. 1–8. [Google Scholar]
- Yazdani, A.; Fazio, A.D.; Ghoddami, H.; Russo, M.; Kazerani, M.; Jatskevich, J.; Strunz, K.; Leva, S.; Martinez, J. Modeling guidelines and a benchmark for power system simulation studies of three-phase single-stage photovoltaic systems. IEEE Trans. Power Del. 2011, 26, 1247–1264. [Google Scholar] [CrossRef]
- Samadi, A.; Ghandhari, M.; Söder, L. Reactive power dynamic assessment of a PV system in a distribution grid. Energy Procedia 2012, 20, 98–107. [Google Scholar] [CrossRef]
- Zhang, F.; Guo, X.; Chang, X.; Fan, G.; Chen, L.; Wang, Q.; Tang, Y.; Dai, J. The reactive power voltage control strategy of PV systems in low-voltage string lines. In Proceedings of the IEEE Manchester PowerTech, Manchester, UK, 18–22 June 2017; pp. 1–6. [Google Scholar]
- Braun, M.; Stetz, T.; Reimann, T.; Valov, B.; Arnold, G. Optimal reactive power supply in distribution networks—Technological and economic assessment for PV systems. In Proceedings of the 24th European. Photovoltaic Solar Energy Conference, Hamburg, Germany, 21–25 September 2009. [Google Scholar]
- Stetz, T.; Diwold, K.; Kraiczy, M.; Geibel, D.; Schmidt, S.; Braun, M. Techno-economic assessment of voltage control strategies in low voltage grids. IEEE Trans. Smart Grid 2014, 5, 2125–2132. [Google Scholar] [CrossRef]
- Degner, T.; Arnold, G.; Reimann, T.; Strauss, P.; Breede, M.; Engel, B. Photovoltaic-system hosting capacity of low voltage distribution networks. In Proceedings of the ISES Solar World Congress, Kassel, Germany, 28 August–2 September 2011; pp. 3152–3161. [Google Scholar]
- Walla, T.; Widén, J.; Johansson, J.; Bergerland, C. Determining and increasing the hosting capacity for photovoltaics in swedish distribution grids. In Proceedings of the 27th European PV Solar Energy Conference, Frankfurt, Germany, 24–28 September 2012; pp. 4414–4420. [Google Scholar]
- Demirok, E.; Sera, D.; Teodorescu, R. Estimation of maximum allowable PV connection to LV residential power networks: A case study of braedstrup. In Proceedings of the 1st International Workshop on Integration of Solar Power into Power Systems, Aarhus, Denmark, 24 October 2011. [Google Scholar]
- Backes, J.; Schorn, C.; Basse, H. Cost-Efficient Integration of Dispersed Generation Using Voltage Dependent Reactive Power Contro; CIRED Workshop: Lyon, France, 2010. [Google Scholar]
- Kim, S.B.; Song, S.H.; Kang, Y.C. A Novel Reactive Power Control Strategy of Renewable Generators for Voltage Rise Mitigation in Distribution Network. Trans. KIEE 2020, 69, 235–244. [Google Scholar] [CrossRef]
- Tonkoski, R.; Lopes, L. Voltage regulation in radial distribution feeders with high penetration of photovoltaic. In Proceedings of the 2008 IEEE Energy 2030 Conference, Atlanta, GA, USA, 17–18 November 2008; pp. 1–7. [Google Scholar]
- Samadi, A.; Eriksson, R.; Soder, L.; Rawn, B.G.; Boemer, J.C. Coordinated active power-dependent voltage regulation in distribution grids with PV systems. IEEE Trans. Power Del. 2014, 29, 1454–1464. [Google Scholar] [CrossRef]
- Kang, S.J.; Kim, J.; Park, J.W.; Baek, S.M. Reactive power management based on voltage sensitivity analysis of distribution system with high penetration of renewable energies. Energies 2019, 12, 1493. [Google Scholar] [CrossRef]
Figure 1.
Test feeder model for reactive power control evaluation.
Figure 1.
Test feeder model for reactive power control evaluation.
Figure 2.
Voltage sensitivity at DG8 to active and reactive power variation.
Figure 2.
Voltage sensitivity at DG8 to active and reactive power variation.
Figure 3.
Characteristic curve of Q(V) control method.
Figure 3.
Characteristic curve of Q(V) control method.
Figure 4.
Characteristic curve of Q(V) control strategy.
Figure 4.
Characteristic curve of Q(V) control strategy.
Figure 5.
Active power output of DGs.
Figure 5.
Active power output of DGs.
Figure 6.
(
a) Reactive power output; and (
b) node voltage of distributed generators with different methods when the output of each DG is set as shown in
Figure 5 and all loads are set to 0 p.u.
Figure 6.
(
a) Reactive power output; and (
b) node voltage of distributed generators with different methods when the output of each DG is set as shown in
Figure 5 and all loads are set to 0 p.u.
Figure 7.
(
a) Reactive power output; and (
b) node voltage of distributed generators with different method when the output of each DG is set as shown in
Figure 5 and set all loads to 0.3 p.u. of rated active power of DG.
Figure 7.
(
a) Reactive power output; and (
b) node voltage of distributed generators with different method when the output of each DG is set as shown in
Figure 5 and set all loads to 0.3 p.u. of rated active power of DG.
Figure 8.
Weight factor as a function of active power and Block diagram for proposed method; (a) weight factor as a function of active power ; (b) Block diagram.
Figure 8.
Weight factor as a function of active power and Block diagram for proposed method; (a) weight factor as a function of active power ; (b) Block diagram.
Figure 9.
Flowchart of load flow including reactive power control of renewable energy system.
Figure 9.
Flowchart of load flow including reactive power control of renewable energy system.
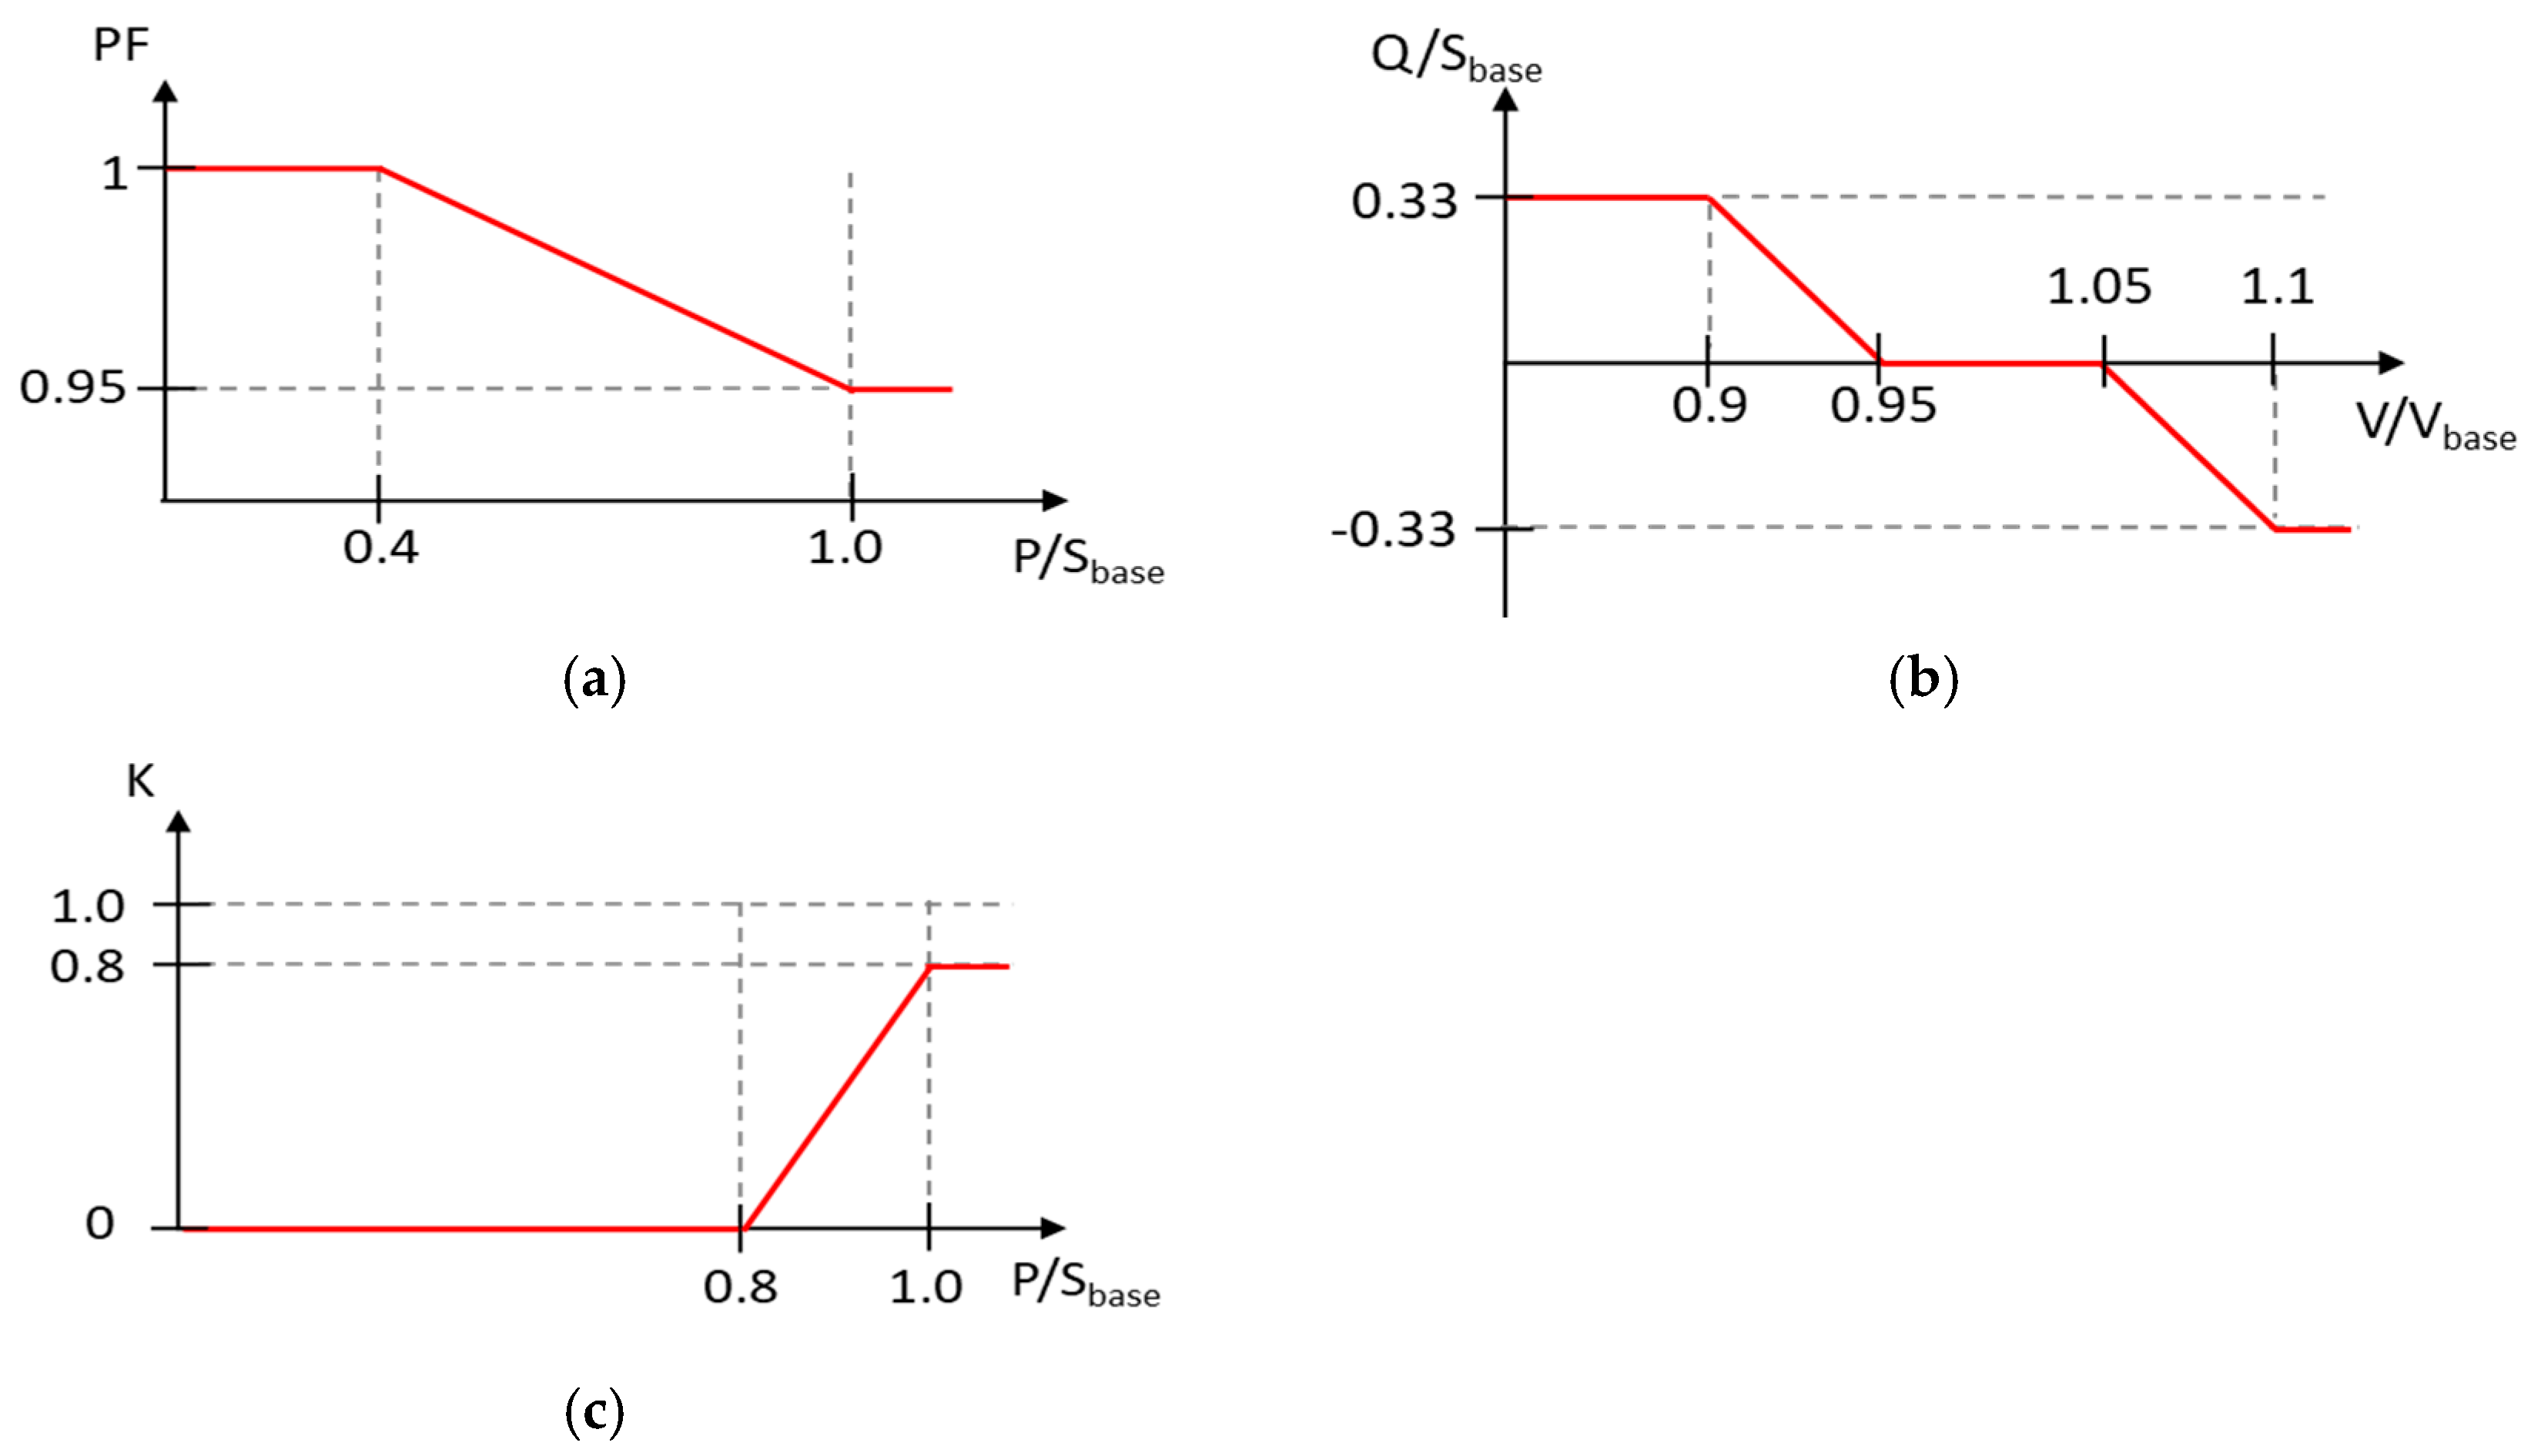
Figure 10.
Setting of reactive power control methods applied to test feeder model; (a) PF-P characteristic curve for PF(P) method; (b) Q-V characteristic curve for Q(V); (c) K-P characteristic curve for proposed method.
Figure 10.
Setting of reactive power control methods applied to test feeder model; (a) PF-P characteristic curve for PF(P) method; (b) Q-V characteristic curve for Q(V); (c) K-P characteristic curve for proposed method.
Figure 11.
Measured power generation profiles in 1-h averages during; (a) January 2017 and (b) July 2017; and (c) histogram of hours of measured power generation at Yeongam-gun, Jeollanam-do, Republic of Korea for 2017.
Figure 11.
Measured power generation profiles in 1-h averages during; (a) January 2017 and (b) July 2017; and (c) histogram of hours of measured power generation at Yeongam-gun, Jeollanam-do, Republic of Korea for 2017.
Figure 12.
Active power output and reactive power output by the different methods at (a) DG1 and (b) DG8 and reactive power output by reactive power control method.
Figure 12.
Active power output and reactive power output by the different methods at (a) DG1 and (b) DG8 and reactive power output by reactive power control method.
Figure 13.
Reactive power absorption amounts for each DG by the reactive power control methods when the active power output is (a) 0.6 p.u.; (b) 0.9 p.u.; and (c) 1.0 p.u.
Figure 13.
Reactive power absorption amounts for each DG by the reactive power control methods when the active power output is (a) 0.6 p.u.; (b) 0.9 p.u.; and (c) 1.0 p.u.
Figure 14.
Voltage variation at DG8 with different reactive power control methods.
Figure 14.
Voltage variation at DG8 with different reactive power control methods.
Figure 15.
Comparison of max voltage at critical bus and grid losses according to reactive power control method.
Figure 15.
Comparison of max voltage at critical bus and grid losses according to reactive power control method.
Table 1.
Parameters of test feeder model.
Table 1.
Parameters of test feeder model.
| Symbol | Values | Remarks |
|---|
| 10 (kVA) | Base power |
| 0.38 (kV) | Base voltage |
| (kV) | Voltage limit () |
| 10 (kW) | Nominal active power of distributed generators |
| 0.0038 + j0.0027 (p.u) | Overhead line(OHL) impedance, i = 1~7 |
| 0.0001 + j0.0001 (p.u) | Medium voltage grid impedance |
| 0.0009 + j0.0020 (p.u) | Transformer impedance |
| 1.02 (p.u) | Slack bus voltage |
Table 2.
Parameters of reactive power control methods.
Table 2.
Parameters of reactive power control methods.
| Method | Parameters | Unit | Values |
|---|
| fixed PF | PF reference | - | 0.95 |
| PF(P) | xlookup of PF(P) | p.u | [0.00, 0.40, 1.00, 1.20] |
| ylookup of PF(P) | - | [1.00, 1.00, 0.95, 0.95] |
| Q(V) | xlookup of Q(V) | p.u | [0.80, 0.90, 0.95, 1.05, 1.10, 1.20] |
| ylookup of Q(V) | p.u | [0.33, 0.33, 0.00, 0.00, −0.33, −0.33] |
Table 3.
Annual results analysis for 2017.
Table 3.
Annual results analysis for 2017.
| Reactive Power Control Strategy | Max. Voltage at Critical Bus
[p.u] | Network Power Losses | Maximum Transformer Loading
[%] | Reactive Power Consumption
[MVArh/year] |
|---|
Active Power
[MWh/year] | Reactive Power
[MVArh/year] |
|---|
| No Q | 1.1140 | 3.7724 | 3.2924 | 75.14 | 0.00 |
| fixed PF | 1.0876 | 4.2897 | 3.7410 | 80.45 | −38.35 |
| PF(P) | 1.0878 | 3.9910 | 3.4816 | 80.41 | −16.58 |
| Q(V) | 1.0965 | 3.8974 | 3.3919 | 76.58 | −9.18 |
| Proposed | 1.0903 | 3.9019 | 3.3960 | 79.25 | −9.44 |
Table 4.
Maximum voltage reduction at critical bus and system losses increase rate of reactive power control.
Table 4.
Maximum voltage reduction at critical bus and system losses increase rate of reactive power control.
| Reactive Power Control Strategy | Max. Voltage Reduction at Critical Bus
(Equation (10)) | Increasing Rate of System Losses [%]
(Equation (11)) | |
|---|
| fixed PF | 0.2640 | 13.71 | 0.0193 |
| PF(P) | 0.2620 | 5.79 | 0.0453 |
| Q(V) | 0.1750 | 3.31 | 0.0529 |
| Proposed | 0.2370 | 3.43 | 0.0691 |
© 2020 by the authors. Licensee MDPI, Basel, Switzerland. This article is an open access article distributed under the terms and conditions of the Creative Commons Attribution (CC BY) license (http://creativecommons.org/licenses/by/4.0/).


