Article

The Impact of a Controlled-Release Fertilizer on Greenhouse Gas Emissions and the Efficiency of the Production of Chinese Cabbage

1
Faculty of Production and Power Engineering, University of Agriculture in Krakow, 30-149 Kraków, Poland
2
Faculty of Agriculture and Economics, University of Agriculture in Krakow, 31-121 Kraków, Poland
3
Department of Economics and Enterprise Organization, Cracow University of Economics, 31-510 Krakow, Poland
4
Faculty of Biotechnology and Horticulture, University of Agriculture in Krakow, 31-121 Kraków, Poland
*
Authors to whom correspondence should be addressed.
Energies 2020, 13(8), 2063; https://doi.org/10.3390/en13082063
Submission received: 30 January 2020 / Revised: 13 March 2020 / Accepted: 17 April 2020 / Published: 21 April 2020

Abstract

:
Optimization of plant fertilization is an important element of all quality systems in primary production, such as Integrated Production, GLOBAL G.A.P. (Good Agriculture Practice) or SAI (Sustainable Agriculture Initiative). Fertilization is the most important element of agricultural treatments, affecting the quantity and quality of crops. The aim of the study was to assess greenhouse gas (GHG) emissions in the cultivation of Chinese cabbage, depending on the technological variant. The factor modifying the production technology was the use of fertilizers with a slow release of nutrients. One tonne of marketable Chinese cabbage crop was selected as the functional unit. To achieve the research goal, a strict field experiment was carried out. Calculation of the total amount of GHG emitted from the crop was made in accordance with ISO 14040 and ISO 14044. The system boundaries included the production and use of fertilizers and pesticides, energy consumption for agricultural practices and the emission of gases from soil resources and harvesting residue. The use of slow-release fertilizers resulted in a greater marketable yield of cabbage compared to conventional fertilizers. The results of the research indicate a significant potential for the use of slow-release fertilizers in reducing agricultural emissions. From the environmental and production point of view, the most favourable variant is the one with 108 kg N·ha−1 slow-release fertilizers. At a higher dose of this element, no increase in crop yield was observed. At this nitrogen dose, a 30% reduction in total GHG emissions and a 50% reduction in fertilizer emissions from the use of per product functional unit were observed. The reference object was fertilization in accordance with production practice in the test area.

Graphical Abstract

1. Introduction

The environmental impact of plant production is mainly associated with the consumption of fossil fuels and the use of fertilizers and plant protection products. Greenhouse gas (GHG) emissions are also associated with energy consumption for the production, transport and application of fertilizers and plant protection products, irrigation, as well as the logistics process of food products [1]. An important source of agricultural pollution is the emission of GHG from the soil as a result of mineralization of dead organic matter and humus compounds [2]. Some of the elements introduced into the soil with organic and mineral fertilizers are dispersed in the environment; to the atmosphere, in the form of GHG, and to the underground and surface waters, causing intensified eutrophication processes and acidification of individual elements of the environment. At all its stages, food production is associated with the intensive use of natural resources such as soil, water, space and energy resources [3]. Intensive agricultural production, often regarded as conventional, has developed in response to the demand for cheap food production. It is characterized by maximizing production with the simultaneous increase in consumption of the means and energy resources [4]. The intensified production very quickly led to environmental degradation of large areas, especially in developed countries, with the most intensive agriculture. The transformation of natural ecosystems into monocultural agrocenosis is also associated with landscape changes that have a multidirectional, negative impact on the human environment [5]. The implementation and development of quality management systems in food production were somewhat the consumer market’s reaction to the presence of poor quality products on the market [6,7].
Economic development of developed countries, and the related increase in the wealth of societies, has shaped consumer awareness regarding the environmental and health effects of overexploitation related to food production [8,9]. An important aspect of optimizing agriculture is reducing its environmental impact, especially in the context of emissions. Research results presented in the scientific literature report great potential for binding organic carbon in soil organic matter, which allows reducing the negative impact of agriculture on the environment, and the greenhouse effect [10,11,12]. Global GHG from fossil fuels used in agriculture is estimated at 0.4–0.6 Gt of CO2 equivalent. Annually, total agricultural emissions amount to 4.6 Gt of CO2 equivalent per year [13]. In the United States, agriculture accounts for 9% of the total emissions of these compounds [14]. There are primary and secondary sources of energy consumption and emission in plant production. Primary emission sources are the result of agrotechnical practices on the farm (e.g., tillage, sowing, fertilization, harvesting and transport, irrigation). Secondary (indirect) emission sources include emissions from the production of fertilizers, pesticides, production and maintenance of equipment, etc. What is important from the point of view of emissions is the emission of nitrogen oxides from soils intensively supplemented with nitrogen fertilizers. The amount of nitrogen compounds released to the atmosphere is related not only to the level of fertilization, but above all, to the efficiency of using the elements contained in fertilizers and the type and intensity of cultivation treatments. An important source of environmental impact of agricultural nitric oxide is its emission resulting from decomposition of harvesting residue. Total N2O fertilizer emissions increased from 0.07 Gt of CO2 equivalent per year in 1961 to 0.68 Gt CO2 equivalent in 2010 [13]. Nitric oxide (N2O) is a key compound responsible for the greenhouse effect. It retains 292 times more infrared radiation than carbon dioxide [15]. Assessing the environmental and economic efficiency of quality systems implemented in primary production is a very important element in the evaluation of the actual impact of producer regulations on the quality of produce and the degree of environmental impact [16,17,18]. One of the methods of comprehensive and multifaceted assessment of the quality system is to prepare a product life cycle taking into account the use of energy and means of production, as well as renewable and non-renewable environmental resources [19,20]. However, developing a reliable and universal method is very difficult because farms operate in a specific economic, social and climatic framework, which significantly affects the assessment and is very difficult to interpret [21]. That is why agricultural systems are often assessed based on a selected fragment of activity.
The aim of the study was to quantify and compare GHG emissions in the different technological variants of the cultivation of Chinese cabbage. The research variable was the fertilisation technology with conventional fertilisers and slow release ferilizers. One tonne of marketablemarketable Chinese cabbage crop was selected as the functional unit.

2. Materials and Methods

In terms of the scope of research, the number of sites and their geographical location, the experiment was planned based on the assumed qualitative and quantitative objectives, as well as technical possibilities. [22]. The choice of the plant variety, the individual fertilization options, the range of agrotechnical treatments, the level of irrigation and the time frame of the experiment was based on a risk analysis carried out in accordance with ISO 31000:2018 [23]. The risk defined was the impact of the above-mentioned risk factors on the reduction of plant yields. Different fertilization variants were applied in individual experiment objects, which resulted from the production practice applied in the research area, the requirements of quality management systems in primary production and economic aspects. The scope of the research and the selection of GHG emission sources were carried out based on literature study [15,16,17,18,19,20,21]. The sources of GHG emissions selected for the calculation of total emissions were selected based on their utility in the context of the determined research objectives.
In terms of the number of objects, the scope of research and geographical location, the experiment was planned based on the assumed qualitative and quantitative objectives and technical capabilities [22]. The choice of plant variety, individual fertilization variants, the range of agrotechnical treatments, the level of irrigation and the time frame of the experiment was based on the risk analysis carried out in accordance with ISO 31000:2018. The defined risk was the impact of the above-mentioned risk factors on the reduction of plant yields. The scope of the conducted research and the selection of GHG emission sources was based on a literature study. The scheme of the experimental design is as follows:
(1)
Formulation of the strategic objective;
(2)
Selection of the experience factors (a single-factor experience was selected);
(3)
Selection of the plant (Chinese cabbage is a plant of high economic importance and high GHG emission potential due to high levels of fertilization and relatively low nitrogen use;
(4)
Selection of the experiment site (geographical boundary of the system); the experiment was conducted in the area with large acreage of Chinese cabbage cultivations;
(5)
Selection of agrotechnical treatments (except the experimental factor); the treatments were selected based on the recommendations of the integrated plant production methodology and based on production practices in the research area;
(6)
Formulation of the experimental factor levels. The level of nitrogen fertilization and the forms of nitrogen applied in the subsequent experimental facilities were designed based on the following input data:
(a)
A control facility is necessary for the assessment of the site potential;
(b)
Objects fertilized with 400 and 500 kg of slow-release fertilizers. The amount of fertilization results from the manufacturer’s recommendations in their advertising materials;
(c)
Objects fertilized with 600 and 800 kg of slow-release fertilizer and objects fertilized with 300 and 450 kg of ammonium nitrate·ha−1. The level of fertilization was calculated based on the plants’ fertilizing needs, at the estimated site productivity of 65 and 90 t·ha−1. The two estimated levels result from the likelihood of adverse weather conditions during the vegetation period of the plants;
(d)
An object fertilized with 600 kg of ammonium nitrate·ha−1. The level of fertilization results from production practices applied in the research area;
(7)
Estimation of the system boundary in terms of GHG emission sources. The selection was based on the latest available literature and a risk analysis in the context of the assumed target, in accordance with ISO 31000:2018. These sources are:
(a)
GHG emissions related to the applied fertilizers;
(b)
GHG emissions related to the plant protection products used;
(c)
GHG emissions related to electricity consumption and combustion of fossil fuels;
(d)
GHG emissions related to decomposition of crop residues;
(e)
GHG emissions related to decomposition of soil organic matter.
The goal was achieved based on field experience which allowed calculating GHG emissions in individual technological variants. The experiment was established in the soil with a heavy clay grain size. The soil properties on which the experiment was established are included in Table 1. The forecrop for research plants was corn. The test plant was Chinese cabbage (Brassica rapa L.) of the Parkin F1 variety. The experiment was established on 15 May 2017. The plants were harvested on 22 July 2017. Plants were grown at a spacing of 50 × 30 cm. Cultivation and plant protection practices were carried out based on the integrated production methodology for the Chinese cabbage approved by the Main Inspector of Plant Health and Seed Inspection, based on art. 5 par. 3 pos. 2 of the Act of 18 December 2003 on Plant protection, consolidated text from 2008, no. 133, item 849 as amended. In terms of agricultural treatments, the following were applied: plowing, cultivating, planting, mechanical application of fertilizers (twice in facilities where conventional fertilizers were applied, and once in facilities where slow-release fertilizers were applied), as well as mechanical weeding (once). The harvesting was manual, and irrigation amounted to 80 dm3·m−2 from a deep water well, 36 m in depth.
Plants were irrigated to optimal water content to eliminate the possibility of water stress affecting the test results. Before establishing the experiment, the physicochemical and chemical properties of the soil were analyzed, and the following parameters were determined: pH, granulometric composition, the content of organic matter, mineral nitrogen and Kiejdahl nitrogen content, as well as the content of available forms of P, K, Mg and Ca.
Optimization of the agricultural system was based on the use of a multicomponent, slow-release fertilizer with NPK content (%) 18-05-10 + 4CaO + 2Mg (with a nitrogen release period of two months), ammonium nitrate (34% N), triple superphosphate (46% P2O5) and 60% potassium salt (60% K2O). The experiment included seven fertilization levels and a control object (Table 2). The slow-release fertilizer was applied pointwise to each plant during planting, at a depth of 5–7 cm below the planting level. All phosphorus and potassium fertilizers were applied before sowing, while ammonium nitrate was applied in two doses: 60% before planting and 40% after planting. The date of late top dressing was selected based on the observation of meteorological conditions and monitoring condition of the plants. The experiment was conducted in four replicates, in randomized blocks.
The system boundaries included:
(1)
Production of fertilizers and agrochemicals used for growing plants;
(2)
The farm’s energy consumption for field work;
(3)
Soil emissions (direct and indirect) related to fertilizer use;
(4)
Emissions from harvesting residue management and from the mineralization of soil organic matter;
(5)
Water consumption for irrigation.
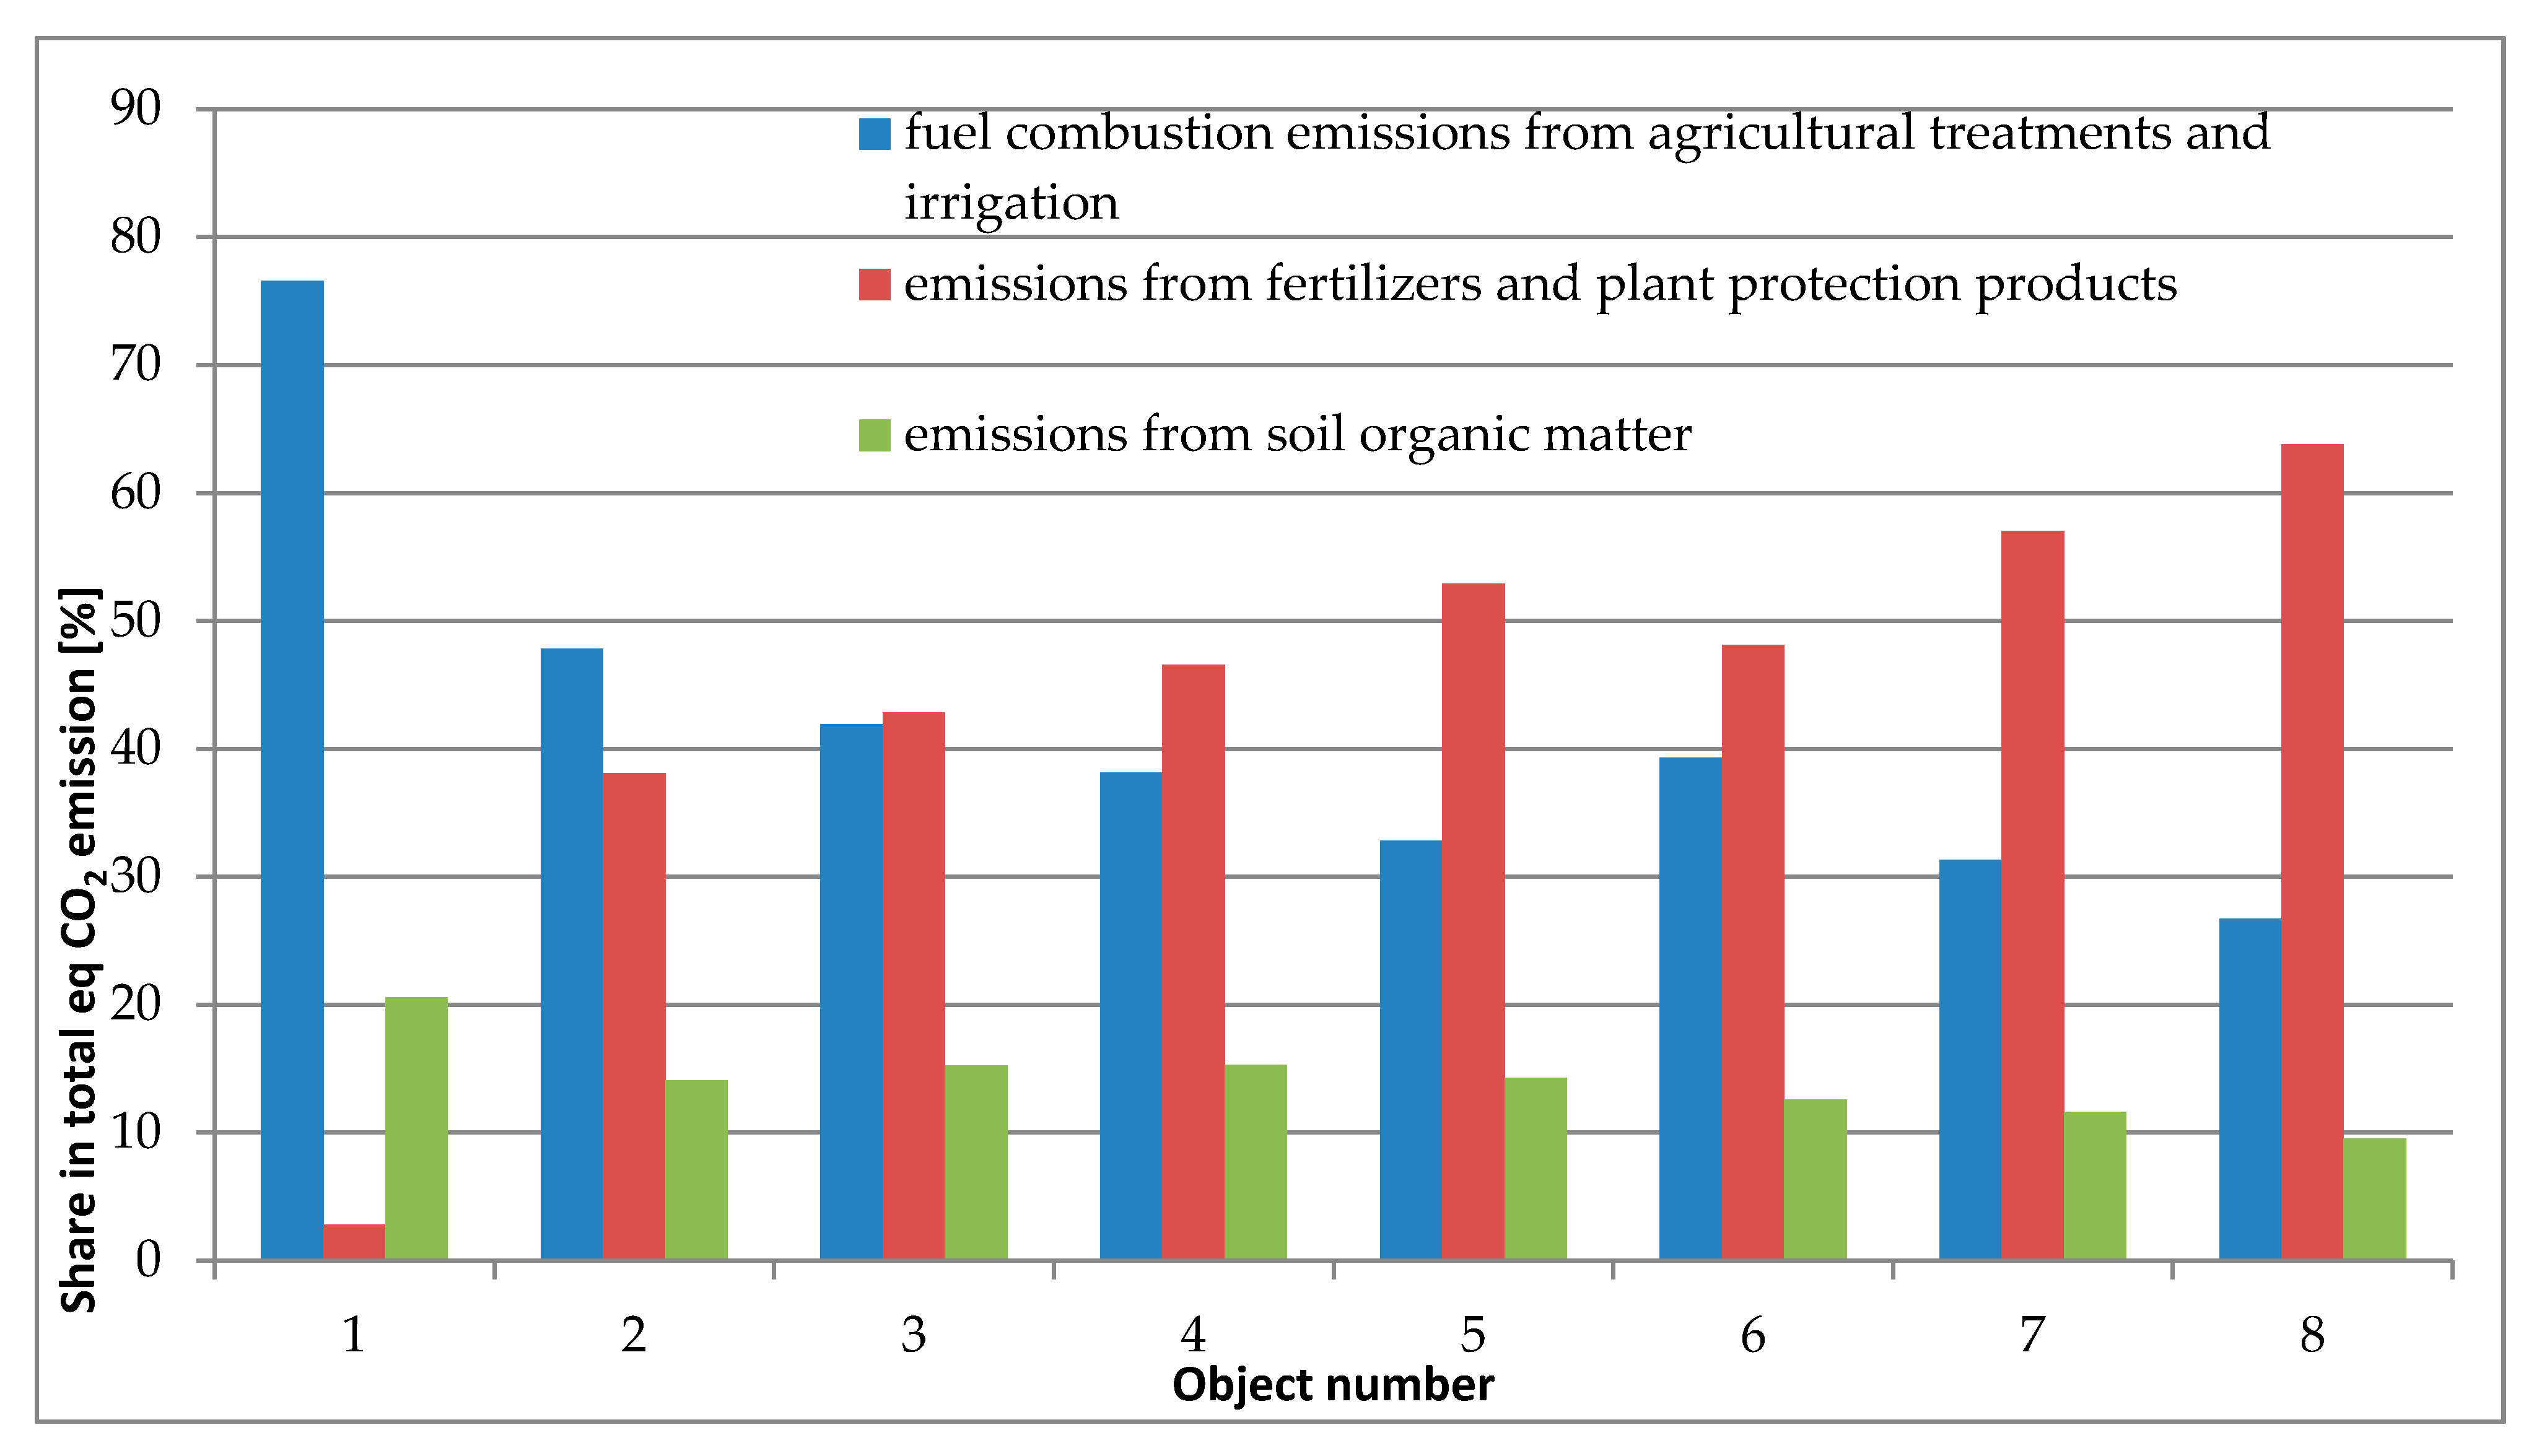
In order to determine the environmental impact of the production of Chinese cabbage in various technological conditions, the following standards were applied: ISO 14040 “Environmental management—Life cycle assessment—Principles and framework” and ISO 14044 “Environmental management—Life cycle assessment—Requirements”.

3. Results

The analysis was carried out according to the recommendations included in the document [24]. Product transport, packaging, agricultural tool wear and marketing were excluded from the research. The production and transport of seedlings were also excluded from the process due to the lack of data on this process. The adopted functional unit was 1 tonne of marketable product. The time frame of the system was one year. The potential for generating the greenhouse effect has been estimated based on the GHG emission calculated as per carbon dioxide equivalent (CO2).
The input data for calculating the GHG emission value came from seven experimental objects and a control object where fertilization was not used (Table 2). Fertilization at object no. 7 was carried out in accordance with the production practices used in the area of testing. The GHG emission level for nitrogen production in ammonium nitrate was assumed at 7.99 kg CO2·kg−1 N. For triple superphosphate, this value was set at 0.36 kg CO2·kg−1 P2O5, while for potassium chloride it was 0.56 kg CO2·kg−1 K2O [25]. Based on the data on the composition of the slow-release fertilizer used, its total carbon footprint was calculated at 8.2 kg CO2∙kg−1 N, as per the mass of fertilizer [25]. Emission factors for harvesting residue were calculated based on the amount of waste generated during cabbage processing. Based on the results of the experiment, it was estimated that the ratio of marketable to collateral yield and harvesting residue in the cultivation of Chinese cabbage ranged from 19% to 28%. The adopted content of carbon fraction in dry matter of harvesting residue was 50%. The actual nitrogen content in harvesting residue was used for the calculations. The level of harvesting residue distribution was estimated at 25%. Carbon emissions from harvesting residue were calculated according to the methodology in the IPCC [26]. The value of nitric oxide emission from harvesting residue was adopted at 1.25% [27]. The value “N-N2O emissions” was multiplied by 44/28 to convert it into N2O. N2O emission was used as a CO2 equivalent by multiplying it by the global warming potential of 298 [15]. The adopted soil mineralization rate of organic matter was 2%. The assessment of the life cycle of Chinese cabbage includes emissions from the burning of fossil fuels used for agricultural procedures. Based on the data provided by EPA [28], the diesel emission from agricultural tractors was assumed at 3.864 kg CO2·dm−3 of fuel. Fuel consumption in particular agricultural procedures is presented in (Table 3). Owing to the small amount of nitrogen oxides and methane emitted the during diesel combustion in agricultural tractors, this source of GHG was omitted [28]. The amount of greenhouse gas emissions associated with the use of pesticides was estimated based on the data provided by Audsley [11] (Table 4). These authors report the total amount of GHG emissions per carbon dioxide equivalent at 25.5 kg CO2 for 1 kg of active substance of pesticide. The amount of pesticides used in cabbage cultivation was 1950 g·ha−1 for all objects. For irrigation, deep well water pumped from 36 m was used using 40% electric pumps. The CO2 emission factor from irrigation was calculated on the basis of the guidelines given by Wang [29] (Table 4). For the production of 1 kWh of electricity, CO2 emissions were adopted at 0.9245 kg [29]. According to the methodology given by [30] the amount of nitrogen emitted as a result of mineral fertilization is 1% as direct emission and 0.27% as nitrogen dispersed in the environment. The amount of nitrogen oxides emitted from mineral fertilizer nitrogen was estimated at 0.75% of total nitrogen not used by plants during the growing season [30] (Table 4 and Table 5). The N2O to CO2 conversion factor in the context of the greenhouse effect is 292 [15].
A—CO2 equivalent from the slow-release fertilizer [25]; B—CO2 equivalent from conventional fertilizers [25]; C—CO2 equivalent from fertilizers in total; D—CO2 equivalent from plant protection products [11]; E—CO2 emissions from fuel combustion and electricity consumption [29]; F—CO2 emissions from soil and harvesting residue and from the mineralization of organic matter3 [26,27].
G—Direct N2O emission from mineral fertilization [30]; H—Indirect N2 emission related to mineral fertilization [30]; I—CO2 equivalent from direct N2 emission; J—CO2 equivalent from the indirect emission of N2 [15]; K—CO2 equivalent from N2 emission from the mineralization of harvesting residue3 [26,27].
The obtained results were subjected to analysis of variance. The significance of differences in mean values was determined with the Tukey test (α ≤ 0.05) using the Statistica 13 (TIBCO Software Inc.) software to statistically process the results.
The presented work compares the total GHG emissions for various fertilization strategies within the assessment system adopted at taking inventory of their sources. The results of the calculations demonstrate a significant differentiation of the total GHG emissions in terms of CO2 equivalent for the adopted system boundary. The adopted unit of account was 1 tonne of marketable product. The marketable yield in the non-fertilized object was 15.46 t. Fertilization in the amount of 72 kg N in the form of slow-release fertilizers and a full dose of phosphorus and potassium caused a double increase in the marketable yield of plants (Figure 1). When using traditional fertilizers, at 100 kg∙ha−1 nitrogen, the marketable yield was approx. 56% higher compared to the unfertilized object. The maximum yield was obtained in an object fertilized with slow-release fertilizers, at 144 kg N, and it amounted to 44.02 t of marketable yield∙ha−1 [31,32]. Niemiec [31], and Niemiec et al. [32] report a reduction in celery yield after applying slow-release fertilizers directly under the root. These authors stated that the reason for the decrease in yielding may be increased salinity of the soil solution directly under plant root zone. In this experiment, slow-release fertilizers were used below the planting level, which could limit the negative impact of soil solution salinity, especially at the initial stage of plant growth. To achieve the yield at the level observed when using 144 kg N in a slow-release fertilizer, 200 kg of nitrogen in conventional fertilizers was required. Due to the relatively low content of mineral forms of nitrogen in the soil, a strong reaction of plants to mineral fertilization was observed.
The experiment results indicate a significant impact of the proposed fertilization strategies on the development of GHG emissions, both from direct and indirect sources. Total GHG emissions, given as CO2 equivalent ranged from 78.9 to 120.3 kg CO2∙t−1 fresh weight of marketable product (Figure 2. The lowest value of this parameter was obtained for an object fertilized with slow-release fertilizers at 108 kg N−1 fresh mass of the marketable product (option 3). For all facilities fertilized with conventional fertilizers, the emission factor was above 110 kg CO2∙t−1 fresh weight of marketable product. The value of GHG emissions for a nonfertilized object was 111.8 kg CO2∙t−1 product. There were no statistically significant differences between individual fertilization variants with the use of the slow-release fertilizer. In relation to the reference object, fertilized in accordance with production practice, a reduction of GHG emission level of 30% was achieved per functional unit of the product (Figure 2). From the point of view of environmental efficiency, this is an important technological achievement. In modern agricultural systems, improving efficiency by up to several percent can be problematic [33,34,35].
The share of mineral fertilizers in shaping GHG emissions is presented in Figure 3. In the object fertilized in accordance with production practice, the amount of GHG emissions associated with the use of mineral fertilizers and plant protection products was 73 kg of CO2 equivalent∙t−1. When applying slow-release fertilizers, this value was 36.7 kg CO2 equivalent∙t−1. The obtained research results indicate that the level of mineral fertilization efficiency is the most important element related to the optimization of plant production. This has been confirmed by studies of other authors [14,17,36]. Figure 3 presents the percentage share of individual GHG sources in the total emissions for the adopted system boundaries. The sources were divided into three groups:
  • Agricultural treatments and irrigation;
  • Production and use of fertilizers;
  • Greenhouse gas emissions from soil result from decomposition of harvesting residue and soil organic matter.
Irrigation and agricultural treatments are another source of agricultural emissions included in the research. For the production technologies used, the level of GHG emissions associated with energy consumption was 1303.7 kg CO2∙ha−1 (Table 4). In objects fertilized only with conventional fertilizers, this value was slightly higher, which results from the double application of the fertilizers (Table 4). According to the technology used, the application of slow-release fertilizers during planting did not cause additional GHG emissions. Energy consumption for irrigation and agricultural treatments was constant for all fertilization variants and is not correlated with production effects. However, it has a significant impact on the level of GHG emissions per unit of account. Very high values of this coefficient testify to the low efficiency of the use of production potential, while low values indicate unreasonable fertilization. In the conducted experiment, the share of emissions of GHG from fuel combustion and electricity consumption ranged from 26.70% to 76.60% (Figure 3). The lowest value of this parameter was found in a non-fertilized object, while the largest share of GHG emissions from energy consumption was found in the object fertilized with conventional fertilizers at the highest dose of 200 kg N∙ha−1. In the experimental object fertilized with slow-release fertilizers, at 108 kg N, the agricultural and irrigation GHG emission rate was 38% (Figure 3). The amount of fertilizer GHG emissions is largely influenced by the total amount of fertilizers used, both organic and mineral, as well as the degree of nitrogen utilization by plants. Nitrogen not used by plants is dispersed in the natural environment and is a source of GHG. In the experiment, in the object where the lowest GHG emission rate was obtained, the GHG share associated with the use of fertilizers was 46%. Increasing the nitrogen dose increased the value of this parameter. In an object fertilized with conventional fertilizers, at 200 kg N, it was observed that over 60% of emitted GHG came from fertilizers and plant protection products (Figure 3). The factor that most affected the result of the GHG emission assessment was the unreasonable use of nitrogen from mineral fertilizers. The total nitrogen uptake of the cultivated Chinese cabbage in an object fertilized according to production practice amounted to approx. 30% of the nitrogen dose introduced with mineral fertilizers. In the case of an object with the slow-acting fertilizer at 108 kg∙ha−1 this value was more than twice as high. The most important element in reducing the value of the carbon footprint for the adopted system boundary was the degree of utilization of nitrogen from mineral fertilizers. The object with the highest level of nitrogen fertilization was the reference for individual experiment variants. The share of GHG emissions from soil organic matter and the distribution of harvesting residue ranged from approx. 10% to over 20% of total GHG emissions. For individual fertilization variants, this value was slightly different and resulted from the amount of harvesting residue and its nitrogen content.

4. Discussion

The compared production technologies differed only by the use of an innovative nitrogen fertilizer. No modifications were made to other agricultural treatments. Fertilization is a very important element of agricultural production technology. It shapes the size of the crop and the efficiency of using other means of production, such as plant protection products, water used for irrigation and energy used for growing and harvesting products. The effectiveness of fertilization ultimately affects the efficiency of the use of production acreage and the energy efficiency of production. Unreasonable use of fertilizers results in a decrease in nutrient utilization efficiency. Plant nutrients not absorbed during the growing season significantly increase the impact of agriculture on GHG emissions. An important source of GHG is the soil environment. Optimizing the use of nitrogen introduced with fertilizers is one way to reduce GHG emissions. Liang [37] report that the use of biochar significantly increased the yield and nitrogen utilization in reed. Reduced losses of fertilizer elements as a result of the addition of biochar were also reported by Niemiec [38]. These authors stated that the fertilizers supplemented with biocarbon demonstrate the functional characteristics of slow-release fertilizers. Xiao [39] reported that the use of slow-release fertilizers in peach cultivation resulted in a reduction of the crop’s impact on GHG emissions by 25%, while nitrogen emissions from fertilizers decreased by 50%. In turn, [36] report that the use of fertilizers with slow release of nutrients has allowed the reduction of nitrogen oxides directly from bamboo crops at approx. 20% to 80%. These values depended primarily on the pattern of weather conditions. In our own research, in an object optimally fertilized with slow-release fertilizers, the amount of nitrogen oxides emitted was 45% lower compared to an object fertilized in accordance with production practice in the area of research. In gaseous form, these elements are emitted from the soil surface in the form of carbon dioxide, nitrogen oxides and methane. Their amount results from the intensification of mineralization of organic matter and the level of nitrogen fertilization. Nitrogen compounds from organic and mineral fertilization are very important from the point of view of shaping the level of GHG emissions [24,25,26]. Each experiment was treated as a separate farm, functioning in a specific environment. Literature reports lots of data related to the calculation of the life cycle for agriculture in a broader perspective, both spatial and temporal [5,14,29].
The results presented by these authors relate to the general values of the impact of agriculture on the environment using specific production technologies. Life cycle assessment for strict experiments carried out is not a commonly used element of the assessment of the environmental impact of a production technology [39,40,41,42,43,44,45]. Vegetation experiments are conducted to optimize production technology or to assess the actual effectiveness of the use of a factor of production or production technique. Nowadays, for experiments using new fertilizers, the literature presents results related primarily to fertilization efficiency, the amount of ingredients dispersed in the environment or the quality of the crop. Fertilization is one of the factors impacting the level of GHG emissions and should be considered in a broader context, along with all elements of agricultural treatments. The paper attempts to scale the methodologies used in calculating GHG emissions for strict vegetation experiments. The compared production technologies differed only by the use of an innovative nitrogen fertilizer. Other elements and conditions remained unchanged. This approach allowed estimating the actual impact of using a fertilizer characterized by a slower release of nutrients. The level of GHG emissions is now a strategic element of agricultural characteristic and their emission from nitrogen fertilizers is significant. Agriculture is characterized by a very low level of efficiency in the use of nutrients derived from fertilizers, both mineral and organic. No modifications were made to other agricultural treatments. However, introducing modifications related to fertilization technologies is problematic. Reducing the total amount of elements introduced into the soil environment raises the risk of reducing yields, which agricultural producers fear [7]. Liang [37] has indicated the high effectiveness of subsidizing technological innovations in agricultural production in terms of limiting the negative impact on the environment [46,47,48,49,50,51,52,53,54]. Linking subsidies with pro-environmental measures in agriculture can bring positive effects in reducing GHG emissions.

5. Conclusions

The use of slow-release fertilizers resulted in a greater marketable yield of cabbage compared to conventional fertilizers. From the environmental and production point of view, the most favorable variant is the one with 108 kg N∙ha−1 slow-release fertilizers. At a higher dose of this element, no increase in crop yield was observed. Fertilizing Chinese cabbage with slow-release fertilizers at 108 kg N∙ha−1 resulted in a 30% reduction in total GHG emissions per functional unit, compared to fertilization in accordance with production practice. With slow-release fertilizers, fertilization GHG emissions were reduced by approx. 50% per functional unit of the produce. Efficiency of fertilizer nitrogen use is an important element shaping the level of agricultural GHG emissions.
The use of slow-release fertilizers should be promoted in agricultural production, since, if used rationally, they can reduce GHG emissions and climate change.

Author Contributions

Conceptualization, J.S., M.N., and M.K. (Monika Komorowska); methodology, M.K. (Maciej Kuboń), A.S.-S.; Z.G.-S.; software, J.S., M.N.; validation, A.S.-S. and Z.G.-S.; formal analysis, M.K. (Monika Komorowska), M.K. (Maciej Kuboń); resources, Z.G.-S., A.S.-S., M.K. (Maciej Kuboń); writing—original draft preparation: M.N., J.S., M.K. (Monika Komorowska) visualization, Z.G.-S., A.S.-S., M.K. (Maciej Kuboń). All authors have read and agreed to the published version of the manuscript.

Funding

This research received no external funding.

Conflicts of Interest

The authors declare no conflict of interest.

References

  1. Cupiał, M.; Szeląg-Sikora, A.; Niemiec, M. Optimisation of the machinery park with the use of OTR-7 software in context of sustainable agriculture. Agric. Agric. Sci. Procedia 2015, 7, 64–69. [Google Scholar] [CrossRef] [Green Version]
  2. Szeląg-Sikora, A.; Niemiec, M.; Sikora, J.; Chowaniak, M. Possibilities of Designating Swards of Grasses and Small-Seed Legumes From Selected Organic Farms in Poland for Feed. In Proceedings of the IX International Scientific Symposium Farm Machinery and Processes Management in Sustainable Agriculture, Lublin, Poland, 22–24 November 2017; pp. 365–370. [Google Scholar]
  3. Li, L.; Wu, W.; Giller, P.; O’Halloran, J.; Liang, L.; Peng, P.; Zhao, G. Life Cycle Assessment of a Highly Diverse Vegetable. Multi-Cropping System in Fengqiu County, China. Sustainability 2018, 10, 983. [Google Scholar] [CrossRef] [Green Version]
  4. Kocira, S.; Kuboń, M.; Sporysz, M. Impact of information on organic product packagings on the consumers decision concerning their purchase. In Proceedings of the 17th International Multidisciplinary Scientific GeoConference (SGEM 2017), Albena, Bulgaria, 29 June–5 July 2017; Volume 17, pp. 499–506. [Google Scholar]
  5. Schmidt Rivera, X.C.; Bacenetti, J.; Fusi, A.; Niero, M. The influence of fertiliser and pesticide emissions model on life cycle assessment of agricultural products: The case of Danish and Italian barley. Sci. Total Environ. 2017, 592, 745–757. [Google Scholar] [CrossRef] [Green Version]
  6. Szeląg-Sikora, A.; Sikora, J.; Niemiec, M.; Gródek-Szostak, Z.; Kapusta-Duch, J.; Kuboń, M.; Komorowska, M.; Karcz, J. Impact of Integrated and Conventional Plant Production on Selected Soil Parameters in Carrot Production. Sustainability 2019, 11, 5612. [Google Scholar] [CrossRef] [Green Version]
  7. Niemiec, M.; Komorowska, M.; Szeląg-Sikora, A.; Sikora, J.; Kuboń, M.; Gródek-Szostak, Z.; Kapusta-Duch, J. Risk Assessment for Social Practices in Small Vegetable farms in Poland as a Tool for the Optimization of Quality Management Systems. Sustainability 2019, 11, 1913. [Google Scholar] [CrossRef] [Green Version]
  8. Kasprzak, K.; Wojtunik-Kulesza, K.; Oniszczuk, T.; Kuboń, M.; Oniszczuk, A. Secondary Metabolites, Dietary Fiber and Conjugated Fatty Acids as Functional Food Ingredients against Overweight and Obesity. Natl. Prod. Commun. 2018, 13, 1073–1082. [Google Scholar] [CrossRef] [Green Version]
  9. Gródek-Szostak, Z.; Szeląg-Sikora, A.; Sikora, J.; Korenko, M. Prerequisites for the cooperation between enterprises and business supportinstitutions for technological development. In Business and Non-Profit Organizations Facing Increased Competition and Growing Customers’ Demand; Nowy Sacz Business School–National Louis University: Nowy Sącz, Poland, 2017; Volume 16, pp. 427–439. [Google Scholar]
  10. Goglio, P.; Smith, W.N.; Grant, B.B.; Desjardins, R.L.; McConkey, B.G.; Campbell, C.A.; Nemecek, T. Accounting for soil carbon changes in agricultural life cycle assessment (LCA): A review. J. Clean. Prod. 2015, 104, 23–30. [Google Scholar] [CrossRef]
  11. Audsley, E.; Stacey, K.; Parsons, D.J.; Williams, A.G. Estimation of the Greenhouse Gas Emissions from Agricultural Pesticide Manufacture and Use; Cranfield University: Cranfield, Bedford, 2009. [Google Scholar]
  12. Eggleston, H.S.; Buendia, L.; Miwa, K.; Ngara, T.; Tanabe, K. IPCC Guidelines for National Greenhouse Gas Inventories; Institute for Global Environmental Strategies RIP: Hayama, Japan, 2009. [Google Scholar]
  13. Tubiello, F.N.; Salvatore, M.; Rossi, S.; Ferrara, A.; Fitton, N.; Smith, P. The FAOSTAT database of greenhouse gas emissions from agriculture. Environ. Res. Lett. 2013, 8, 015009. [Google Scholar] [CrossRef]
  14. Lan, K.; Yao, Y. Integrating Life Cycle Assessment and Agent-Based Modeling: A Dynamic Modeling Framework for Sustainable Agricultural Systems. J. Clean. Prod. 2019, 238, 117853. [Google Scholar] [CrossRef]
  15. Forster, P.; Ramaswamy, V.; Artaxo, P.; Berntsen, T.; Betts, R.; Fahey, D.W.; Haywood, J.; Lean, J.; Lowe, D.C.; Myhre, G.; et al. Changes in Atmospheric Constituents and in Radiative Forcing. In Climate Change 2007: The Physical Science Basis. Contribution of Working Group I to the Fourth Assessment Report of the Intergovernmental Panel on Climate Change; Solomon, S., Qin, D., Manning, M., Chen, Z., Marquis, M., Averyt, K.B., Tignor, M., Miller, H.L., Eds.; Cambridge University Press: Cambridge, UK; New York, NY, USA, 2007; p. 212. [Google Scholar]
  16. Kapusta-Duch, J.; Szeląg-Sikora, A.; Sikora, J.; Niemiec, M.; Gródek-Szostak, Z.; Kuboń, M.; Leszczyńska, T.; Borczak, B. Health-Promoting Properties of Fresh and Processed Purple Cauliflower. Sustainability 2019, 11, 4008. [Google Scholar] [CrossRef] [Green Version]
  17. Bacenetti, J.; Lovarelli, D.; Fiala, M. Mechanisation of organic fertiliser spreading, choice of fertiliser and harvesting residue management as solutions for maize environmental impact mitigation. Eur. J. Agron. 2016, 79, 107–118. [Google Scholar] [CrossRef]
  18. Liang, L.; Lal, R.; Ridoutt, B.G.; Du, Z.L.; Wang, D.P.; Wang, L.Y.; Wu, W.L.; Zhao, G.S. Life cycle assessment of China’s agroecosystems. Ecol. Indic. 2018, 88, 341–350. [Google Scholar] [CrossRef]
  19. Nemecek, T.; Dubois, D.; Huguenin-Elie, O.; Gaillard, G. Life cycle assessment of Swiss farming systems: I. Integrated and organic farming. Agric. Syst. 2011, 104, 217–232. [Google Scholar] [CrossRef]
  20. De Luca, G.; Strkalj, N.; Manz, S. Nanoscale design of polarization in ultrathin ferroelectric heterostructures. Nat. Commun. 2017, 8, 1419. [Google Scholar] [CrossRef] [PubMed] [Green Version]
  21. Devapriya, P.; Ferrell, W.; Geismar, N. Integrated production and distribution scheduling with a perishable product. Eur. J. Oper. Res. 2017, 259, 906–916. [Google Scholar] [CrossRef]
  22. Montgomery, D.C. Design and Analysis of Experiments; John Wiley & Sons, Inc.: New York, NY, USA, 2001. [Google Scholar]
  23. ISO 31000:2018. Risk management; ISO: Geneva, Switzerland, 2018. [Google Scholar]
  24. ILCD. General Giude for Lifr Cycle Assessment Detailed Guidance; JRC European Commision, Publications Office of the European Union: Luxembourg, 2010; p. 394. [Google Scholar]
  25. Kool, A.; Marinussen, M.; Blonk, H. LCI Data for the Calculation Tool Feedprint for Greenhouse Gas Emissions of Feed Production and Utilization GHG Emissions of N, P and K Fertilizer Production; Blonk Consultants: Gouda, The Netherlands, 2016; Available online: https://www.blonkconsultants.nl/wp-content/uploads/2016/06/fertilizer_production-D03.pdf (accessed on 26 March 2020).
  26. IPCC. Guidelines for National Greenhouse Gas Inventories, Volume 4: Agriculture, Forestry and Other Land Use; Intergovernmental Panel on Climate Change: Geneva, Switzerland, 2006. [Google Scholar]
  27. Novoa, R.; Tejeda, H. Evaluation of the N2O emissions from N in plant residues as affected by environmental and management factors. Nutr. Cycl. Agroecosyst. 2006, 75, 29–46. [Google Scholar] [CrossRef]
  28. EPA Unated States Environmental Protection Agency. Greenhouse Gas Inventory Guidance Direct Emissions from Mobile Combustion Sources; U.S. EPA Center for Corporate Climate Leadership—GHG Inventory Guidance: Washington, DC, USA, 2016; p. 27.
  29. Wang, J.; Rothausen, S.; Conway, D.; Zhang, L.; Xiong, W.; Holman, I.P.; Li, Y. China’s water–energy nexus: Greenhouse-gas emissions from groundwater use for agriculture. Environ. Res. Lett. 2012, 7, 1–10. [Google Scholar] [CrossRef]
  30. FAO. Global database of GHG emissions related to feed crops: Methodology. In Version 1. Livestock Environmental Assessment and Performance Partnership; FAO: Rome, Italy, 2017. [Google Scholar]
  31. Niemiec, M. Efficiency of slow-acting fertilizer in the integrated cultivation of Chinese cabbage. Ecol. Chem. Eng. A 2014, 21, 333–346. [Google Scholar]
  32. Niemiec, M.; Cupiał, M.; Szeląg-Sikora, A. Evaluation of the Efficiency of Celeriac Fertilization with the Use of Slow-acting Fertilizers. Agric. Agric. Sci. Procedia 2015, 7, 177–183. [Google Scholar] [CrossRef] [Green Version]
  33. Gródek-Szostak, Z.; Malik, G.; Kajrunajtys, D.; Szeląg-Sikora, A.; Sikora, J.; Kuboń, M.; Niemiec, M.; Kapusta-Duch, J. Modeling the Dependency between Extreme Prices of Selected Agricultural Products on the Derivatives Market Using the Linkage Function. Sustainability 2019, 11, 4144. [Google Scholar] [CrossRef] [Green Version]
  34. Cupiał, M.; Szeląg-Sikora, A.; Niemiec, M. Farm Machinery and Processes Management in Sustainable Agriculture Location: 7th International Scientific Symposium: Symposium proceedings, Gembloux, Belgium November, 25–27, 2015. Agric. Agric. Sci. Procedia 2015, 7, 64–69. [Google Scholar]
  35. Sikora, J.; Niemiec, M.; Szeląg-Sikora, A.; Kuboń, M.; Olech, E.; Marczuk, A. Zgazowanie odpadów z przemysłowego przetwórstwa karpia. Przem. Chem. 2017, 96, 2275–2278. [Google Scholar] [CrossRef]
  36. Zhang, J.; Jiang, J.; Tian, G. 2016. The potential of fertilizer management for reducing nitrous oxide emissions in the cleaner production of bamboo in China. J. Clean. Prod. 2016, 112, 2536–2544. [Google Scholar] [CrossRef]
  37. Liang, J.-F.; An, J.; Gao, J.-Q.; Zhang, X.-Y.; Song, M.-H.; Yu, F.-H. Interactive effects of biochar and AMF on plant growth and greenhouse gas emissions from wetland microcosms. Geoderma 2019, 346, 11–17. [Google Scholar] [CrossRef]
  38. Niemiec, M.; Komorowska, M.; Mudryk, K.; Jewiarz, M.; Sikora, J.; Szeląg-Sikora, A.; Rozkosz, A. Evaluation of the Fertilizing Potential of Products Based on Torrefied Biomass and Valorized with Mineral Additives. Renewable Energy Sources: Engineering, Technology, Innovation; Springer: Cham, Switherland, 2020; pp. 267–275. [Google Scholar]
  39. Xiao, Y.; Peng, F.; Zhang, Y.; Wang, J.; Zhuge, Y.; Zhanga, S.; Gaoa, H. Effect of bag-controlled release fertilizer on nitrogen loss, greenhouse gas emissions, and nitrogen applied amount in peach production. J. Clean. Prod. 2019, 234, 258–274. [Google Scholar] [CrossRef]
  40. Garg, A.; Kazunari, K.; Pulles, T. IPCC Guidelines for National Greenhouse Gas Inventories. Available online: https://www.ipcc-nggip.iges.or.jp/public/2006gl/pdf/2_Volume2/V2_1_Ch1_Introduction.pdf (accessed on 26 March 2020).
  41. ISO 14040. Environmental Management-Life Cycle Assessment-Principles and Framework; ISO: Geneva, Switzerland, 2006. [Google Scholar]
  42. Zhang, X.; Bol, R.; Rahn, C.; Xiao, G.; Meng, F.; Wu, W. Agricultural sustainable intensification improved nitrogen use efficiency and maintained high crop yield during 1980–2014 in Northern China. Sci. Total Environ. 2017, 596–597, 61–68. [Google Scholar] [CrossRef]
  43. IFA. Energy Efficiency and CO2 Emissions in Ammonia Production 2008–2009 Summary Report; International Fertilizer Association: Paris, France, 2009. [Google Scholar]
  44. Tongwane, M.; Mdlambuzi, T.; Moeletsi, M.; Tsubo, M.; Mliswa, V.; Grootboom, L. Greenhouse gas emissions from different crop production and management practices in South Africa. Environ. Dev. 2016, 19, 23–35. [Google Scholar] [CrossRef] [Green Version]
  45. Jacxsens, L.; Luning, P.A.; Marcelis, W.J.; van Boekel, T.; Rovira, J.; Oses, S.; Kousta, M.; Drosinos, E.; Jasson, V.; Uyttendaele, M. Tools for the performance assessment and improvement of food safety management systems. Trends Food Sci. Technol. 2011, 22 (Suppl. 1), 80–89. [Google Scholar] [CrossRef]
  46. ISO. TS-EN ISO 14067 Greenhouse Gases—Carbon Footprint of Products—Requirements and Guidelines for Quantification and Communication; International Organization for Standardization: Geneva, Switzerland, 2013. [Google Scholar]
  47. Wójcicki, Z. Methodology of examining energy consumption of agricultural production. Problemy Inżynierii Rolniczej 2015, 23, 17–29. [Google Scholar]
  48. Niemiec, M.; Komorowska, M.; Szeląg-Sikora, A.; Sikora, J.; Kuzminova, N. Content of Ba, B, Sr and As in water and fish larvae of the genus Atherinidae, L. sampled in three bays in the Sevastopol coastal area. J. Elem. 2018, 23, 1009–1020. [Google Scholar] [CrossRef]
  49. Goglio, P.; Williams, A.G.; Balta-Ozkan, N.; Harris, N.R.P.; Williamson, P.; Balta-Ozkan, N.; Huisingh, D.; Zhang, Z.; Tavoni, M. Advances and challenges of life cycle assessment (LCA) of greenhouse gas removal technologies to fight climate changes. J. Clean. Prod. 2020, 244, 118896. [Google Scholar] [CrossRef]
  50. Kuźnia, M.; Wojciech, J.; Łyko, P.; Sikora, J. Analysis of the combustion products of biogas produced from organic municipal waste. J. Power Technol. 2015, 95, 158–165. [Google Scholar]
  51. Niemiec, M.; Chowaniak, M.; Sikora, J.; Szeląg-Sikora, A.; Gródek-Szostak, Z.; Komorowska, M. Selected Properties of Soils for Long-Term Use in Organic Farming. Sustainability 2020, 12, 2509. [Google Scholar] [CrossRef] [Green Version]
  52. Sikora, J.; Niemiec, M.; Tabak, M.; Gródek-Szostak, Z.; Szeląg-Sikora, A.; Kuboń, M.; Komorowska, M. Assessment of the Efficiency of Nitrogen Slow-Release Fertilizers in Integrated Production of Carrot Depending on Fertilization Strategy. Sustainability 2020, 12, 1982. [Google Scholar] [CrossRef] [Green Version]
  53. Kuboń, M.; Niemiec, M.; Tabak, M.; Komorowska, M.; Gródek-Szostak, Z. Ocena zasobności gleby w przyswajalne związki siarki z wykorzystaniem ekstrahentów o zróżnicowanej zdolności ekstrakcji. Przem. Chem. 2020, 99, 581–584. [Google Scholar] [CrossRef]
  54. Sikora, J.; Niemiec, M.; Szeląg-Sikora, A.; Gródek-Szostak, Z.; Kuboń, M.; Komorowska, M. The Effect of the Addition of a Fat Emulsifier on the Amount and Quality of the Obtained Biogas. Energies 2020, 13, 1825. [Google Scholar] [CrossRef] [Green Version]
Figure 1. Amount of marketable and residual crop.
Energies 13 02063 g001
Figure 2. Total GHG emissions and emissions related to the use of fertilizers.
Energies 13 02063 g002
Figure 3. Structure of GHG emissions from individual sources [%].
Energies 13 02063 g003
Table 1. Selected soil properties at the beginning and at the close of the experiment. Used for experiments mg·kg−1 and after.
pH in H2OpH in KCl[%]mg·kg−1
N in TotalC OrganicN MineralPKMgCa
7.016.650.161.4156.65147.8359.5199.4850
Table 2. Experiment diagram.
Object NumberSlow-Release FertilizerAmmonium NitrateTriple SuperphosphatePotassium SaltNP2O5K2O
kg of fertilizer·ha−1kg of component·ha−1
control0------
1400-891777260150
2500-761589060150
3600-6514010860150
4800-4310314460150
5-30013025010060150
6-45013025015060150
7-60013025020060150
Table 3. Energy consumption and greenhouse gas (GHG) emissions associated with agricultural treatments.
Type of Agricultural TreatmentDiesel UseEnergy UseCO2 Emission
[dm3][MJ][kg]
Ploughing 57.02299.0220.2
Mineral fertilization, one time5.1206.919.71
Cultivation with an aggregate30.81241.5119.0
Mechanical planting154.06207.4595.1
Application of plant protection products, four times24.8517.395.83
Mechanical weeding, one time19.2775.974.19
Total1325.853,458.01124.0
Irrigation [KWh] 194.7179.7
Total 1303.7
Table 4. CO2 emissions from fertilizers [CO2 equivalent·ha−1).
Object NumberABCDEF
control 1323.4353.1a *
259272.29664.2948.751323.4384.3a
374064.00804.0048.751323.4474.0b
488856.34944.3448.751323.4521.1bc
5118440.701224.7048.751323.4563.9c
6 502.3502.2848.751303.7412.8a
7 901.8901.7848.751303.7476.9b
8 1301.31301.2848.751303.7458.1bc
* Different letters mean statistically significant differences at the significance level p = 0.05.
Table 5. Greenhouse gas (GHG) emissions.
Object NumberGHIJK
equivalent of CO2∙ha−1equivalent of CO2∙ha−1
control 14.5
11.130.04330.411.3318.9
21.410.30413.087.8131.5
31.700.44495.6128.0238.2
42.260.68660.8197.7744.2
51.570.64458.9187.8522.9
62.361.15688.3334.5131.9
73.141.53917.7448.0129.3

