Article

Determination of the Selected Wells Operational Power with Borehole Heat Exchangers Operating in Real Conditions, Based on Experimental Tests

by
Joanna Piotrowska-Woroniak
HVAC Department, Bialystok University of Technology, Wiejska 45E, 15–351 Bialystok, Poland
Energies 2021, 14(9), 2512; https://doi.org/10.3390/en14092512
Submission received: 18 March 2021 / Revised: 23 April 2021 / Accepted: 24 April 2021 / Published: 27 April 2021

Abstract

:
On the basis of experimental studies, the operational power of four borehole heat exchangers (BHE) under real conditions was determined. The research was carried out in 2018–2019. The theoretical power of the BHE was verified with its operating power. The amount of thermal energy absorbed from the ground by individual BHEs, the operating temperatures obtained at the inlet and outlet of the exchanger, the annual brine flow rate, and the average operating power of the tested wells in two heating seasons were compared and analyzed. Both in 2018 and 2019, none of the examined exchangers achieved an average unit capacity of a well. The aim of the work is to verify the specific ground thermal efficiency indicators adopted for the design of the lower heat source, determined using the computational method and the TRT test with data obtained on the basis of experimental tests. The differences between the results of the tests of the operating parameters of the analyzed BHEs were shown. The data obtained in real conditions is valuable in the research and development of the BHE system.

1. Introduction

Climate change is a major challenge for the world community. European countries are aiming to achieve zero net emissions by 2050 [1,2]. Buildings, which account for up to 36% of final energy consumption, can make an important contribution to achieving this target [3]. Clean and renewable energy resources are receiving increasing attention because of their advantages over fossil fuels, which have a significant impact on global warming and pollution. As one of the main options for replacing conventional energy sources, geothermal energy is becoming more and more attractive due to its wide availability, low operating costs and low CO2 emissions [4]. The design phase of ground source heat pump systems is extremely important as many of the decisions made at this stage can affect the energy performance of the system as well as installation and operating costs [5]. The borehole heat exchangers (BHE) are the most commonly used devices in buildings due to their efficiency [6]. The efficiency of a heat pump’s energy system is greatly influenced by a low-temperature heat source. Neuberger and Adamovský [7] presented the results of operational monitoring, analysis and comparison of temperatures, power and energy of antifreeze fluid in the most commonly used low-temperature heat sources. The results of the verification indicated that it was not possible to unequivocally define the most favorable low-temperature heat source meeting the requirements for the efficiency of the heat pump operation. Sáez Blázquez et al. [8] investigated the influence of main components on the overall efficiency of the BHE. Regarding the heat transfer process between the soil and the heat transfer fluid, it should be emphasized that the best results were obtained with a spiral-shaped pipe system. Thanks to the laboratory results obtained from these studies, it is possible to establish the optimal behavior pattern for entire vertical closed systems [8]. In BHE, the remainder of the borehole is filled with a filler material, called a grout, usually made of bentonite, quartz with sand or just a water mixture [9]. Quartz provides higher thermal conductivity of the joint, and bentonite provides sealing and blanking properties [10]. Due to earthworks, the length of the geothermal heat exchanger must be properly calculated. Too little will result in excessive “discharge” and lack of time for its regeneration in the summer. Too many of them will generate unnecessary costs [11]. Therefore, it is advantageous to calculate the lower parameters of the heat source as accurately as possible. There are many attempts to solve this problem in an analytical way and with the help of computer simulations [12,13,14,15,16,17,18,19,20,21,22,23,24], but so far there is no universal formula. Real measurement results are required for calculations and simulations. A number of studies [25,26,27,28,29,30,31,32,33,34] have been conducted to evaluate the performance of BHE in heat pump systems. All of these studies described the impact of BHE based on the evaluation of COP improvement in these systems. Bae et al. assessed the thermal performance of different types of BHE pipes using the Thermal Response Test (TRT) under the same field and test conditions, it was found that the borehole average thermal resistance could be an important factor in TRT, but the effect of the increased thermal conductivity of the pipe material itself was not significant [35]. BHEs are a key technological component of geothermal energy systems, and modeling their behavior has received much attention. The main technical challenge when designing geothermal heat exchanger systems is the ability to predict long-term temperature trends in well groups. This inevitably requires computer models implemented in design software or tools to simulate thermal systems [36,37]. Many studies look for a function describing the soil temperature profile, the most popular are those proposed by Kasuda et al., which report a sinusoidal change in soil temperature at various depths as a function of average temperature [38]. Most analytical and numerical methods are not always able to actually predict the temperature distribution in the ground [13]. More about the numerical methods and simulations used in the calculations of BHE and heat transfer in the ground can be found in [2,12,39,40,41,42,43,44,45,46,47,48,49,50,51,52,53,54,55,56,57,58].
Ma et al. investigated the effect of groundwater migration on the BHE, heat exchange between ground heat exchangers and changes in the surrounding soil from heat conduction to the coupled mode of conduction and convection [59]. The presence of groundwater advection can significantly increase heat transfer and accelerate the possibility of soil restoration, as studied by Serageldin et al. [60]. Lei et al. investigated whether groundwater flow and the interaction of underground pipe groups will affect heat transfer efficiency and ground temperature field distribution, thus affecting the design and operation of ground source heat pumps [58]. Numerical calculations involving well material and groundwater flow were provided by Park et al. where the suitability of the combined model of a solid cylindrical heat source, which so far is the most suitable for energy piles, was assessed by performing a series of numerical analyzes [61].
The thermal response test (TRT) is a common procedure for characterizing the thermal properties of the ground and borehole needed to design a shallow geothermal heat pump system [62]. For this interpretation, TRT measurements must be made under defined boundary conditions; if any of its assumptions are invalid, the interpretation will lead to an error in the final result [8,63]. TRT is especially needed in large-scale installations, where an improper design of a borehole heat exchanger will mean poor system performance if the system is too small or unjustified cost overruns if it is oversized. TRT is based on the thermal reaction of a heat exchanger to a constant, several days, heat injection or extraction pulse. The most significant variables measured with the TRT are the heat transfer fluid temperature at the inlet and outlet of the heat exchanger, measured during the execution of the test. By comparing these experimental data with the model describing the heat exchange between the liquid and the soil, the thermal properties of the soil can be estimated [62]. Conventional thermal response testing (TRT), successfully implemented in the commercial geothermal sector, involves injecting a thermal pulse into a borehole and measuring its temperature response [63]. Badenes et. presented a comparison of the data obtained in the first TRTs performed without the injection power control with the data obtained in the tests with the PID controller, which regulated the power injected in the well [62]. Lamarche et al. investigated the borehole resistance and internal resistance using the temperature of the bottom fluid and changing the flow rate. It was found that the resistance depends on the assumed temperature profile along the GHE pipe and the temperature at the bottom is very sensitive to the accuracy of temperature sensors [64].
To improve the accuracy of the TRT, Kurevija et al. introduced a procedure for additional analysis of the temperature drop after the power test. The method is based on the justification of the analogy between TRT and oil well testing, as the source of both procedures is the diffusivity equation with solutions for thermal conductivity analysis or pressure analysis during radial flow [65]. Peng et al. proposed an improved TRT (ITRT) method for coaxial BHE as effective thermal properties of the soil cannot be obtained with the traditional thermal response test (TRT) method for this type of BHE. The influence of the inlet temperature and the flow rate on the heat transfer coefficient is more significant than the influence of the backfill material, the thermal conductivity of the inner pipe and the well depth [43]. Jensen-Page et al. investigated the TRT test of large diameter energy exchangers (large diameter energy piles), which are a novel form of BHE heat exchangers used in ground source heat pump systems [66]. Sáez Blázquez et al. proposed an experimental novel device that provides an inexpensive, less time-consuming and reliable approach to measuring thermal conductivity. This approach can replace or supplement well-known but expensive methods such as the thermal response test (TRT) [67]. A very extensive review on TRTs of ground-coupled heat pump systems can be found in the work of Zhang et al. covering both in situ research and mathematical models [68].
In this work, on the basis of experimental tests, the operational power of four wells with vertical ground probes for brine-water heat pumps under real conditions was determined. The theoretical power of the BHE was verified with its operating power. The amount of thermal energy absorbed from the ground by individual BHE, the obtained operating temperatures at the inlet and outlet of the exchanger, the annual brine flow rate, and the average operating power of the tested wells in two heating seasons were compared and analyzed. The aim of the work is to verify the specific soil thermal efficiency indicators adopted for the design of the lower heat source, determined with the use of the computational method and the TRT test with data obtained on the basis of experimental tests.

2. Materials and Methods

2.1. Experimental and Measuring Site

Operational tests of selected four working BHEs, out of 52 ones, were carried out in the north-eastern part of Poland. The analysis of the results of the operational research of BHEs work covers the years 2018–2019.
Statistical climatic conditions from the period 1971–2000 and the parameters occurring in 2018–2019 characterizing the studied area of BHEs locations are presented in Table 1.
A statistical measure that describes the heat demand in a building is the number of degree-days given in Table 1, which in a given heating season determines the energy consumption for heating buildings. The number of degree-days takes into account the average measured monthly outdoor temperature in a given year and the number of days in the heating season. On the basis of the calculated values of the number of degree-days, we can compare heating seasons in individual years, as well as refer to the standard multi-year heating season. The number of days with snow cover in 2018 was 55 days, and in 2019 47 days.

2.2. Description of the Experimental Setup and Location of the Tested Wells

The wells selected for analysis with the BHEs placed inside them were marked as L1, L2, L3 and L4, and their exact location is shown in Figure 1.
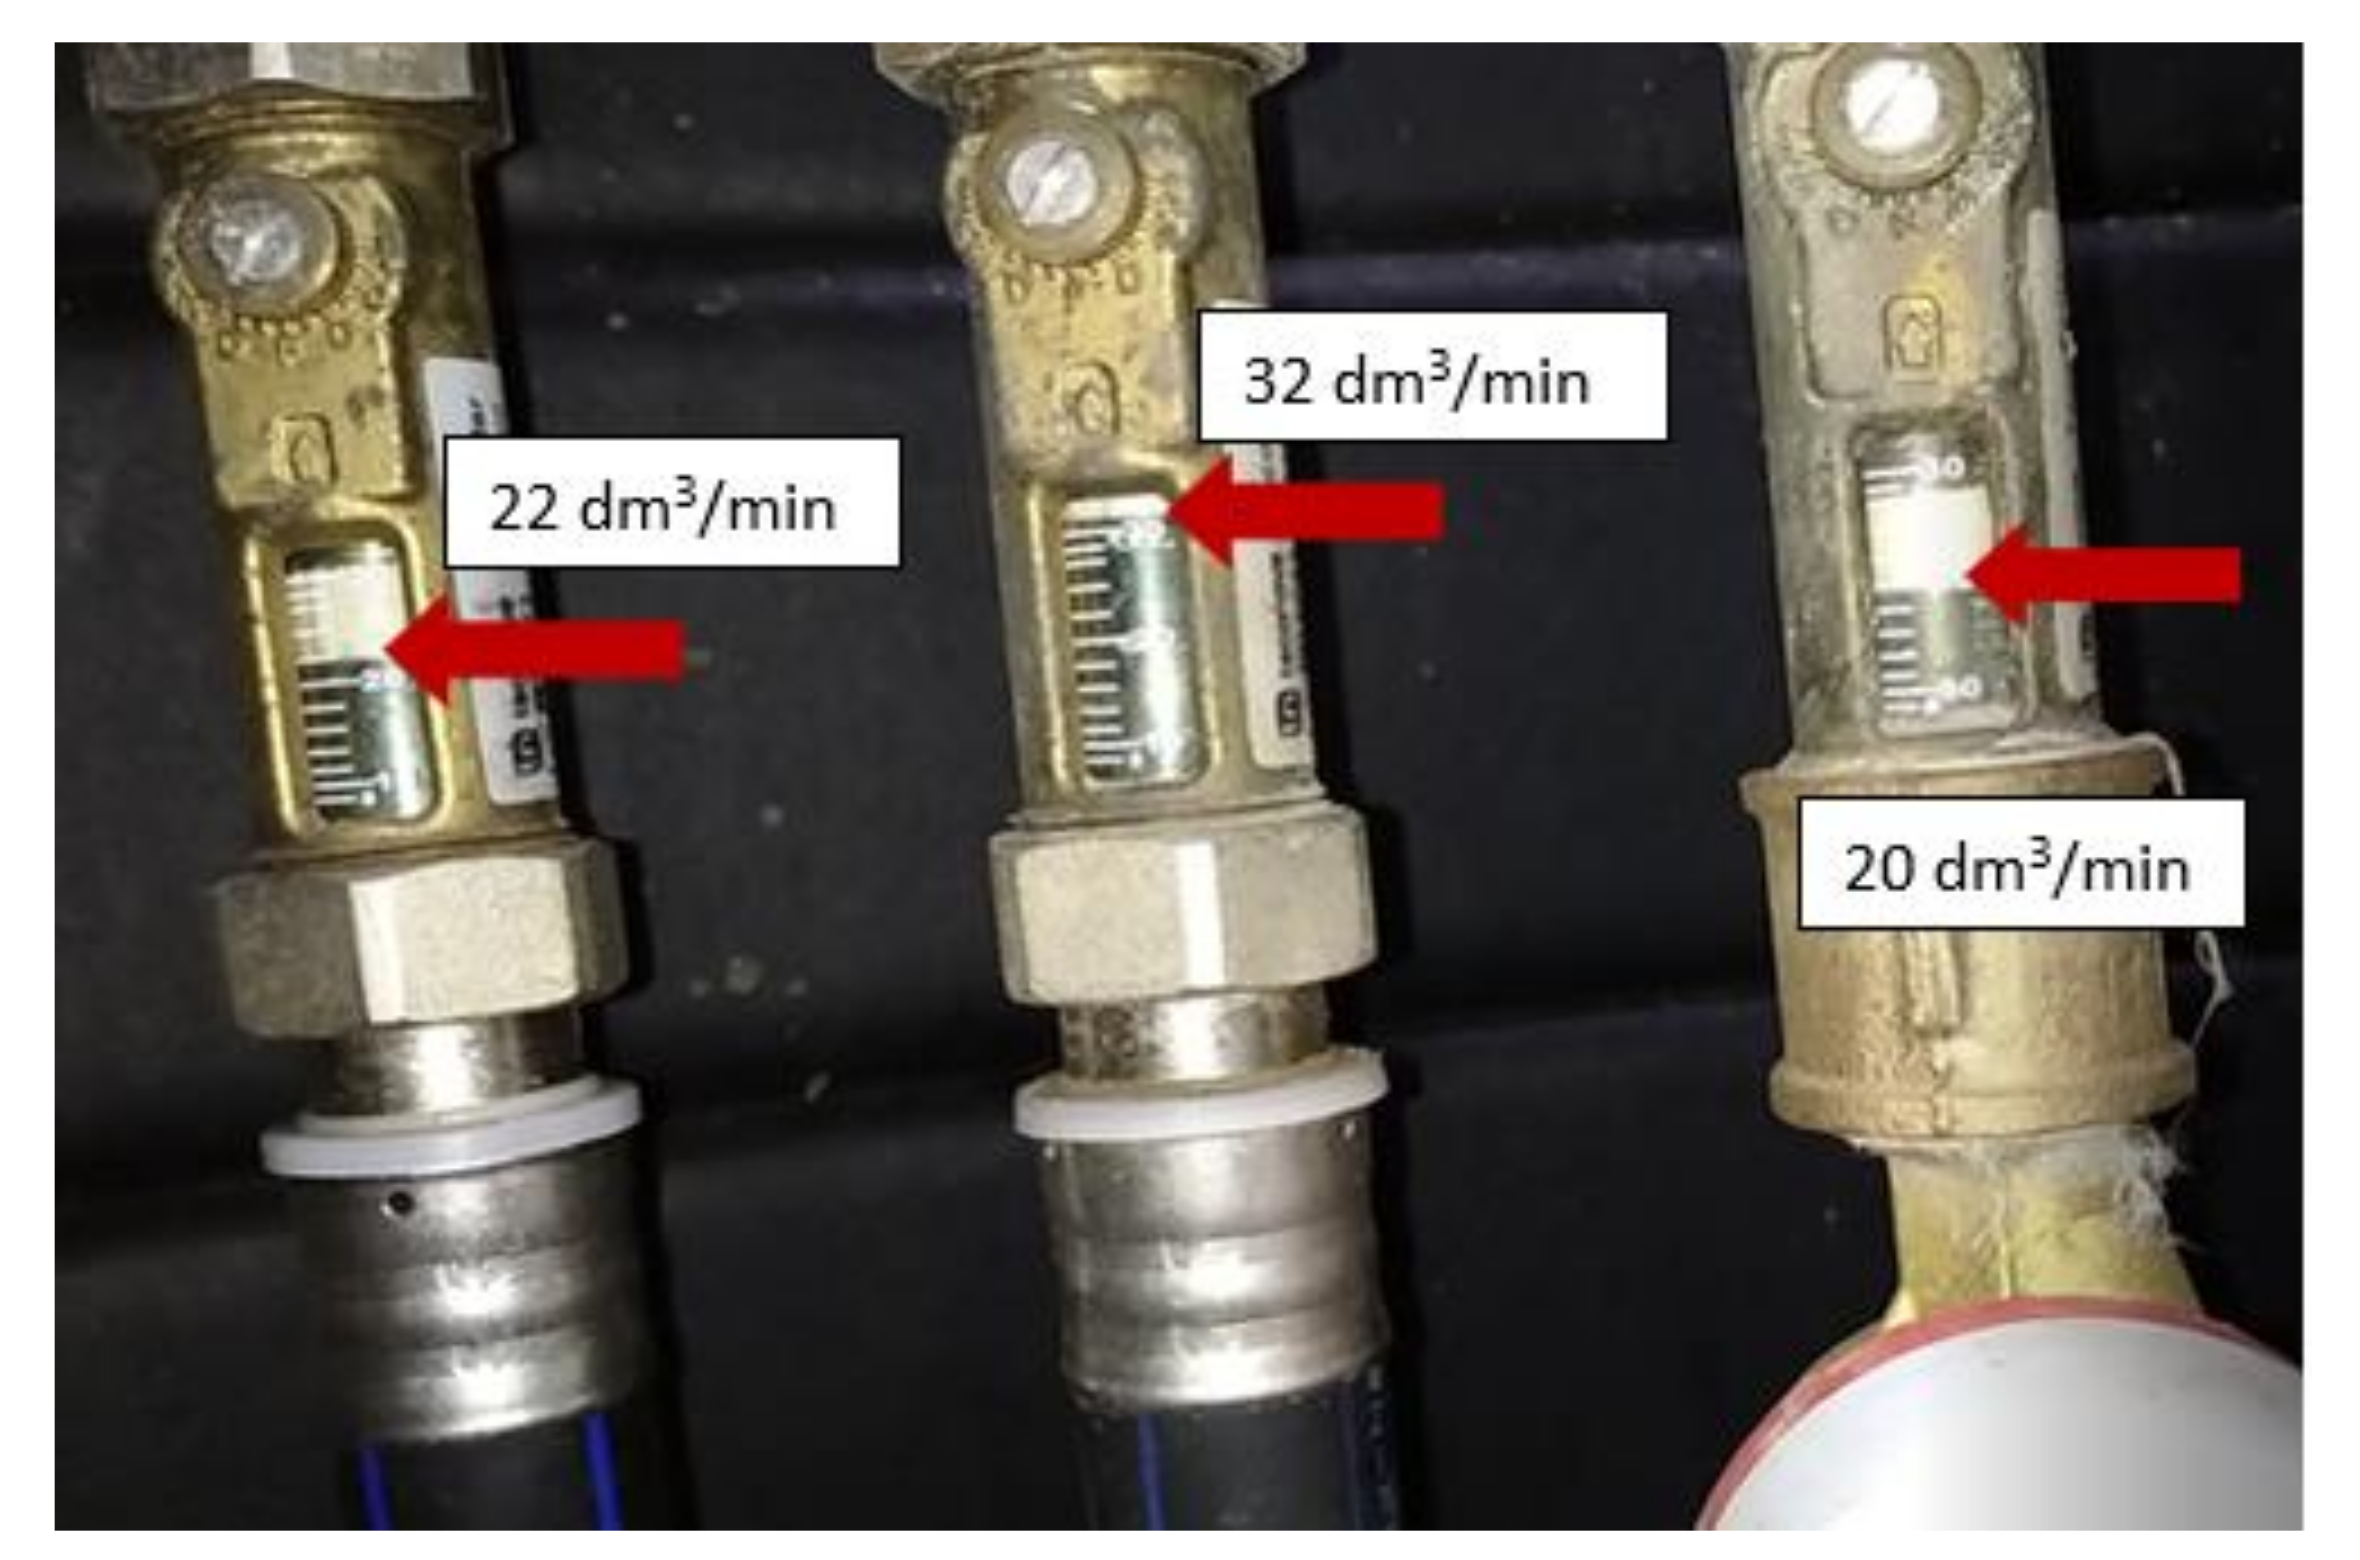
BHEs are made of PE-Xa cross-linked polyethylene with a diameter of 40/3.7 mm, 100 m in depth, U-shaped and form the lower heat source for two brine-water heat pumps, with a heating power of 117.2 kW and a cooling capacity of 95.9 kW each, working for heating purposes in public utility building. The outer diameter of a single borehole is 160 mm and it is filled with a mixture of concrete mixed with excavated material. The distances between BHEs are 10 m (Figure 1). The assumed design flow rate for each well, in accordance with the design documentation [70], was 14.2 dm3/min, with a temperature difference in the brine circuit equal to ΔT = 4 °C. While the actual flows set on the rotameters during BHEs operation are from 20 dm3/min to 32 dm3/min, and the measured temperature difference in the brine circuit is ΔT = 1.4–2.9 °C, on average ΔT = 2 °C. The hydraulic imbalance of the brine has a significant impact on the operation of the BHEs. The heat transferring factor is an aqueous propylene glycol solution with a concentration of 39%, a density of 1038 kg/m3 and a specific heat of 3.38 kJ/(kg∙K).

2.3. Measurement Methodology

Measurement of operating parameters such as: fluid temperature at the inlet T2 [°C] and the outlet T1 [°C] from the exchanger opening, temperature difference ΔT, volume flows of the flowing brine V [m3], instantaneous flow m ˙   c h   [m3/h], the instantaneous power of the borehole heat exchanger Pch [kW], the amount of heat energy taken from the ground E [MJ], is recorded continuously with a frequency of 5 min. Measurements on each probe are carried out using a flow transducer type JS90-2.5-NE PoWoGaz (FM), (accuracy 1%) with a PolluTherm (HMn) microprocessor conversion system and a pair of platinum thermoresistance PT500 temperature sensors (TS) mounted on stub pipes probes TS1 and TS2. Individual metering of BHEs allows for the control of the correctness of the drilling and its installation in the well, allowing the monitoring of the amount of heat taken from the ground by each of them.
Additionally, BHEs marked L1 and L3 along its entire length were equipped with 30 digital temperature sensors DS18B20 from Dallas Semiconductor (according to the concept of J. Piotrowska-Woroniak, G. Gajewski) [71].
The amount of thermal energy collected from the ground in 2018–2019 by each probe was determined based on the Equation (1):
E = [ i = 1 n C p   ·   ρ p   ·   m   ˙   i   ·   ( T 1 i T 2 i )   ·   t     i   ] / 10 6   MJ
where: Cp-specific heat, [J/(kg∙K)]; m   ˙ i   -mass flow rate of brine, [kg∙s−1]; ρp-brine density [kg/m3]; T1i T2i-brine supply and return temperature [°C]; ti-measurement time every 300 s, [s]; n-number of measurements in the analyzed period; i-operation time, covering the entire heating season in 2018–2019.
The instantaneous power of the borehole was determined based on the instantaneous flow and the instantaneous temperature difference measured every 5 min throughout the year, from the dependence Equation (2):
P i , c h   = C p   ·   ρ p   ·   m ˙ i , c h   ·   Δ T i , c h   k W
where: m ˙ i , c h –instantaneous brine mass flow rate every 5 min, [m3∙s−1]; ΔTi,ch–recorded temperature difference of the brine flowing through the BHE at the time of flow measurement [°C].
Determination of the instantaneous BHEs power in the entire heating season in time intervals of 5 min, made it possible to calculate the average operating daily power of a well, and then the average monthly operating power of BHEs. Each daily series of measurements included 283 measurement points, read every 300 s.

2.4. The Ground Profile

The study area, in which the BHEs wells are located (Figure 1), is located within the East European Platform and is composed of metamorphic rocks (granitoids, granite-gneisses and diabazes). The thermal properties of individual layers of the geological profile of a 100-m borehole are presented in Table 2. The values of the ground thermal conductivity coefficient [W/(m∙K)] and volumetric heat capacity [MJ/(m3∙K)] in Table 2 are given for the ranges of values from minimum to maximum, which characterize a given type of ground, together with the values recommended for calculations according to [72,73].
Knowing the geological profile of the ground and the quantities characterizing the soil, presented in Table 2, the mean value of the ground thermal conductivity coefficient λavg and the weighted average thermal capacity of the soil can be determined by calculation, and then the unit heat capacity of the ground heat exchanger qv [W/m].
The value of the thermal conductivity coefficient of soil λavg was determined by the calculation method as the weighted average of the individual layers of the well, taking into account the share of a given layer of soil in the entire structure of a 100-m well from the Equation (3):
λ   a v g = ( U 1   ·   λ   1   + U 2   ·   λ   2   + U 3   ·   λ   3   + U 4   ·   λ   4   + U 5   ·   λ   5   + U 6   ·   λ   6   ) ( U 1   + U 2   + U 3   + U 4   + U 5   + U 6   )   W / m   ·   K
where: Un is the share of a particular layer of soil in the structure of a 100 m borehole, in accordance with Table 2 and λn is the conductivity coefficient of a given soil layer [W/(m∙K)], in accordance with Table 2.
In order to estimate the theoretical power of the well, three calculation variants were analyzed in accordance with the geological profile of the well presented in Table 2, assuming different assumptions. The values of the thermal conductivity of soil λavg adopted for further calculations are included in Table 3.
The difference in the calculated values of the soil thermal conductivity coefficients between the extreme variants V1 and V2 is approximately 69%, and between the variants V1 and V3 approximately 31%.
The thermal conductivity of the ground was measured by the TRT test by an external company using the TRT Comfort 2.9 Measurement Kit. The measurement time was 40 h 40 min. The value of the measured coefficient of effective thermal conductivity of the soil was λ = 1.76 W/(m∙K) ± 0.03 W/(m∙K) [70]
The results of calculating the thermal power of a 100 m borehole with BHE, when determining λ by the computational method [75] and on the basis of measurements using the TRT test for the operating time of compressors in the heat pump up to 2000 h are presented in Table 3.
The λ value of the soil thermal conductivity coefficient measured by the TRT test differs from the values calculated for variants 1–3, with known the geological profile of the soil, from 16% to 38%. This shows how the lower heat sources can be designed of different sizes depending on the adopted calculation variant and the adopted values of the thermal conductivity coefficients of the soil for the geological profile of the well. An additional error in determining the size of the unit’s thermal efficiency of the well may result from the preparation of the geological profile of the well, made on the basis of samples taken of the excavated material from the borehole during drilling.
For the design of the lower heat source for brine-water heat pumps with a heating capacity of 234.4 kW and a cooling capacity of 182 kW installed in the Faculty of Civil Engineering and Environmental Sciences of Bialystok University of Technology building, the values adopted in Table 3 are marked as the V TRT variant.

3. Results and Discussion

During the experiment, the work of four wells in real conditions, marked as L1, L2, L3 and L4, was analyzed, the locations of which are shown in Figure 1. The analysis covers the years 2018–2019. Table 4 presents the operation time of two brine-water heat pumps with a total heating capacity of 234.5 kW from boreholes with BHE exchangers in 2018–2019.
The total working time of two heat pumps and the operation of BHEs in 2018 was 192 days, and in 2019 it was 212 days. The standard heating season in this area lasts 232 days. The average daily results of measurements of the unit heat flux from the ground in the wells marked as L1–L4 with operating BHEs in 2018–2019 are shown in Figure 2 and Figure 3. Calculations of the unit heat flux from the ground qv [W/m] for each day in 2018 and 2019 were performed at five-minute intervals, and then averaged over the following daily work cycles. Each daily series of measurements includes 283 measurement points, read every 300 s.
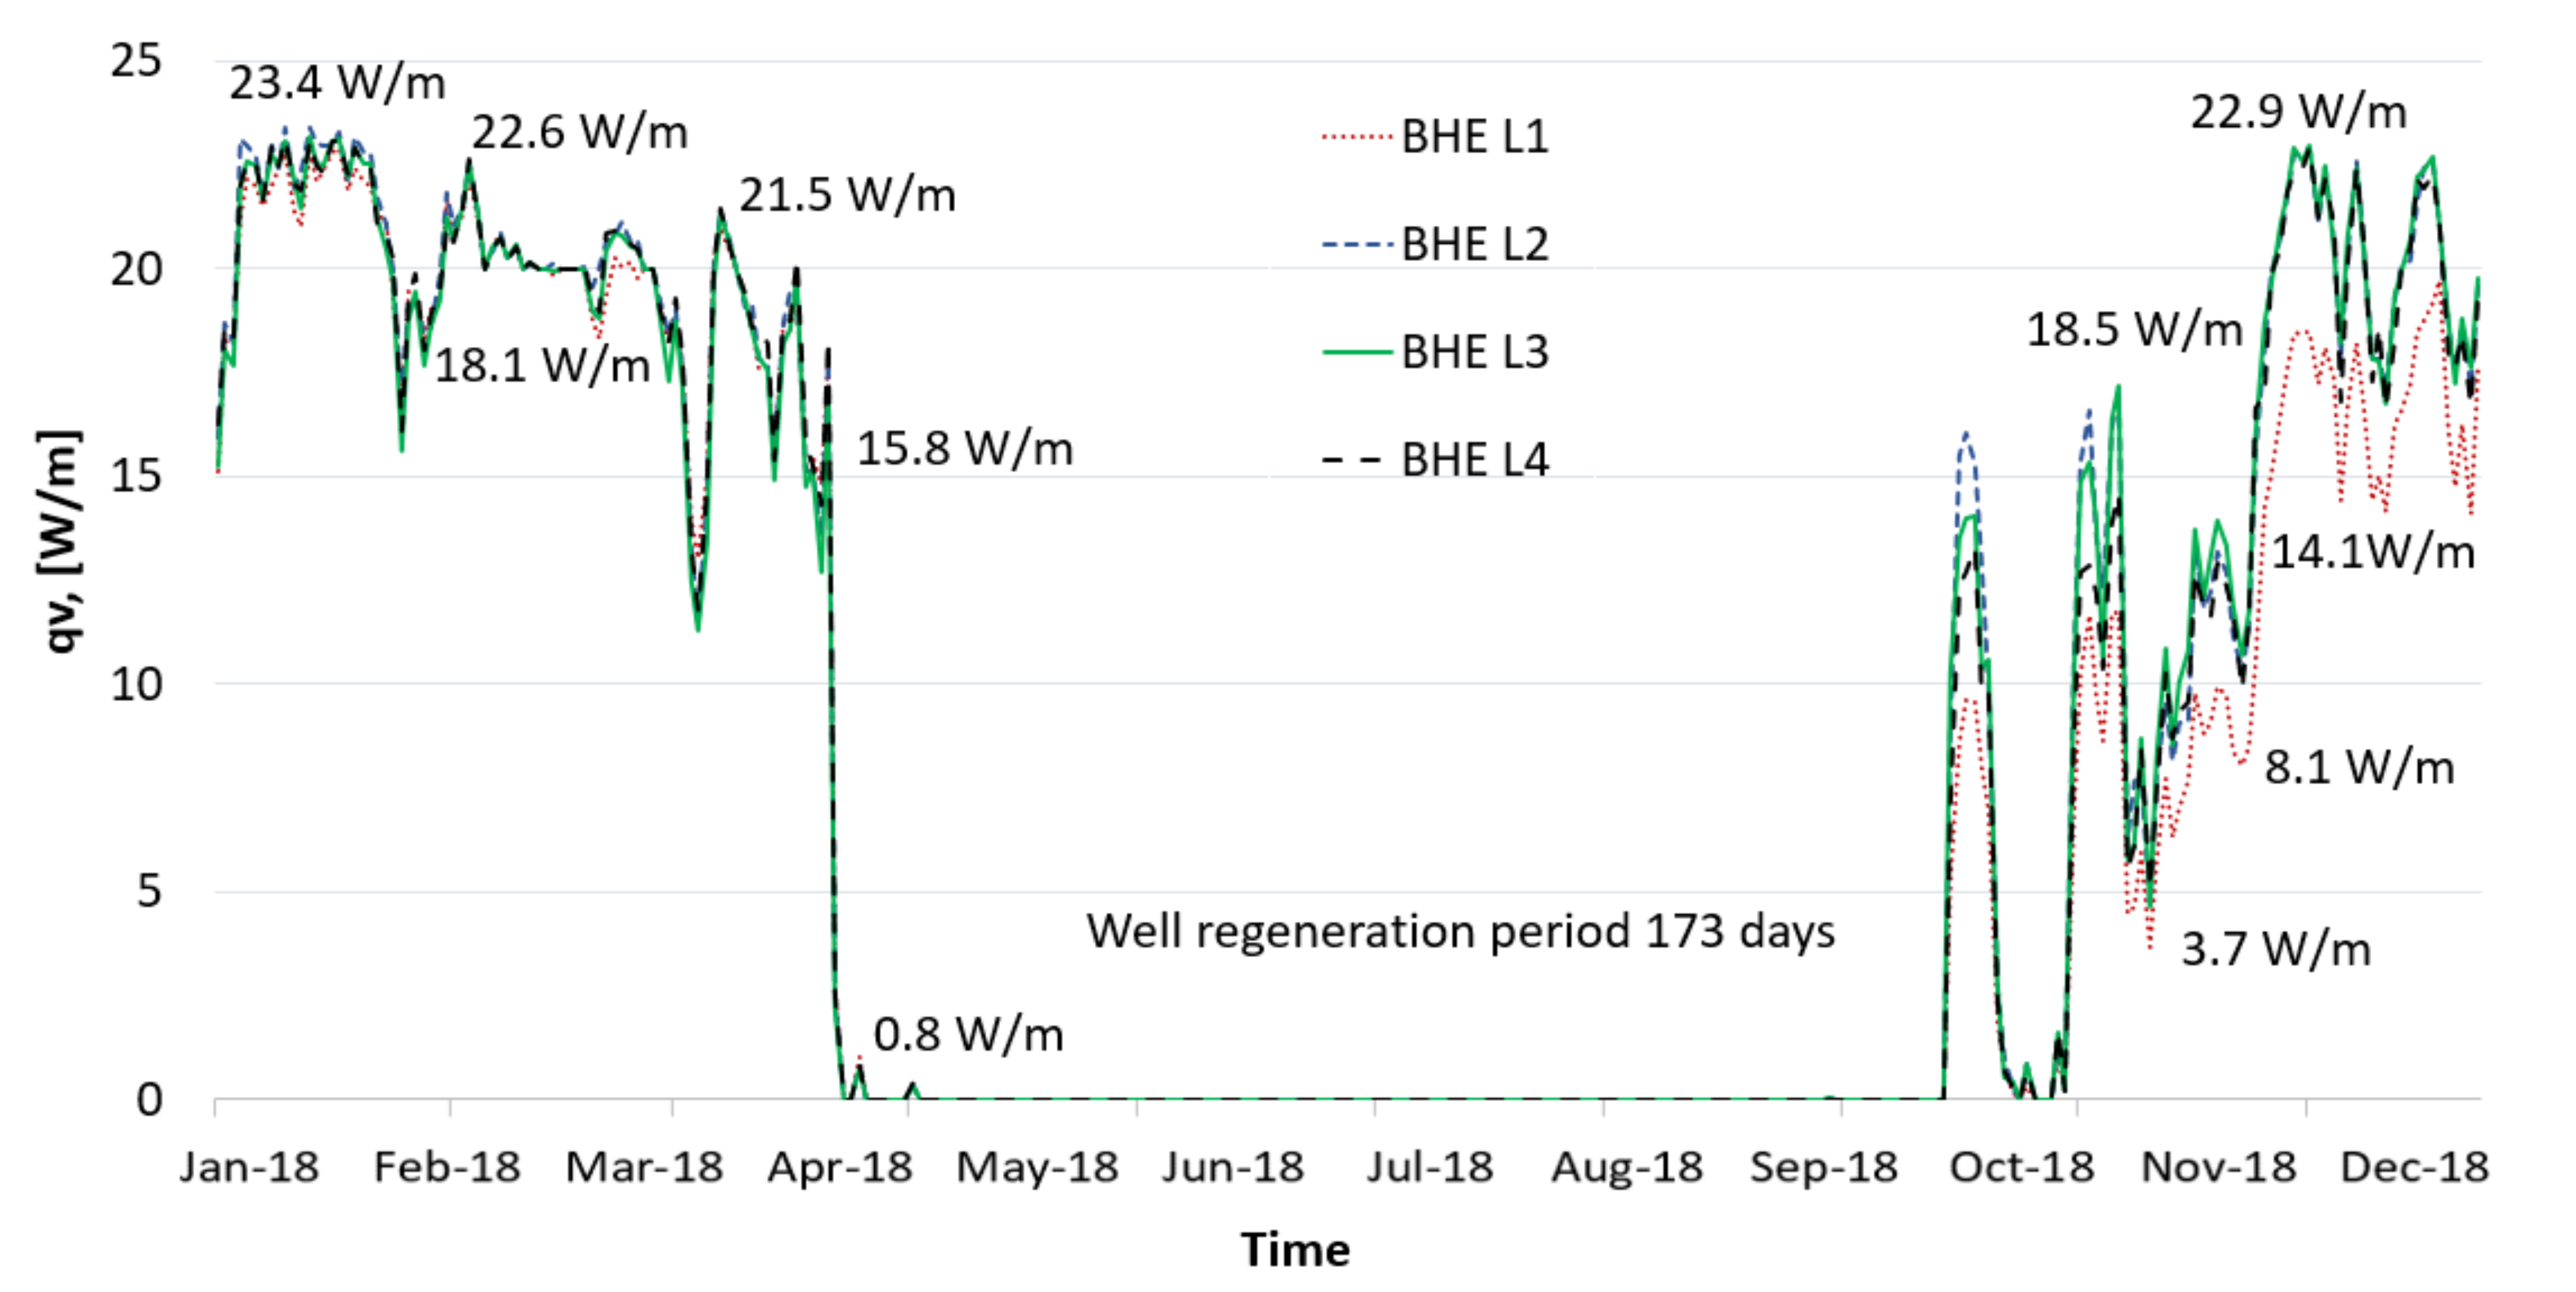
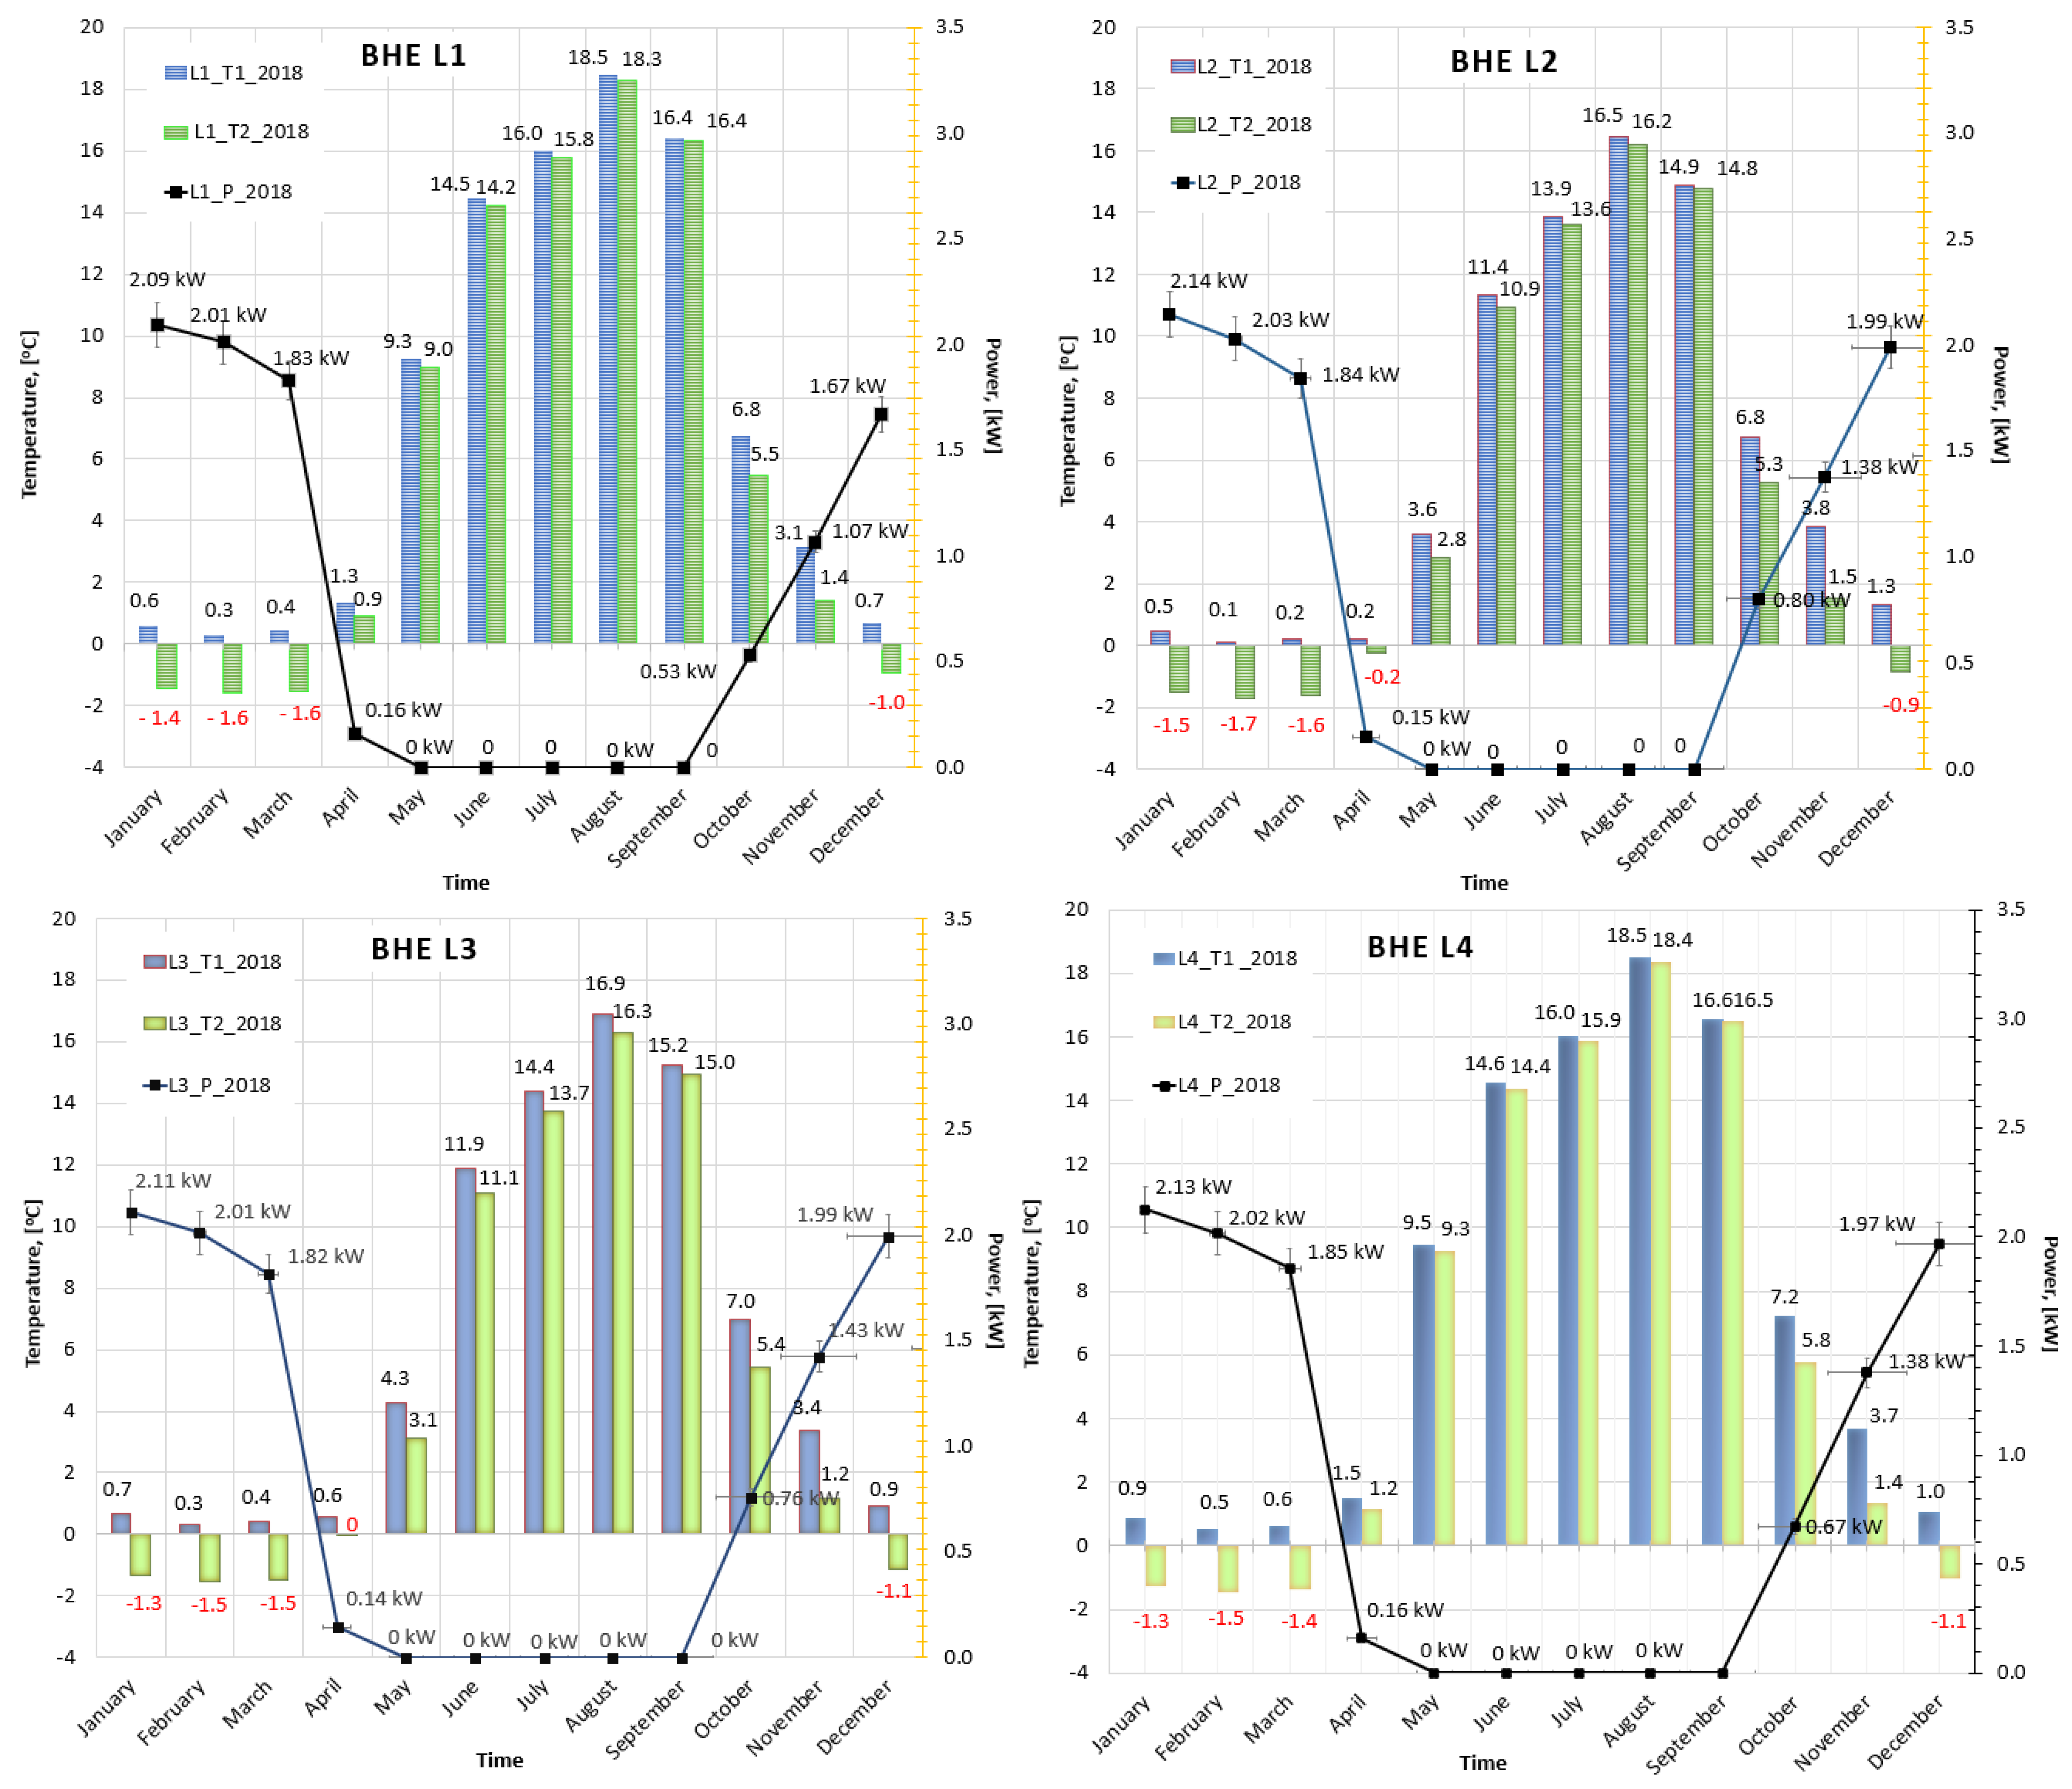
In 2018, the average daily unit heat flux extracted from the ground by the BHEs L1–L4 in the months of January–February was in the range of 15.6–23.4 W/m, and in March in the ranges of 11.3 W/m to 21.8 W/m. During this period, the unit heat flow extracted by the four BHEs was close to each other. After a well regeneration period lasting 173 days, in October–December, differences in energy consumption from the ground by individual BHEs can be noticed in Figure 2, which ranged from 3.7 W/m to 22.9 W/m.
The lowest average daily unit heat flux was consumed by L1 BHE, maximum 18.5 W/m, while BHEs L3 and L4 absorbed maximum from the ground 22.3–22.9 W/m at the same time. The amount of brine flowing through the BHE and the temperature difference between the temperature at the outlet and inlet to the BHE have an influence on the value of the unit heat flux.
In BHEs L1 and L4, the flows in November and December were very similar to each other. In November, the brine flow through BHE L1 ranged from 0.18 m3/h to 0.91 m3/h, on average 0.53 m3/h, and through BHE L4, ranged from 0.18 m3/h to 0.92 m3/h, on average 0.54 m3/h. On the other hand, BHEs L1 and L4 differed in the recorded brine temperature at the inlet and outlet of the exchanger. In BHE L1, the average temperature difference between the inlet and outlet temperature of the exchanger in October was 1.71 °C, and in BHE L4 it was 2.31 °C. This has a significant impact on the unit heat flux taken from the ground by the probe, and thus on the power of the entire borehole. In November, the average power of BHE L1 with a flow of 0.53 m3/h and ΔT = 2.27 °C was 1.07 kW, and of the L4 exchanger, with the same flow, but with a greater difference in brine temperatures ΔT = 2.52 °C, was 1.38 kW. Whereas in December, the average power of BHE L1 was 1.67 kW, with ΔT = 1.66 °C and average flow 0.80 m3/h, while for the L4 exchanger it was 1.97 kW, with ΔT = 2.09 °C and average flow 0.81 m3/h.
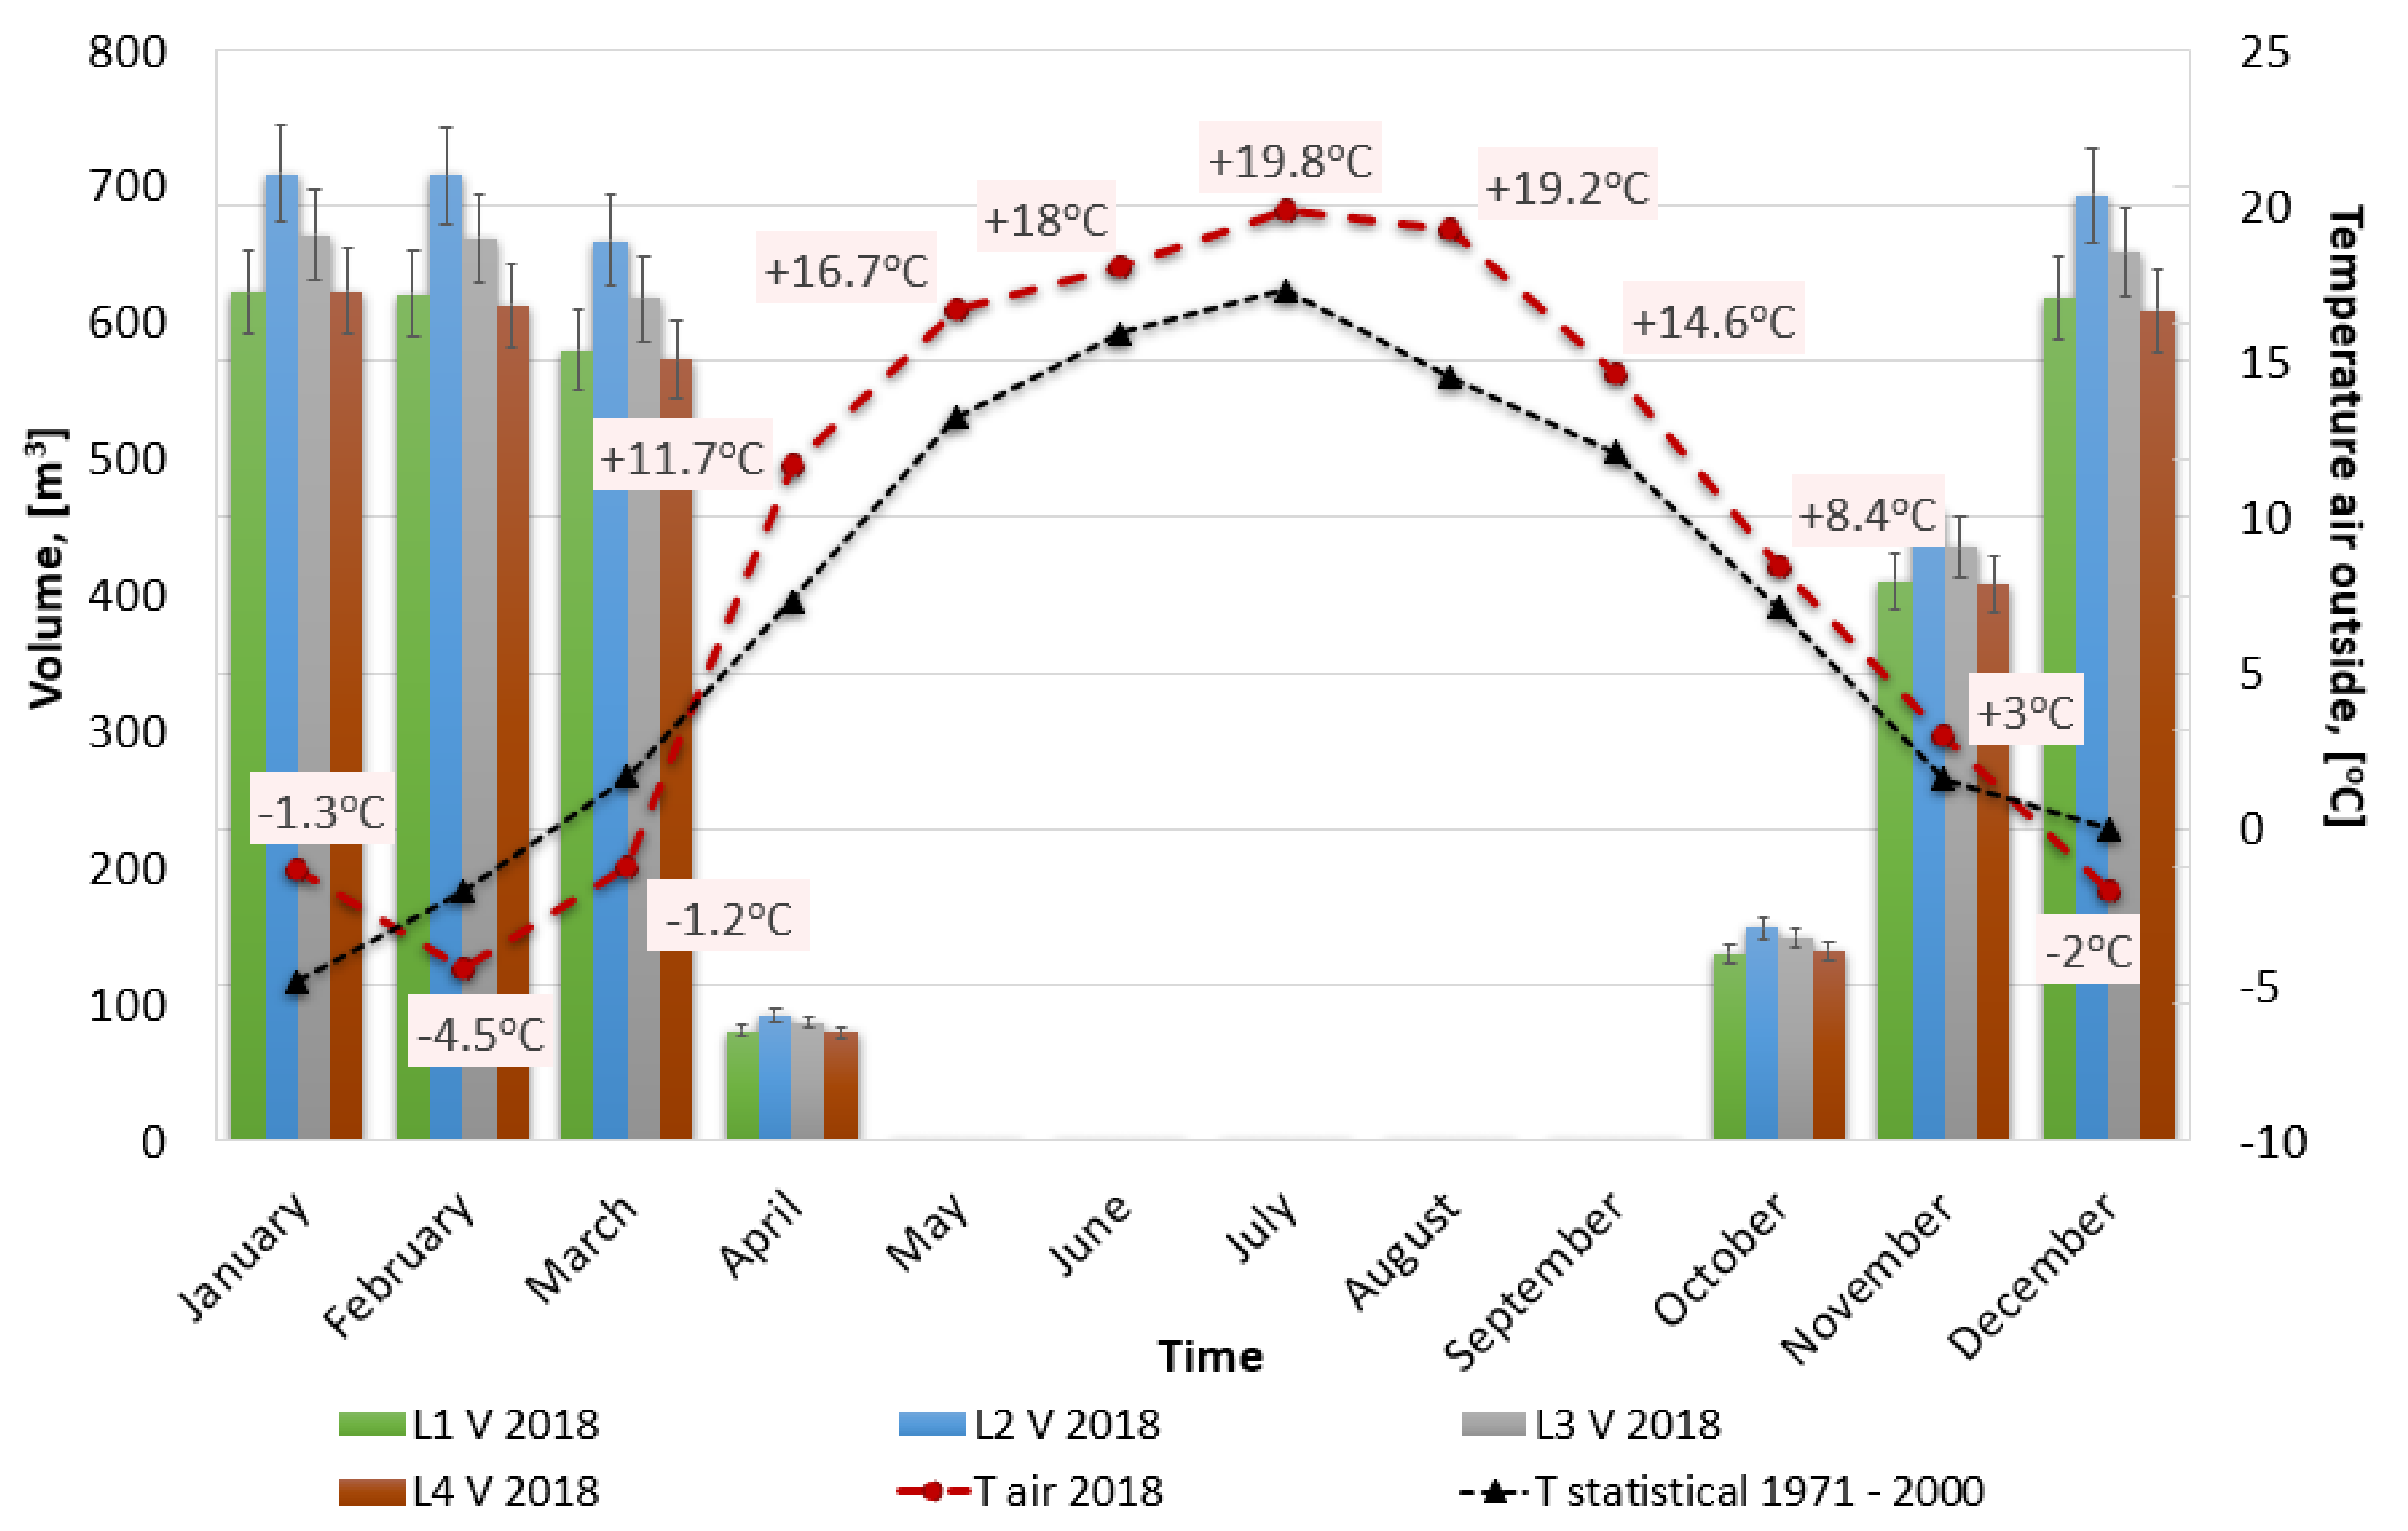
The flows through BHEs in 2018 differed, as shown in Figure 4. The annual brine flow through the L1 exchanger was 3069.64 m3, through L2 one was 3480.88 m3, through L3 one was 3265.18 m3, and through L4 one was 3043.57 m3. The difference between the BHE L4 with the lowest annual flow and the L2 one with the highest flow is 437.31 m3.
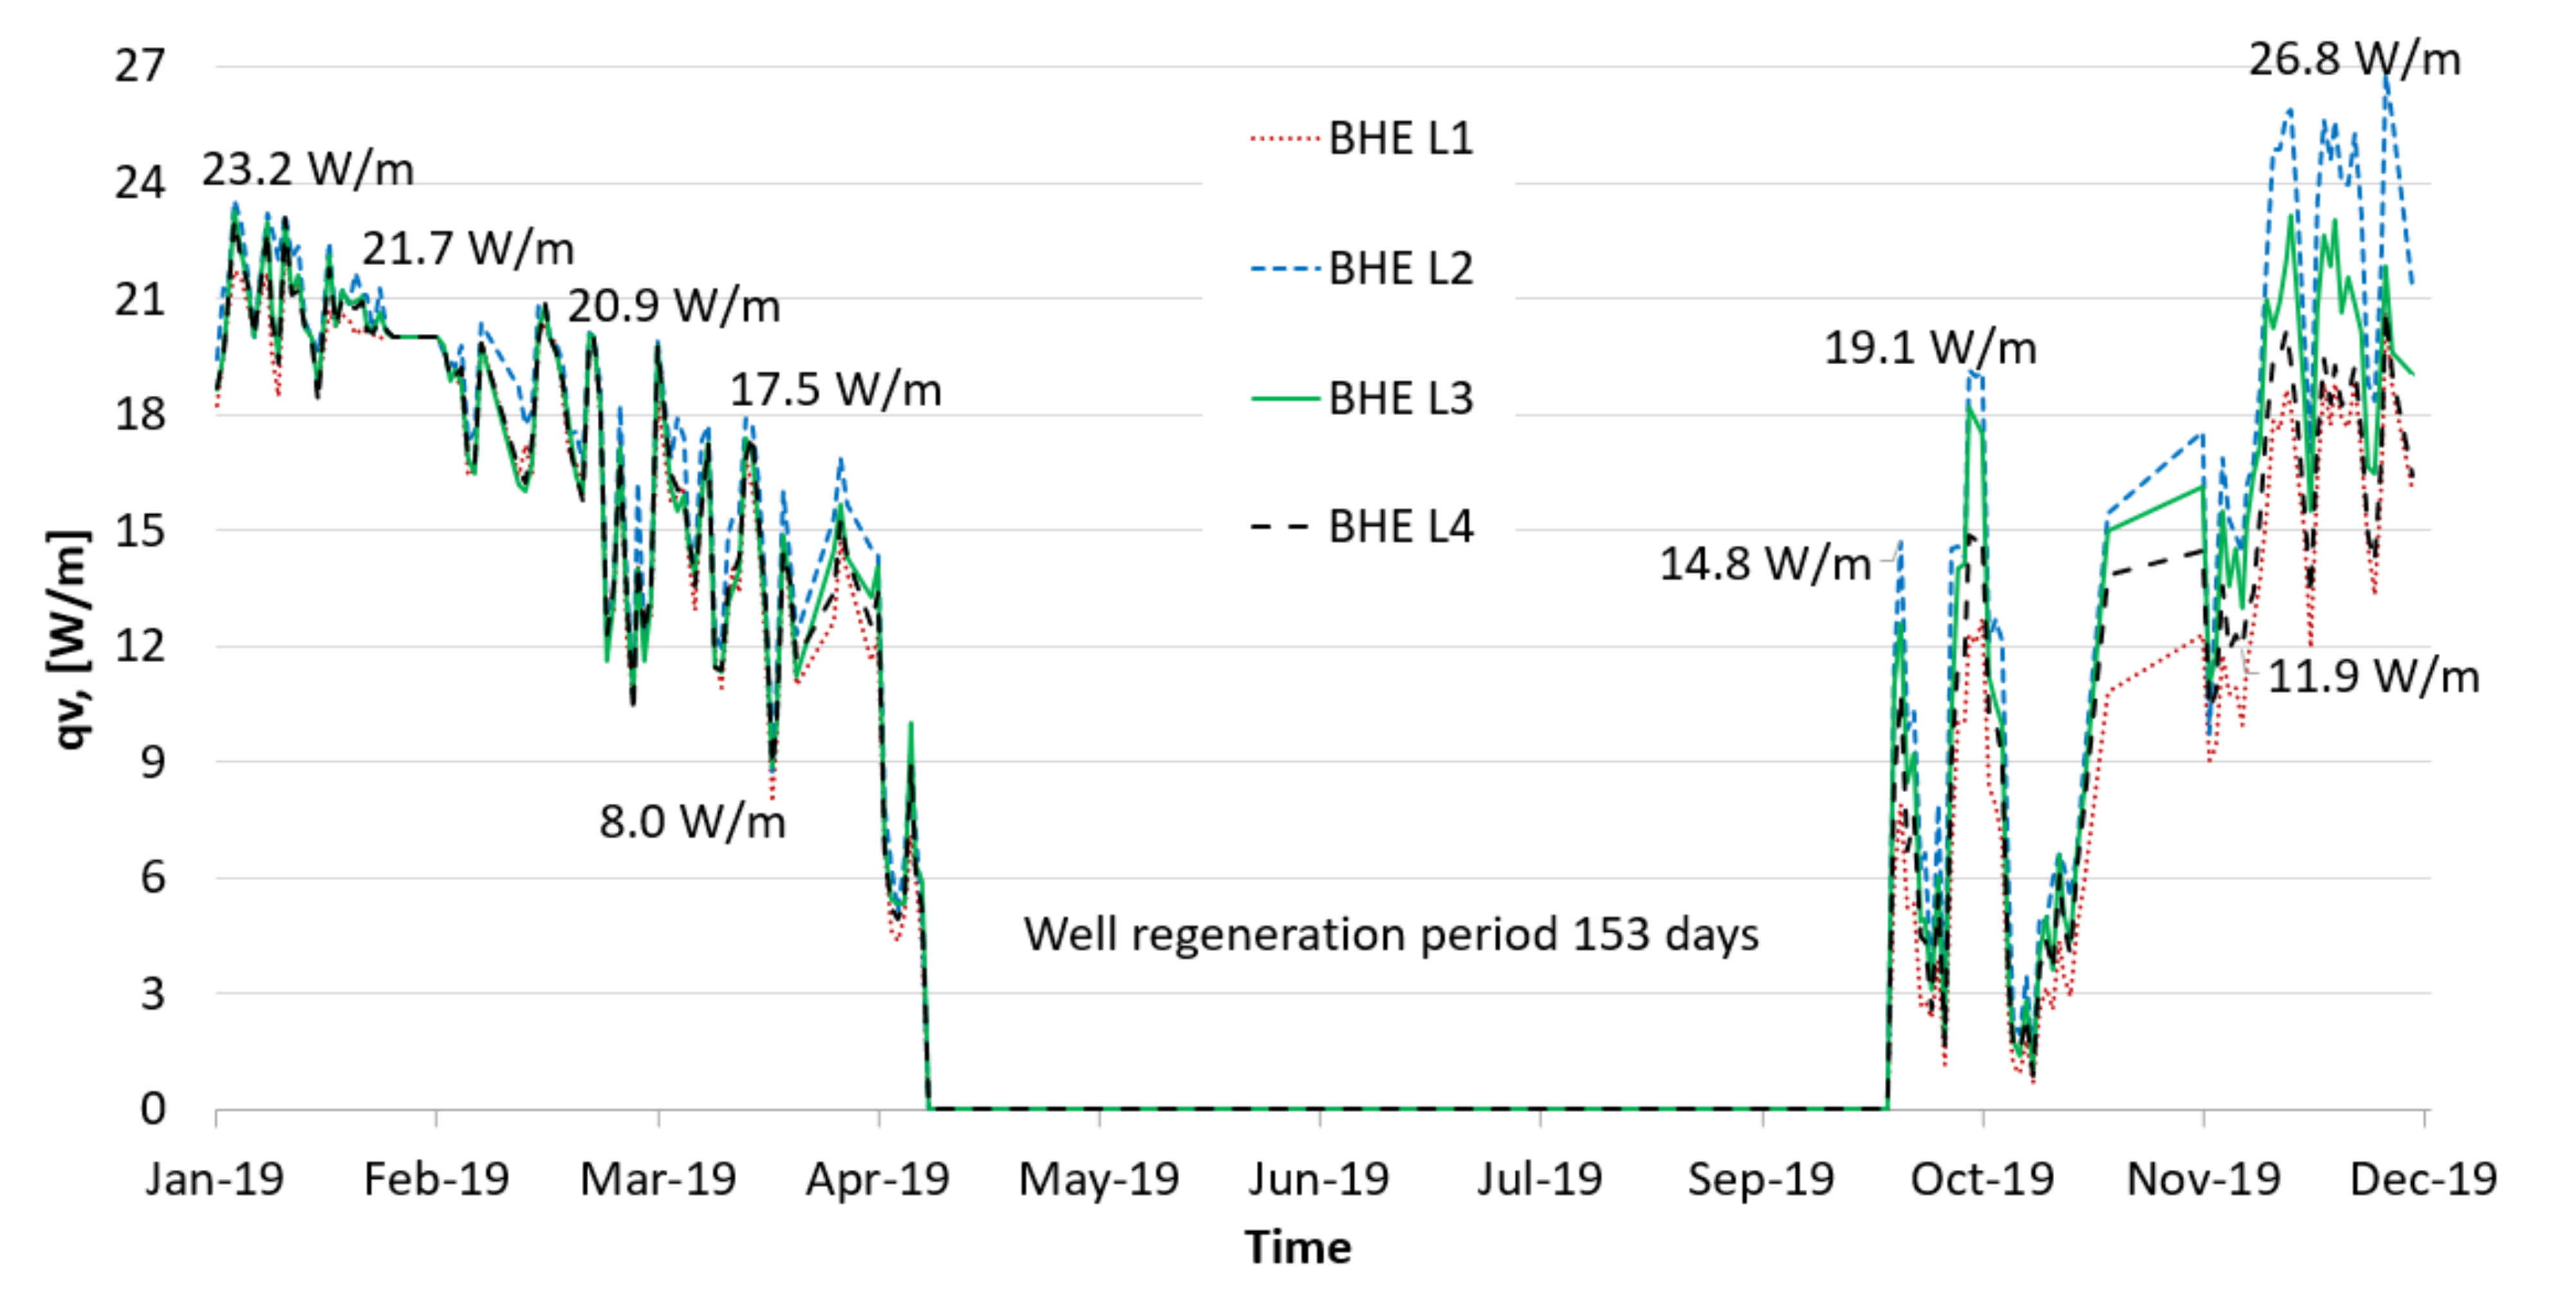
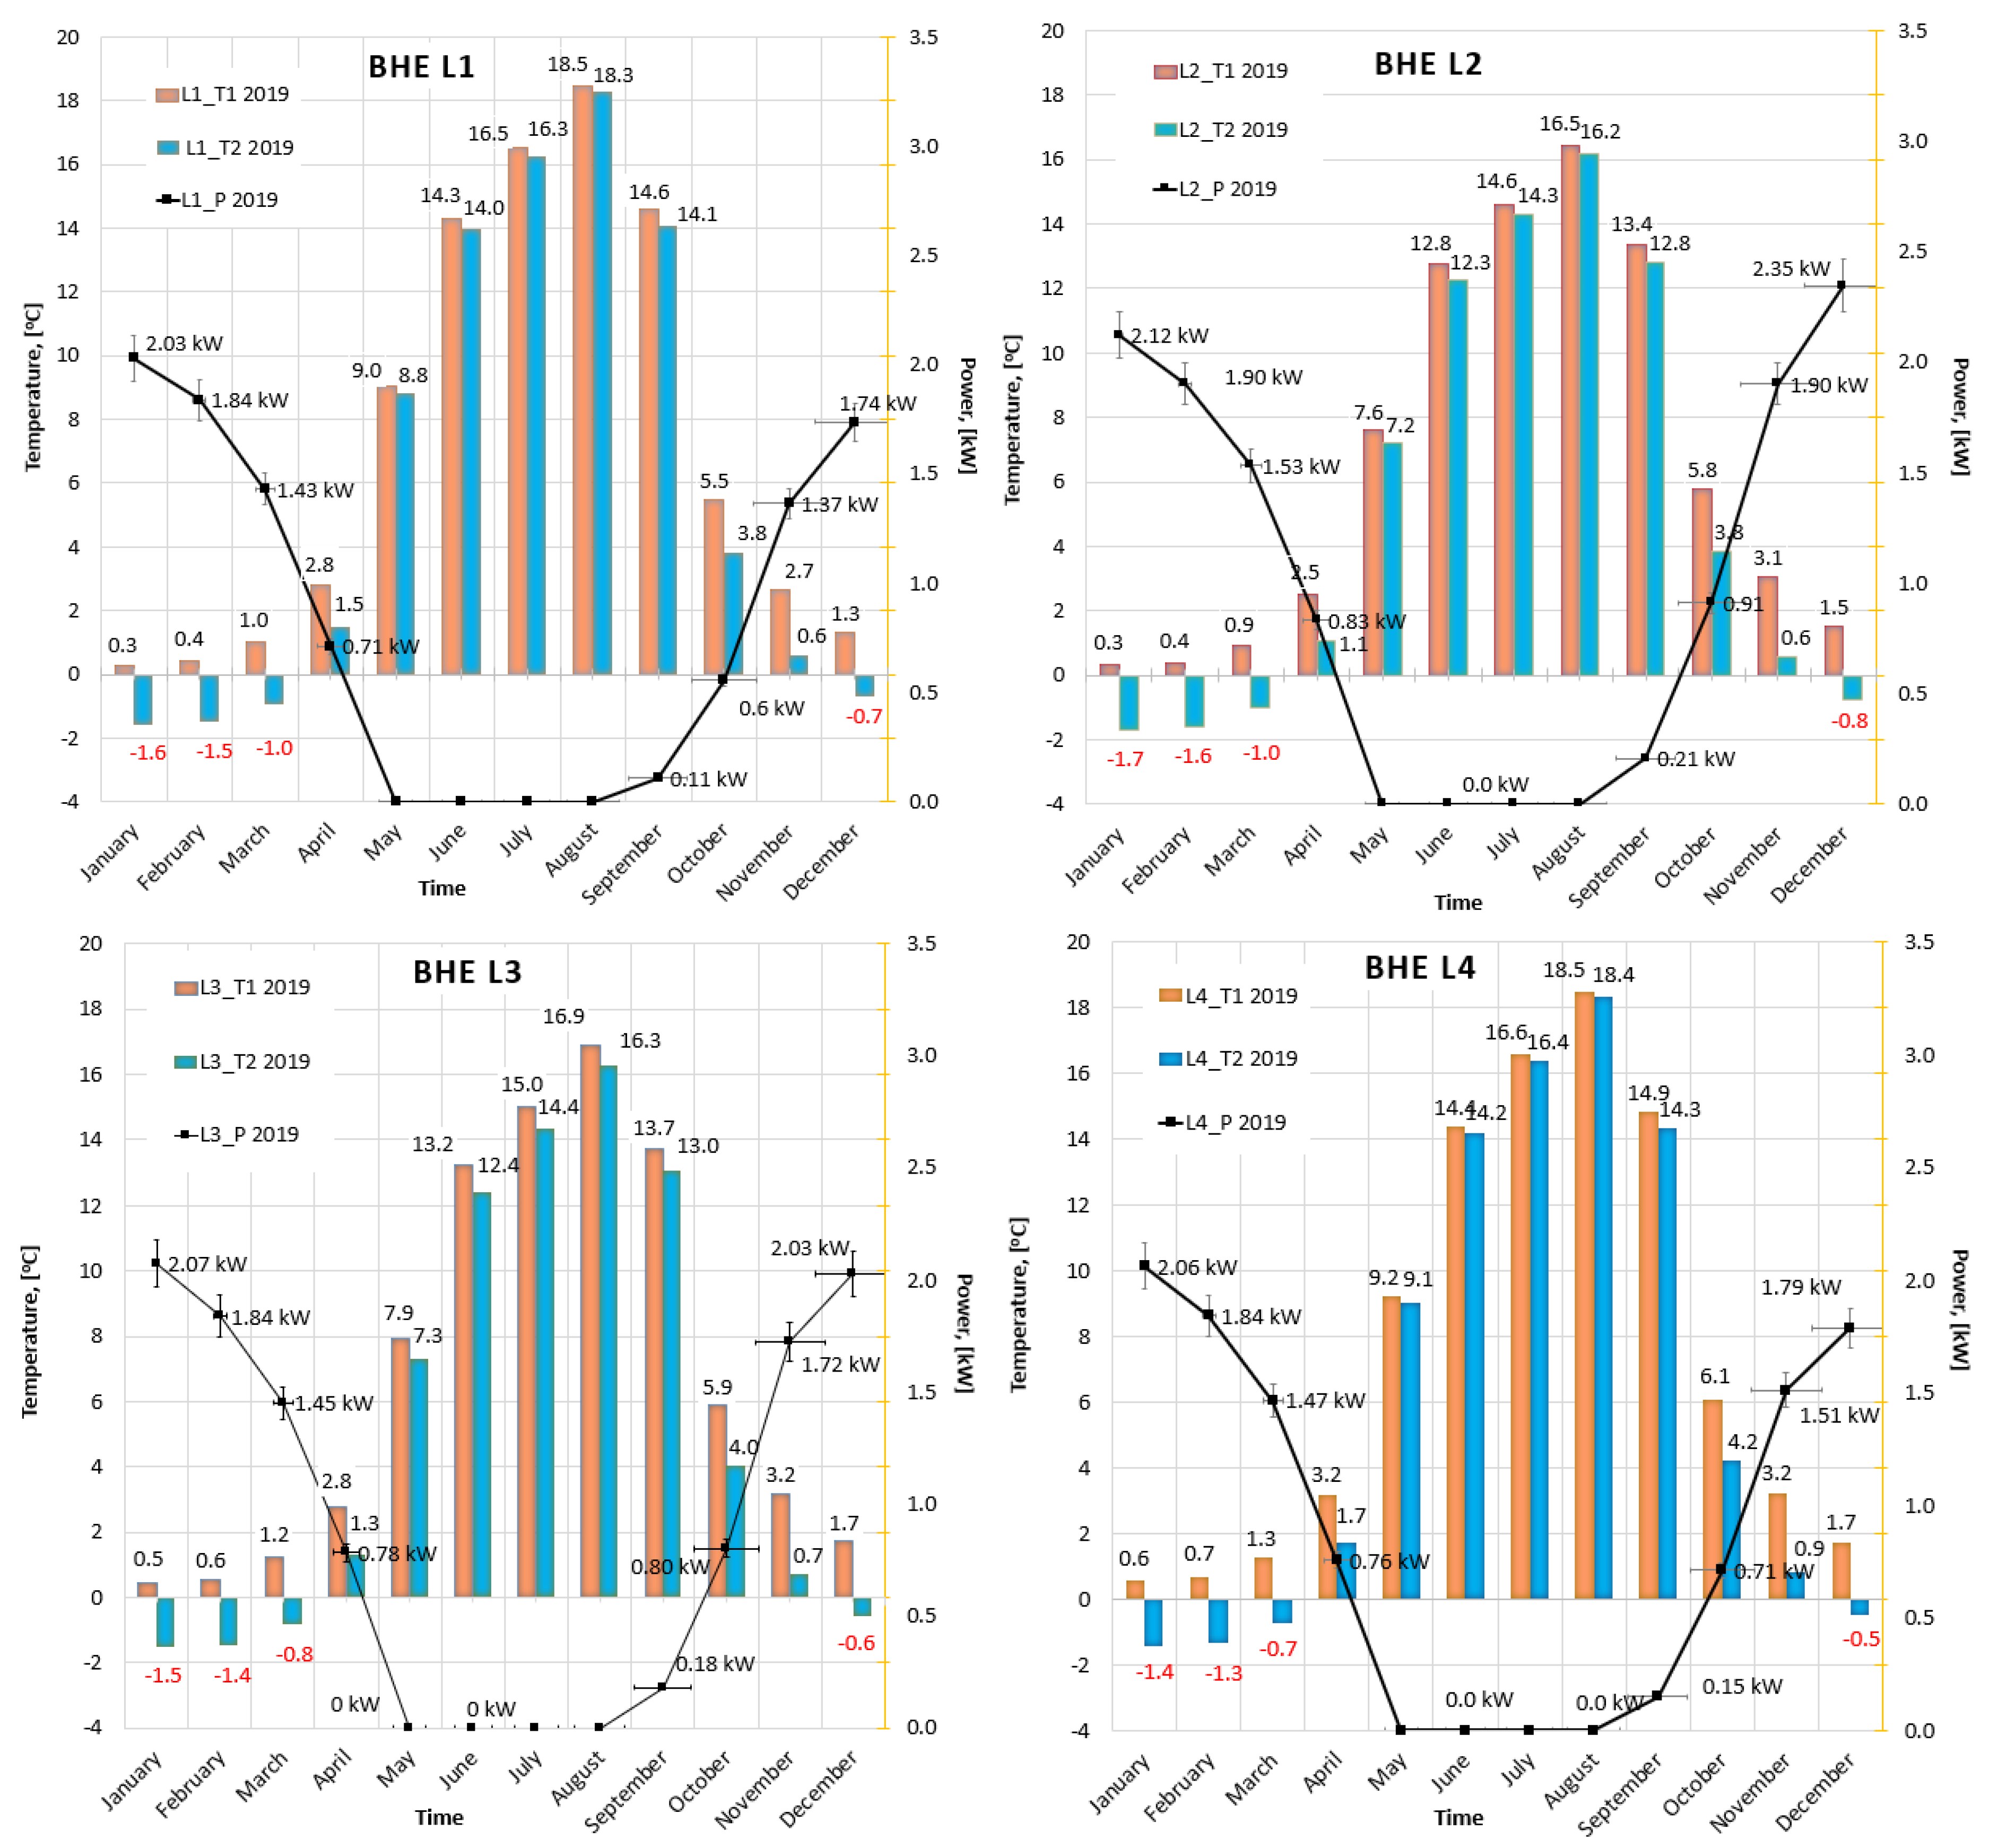
In 2019, the average daily unit heat flux from the ground by L1-L4 exchangers in January ranged from 18.3 W/m to 23.2 W/m, in February from 11.6 W/m to 20.9 W/m, and in March from 8 W/m to 17.5 W/m. Figure 3 shows differences in the thermal energy consumption by individual BHEs (after the recovery period of the boreholes), despite the fact that each of them has the same diameter of 40/3.7 mm and a length of 100 m. Average monthly power from the well in November: for BHE L1 it was 1.37 kW, i.e., the average unit heat flux from the ground was 13.7 W/m, for L2 one it was 1.90 kW, for L3 one it was 1.72 kW, and for L4 one it was 1.51 kW. The smallest heat flux from the ground in 2019 was taken by the exchanger L1, and the largest by L2 one, as shown in Figure 3.
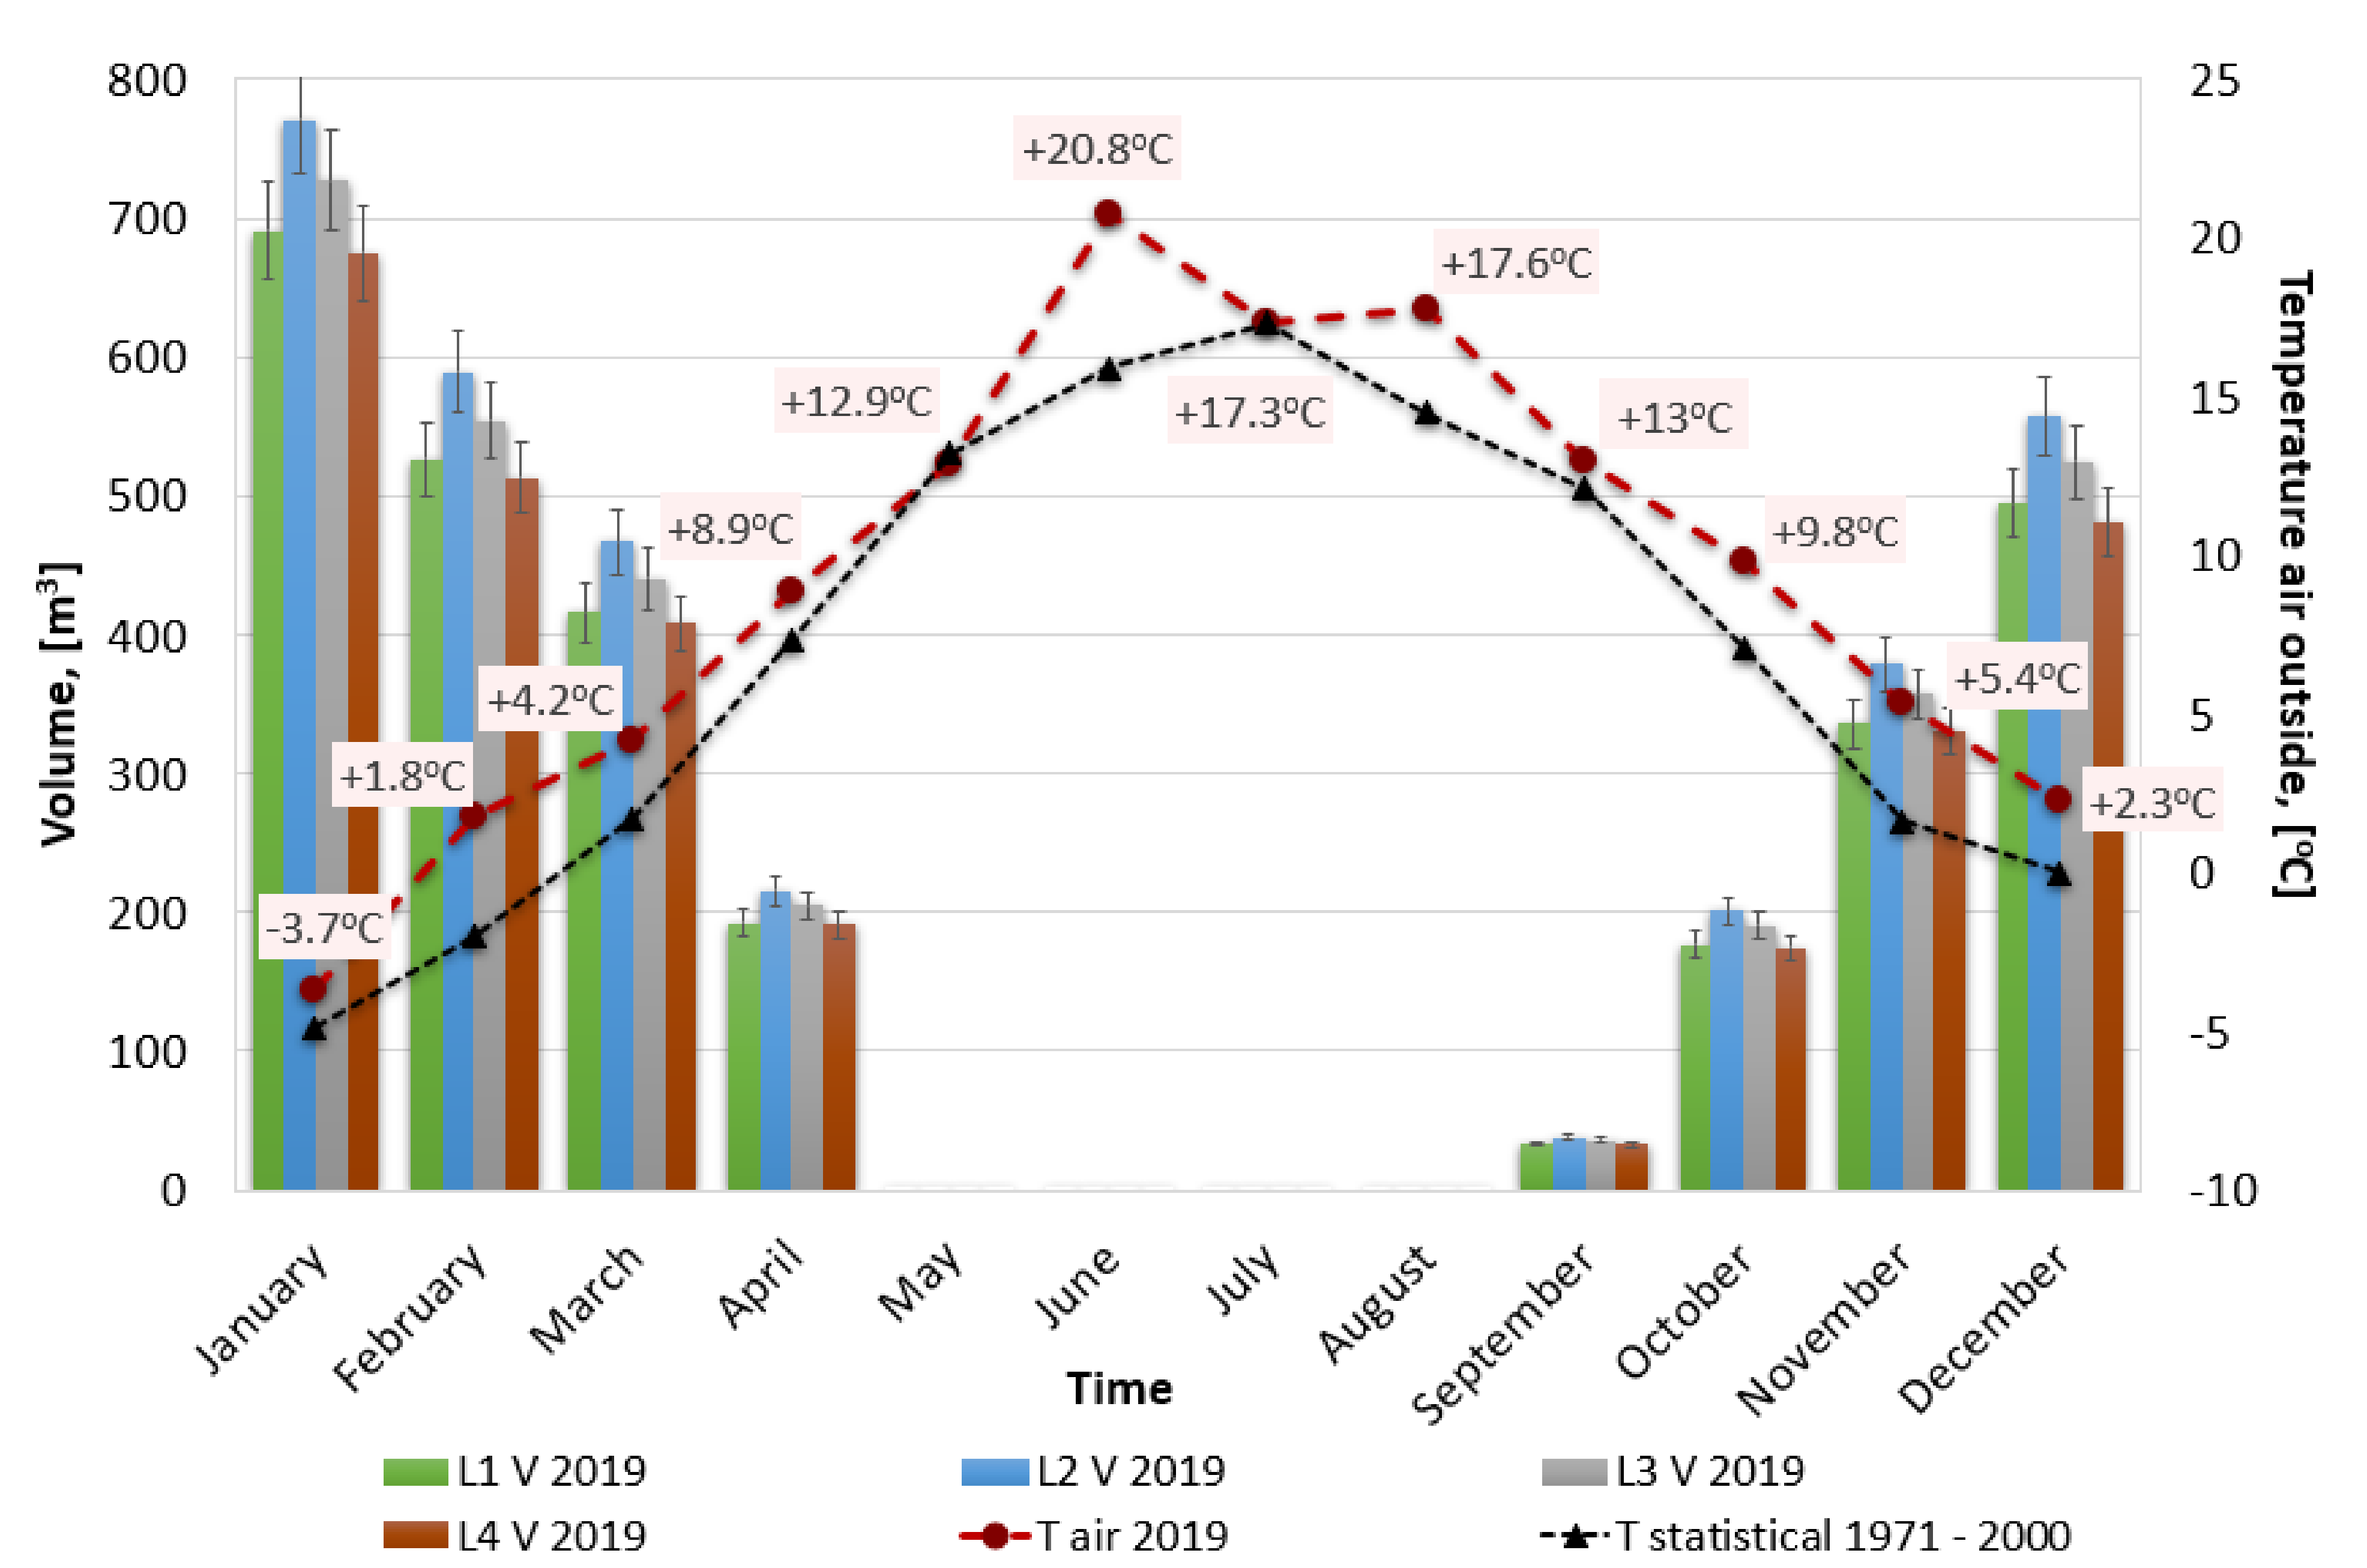
The brine flows through individual BHEs in 2019, as in 2018, differed from each other, as shown in Figure 5. The annual brine flow through the exchanger L1 was 2866.3 m3, through L2 one it was 3217.54 m3, through L3 one it was 3034.10 m3, and through L4 one was 2806.06 m3. The difference between the BHE L4 with the lowest annual flow and the L2 one with the highest flow is 411.48 m3. BHEs L1 and L4 have very similar flows, the difference between them is about 2%, but the L1 exchanger, with a higher brine flow, compared to the L4 one, takes less energy from the ground, which may indicate a greater exploitation of the L1 well or incomplete filling of the well around BHE.
Comparing the monthly brine flows in 2018 and 2019 (Figure 4 and Figure 5), significant differences in the amount of fluid flowing in the individual months of the year can be seen. In 2018, the total flow through the four BHEs in January was 2617.95 m3, in February it was 2603.39 m3, and in December it was 2572.14 m3. As can be seen, the amount of flowing brine is similar in 2018. The situation is different already in 2019, wherein January the amount of brine flowing through four BHEs was 2864.71 m3 in January, in February it was 2183.42 m3, and in December it was 2057.31 m3. The differentiation in the amount of brine flowing through the BHEs in individual months and years is related to the average outside temperature and the number of degree days in the heating season, as shown in Table 1. 2019 was warmer than 2018. The number of degree-days in the heating season in 2018 was 3254.1 day/(K∙year), while in 2019 it was 2917.3 day/(K∙year) and was lower than the number of multi-year degree-days of 3631.4 day/(K∙year).
Based on the conducted research, the actual thermal efficiency of the BHEs wells turned out to be lower than expected. The specific heat flux extracted from the ground determined on the basis of TRT tests is 35.4 W/m with compressors operating not exceeding 2000 h/year [70], both in 2018 and 2019, none of the tested BHEs achieved an average unit capacity of a well equal to 35.4 W/m (Figure 2 and Figure 3).
The differences in the results of thermal energy obtained from the ground by BHEs may probably be related to the adopted method of filling the holes around the annular space between the pipes of the ground exchanger and the well walls and the material used to fill the well. All 52 boreholes were filled from top to bottom, without the use of an injection pipe, with bentonite mixed with the excavated material. An inaccurately filled hole will not achieve the expected thermal performance due to a reduction in thermal conductivity in places where there is no filling. Thereby the effective working length of the well is reduced [76,77,78,79]. The boreholes should be filled with a sealing compound (e.g., bentonite) with very good thermal conductivity, which should be forced into the well by the bottom-up method [73], using a special pipe for injection of filling material.
Baumann [76] performed an inspection of the annular space filling around the well and it turned out that in 100 m of the well only less than 70 m of the bore was filled, the remaining lower part of the bore below 70 m was not filled. This was due to the wrong way of filling the borehole from top to bottom. Some researchers point out that the discrepancy between the TRT test results and the measured values may be caused by groundwater flow [78,80].
The example of the L1 probe shows the operational parameters recorded every 5 min in the period from 01/01/2018 to 31/01/2018: temperature at the inlet and outlet of the BHE, instantaneous brine flow, instantaneous heat exchanger power, which is presented in Figure 6.
Based on the measurements, it can be seen that the BHE power changes with the change of the brine flow rate and the recorded temperature at the inlet and outlet of the working exchanger. Although the daily maximum brine mass flow rate was almost constant from 03.01 until 21.01 and it was 0.95–0.96 m3/h, the BHE power changed significantly due to the temperature difference between the inlet and outlet of the working exchanger. The BHE instantaneous power was 1.57–2.43 kW. The value of the actual power obtained from the exchanger is also influenced by the average length of the heat pump operation cycle and the intervals between its cycles. In the second half of January 2018, one BHE instantaneous power measurement of 3.18 kW was recorded.
Comparing the three charts with each other, it can be seen that the BHE instantaneous power is closely related to the flow rate and the difference in brine temperatures. Any changes in the flow and its fluctuations also change other parameters, which is visible at the very beginning of the month (1.01–3.01) and at the end of the month (22.01–31.01).
For the remaining BHEs, analogous measurements of operating parameters were carried out throughout 2018 and 2019, recorded every 5 min.
During the heating season, as a result of changes in the heating energy demand of the building, the temperature of the lower heat source changed, which had an impact, as shown in Figure 7 and Figure 8, on the obtained operational thermal power of the wells. It was related to the collection of heat from the ground by the working medium flowing in the BHE during the operation of heat pumps. On the other hand, during the period when heat pumps are shut down, an increase in brine temperature in the borehole is noticeable, it can be seen in the above-mentioned figures. The inlet and outlet brine temperature measured at the top of the BHE shows a strong relationship with the outside temperature. In the period from May to August 2018, the wells began their regeneration.
Figure 7 shows the average operating monthly borehole power and the average monthly temperatures of the measured brine at the outlet and inlet of the BHE in 2018.
The average operational power of 100 m of a well in the coldest months of 2018 was: in January-2.09 kW in the L1 well, 2.14 kW in the L2 well, 2.11 kW in the L3 well, 2.13 kW in the L4 well; in February, L1-2.01 kW, L2-2.03 kW, L3-1.82 kW, L4-1.85 kW; in December, the well L1-1.67 kW, the well L2-1.99 kW, the well L3-1.99 kW, and the well L4-1.97 kW.
The working time of the compressors in 2018 exceeded the recommended 2000 h/year. In 2018, the working time of the compressors in the MASTER heat pump was 3143 h, and in the SLAVE pump 2827 h. In the first heat pump it was longer by 57%, and in the second by 41% than the recommended compressor operation time of 2000 h/year, at which time it was specific borehole power of 3.54 kW. With this assumption, the number of boreholes and the size of the lower heat source were determined. 52 boreholes have been designed, 100 m deep, each with a power of 3.54 kW. The total design power of the heat source according to the design documentation [70] was 184 kW.
Figure 8 shows the average operating monthly borehole power and the average monthly temperatures of the measured brine at the outlet and inlet of the BHE in 2019.
The average operational power of 100 m of a well in the coldest months of 2019 was: January L1-2.03 kW, L2-2.12 kW, L3-2.07 kW, L4-2.06 kW; in February-well L1-1.84 kW, well L2-1.90 kW, well L3-1.84 kW, and well L4-1.84 kW; in December-well L1-1.74 kW, well L2-2.35 kW, well L3-2.03 kW, and well L4-1.79 kW. Also in 2019, the operating time of the compressors exceeded the recommended 2000 h/year, similar to 2018. In the MASTER heat pump, the compressor operation time in 2019 was 2831 h, and in the SLAVE one 2467 h. In the first heat pump it was 41% longer, and in the second by 23% than the recommended compressor operation time of 2000 h per year.
Too much load of the lower heat source causes a significant reduction of the brine temperature in the boreholes [80]. According to the design guidelines [73], the monthly average brine supply and return temperature should not be lower than (−1.5) °C. The operation of the well at such a low, negative average brine temperature and continuous consumption of thermal energy from the ground may lead to excessive cooling of the well itself and the area around it and an increase in the frequency of freezing and thawing cycles of the sealing material [73]. In the heating season of 2018 and 2019, the average monthly brine temperature at the inlet and outlet of the BHE was analyzed. Based on the recorded temperatures, it can be assumed that the wells were overexploited. In the four tested BHEs, the average monthly brine temperature at the inlet and outlet of the exchanger in the months from January to March in 2018 reached negative temperatures ranging from (−0.21) °C to (−0.8) °C, with the lowest temperatures in the L2 well, and the highest in L4 one, which may indicate uneven operation of BHEs. In April 2018, only the L2 exchanger had a negative average brine temperature. It was similar in 2019, where the recorded average brine temperatures in the months from January to March reached negative temperatures ranging from 0 °C to (−0.7) °C and were also the lowest in BHE L2 and the highest in L4 one.
In the BHEs tested in 2018–2019, no average monthly brine temperature between the inlet and the outlet from the exchanger lower than (−1.5) °C was recorded. From 18/01/2018 to 9/03/2018, the average daily temperature below (−1.5) °C was also not recorded. The lowest daily averaged brine temperature ranged from (−1.1) °C to (−1.2) °C.
Figure 9 shows the view of three BHEs with different flows set on the rotameters, hydraulic fine adjustment of individual geothermal probes not performed. The differentiation in the flows through the probes is visible in the amount of brine flowing through the exchangers (Figure 4 and Figure 5), recorded brine temperatures (Figure 7 and Figure 8), or in the power of the wells themselves (Figure 2, Figure 3, Figure 7 and Figure 8).
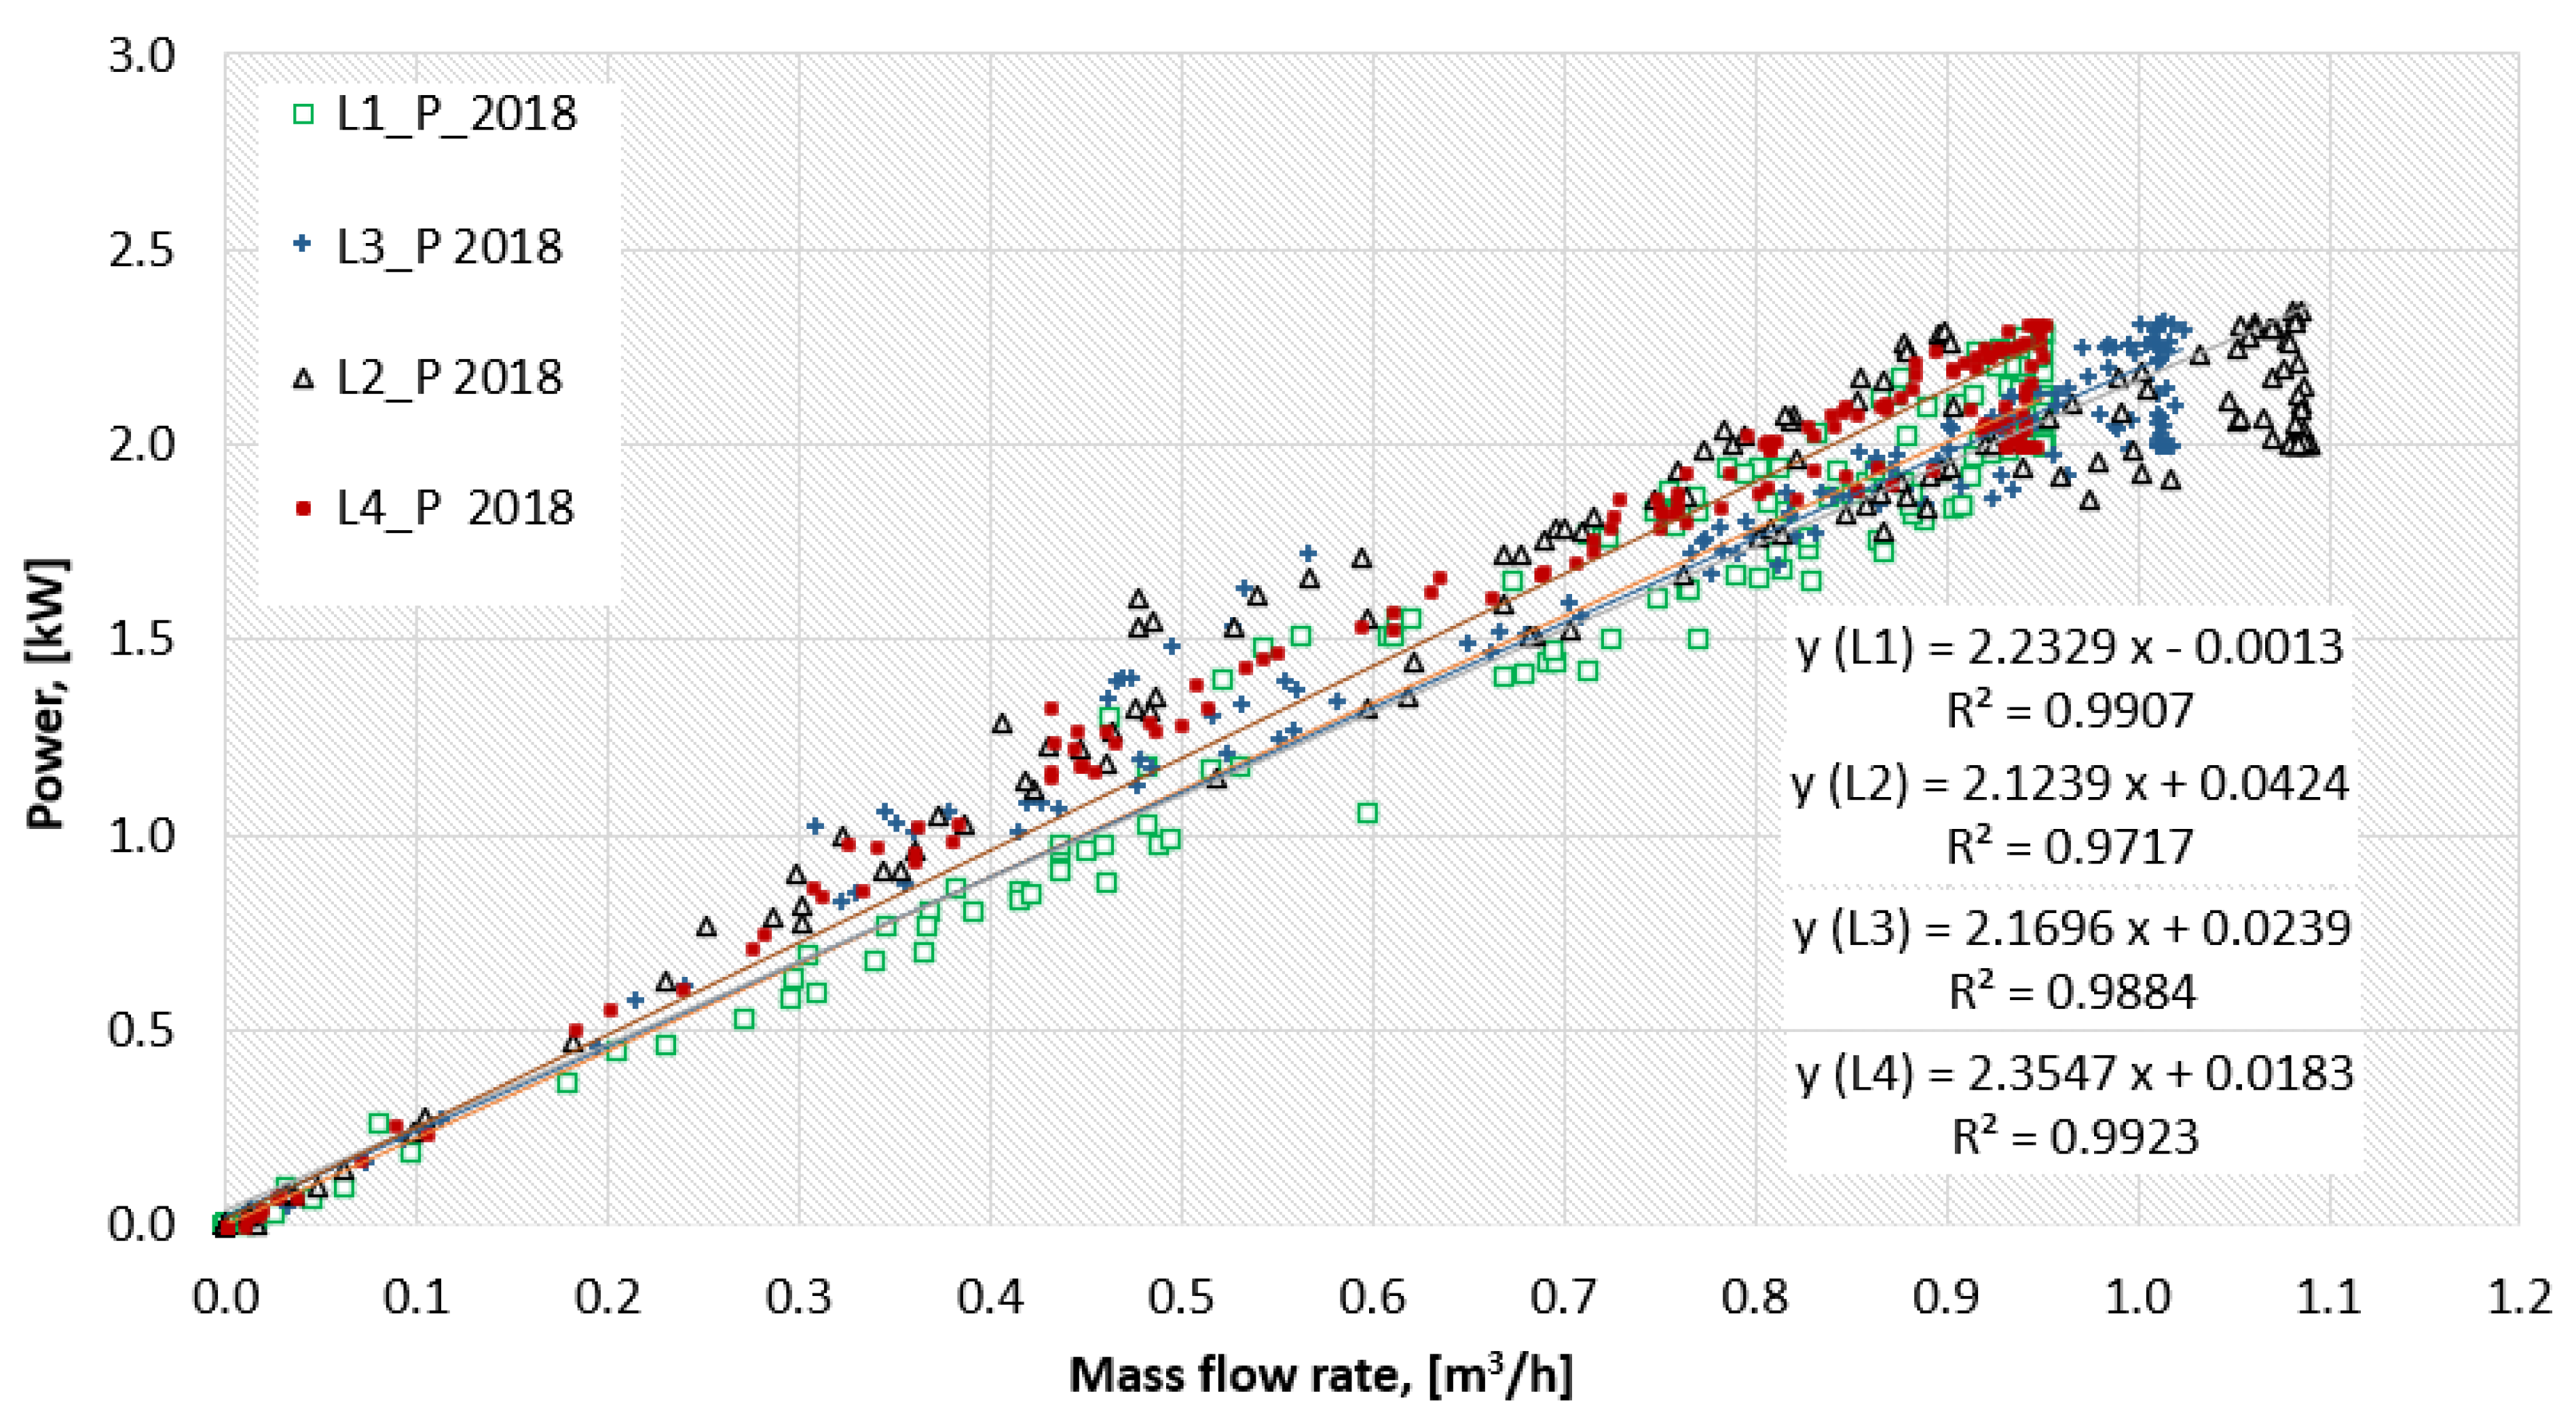
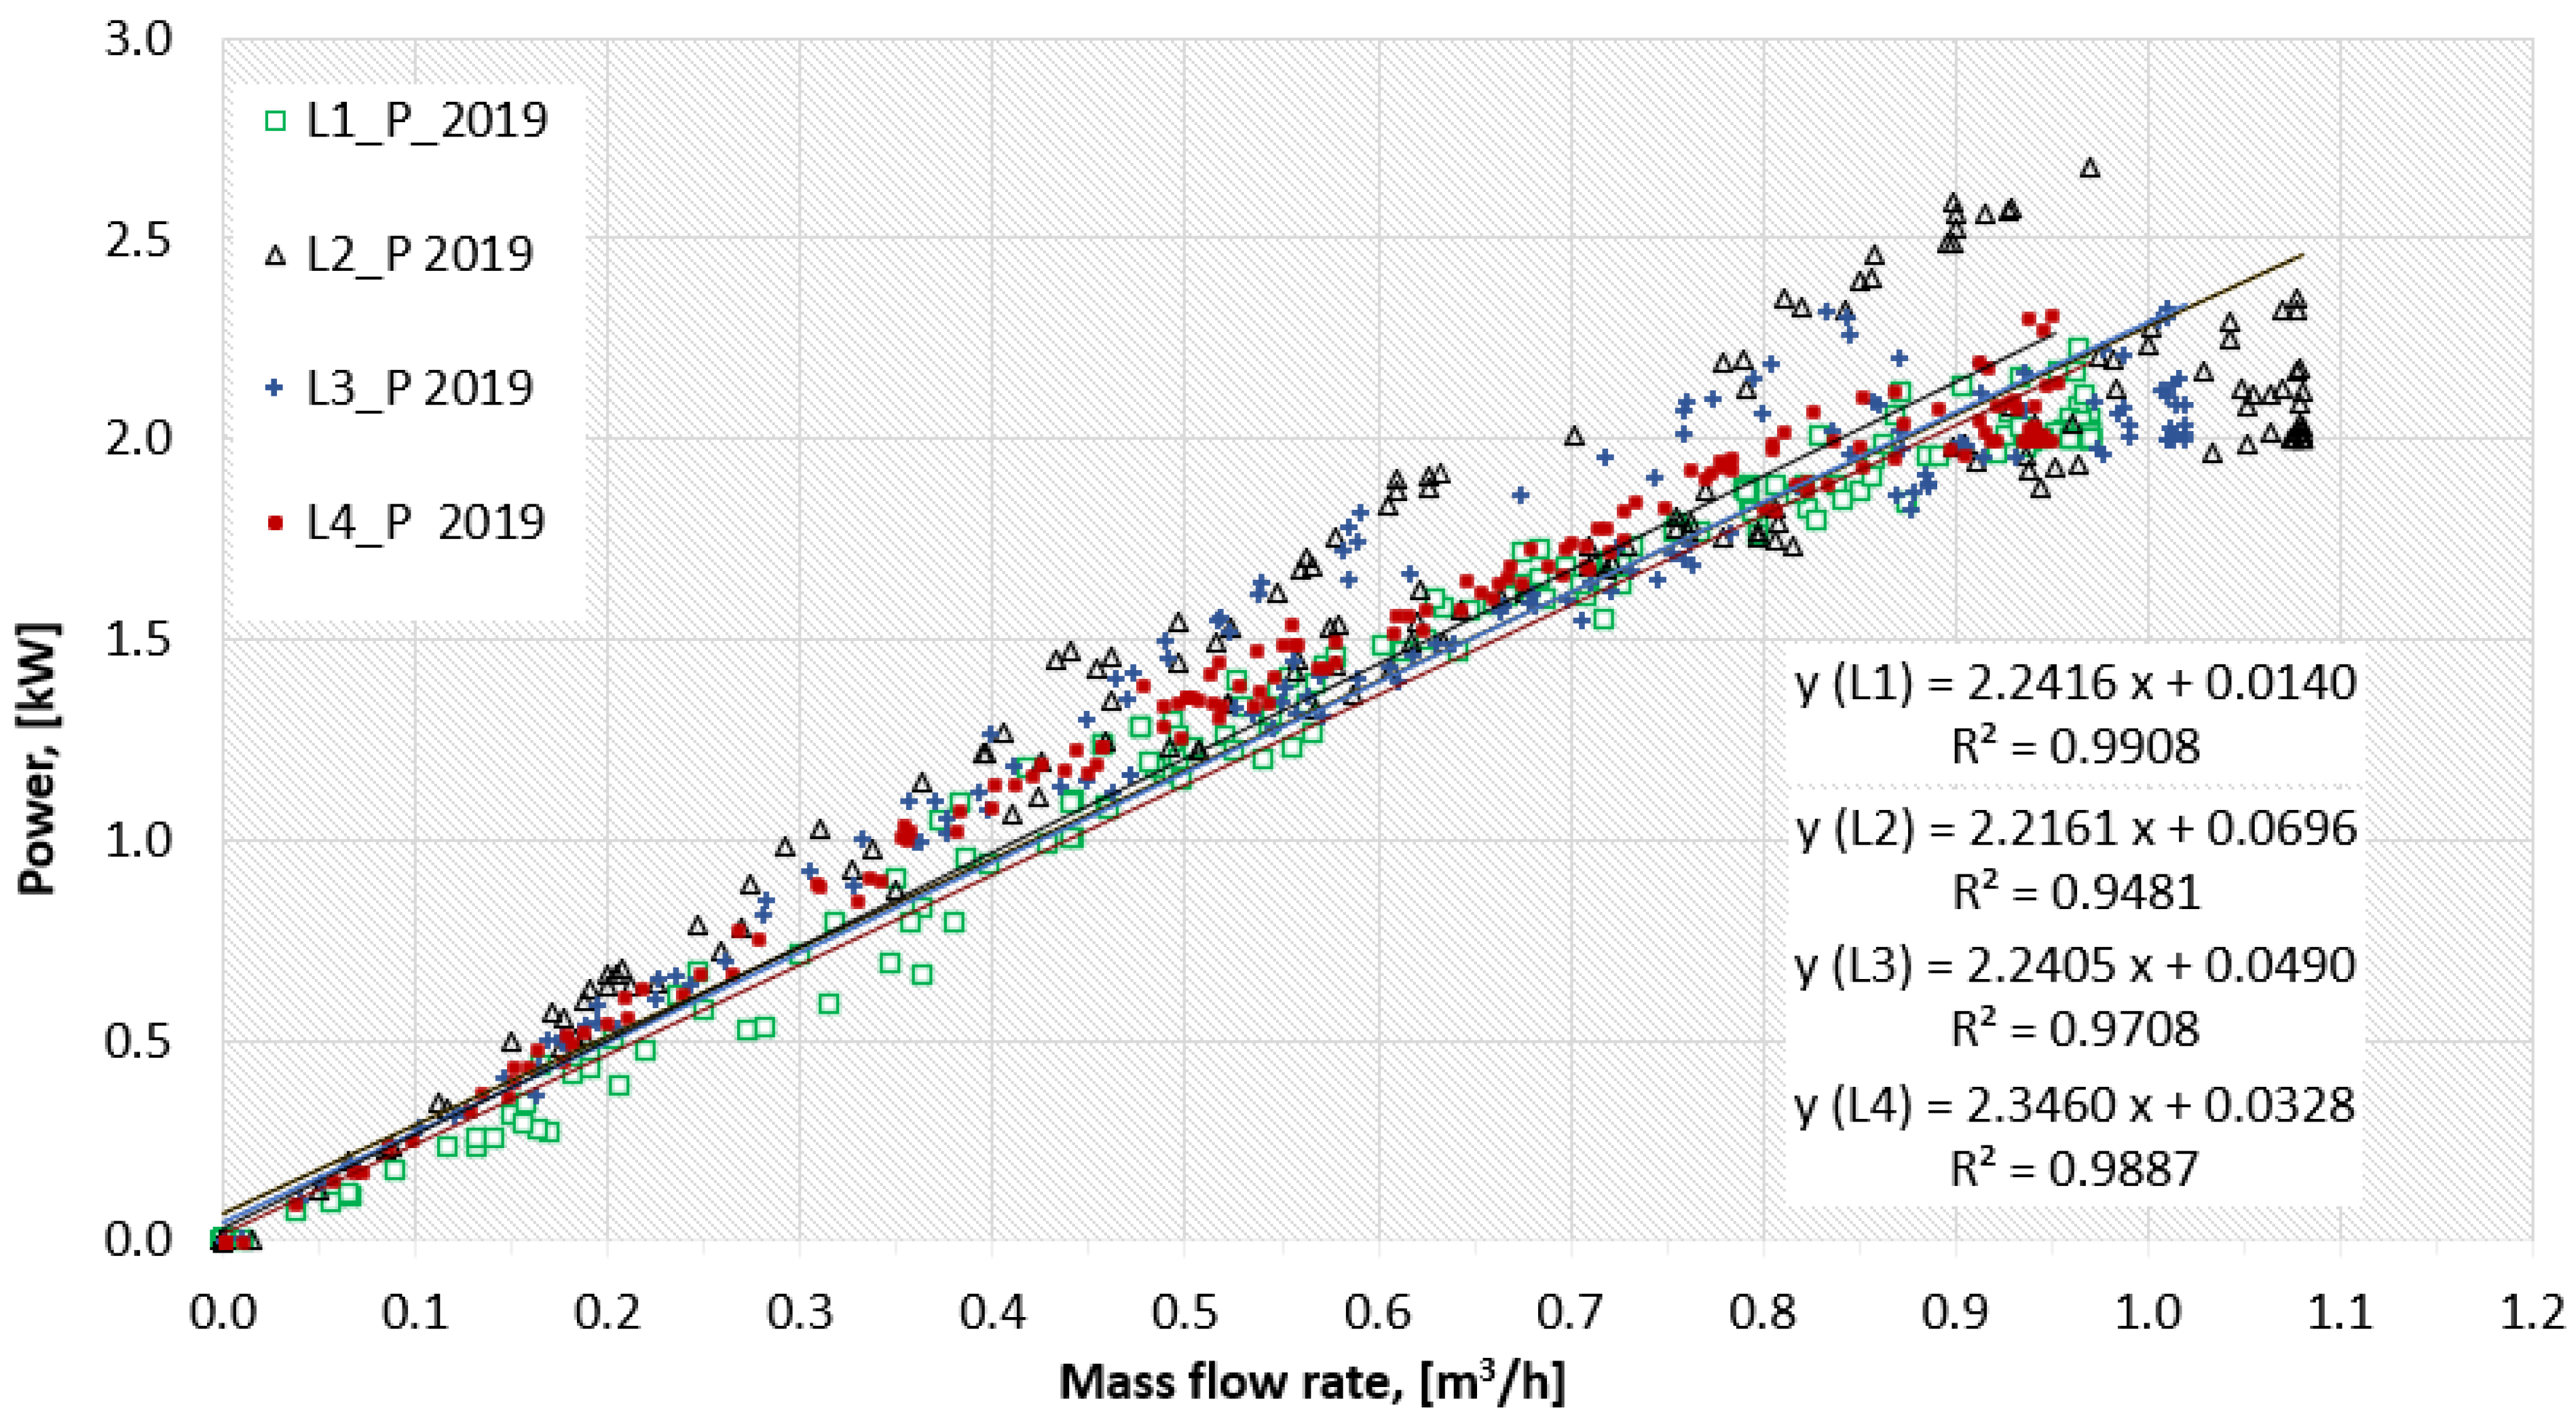
Figure 10 and Figure 11 show the dependence of the borehole power on the amount of flowing brine in the heating season in 2018–2019 in BHEs L1–L4. Research shows that at the same mass brine flow rates, we can achieve different values of the maximum BHE power, which is related to the difference in brine temperatures at the inlet and outlet of individual exchangers. On the basis of the conducted research, it can be seen that not only the amount of flowing brine is important, but also the speed at which the brine flows through the exchanger and the brine temperature obtained in this way at the inlet and outlet of the BHE. The temperature difference here has a significant impact on the power of the entire BHE.
According to the assumed design requirements [70], the brine flow rate in each BHE should be 0.852 m3/h, with the temperature difference in the brine circuit being maintained at ΔT = 4 °C. However, the actual measured temperature difference in the brine circuit is ΔT = 1.4 ÷ 2.9 °C, on average ΔT = 2 °C. A more precise hydraulic adjustment of the installation and an increase in the temperature difference between the supply and return of the brine circuit would allow higher BHE outputs.
The amount of annual energy absorbed from the ground by individual BHEs along with the annual brine flow through the exchangers is presented in Table 5. In 2018 and 2019, the lowest thermal energy was extracted from the ground by BHE L1 and the highest by L2 one.
The unit amount of heat extracted from the ground in real conditions in 2018 by BHEs is: well L1-70.37 kWh/(m∙year), well L2-83.12 kWh/(m∙year), well L3-77.62 kWh/(m∙year), and well L4-75.40 kWh/(m∙year), with a compressor operating time of 3143 h in the MASTER heat pump, and 2827 h in the SLAVE heat pump. In turn, the unit amount of heat extracted from the ground in real conditions in 2019 by BHEs is: well L1-65.34 kWh/(m∙year), well L2-82.89 kWh/(m∙year), well L3-76.78 kWh/(m∙year), well L4-71.64 kWh/(m∙year), with a compressor operating time of 2831 h in the MASTER heat pump, and 2467 h in the SLAVE heat pump. According to the design guidelines [72], the unit amount of heat collected from the ground at λ = 1.76 W/(m∙K) ± 0.03 W/(m∙K) [70] and the operating time of heat pump compressors up to 2000 h should not exceed 78 kWh/(m∙year).
In the analyzed period, the unit amount of heat extracted from the ground in real conditions did not exceed 78 kWh/(m∙year), except for BHE L2, where energy consumption in 2018–2019 was higher by about 6%, while the compressor operation time in both seasons heating systems was much longer than the recommended 2000 h/year. It is a very disturbing phenomenon during the operation of the lower heat source and may indicate insufficient BHEs power. In this case, the longer operation time of heat pump compressors, over 2000 h per year, increases the operation of the ground heat source and may have a negative impact on the operation of all BHEs.
Additionally, maintaining the uneven exploitation of the wells for a longer period of time may lead to exploitation, freezing, and, as a result, to an earlier “shutdown” of the excessively loaded well from work. The process of ground regeneration around the overexploited well will also differ from the others, as shown in Figure 7 and Figure 8, and in subsequent years may lead to its incomplete regeneration in the spring and summer period. At the design stage, if the operating time of compressors in heat pumps is assumed to exceed 2000 h/year, the length of the lower heat source heat exchanger increases due to the thermal regeneration of the ground [73]. In this case, when designing the lower heat source, the operating time of the compressors was assumed to be 2000 h/year, which turned out to be an insufficient assumption in operating conditions.

4. Conclusions

On the basis of operational tests, the obtained results show that during their operation, both in 2018 and 2019, the BHEs with a depth of 100 m did not reach the designated maximum power of a single exchanger of about 3.54 kW, determined during preliminary soil tests using the TRT test. With the assumed drilling capacity, the unit amount of heat taken from the ground should not exceed 78 kWh/(m∙year), with the compressor operation time up to 2000 h/year.
The unit amount of heat extracted from the ground by BHEs L1-L4 in real conditions in 2018 ranged from 70.37 kWh/(m∙year) to 83.12 kWh/(m∙year), and in 2019 from 65.34 kWh/(m∙year) to 82.89 kWh/(m∙year), but it was at the expense of longer compressor operation time. The working time of the compressors in 2018 in the Master heat pump was longer by 57%, and in the Slave heat pump by 41%, and in 2019 in the Master heat pump it was 41% longer, and in the Slave by 23%, than the recommended compressor operation time of 2000 h/year. The difference in the operation time of the compressors in 2018–2019 resulted from the different temperatures of the outside air. The average annual measured outside temperature in 2019 was 9.2 °C and was higher than the temperature in 2018, which was 8.7 °C. Longer operation time of the compressors reduces the temperature of the heat source.
Based on the experimental measurements, it can be seen that TRT tests should be performed not only before the execution of the heat source, but also after its execution at several control points, especially when the area covered by the boreholes is extensive, as in this case. The boreholes should be checked for correctness and reliability of filling the annular space between the pipes and the walls of the borehole. Incorrectly performed filling may cause the BHE to fail to achieve the required thermal performance due to a reduction in thermal conductivity in the unfilled areas, which in practice translates into a shorter working length of the well and a lower thermal power of the well. Leaving spaces around the exchanger may also pose a risk of water contamination in underground aquifers. The data obtained in real conditions is valuable in the research and development of the BHE system, in particular in simulation and numerical calculations. These tests will contribute to the verification of the calculations of the lower heat sources in the period of their longer operation, it will be possible to determine the correctness of their operation in 10 or 20 years with greater probability.

Funding

This work was performed within the framework of grants of the Bialystok University of Technology (WZ/WBiIS/4/2020) and financed by the Ministry of Science and Higher Education of the Republic of Poland, co-funded by the European Union through the European Regional Development Fund under the Programme Infrastructure and Environment.

Data Availability Statement

The data presented in this study are available on request from the corresponding author.

Conflicts of Interest

The author declare no conflict of interest.

References

  1. European Parliament. European Parliament Resolution of 15 January 2020 on the European Green Deal 2019, 2956 (RSP). Available online: https://www.europarl.europa.eu/doceo/document/TA-9-2020-0005_EN.%20html (accessed on 10 March 2021).
  2. European Parliament. European Parliament resolution of 14 March 2019 on Climate Change-A European Strategic Long-Term Vision for a Prosperous, Modern, Competitive and Climate Neutral Economy in Accordance with the Paris Agreement 2019, 2582(RSP). Available online: https://www.europarl.europa.eu/%20doceo/document/TA-8-2019-0217_EN.html (accessed on 9 March 2021).
  3. International Energy Agency (IEA). Global Status Report for Buildings and Construction 2019; IEA: Paris, France, 2019; Available online: https://www.iea.org/reports/global-status-report-for-buildings-and-construction (accessed on 9 March 2021).
  4. Zhao, Y.; Pang, Z.; Huang, Y.; Ma, Z. An efficient hybrid model for thermal analysis of deep borehole heat exchangers. Geotherm. Energy 2020, 8, 1–31. [Google Scholar] [CrossRef]
  5. Zarrella, A.; Emmi, G.; Graci, S.; De Carli, M.; Cultrera, M.; Santa, G.D.; Galgaro, A.; Bertermann, D.; Müller, J.; Pockelé, L.; et al. Thermal Response Testing Results of Different Types of Borehole Heat Exchangers: An Analysis and Comparison of Interpretation Methods. Energies 2017, 10, 801. [Google Scholar] [CrossRef] [Green Version]
  6. Minaei, A.; Maerefat, M. A new analytical model for short-term borehole heat exchanger based on thermal resistance capacity model. Energy Build. 2017, 146, 233–242. [Google Scholar] [CrossRef]
  7. Neuberger, P.; Adamovský, R. Analysis and Comparison of Some Low-Temperature Heat Sources for Heat Pumps. Energies 2019, 12, 1853. [Google Scholar] [CrossRef] [Green Version]
  8. Blázquez, C.S.; Martín, A.F.; Nieto, I.M.; García, P.C.; Pérez, L.S.S.; González-Aguilera, D. Efficiency Analysis of the Main Components of a Vertical Closed-Loop System in a Borehole Heat Exchanger. Energies 2017, 10, 201. [Google Scholar] [CrossRef] [Green Version]
  9. Rad, F.M.; Fung, A.S.; Rosen, M.A. An integrated model for designing a solar community heating system with borehole thermal storage. Energy Sustain. Dev. 2017, 36, 6–15. [Google Scholar] [CrossRef]
  10. Rad, F.M.; Fung, A.S. Solar community heating and cooling system with borehole thermal energy storage—Review of systems. Renew. Sustain. Energy Rev. 2016, 60, 1550–1561. [Google Scholar] [CrossRef]
  11. Liu, Z.; Li, R.; Wang, D.; Li, H.; Shi, L. Multilayer quasi-three-dimensional model for the heat transfer inside the borehole wall of a vertical ground heat exchanger. Geothermics 2020, 83, 101711. [Google Scholar] [CrossRef]
  12. Al-Temeemi, A.; Harris, D. The generation of subsurface temperature profiles for Kuwait. Energy Build. 2001, 33, 837–841. [Google Scholar] [CrossRef]
  13. Ouzzane, M.; Eslami-Nejad, P.; Aidoun, Z.; Lamarche, L. Analysis of the convective heat exchange effect on the undisturbed ground temperature. Sol. Energy 2014, 108, 340–347. [Google Scholar] [CrossRef]
  14. Pan, A.; Lu, L.; Tian, Y. A new analytical model for short vertical ground heat exchangers with Neumann and Robin boundary conditions on ground surface. Int. J. Therm. Sci. 2020, 152, 106326. [Google Scholar] [CrossRef]
  15. Nian, Y.-L.; Wang, X.-Y.; Xie, K.; Cheng, W.-L. Estimation of ground thermal properties for coaxial BHE through distributed thermal response test. Renew. Energy 2020, 152, 1209–1219. [Google Scholar] [CrossRef]
  16. Boban, L.; Soldo, V.; Fujii, H. Investigation of heat pump performance in heterogeneous ground. Energy Convers. Manag. 2020, 211, 112736. [Google Scholar] [CrossRef]
  17. Ahmadfard, M.; Bernier, M. A review of vertical ground heat exchanger sizing tools including an inter-model comparison. Renew. Sustain. Energy Rev. 2019, 110, 247–265. [Google Scholar] [CrossRef]
  18. Sailer, E.; Taborda, D.M.; Zdravković, L. A new approach to estimating temperature fields around a group of vertical ground heat exchangers in two-dimensional analyses. Renew. Energy 2018, 118, 579–590. [Google Scholar] [CrossRef]
  19. Hu, J. An improved analytical model for vertical borehole ground heat exchanger with multiple-layer substrates and groundwater flow. Appl. Energy 2017, 202, 537–549. [Google Scholar] [CrossRef]
  20. Morchio, S.; Fossa, M. On the ground thermal conductivity estimation with coaxial borehole heat exchangers according to different undisturbed ground temperature profiles. Appl. Therm. Eng. 2020, 173, 115198. [Google Scholar] [CrossRef]
  21. Beier, R.A. Thermal response tests on deep borehole heat exchangers with geothermal gradient. Appl. Therm. Eng. 2020, 178, 115447. [Google Scholar] [CrossRef]
  22. Gónzález-Santander, J.L. Asymptotic expansions for the ground heat transfer due to a borehole heat exchanger with a Neumann boundary condition. J. Eng. Math. 2019, 117, 47–64. [Google Scholar] [CrossRef]
  23. Kerme, E.D.; Fung, A.S. Heat transfer simulation, analysis and performance study of single U-tube borehole heat exchanger. Renew. Energy 2020, 145, 1430–1448. [Google Scholar] [CrossRef]
  24. Claesson, J.; Javed, S. Explicit Multipole Formulas for Calculating Thermal Resistance of Single U-Tube Ground Heat Exchangers. Energies 2018, 11, 214. [Google Scholar] [CrossRef] [Green Version]
  25. Bakirci, K. Evaluation of the performance of a ground-source heat-pump system with series GHE (ground heat exchanger) in the cold climate region. Energy 2010, 35, 3088–3096. [Google Scholar] [CrossRef]
  26. Luo, J.; Rohn, J.; Bayer, M.; Priess, A.; Wilkmann, L.; Xiang, W. Heating and cooling performance analysis of a ground source heat pump system in Southern Germany. Geothermics 2015, 53, 57–66. [Google Scholar] [CrossRef]
  27. Sivasakthivel, T.; Murugesan, K.; Kumar, S.; Hu, P.; Kobiga, P. Experimental study of thermal performance of a ground source heat pump system installed in a Himalayan city of India for composite climatic conditions. Energy Build. 2016, 131, 193–206. [Google Scholar] [CrossRef]
  28. Sivasakthivel, T.; Philippe, M.; Murugesan, K.; Verma, V.; Hu, P. Experimental thermal performance analysis of ground heat exchangers for space heating and cooling applications. Renew. Energy 2017, 113, 1168–1181. [Google Scholar] [CrossRef]
  29. Zhai, X.; Cheng, X.; Wang, R. Heating and cooling performance of a minitype ground source heat pump system. Appl. Therm. Eng. 2017, 111, 1366–1370. [Google Scholar] [CrossRef]
  30. Atwany, H.; Hamdan, M.O.; Abu-Nabah, B.A.; Alami, A.H.; Attom, M. Experimental evaluation of ground heat exchanger in UAE. Renew. Energy 2020, 159, 538–546. [Google Scholar] [CrossRef]
  31. Vella, C.; Borg, S.P.; Micallef, D. The Effect of Shank-Space on the Thermal Performance of Shallow Vertical U-Tube Ground Heat Exchangers. Energies 2020, 13, 602. [Google Scholar] [CrossRef] [Green Version]
  32. Zarrella, A.; Zecchin, R.; Pasquier, P.; Guzzon, D.; Prataviera, E.; Vivian, J.; De Carli, M.; Emmi, G. Analysis of Retrofit Solutions of a Ground Source Heat Pump System: An Italian Case Study. Energies 2020, 13, 5680. [Google Scholar] [CrossRef]
  33. Bartolini, N.; Casasso, A.; Bianco, C.; Sethi, R. Environmental and Economic Impact of the Antifreeze Agents in Geothermal Heat Exchangers. Energies 2020, 13, 5653. [Google Scholar] [CrossRef]
  34. Badenes, B.; Pla, M.; Ángel, M.; Magraner, T.; Soriano, J.; Urchueguía, J.F. Theoretical and Experimental Cost-Benefit Assessment of Borehole Heat Exchangers (BHEs) According to Working Fluid Flow Rate. Energies 2020, 13, 4925. [Google Scholar] [CrossRef]
  35. Bae, S.M.; Nam, Y.; Choi, J.M.; Lee, K.H.; Choi, J.S. Analysis on Thermal Performance of Ground Heat Exchanger According to Design Type Based on Thermal Response Test. Energies 2019, 12, 651. [Google Scholar] [CrossRef] [Green Version]
  36. Naicker, S.S.; Rees, S.J. Long-term high frequency monitoring of a large borehole heat exchanger array. Renew. Energy 2020, 145, 1528–1542. [Google Scholar] [CrossRef]
  37. Spitler, J.D.; Bernier, M. 2-Vertical borehole ground heat exchanger design methods. In Advances in Ground-Source Heat Pump Systems; Rees, S.J., Ed.; Woodhead Publishing: Amsterdam, The Netherlands, 2016; pp. 29–61. ISBN 978-0-08-100311-4. [Google Scholar]
  38. Kusuda, T.; Achenbach, P.R. Earth temperature and thermal diffusivity at selected stations in the United States. Earth Temp. Therm. Diffus. Sel. Stn. 1965, 71. [Google Scholar] [CrossRef]
  39. Nian, Y.-L.; Cheng, W.-L. Analytical g-function for vertical geothermal boreholes with effect of borehole heat capacity. Appl. Therm. Eng. 2018, 140, 733–744. [Google Scholar] [CrossRef]
  40. Yu, X.; Li, H.; Yao, S.; Nielsen, V.; Heller, A. Development of an efficient numerical model and analysis of heat transfer performance for borehole heat exchanger. Renew. Energy 2020, 152, 189–197. [Google Scholar] [CrossRef]
  41. Wang, C.-L.; Li, H.; Huang, Z.-J.; Lu, Y.-H.; Huang, X.-J.; Gan, L. A new heat transfer model for single U-pipe ground heat exchanger. Appl. Therm. Eng. 2019, 154, 400–406. [Google Scholar] [CrossRef]
  42. Ghoreishi-Madiseh, S.A.; Kuyuk, A.F.; de Brito, M.A.R. An analytical model for transient heat transfer in ground-coupled heat exchangers of closed-loop geothermal systems. Appl. Therm. Eng. 2019, 150, 696–705. [Google Scholar] [CrossRef]
  43. Li, P.; Guan, P.; Zheng, J.; Dou, B.; Tian, H.; Duan, X.; Liu, H. Field Test and Numerical Simulation on Heat Transfer Performance of Coaxial Borehole Heat Exchanger. Energies 2020, 13, 5471. [Google Scholar] [CrossRef]
  44. Lee, S.-M.; Park, S.-H.; Jang, Y.-S.; Kim, E.-J. Proposition of Design Capacity of Borehole Heat Exchangers for Use in the Schematic-Design Stage. Energies 2021, 14, 822. [Google Scholar] [CrossRef]
  45. Javadi, H.; Urchueguia, J.F.; Ajarostaghi, S.S.M.; Badenes, B. Numerical Study on the Thermal Performance of a Single U-Tube Borehole Heat Exchanger Using Nano-Enhanced Phase Change Materials. Energies 2020, 13, 5156. [Google Scholar] [CrossRef]
  46. Katsura, T.; Sakata, Y.; Ding, L.; Nagano, K. Development of Simulation Tool for Ground Source Heat Pump Systems Influenced by Ground Surface. Energies 2020, 13, 4491. [Google Scholar] [CrossRef]
  47. Mitchell, M.S.; Spitler, J.D. An Enhanced Vertical Ground Heat Exchanger Model for Whole-Building Energy Simulation. Energies 2020, 13, 4058. [Google Scholar] [CrossRef]
  48. Jahanbin, A.; Semprini, G.; Impiombato, A.N.; Biserni, C.; Di Schio, E.R. Effects of the Circuit Arrangement on the Thermal Performance of Double U-Tube Ground Heat Exchangers. Energies 2020, 13, 3275. [Google Scholar] [CrossRef]
  49. Hałaj, E.; Pająk, L.; Papiernik, B. Finite Element Modeling of Geothermal Source of Heat Pump in Long-Term Operation. Energies 2020, 13, 1341. [Google Scholar] [CrossRef] [Green Version]
  50. Katsura, T.; Higashitani, T.; Fang, Y.; Sakata, Y.; Nagano, K.; Akai, H.; Oe, M. A New Simulation Model for Vertical Spiral Ground Heat Exchangers Combining Cylindrical Source Model and Capacity Resistance Model. Energies 2020, 13, 1339. [Google Scholar] [CrossRef] [Green Version]
  51. Zhang, X.; Zhang, T.; Li, B.; Jiang, Y. Comparison of Four Methods for Borehole Heat Exchanger Sizing Subject to Thermal Response Test Parameter Estimation. Energies 2019, 12, 4067. [Google Scholar] [CrossRef] [Green Version]
  52. Naldi, C.; Zanchini, E. Full-Time-Scale Fluid-to-Ground Thermal Response of a Borefield with Uniform Fluid Temperature. Energies 2019, 12, 3750. [Google Scholar] [CrossRef] [Green Version]
  53. Quaggiotto, D.; Zarrella, A.; Emmi, G.; De Carli, M.; Pockelé, L.; Vercruysse, J.; Psyk, M.; Righini, D.; Galgaro, A.; Mendrinos, D.; et al. Simulation-Based Comparison Between the Thermal Behavior of Coaxial and Double U-Tube Borehole Heat Exchangers. Energies 2019, 12, 2321. [Google Scholar] [CrossRef] [Green Version]
  54. Rivoire, M.; Casasso, A.; Piga, B.; Sethi, R. Assessment of Energetic, Economic and Environmental Performance of Ground-Coupled Heat Pumps. Energies 2018, 11, 1941. [Google Scholar] [CrossRef] [Green Version]
  55. Sun, X.-H.; Yan, H.; Massoudi, M.; Chen, Z.-H.; Wu, W.-T. Numerical Simulation of Nanofluid Suspensions in a Geothermal Heat Exchanger. Energies 2018, 11, 919. [Google Scholar] [CrossRef] [Green Version]
  56. Alberti, L.; Angelotti, A.; Antelmi, M.; La Licata, I. A Numerical Study on the Impact of Grouting Material on Borehole Heat Exchangers Performance in Aquifers. Energies 2017, 10, 703. [Google Scholar] [CrossRef] [Green Version]
  57. Puttige, A.R.; Andersson, S.; Östin, R.; Olofsson, T. A Novel Analytical-ANN Hybrid Model for Borehole Heat Exchanger. Energies 2020, 13, 6213. [Google Scholar] [CrossRef]
  58. Lei, X.; Zheng, X.; Duan, C.; Ye, J.; Liu, K. Three-Dimensional Numerical Simulation of Geothermal Field of Buried Pipe Group Coupled with Heat and Permeable Groundwater. Energies 2019, 12, 3698. [Google Scholar] [CrossRef] [Green Version]
  59. Ma, Z.; Jia, G.; Cui, X.; Xia, Z.; Zhang, Y.; Jin, L. Analysis on variations of ground temperature field and thermal radius caused by ground heat exchanger crossing an aquifer layer. Appl. Energy 2020, 276, 115453. [Google Scholar] [CrossRef]
  60. Serageldin, A.A.; Radwan, A.; Sakata, Y.; Katsura, T.; Nagano, K. The Effect of Groundwater Flow on the Thermal Performance of a Novel Borehole Heat Exchanger for Ground Source Heat Pump Systems: Small Scale Experiments and Numerical Simulation. Energies 2020, 13, 1418. [Google Scholar] [CrossRef] [Green Version]
  61. Park, S.; Lee, S.; Lee, H.; Pham, K.; Choi, H. Effect of Borehole Material on Analytical Solutions of the Heat Transfer Model of Ground Heat Exchangers Considering Groundwater Flow. Energies 2016, 9, 318. [Google Scholar] [CrossRef] [Green Version]
  62. Badenes, B.B.; Pla, M.; Ángel, M.; Lemus-Zúñiga, L.-G.; Mauleón, B.S.; Urchueguía, J.F. On the Influence of Operational and Control Parameters in Thermal Response Testing of Borehole Heat Exchangers. Energies 2017, 10, 1328. [Google Scholar] [CrossRef] [Green Version]
  63. Witte, H.J. Error analysis of thermal response tests. Appl. Energy 2013, 109, 302–311. [Google Scholar] [CrossRef]
  64. Lamarche, L.; Raymond, J.; Pambou, C.H.K. Evaluation of the Internal and Borehole Resistances during Thermal Response Tests and Impact on Ground Heat Exchanger Design. Energies 2017, 11, 38. [Google Scholar] [CrossRef] [Green Version]
  65. Kurevija, T.; Strpić, K.; Koščak-Kolin, S. Applying Petroleum the Pressure Buildup Well Test Procedure on Thermal Response Test—A Novel Method for Analyzing Temperature Recovery Period. Energies 2018, 11, 366. [Google Scholar] [CrossRef] [Green Version]
  66. Jensen-Page, L.; Loveridge, F.; Narsilio, G.A. Thermal Response Testing of Large Diameter Energy Piles. Energies 2019, 12, 2700. [Google Scholar] [CrossRef] [Green Version]
  67. Blázquez, C.S.; Piedelobo, L.; Fernández-Hernández, J.; Nieto, I.M.; Martín, A.F.; Lagüela, S.; González-Aguilera, D. Novel Experimental Device to Monitor the Ground Thermal Exchange in a Borehole Heat Exchanger. Energies 2020, 13, 1270. [Google Scholar] [CrossRef] [Green Version]
  68. Zhang, C.; Guo, Z.; Liu, Y.; Cong, X.; Peng, D. A review on thermal response test of ground-coupled heat pump systems. Renew. Sustain. Energy Rev. 2014, 40, 851–867. [Google Scholar] [CrossRef]
  69. Data from the Institute of Meteorology and Water Management. Available online: https://danepubliczne.imgw.pl/ (accessed on 11 January 2021). (In Polish).
  70. Łapa, M. Executive project. In Reconstruction of the WBiIŚ Building of the Bialystok University of Technology Together with the Construction of An Internal Monitoring Installation under the Project “Improving the Energy Efficiency of the PB Infrastructure Using Renewable Heat Sources”; Scope: Construction of the heat pump installation; Office Technika Grzewcza Solarsystem: Myślenice, Poland, 2014. (In Polish) [Google Scholar]
  71. Piotrowska-Woroniak, J. Preliminary Results of the Temperature Distribution Measurements Around the Vertical Ground Heat Exchangers Tubes. Ecol. Chem. Eng. S 2020, 27, 509–528. [Google Scholar] [CrossRef]
  72. Earth Energy Designer ver.4.20 Software. BLOCON AB: Lund, Sweden, (license for [email protected]).
  73. Port, P.C. Guidelines for Designing, Realization and Receiving Installations Powered by Heat Pumps; Part 1; Polish Organization for the Development of Heat Pump Technology: Cracow, Poland, 2013. (In Polish) [Google Scholar]
  74. Bigaj, Z. Project of Geological Works for Drilling Boreholes to Use Heat from the Earth; Hydrogeological Company PANGEA: Chrzanów, Poland, 2013. (In Polish) [Google Scholar]
  75. Verlag des Vereins Deutscher Ingenieure. Standard VDI 4640 Thermal use of the underground-Ground source heat pump systems. In Verein Deutscher Ingenieure. Richtlinien VDI 4640; Part 2; Düsseldorf Verlag des Vereins Deutscher Ingenieure: Alexisbad, Harzgerode, Germany, 2001. (In German) [Google Scholar]
  76. Baumann, K. First experiences with the geophysical borehole examination of geothermal probes; bbr Wasser, Kanal- & Rohrleitungsbau, 2010, 5. wvgw Wirtschafts- und Verlagsgesellschaft Gas und Wasser mbH Available online: http://www.blm-storkow.de/fileadmin/user_upload/dokumente/veroeffentlichungen/bbr_2010_Erdwaermesonden.pdf (accessed on 11 January 2021). (In German).
  77. Mirowski, A. Ground source heat sources-how to study their thermal efficiency? Methods for determining the soil conduc-tivity coefficient. InstalReporter 2016, 2, 45–48. (In Polish) [Google Scholar]
  78. Baumann, K.; Tewes, S.; Lang, D.; Rogge, R. Subsequent sealing of the annular space for the dismantling of wells and groundwater measuring points; Energie wasser-praxis 2020, 8. and bbr Wasser, Kanal- & Rohrleitungsbau, 2020, 4. wvgw Wirtschafts- und Verlagsgesllschaft Gas und Wasser mbH. Available online: http://www.blm-storkow.de/fileadmin/user_upload/dokumente/veroeffentlichungen/Rueckbau_ewp.pdf (accessed on 12 January 2021). (In German).
  79. Mosch, S.; Pietzner, O.; Baumann, K.; Goldbeck, J. Impulse-based bulk Material Consolidation-hydraulic changes in the con-struction of a new well; Energie wasser-praxis 2020, 8 and bbr Wasser, Kanal- & Rohrleitungsbau 2020, 11. wvgw Wirtschafts- und Verlagsgesllschaft Gas und Wasser mbH. Available online: http://www.blm-storkow.de/fileadmin/user_upload/dokumente/veroeffentlichungen/Schuettgutkonsolidierung.pdf (accessed on 10 January 2021). (In German).
  80. Stefanowicz, E.; Szulgowska-Zgrzywa, M.; Fidorów-Kaprawy, N. Analysis of the ground-source heat pump operation with various heat-carrier fluids in the lower heat source. E3S Web Conf. 2018, 44, 00168. [Google Scholar] [CrossRef] [Green Version]
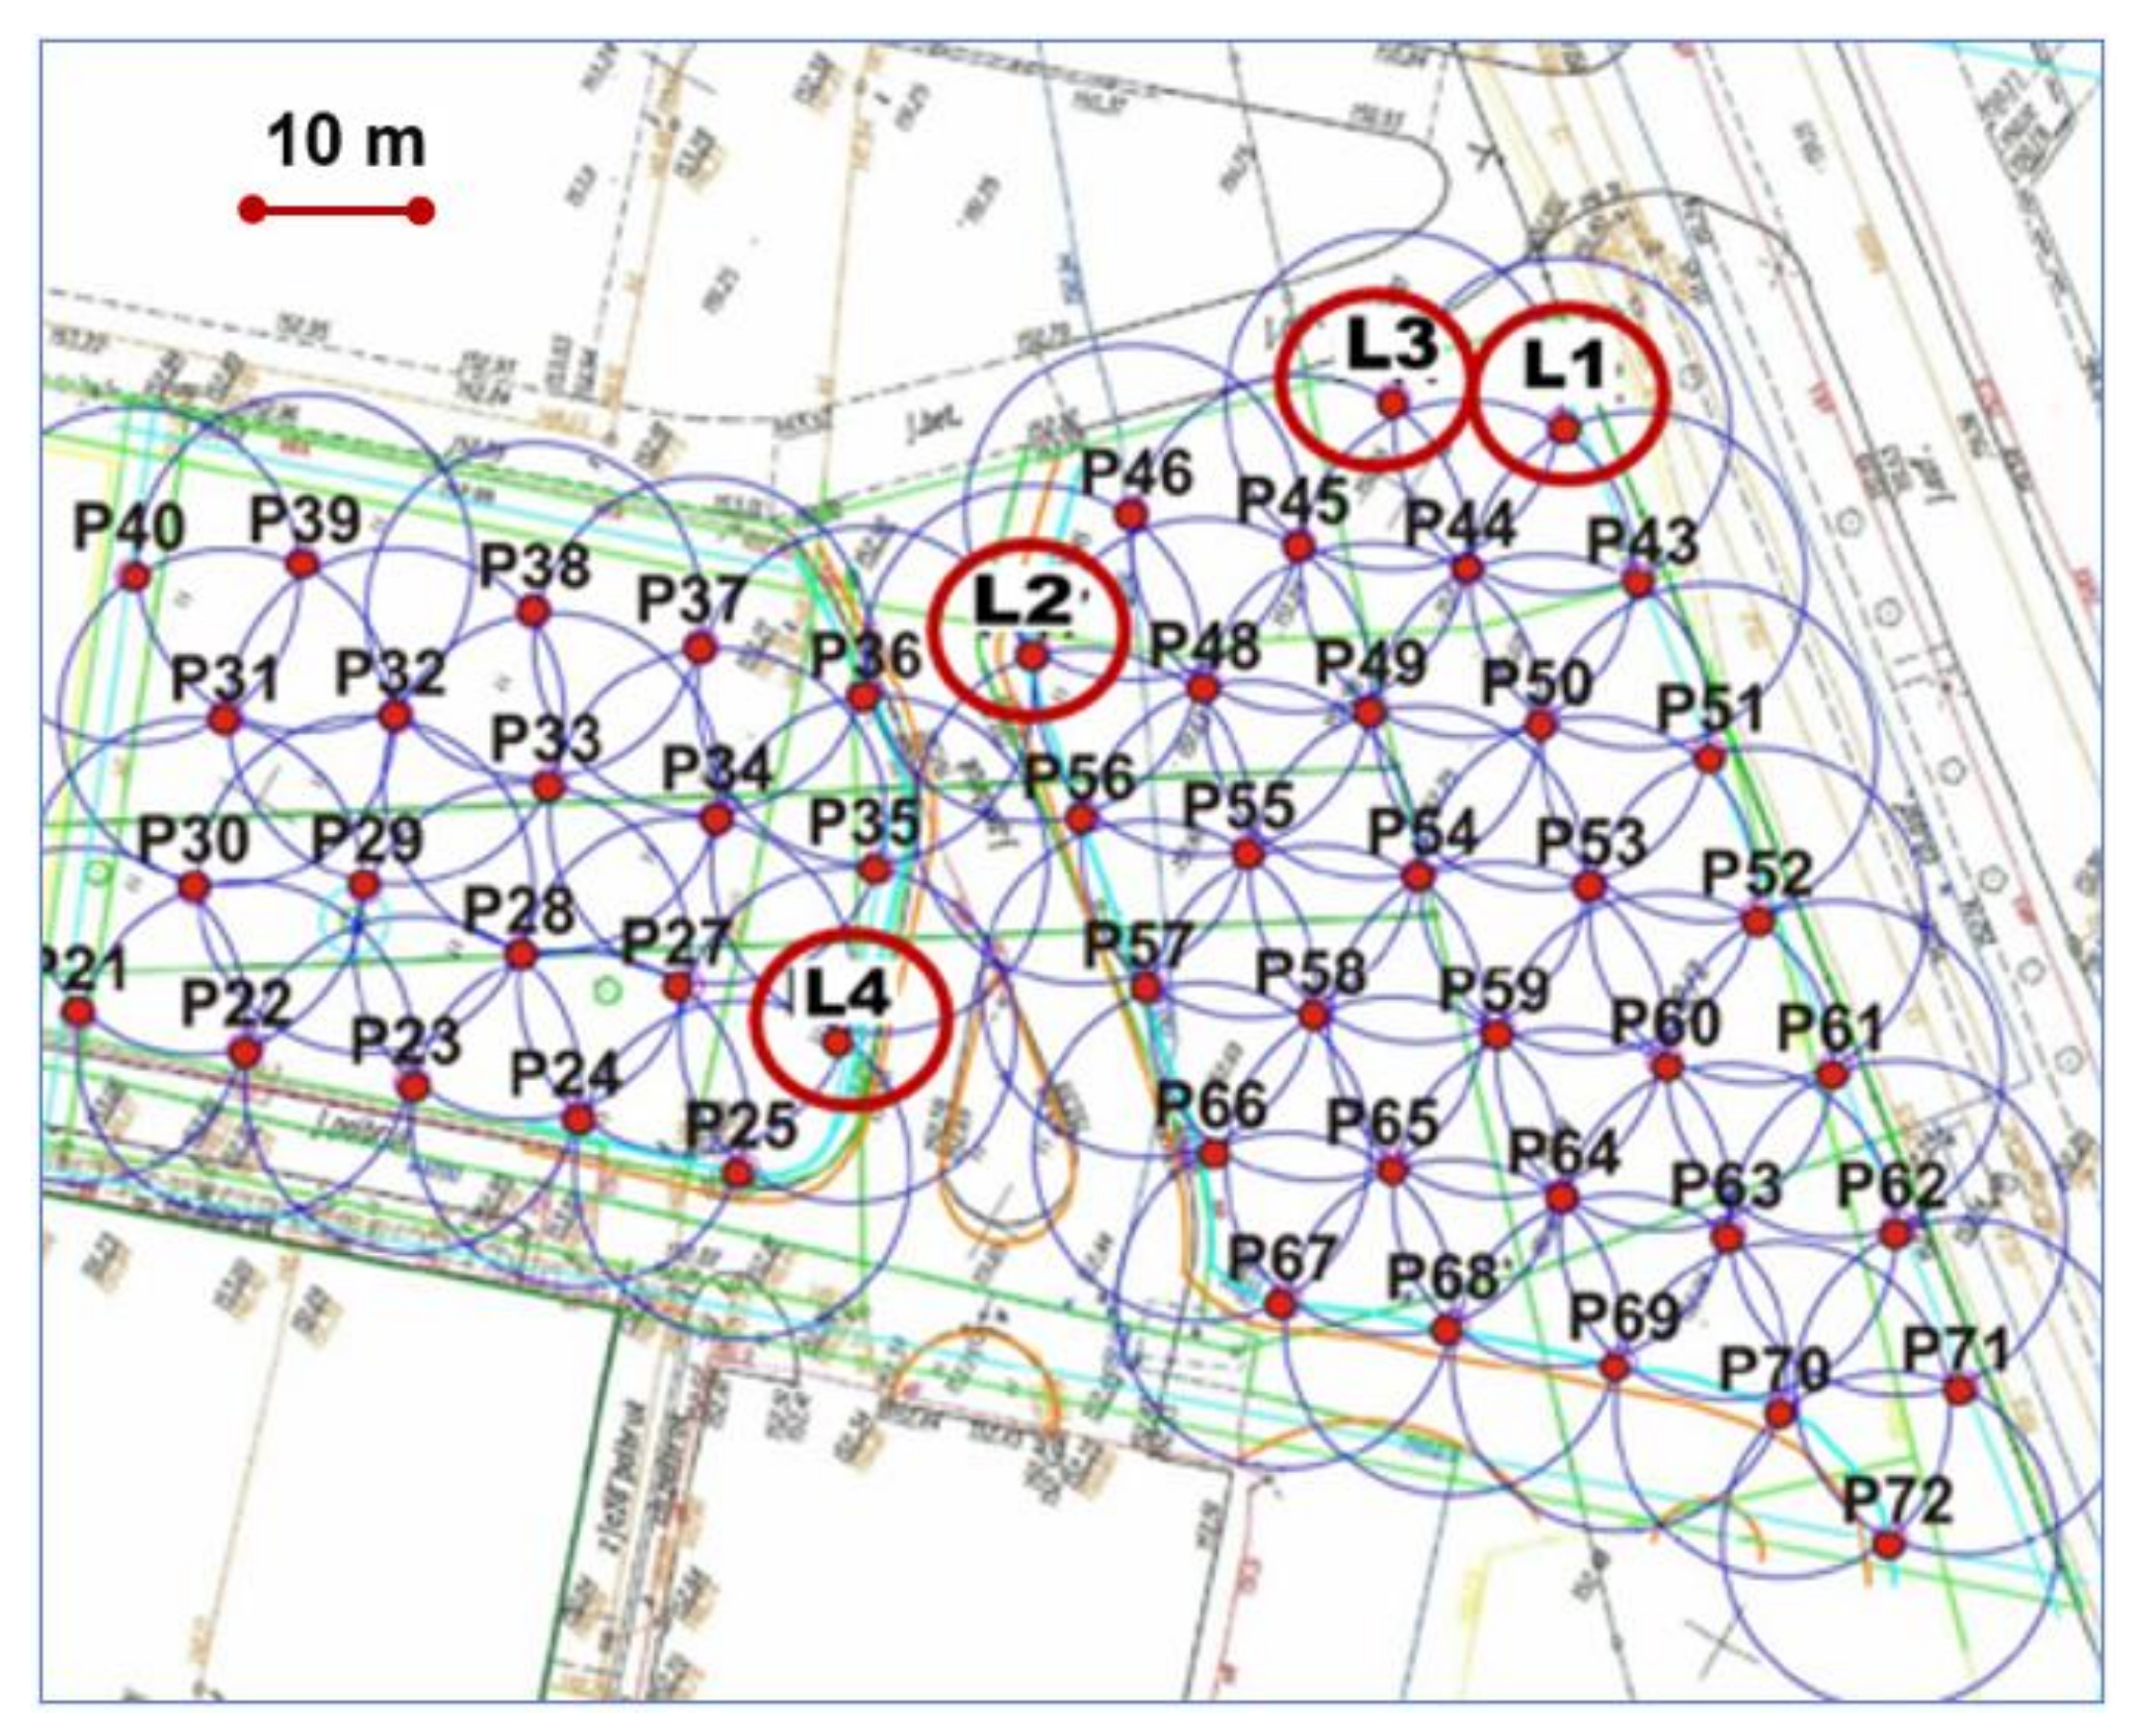
Figure 1. View of the locations of the four BHEs selected for the study marked as L1, L2. L3 and L4, out of 52 BHEs with an assumed power of 3.54 kW each [70].
Energies 14 02512 g001
Figure 2. Unit daily average heat flux taken from the ground by BHEs L1–L4 in 2018.
Energies 14 02512 g002
Figure 3. Unit daily average heat flux taken from the ground by BHEs L1–L4 in 2019.
Energies 14 02512 g003
Figure 4. Brine flow through BHEs L1–L4 in 2018.
Energies 14 02512 g004
Figure 5. Brine flow through BHEs L1–L4 in 2019.
Energies 14 02512 g005
Figure 6. BHE L1 operating parameters in January 2018; (a) flow (b) inlet (T2) and outlet (T1) of brine temperature and (ΔT) brine temperature difference, (c) power.
Energies 14 02512 g006
Figure 7. The average monthly operating parameters of BHEs L1–L4 in 2018, showing the temperature measurement at the outlet (T1) and inlet (T2) from the exchangers and their average power.
Energies 14 02512 g007
Figure 8. The average monthly operating parameters of BHEs L1–L4 in 2019, showing the temperature measurement at the outlet (T1) and inlet (T2) from the exchangers and their average power.
Energies 14 02512 g008
Figure 9. View of various flows set on BHEs rotameters, the red arrows indicate the flow rate set on the rotameter [photo author].
Energies 14 02512 g009
Figure 10. Power of the BHE L1– L4 depending on the brine flow in 2018.
Energies 14 02512 g010
Figure 11. Power of the BHE L1–L4 depending on the brine flow in 2019.
Energies 14 02512 g011
Table 1. Characteristic climatic conditions for the area covered by the research of BHEs [69].
MonthAverage Outside Air Temperature [°C]The Number of Degree-Days [Day/K·Year]Minimum Temperature Near the Ground [°C]
Statistical
1971–2000
20182019Statistical 1971–2000201820191971–200020182019
I−4.9−1.3−3.7709.9598.3 672.7−21.0−13.3−22.2
II−2.0−4.51.8560.0630.0 453.6−20.7−18.6−10.3
III1.7−1.24.2505.3595.2427.8−15.9−21.8−7.2
IV7.311.78.9321.063.0209.3−7.9−6.7−8.7
V13.216.712.948.00 0 −4.00.5−6.3
VI15.918.020.80000.3−0.65.4
VII17.319.817.30003.48.72.6
VIII14.519.217.80002.03.85.9
IX12.114.613.059.00 35 −3.4−3.2−3.8
X7.18.49.8337.9297.6254.2−8.1−3.4−6.0
XI1.63.05.4492.0450.0378.0−12.3−12.0−4.5
XII−1.3−2.02.3598.3620.0486.7−19.8−17.1−7.4
Table 2. Lithological-stratigraphic profile of the soil with the thermal properties [72,74].
No.LayerParticipation in the Structure of the Ground U n     Lithology [74]Thermal Conductivity λ, [W/(m·K)]Volumetric Specific Heat [MJ/(m3·K)]
Top Bottom Min Max Recommended Min Max Recommended
10 m2 m2/100Native soil0.270.750.401.311.591.40
22 m4 m2/100Clay dry0.400.900.401.511.621.60
34 m12 m8/100Sand and Gravel, saturated0.750.900.801.401.651.62
412 m40 m28/100Clay, moist-wet0.902.221.601.603.402.40
540 m45 m5/100Muds1.735.022.402.202.852.50
645 m100 m55/100Clay, moist-wet0.902.221.601.603.402.40
Average weighted factor0.912.201.531.613.162.31
Table 3. The results of calculations of the unit thermal efficiency of the soil and the borehole power.
VariantThermal Conductivity λavg [W/(m·K)]The Unit thermal Efficiency qv [W/m]100 m Borehole Power [kW]
V10.9121.82.18
V22.2038.63.86
V31.5329.92.99
V TRT1.76 ± 0.0335.43.54
Table 4. Operation time of brine-water heat pumps with BHEs during operation in 2018–2019.
No.DateHeat Pumps Work
11 January 2018–10 April 2018duty cycle-on
211 April 2018–30 September 2018duty cycle-off
31 October 2018–23 April 2019duty cycle-on
424 April 2019–23 September 2019duty cycle-off
524 September 2019–31 December 2019duty cycle-on
Table 5. Summary of energy extracted from the ground by BHEs L1–L4 along with the registered annual brine flow through exchangers in 2018–2019.
BHEAnnual Energy Extracted from the Ground E [MJ]Annual Brine Flow V [m3]
2018201920182019
L125530 Energies 14 02512 i00125521 Energies 14 02512 i0013069.642866.30
L229921 Energies 14 02512 i00229839 Energies 14 02512 i0023480.883217.54
L327941276403265.183034.10
L427141257903043.572806.06
Publisher’s Note: MDPI stays neutral with regard to jurisdictional claims in published maps and institutional affiliations.