Article

Microgrid Controller Testing Using Power Hardware-in-the-Loop

1
Fukushima Renewable Energy Institute, AIST (FREA), 2-2-9 Machiikedai, Koriyama, Fukushima 963-0298, Japan
2
Nippon Koei Co. Ltd., 1-22 Morijukudokyu, Sukagawa, Fukushima 962-8508, Japan
*
Author to whom correspondence should be addressed.
Energies 2020, 13(8), 2044; https://doi.org/10.3390/en13082044
Submission received: 14 March 2020 / Revised: 31 March 2020 / Accepted: 16 April 2020 / Published: 20 April 2020
(This article belongs to the Section F: Electrical Engineering)

Abstract

:
Required functions of a microgrid become divers because there are many possible configurations that depend on the location. In order to effectively implement the microgrid system, which consists of a microgrid controller and components with distributed energy resources (DERs), thorough tests should be run to validate controller operation for possible operating conditions. Power-hardware-in-the-loop (PHIL) simulation is a validation method that allows different configurations and yields reliable results. However, PHIL configuration for testing the microgrid controller that can evaluate the communication between a microgrid controller and components as well as the power interaction among microgrid components has not been discussed. Additionally, the difference of the power rating of microgrid components between the deployment site and the test lab needs to be adjusted. In this paper, we configured the PHIL environment, which integrates various equipment in the laboratory with a digital real-time simulation (DRTS), to address these two issues of microgrid controller testing. The test in the configured PHIL environment validated two main functions of the microgrid controller, which supports the diesel generator set operations by controlling the DER, regarding single function and simultaneously activated multiple functions.

1. Introduction

Electricity is still not a granted service for almost a billion people around the globe, mostly in Sub-Saharan Africa, South Asia, and Latin America [1]. These isolated areas with sparse populations pose a real challenge for electrification efforts. Due to their peculiarities, such areas are not reachable by traditional grid-extension solutions [2]. An unorthodox approach is required to supply electrical energy to these locations with stand-alone systems that can address geographical and physical limitations.
In the microgrid of remote areas, the main source of electricity has always been diesel generator (DG) sets. This has negative aspects such as CO2 emissions, operation and maintenance costs, fuel costs, and availability. Variable renewable energy (VRE) sources, such as photovoltaic (PV) and wind, are alternative solutions in this domain [3]. They provide energy in a cleaner and more environmentally-friendly way compared to the grid extension solutions [4]. Although they can provide electricity with smaller geographic constraints, their intermittent and variable generation must be addressed. To realize stable and reliable power supply in the microgrid with VREs, energy storages, which compensate for balancing generation and load, and the microgrid controller, which monitors and operates the status of microgrid components, are necessary. Two core functions of the microgrid controller, i.e., the dispatch function and the transition function are specified [5], and the expected minimum testing requirements of the microgrid controller are discussed [6,7]. Moreover, various functions to meet the requirements and the philosophies of microgrids have been proposed [8]. Since there are many possible configurations that depend on location and purpose, the required functions of microgrid controllers become diverse.
In order to effectively lead the microgrid controller to on-site deployment in a sophisticated condition, thorough validation testing needs to be run on the microgrid controller. The testing can be performed in different ways. Simulation, being one of them, provides quick and flexible testing. It has low fidelity, and this can be mitigated with laboratory testing. However, laboratory testing is performed with real-equipment and setups. This is time-consuming and prone to errors. On the other hand, a new approach called hardware-in-the-loop (HIL) simulation provides flexibility and yields very precise results [9]. Each validation method should be selected depending on the development stages, while HIL is a reasonable option from the viewpoint of testing the prototype and the final product of commercial microgrid controllers.
Laboratory testing has the capability to test hardware with high fidelity conditions. There are power system research testbeds that can provide flexible testing environments composed of inverter-based emulators and some distributed energy resources (DERs) [10,11,12]. Since the control system parts of these labs are built by the flexible modeling tools, it is supposed that they have advantages in the stage of developing microgrid control algorithms. They still have potential to improve the flexibility in terms of power system configurations by integrating with the digital real-time simulation (DRTS) [13].
Controller HIL (CHIL) is a sort of HIL simulation that can evaluate the interaction between the controller hardware and the rest of the simulated system. The testing capability of the microgrid testbed was improved by combining DER controllers and the DRTS [14]. The control and the communication of a microgrid and its protection system were evaluated in the CHIL technique. The ancillary service provided by a PV connected to the microgrid was evaluated in the CHIL simulation [15]. The theoretical control algorithm was improved on the basis of the evidence provided by the practical implementation and the interaction between the simulated microgrid. The data communication and management schemes of the multiple agents distributed control implemented in the microgrid central controller were tested in the CHIL system [16]. The CHIL evaluation of a DG set controller for several microgrid operations was presented [17]. The controller performance for the events that occurred in the simulated microgrid was evaluated. The literature described that the CHIL simulation had the capability to test the hardware controller in various power system configurations thanks to the integration with the DRTS. On the other hand, since no real power was applied, and the power system was modeled in the DRTS, the evaluation concerning the effect caused by the actual power interaction was not available.
Power HIL (PHIL) is another HIL simulation method, which interfaces power devices with power amplifiers emulating the behavior of the remaining power system modeled in the DRTS. The accuracy of PHIL testing was validated to compare with the virtual simulation [18]. The validation was focused on the autonomous frequency droop control of the battery energy storage system (BESS) and the DG sets in islanded microgrid. The PV inverter that provides local control of frequency and voltage support functions was tested [19]. The low-voltage (LV) microgrid was modeled in the PHIL simulation, and the PV inverter under test was connected to a bus of the microgrid via a power amplifier and a current sensor. The PHIL configuration was proposed for the analysis of a direct current (DC) microgrid as well as an alternating current (AC) microgrid [20]. The validity of the PHIL simulation for the DC microgrid and its simulation stability were evaluated. Most studies about microgrid PHIL testing focused on evaluating the autonomous control of DERs, not the microgrid controller. From the perspective of testing the microgrid controller, which includes various functions and controls DERs that may interfere with each other, the communication between the controller and the components of the microgrid as well as the power interaction among them needs to be evaluated. Although the conceptual PHIL setup for evaluating both interactions was shown in [21], only testing of autonomous control of a PV inverter was performed. The microgrid composed of DERs and loads were tested in the platform combining PHIL and signal-HIL (SHIL) simulations [22]. The microgrid controller was mainly tested on the SHIL scheme; however, the complex power interaction among DERs was not verified because implemented hardware under test was the only load, which does not interfere with other microgrid components. To evaluate the communication and power interaction among the microgrid controller and the components, the PHIL configuration needs to include the microgrid controller and at least one component that is managed by the controller considering the power interaction. However, such a PHIL configuration that enables the evaluation of the aforementioned interactions has not been discussed. Furthermore, the necessity of power rating scaling has not been mentioned. In the existing PHIL simulations, the current and voltage the values fed back to the DRTS are set to reflect the measured values as they are. However, when the power ratings of the microgrid components are different between the deployment site and the laboratory, these values should be appropriately scaled.
The contribution of this paper is to present a PHIL configuration for testing a microgrid controller that:
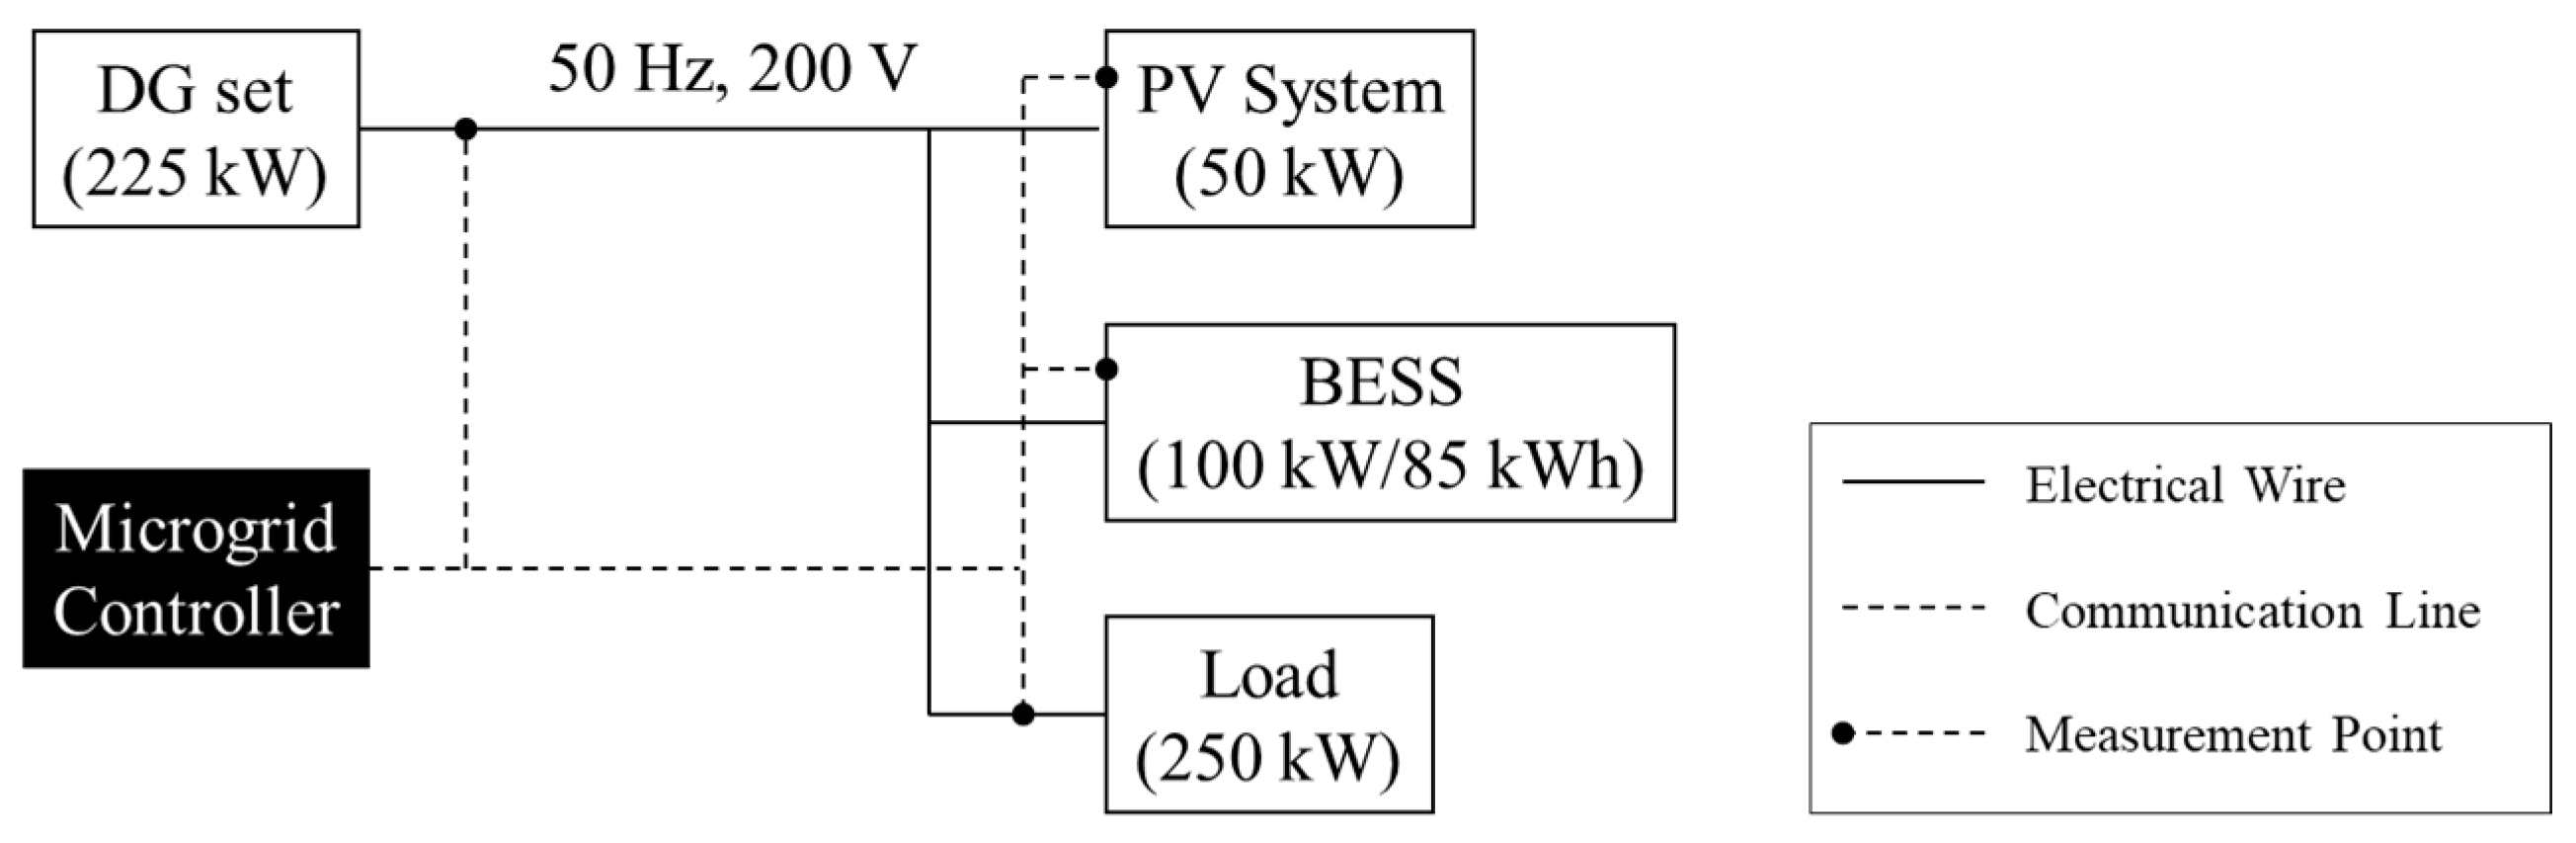
  • can evaluate the communication between the microgrid controller and the components as well as the power interaction among them, i.e., DG set, PV, BESS, and load;
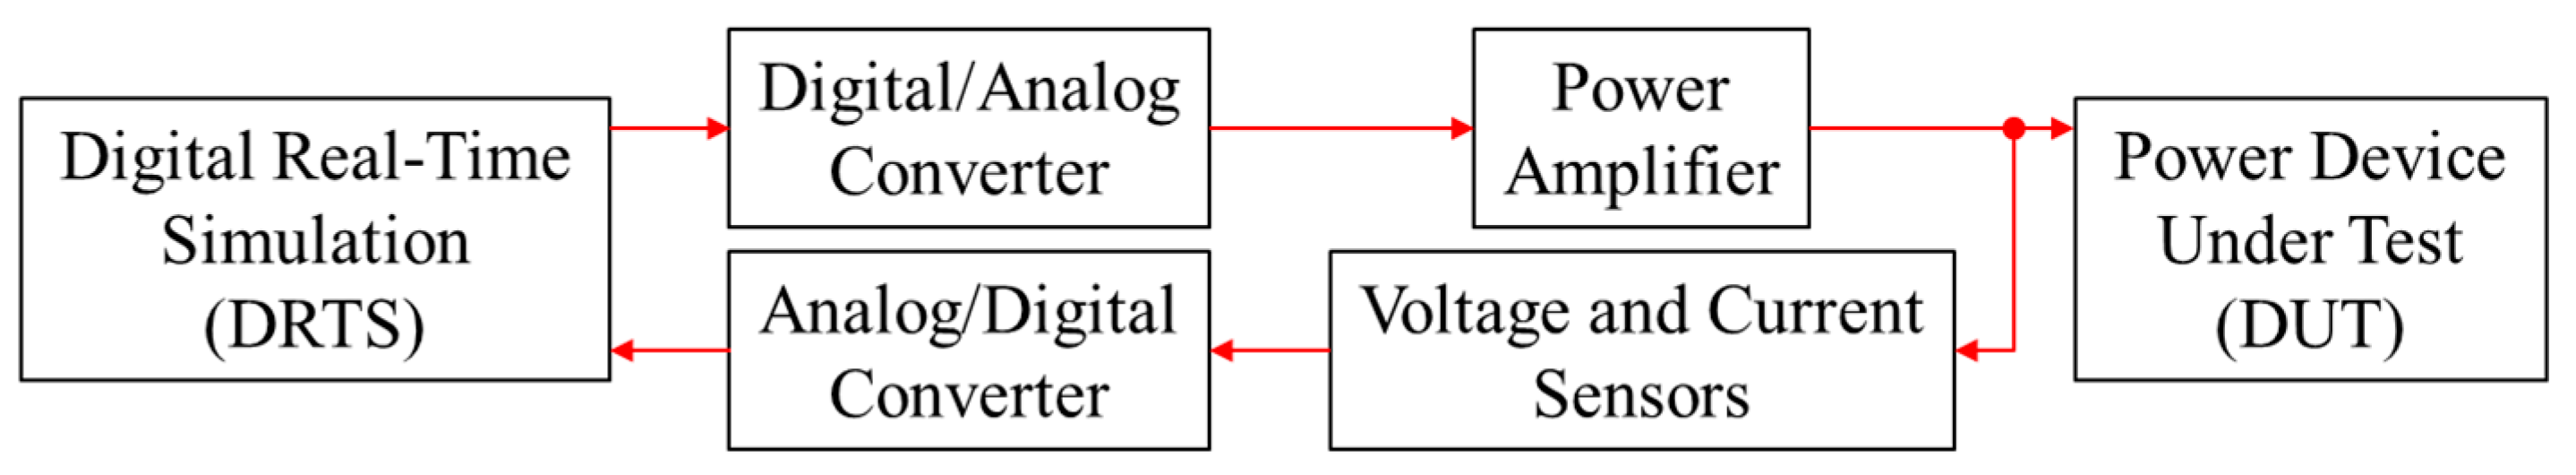
  • appropriately scales the power rating between physical and simulated devices under test (DUT) by adjusting the feedback current and the voltage values to the DRTS.
Main functions of a developing microgrid controller were tested in the configured PHIL environment. The test scenarios were set to observe the interference between the functions, while each function was validated in our previous work [13]. The ultimate goal is to deploy this controller along with BESS and PV systems to a stand-alone island microgrid energized by only DG sets. This paper is structured as follows: Section 2 presents test facilities in Fukushima Renewable Energy Institute, AIST (FREA). Section 3 depicts the configuration details of the microgrid under consideration. Section 4 shows the setup for PHIL testing. Section 5 shows the test results of the microgrid controller in the PHIL simulation, and Section 6 draws the conclusions.

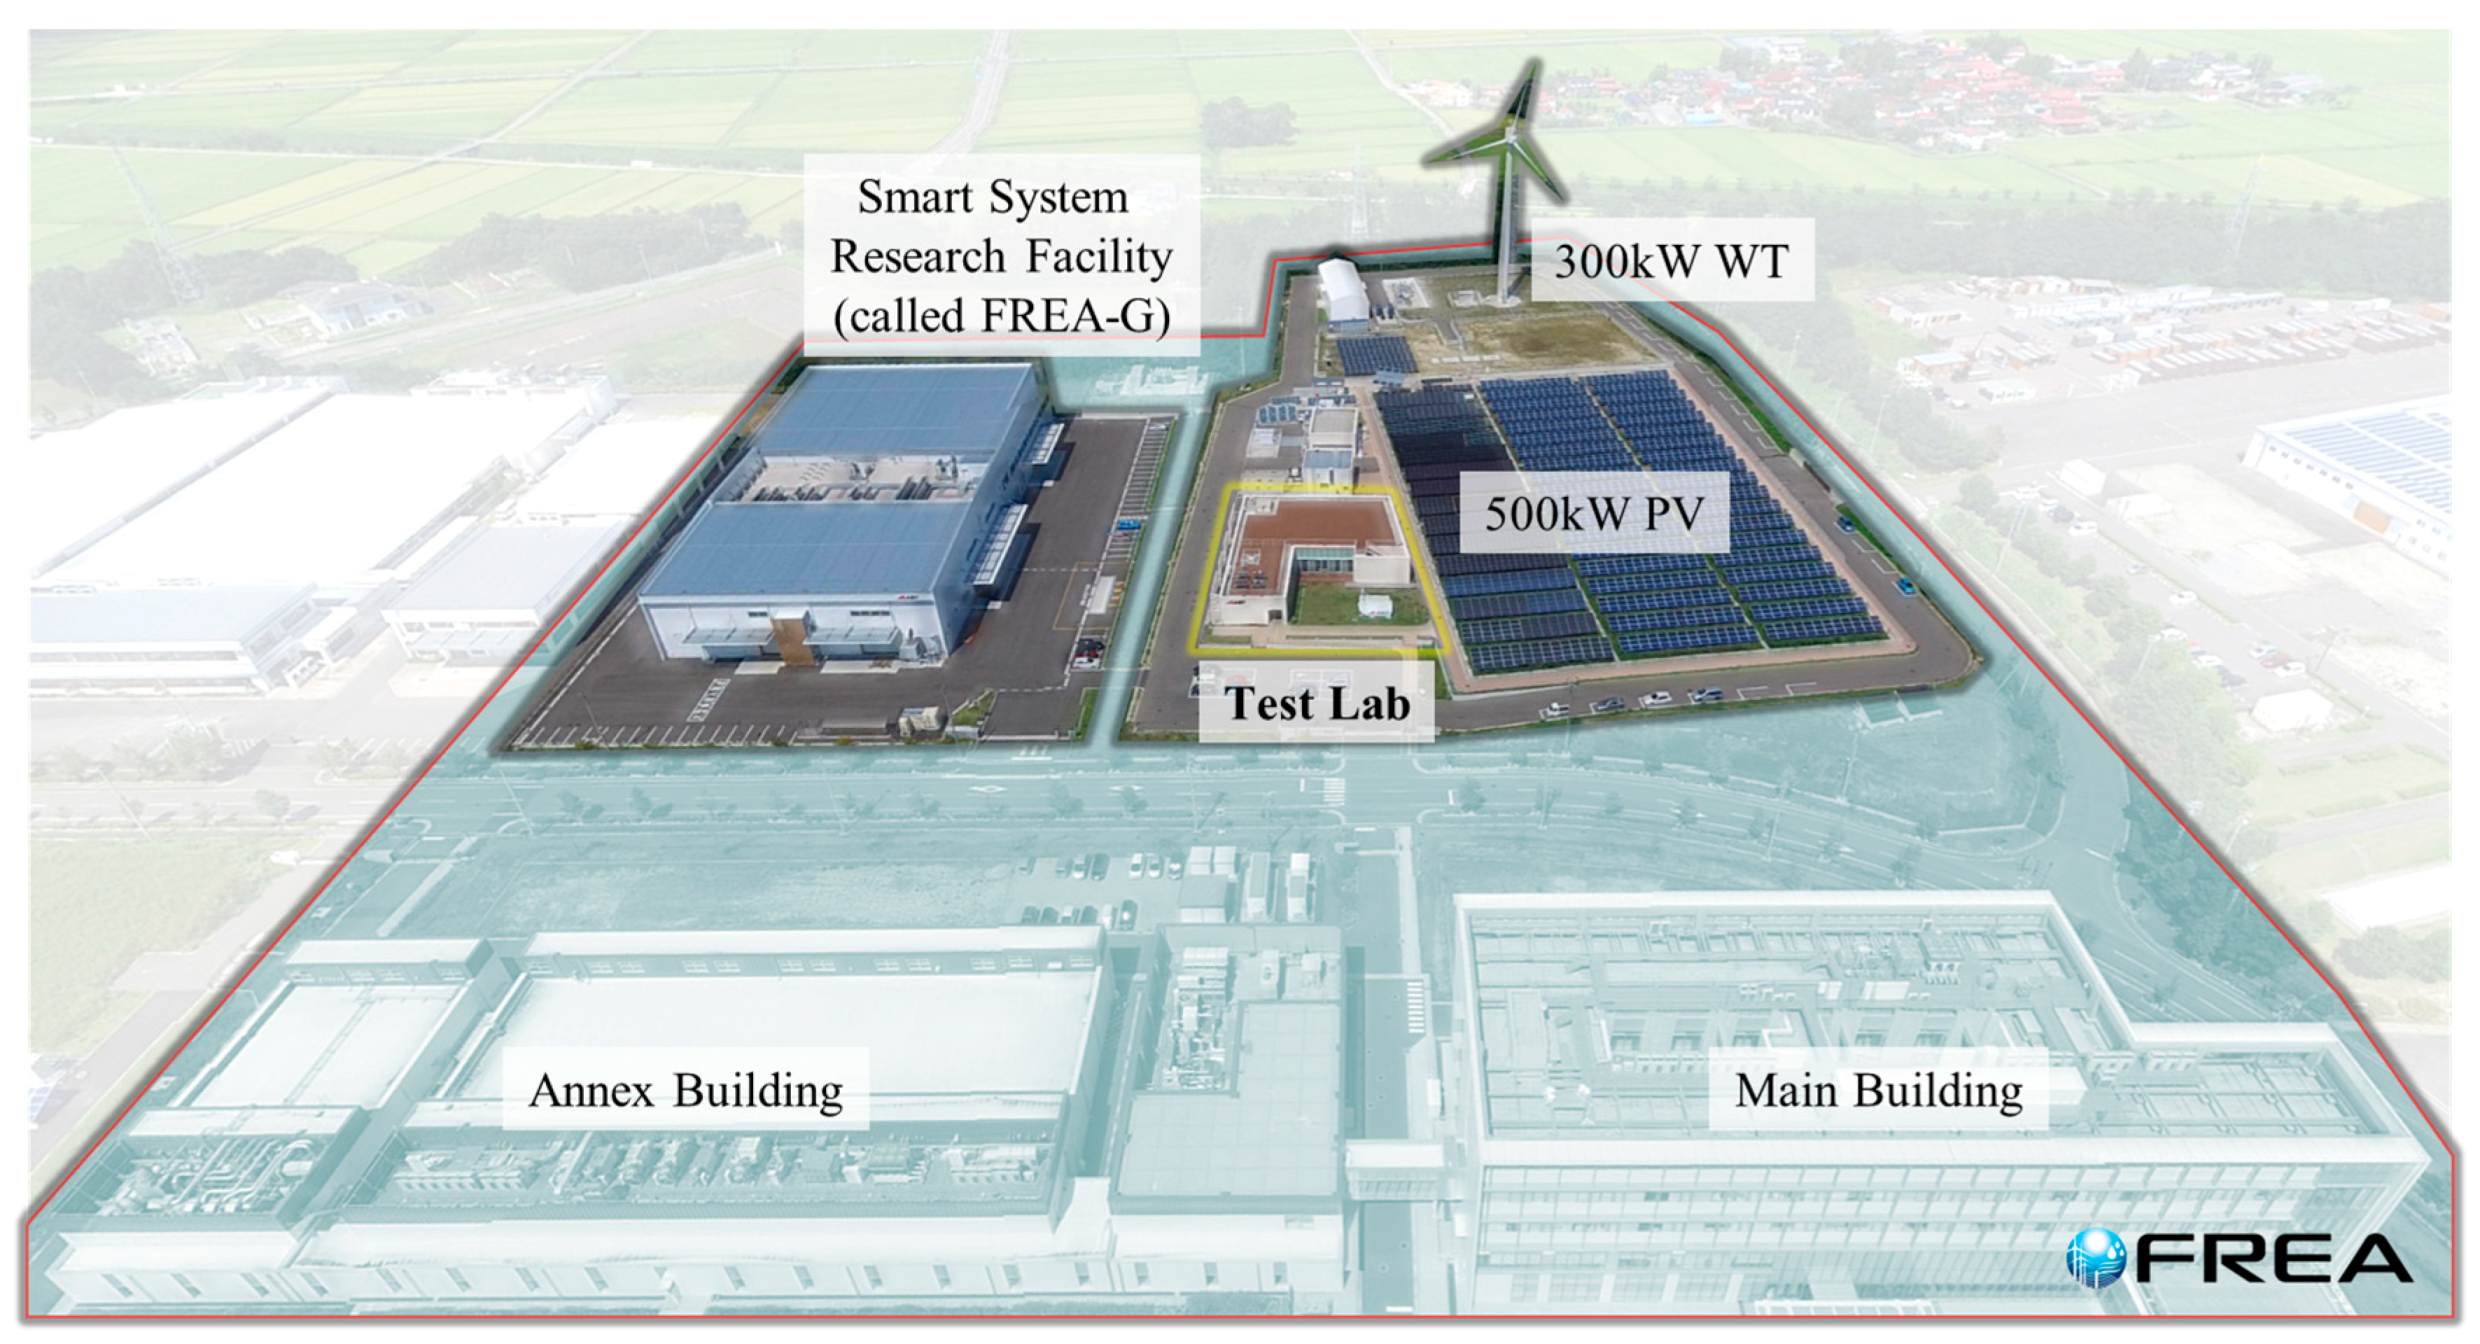
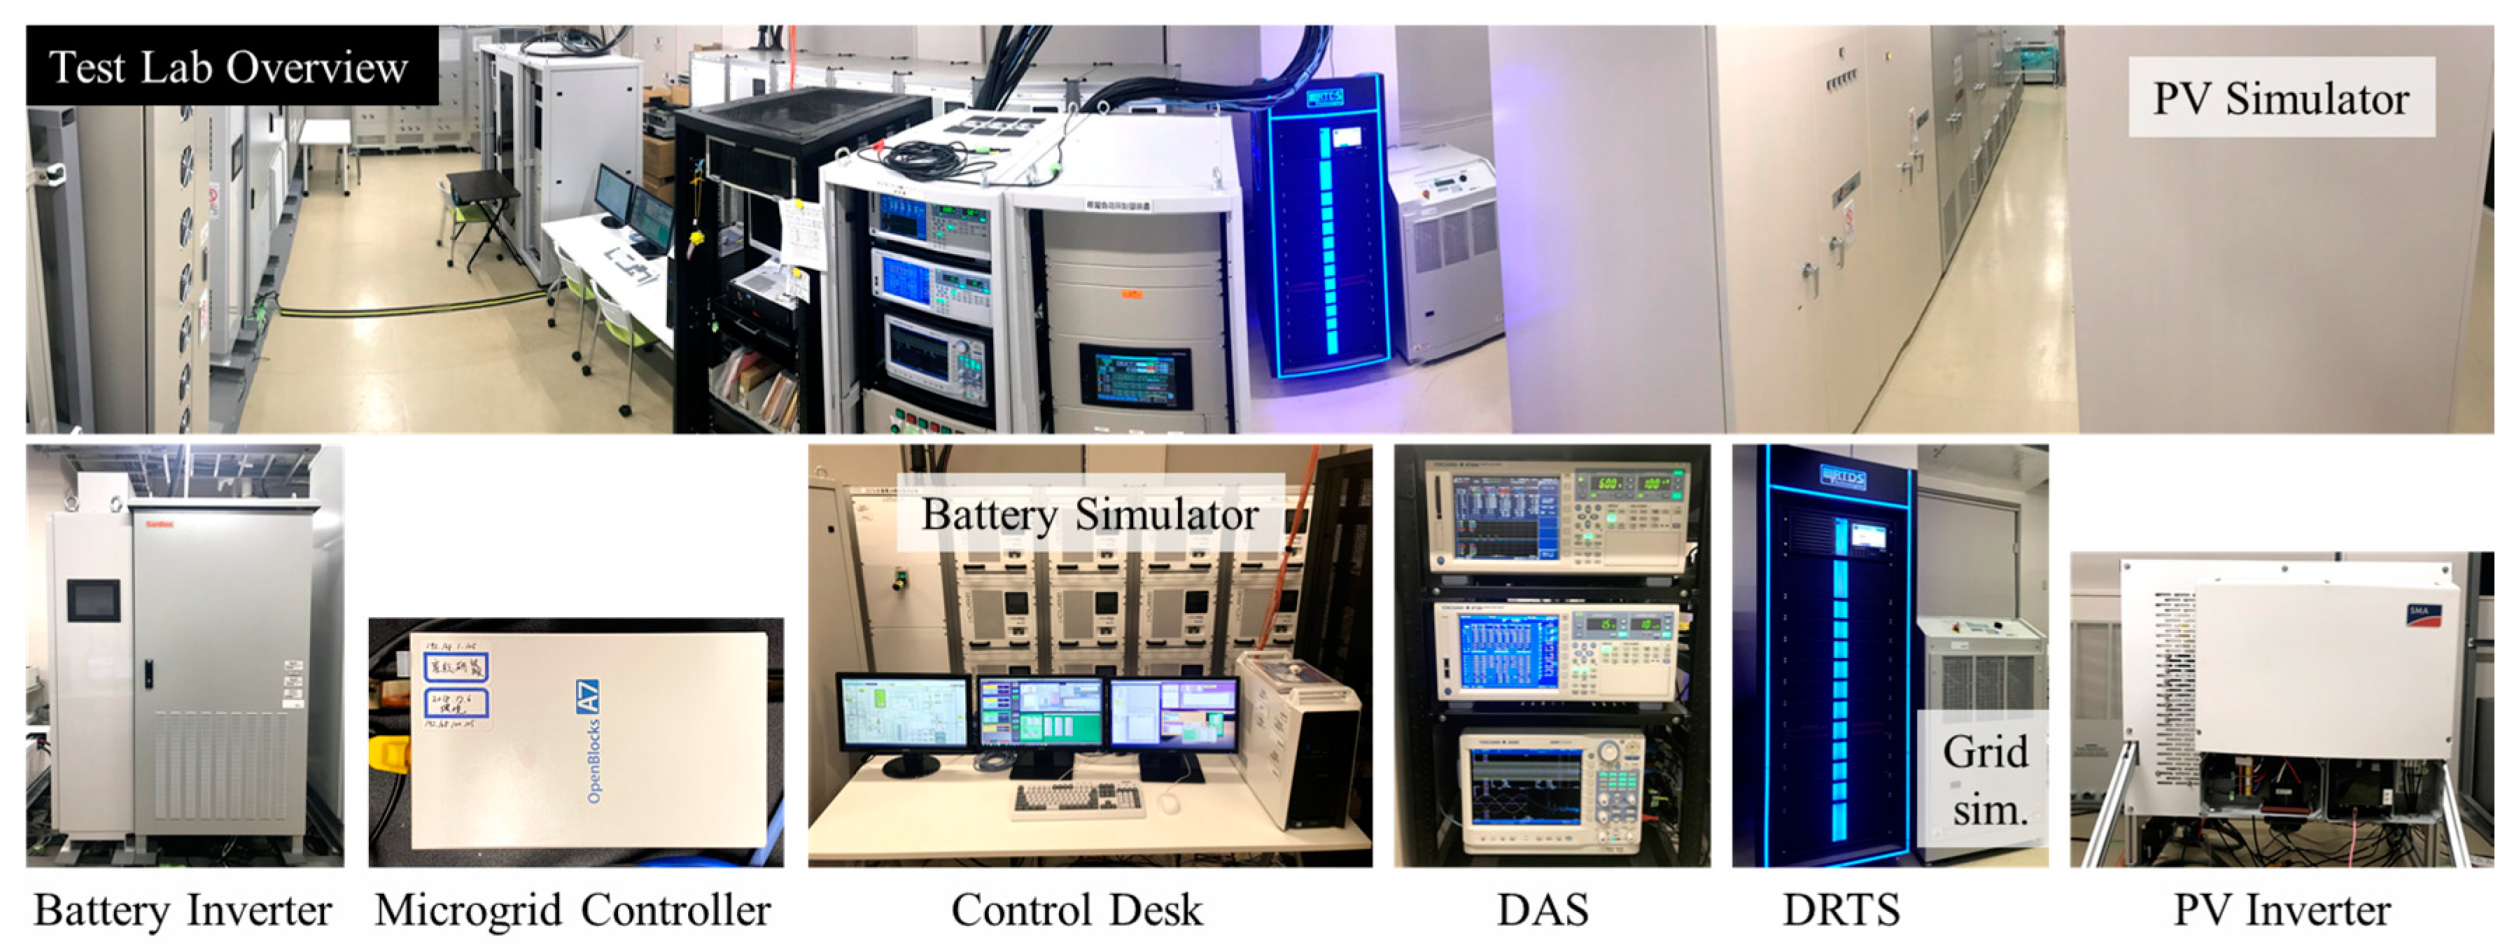
2. Power System Related Testing Facilities in FREA

In FREA, different testing can be run to validate a range of technologies. Figure 1 shows the overview of FREA highlighting the power system related facilities. On the left stands the Smart System Research Facility (FREA-G), which has the capability to validate devices with or without connection to the grid. The construction was specifically kept flexible to enable the testing to be performed with bidirectional AC sources, e.g., a grid simulator, as well as bidirectional DC sources, e.g., PV/battery simulator, load banks, and line impedances. The features are the gigantic 5 mega volt-ampere (MVA) grid simulator and the 3.3 MVA PV/battery simulator, which are tailor-made for testing that involves power equipment with very high ratings.
The test lab is mainly utilized for research and development of novel technologies, while FREA-G is mainly utilized for authentication testing. It is envisioned that novel testing methods and grid supporting functions of devices developed in the test lab are transferred to FREA-G. The test lab configuration regarding this paper is shown in Figure 2. It is composed of smaller-scale equipment than those in FREA-G. A 500 kW PV demonstration field stands next to the test lab. This field houses PV panels from different manufacturers using several solar cell technologies. This allows one to follow and record performance variations in time [23]. These panels as well as a wind turbine, rated 300 kW, have alternative connections to the test lab and can be integrated for the testing.
Nonetheless, this state-of-the-art facility is no different than others when it comes to flexibility, which is limited by the real equipment in the lab. The PHIL simulation capability is added to FREA to further expand the testing capabilities and cases that can be run. Configurational alterations can be done in a rapid manner, and real power exchange yields reliable results. Figure 3 shows configuration details of the PHIL testing setup. The DRTS simulating the power system transmits necessary signals to the power amplifier, i.e., the grid simulator. The amplifier’s output is connected to the device under test (DUT), while the output from the DUT is fed back to the DRTS. Typical PHIL testing consists of only a DUT, and the rest is modeled inside the DRTS; however, this paper describes the PHIL configuration that several devices present in the laboratory are connected to the DRTS as DUTs. Such an integrated approach brings the test case much closer to real-life scenarios and is more likely to convince stakeholders, e.g., grid operators.

3. Configuration and Functions of the Microgrid

Microgrid controller testing is run after combining a DRTS and power hardware devices present in the test lab shown in Figure 2. A developing microgrid controller is planned to be used in a stand-alone island system that is currently energized by DG sets only. Additional BESS and PV deployments are also planned. Figure 4 shows the configuration of the microgrid. The current consumers are represented by an aggregated load, and the nominal system values are 200 V and 50 Hz. The controller was designed by Nippon Koei on the basis of the battery control system for providing ancillary service in a bulk power system (NK-EMS in [24]). After PV and BESS deployments, grid voltage and frequency are set by the DG set, and the controller tries to maximize renewable energy use. The DG set is the utility operator’s property and cannot be managed by the controller. The communication link with it is only used to monitor its operating conditions. In this paper, two main capabilities of the controller are tested. The first one pertains to frequency control, while the latter is about controlling the DG set’s power output.
Function 1: It focuses on frequency control. The controller’s responsibility is to support the DG set capability to maintain the frequency at around the nominal one by controlling the DERs. Should a swing occur, the controller is expected to command the BESS to charge or discharge so as to stabilize the frequency.
Function 2: This function keeps the DG set’s output between certain limits. The DG set’s output needs to be higher than a certain amount in order to not stop its operation as it is setting the frequency and the voltage of the grid. PV and BESS outputs need to be coordinated by the controller so that the DG set’s output is kept above this threshold. Although grid forming functions of inverter-based sources are also studied [25], here, only grid supporting functions are focused on. On the other hand, it is desirable to keep the DG set’s output below a certain value because there is one unit inside the DG set, and going beyond this certain limit would require the second unit to be fired. This needs to be avoided as much as possible.

4. PHIL Testing Configuration

Figure 5 depicts the testing configuration in the lab. A real PV inverter is coupled with a DC simulator, which represents PV modules/arrays. A battery inverter and a battery emulator that is capable of mimicking different characteristics are utilized to implement BESS. The aggregated customer load is emulated by a load bank. Due to the lack of a DG set, the DRTS, which is NovaCor of RTDS Technologies, is utilized to integrate a DG set through the PHIL application. The simulated output of the DG set is amplified via AMETEK MX30 power amplifier and applied to the microgrid power components. Comparing Figure 4 and Figure 5, the mismatch between real ratings of the microgrid equipment and the available test equipment becomes evident. The lab’s PV and battery inverters are rated 10 kW and 50 kW, respectively, which are smaller than those in the real microgrid (see Figure 4). Moreover, the DRTS interface with the lab equipment is achieved through a power amplifier, and the upper limit of allowed power exchange is 30 kW. As a workaround of this issue, the testing set up is scaled to 10% of actual ratings, as shown in Table 1. When the actual proportion between equipment ratings is preserved, the interaction between their outputs and how this affects the system frequency and the voltage stays constant. All three pieces of equipment in the lab, i.e., the load as well as two inverters, are monitored by the data acquisition system (DAS) composed of YOKOGAWA WT3000 and WT1800 that capture root means square values of current and voltage with 50 ms. The microgrid controller, on the other hand, monitors terminal data of all equipment with a resolution of 100 ms.
The PHIL application is utilized to couple the lab setup with the DRTS where a DG set is simulated. The second component, i.e., dynamic PQ source, is utilized to model the lab inside the DRTS. Since the simulation does not have any rating limitations, it follows real rating values, e.g., 225 kW for the DG set. The interface through the amplifier scales down the simulated power values to 10% and reflects as the output. The opposite is also true; power outputs of all other components are multiplied by ten and provided as input to the DRTS. In this test, since the nominal voltage is set to an identical value (200 V) in DRTS and the test lab, only the current value fed back to the DRTS is scaled for adjusting the power rating. This set up enables running validation testing for the microgrid controller by realizing real power exchanges between different components as well as the communication between the controller and the components, although the test lab is not sufficient in terms of equipment variety or sizing. This shows the advantage of the PHIL simulation in testing. In this PHIL setup, the microgrid controller developed by Nippon Koei was brought into the test lab in FREA. Once the communication interface of the microgrid controller and the lab devices is set, it can be tested as a blackbox. In other words, the lab test can be performed without the need to know the internal design of the controller.

5. Results of Microgrid Controller Testing in PHIL Simulation

Validation testing is run on the PHIL configuration to monitor performance of the microgrid controller. A main focus of this testing is to validate the mutual interference between functions 1 and 2. The operation of the microgrid controller is validated when both functions 1 and 2 are simultaneously activated, while each single function was tested in our previous work [13]. The test is carried out in two scenarios. In the first test, the performance of function 1 is assessed. Then, the test is carried out with both functions 1 and 2 activated. The PV output is set to zero throughout all test scenarios.

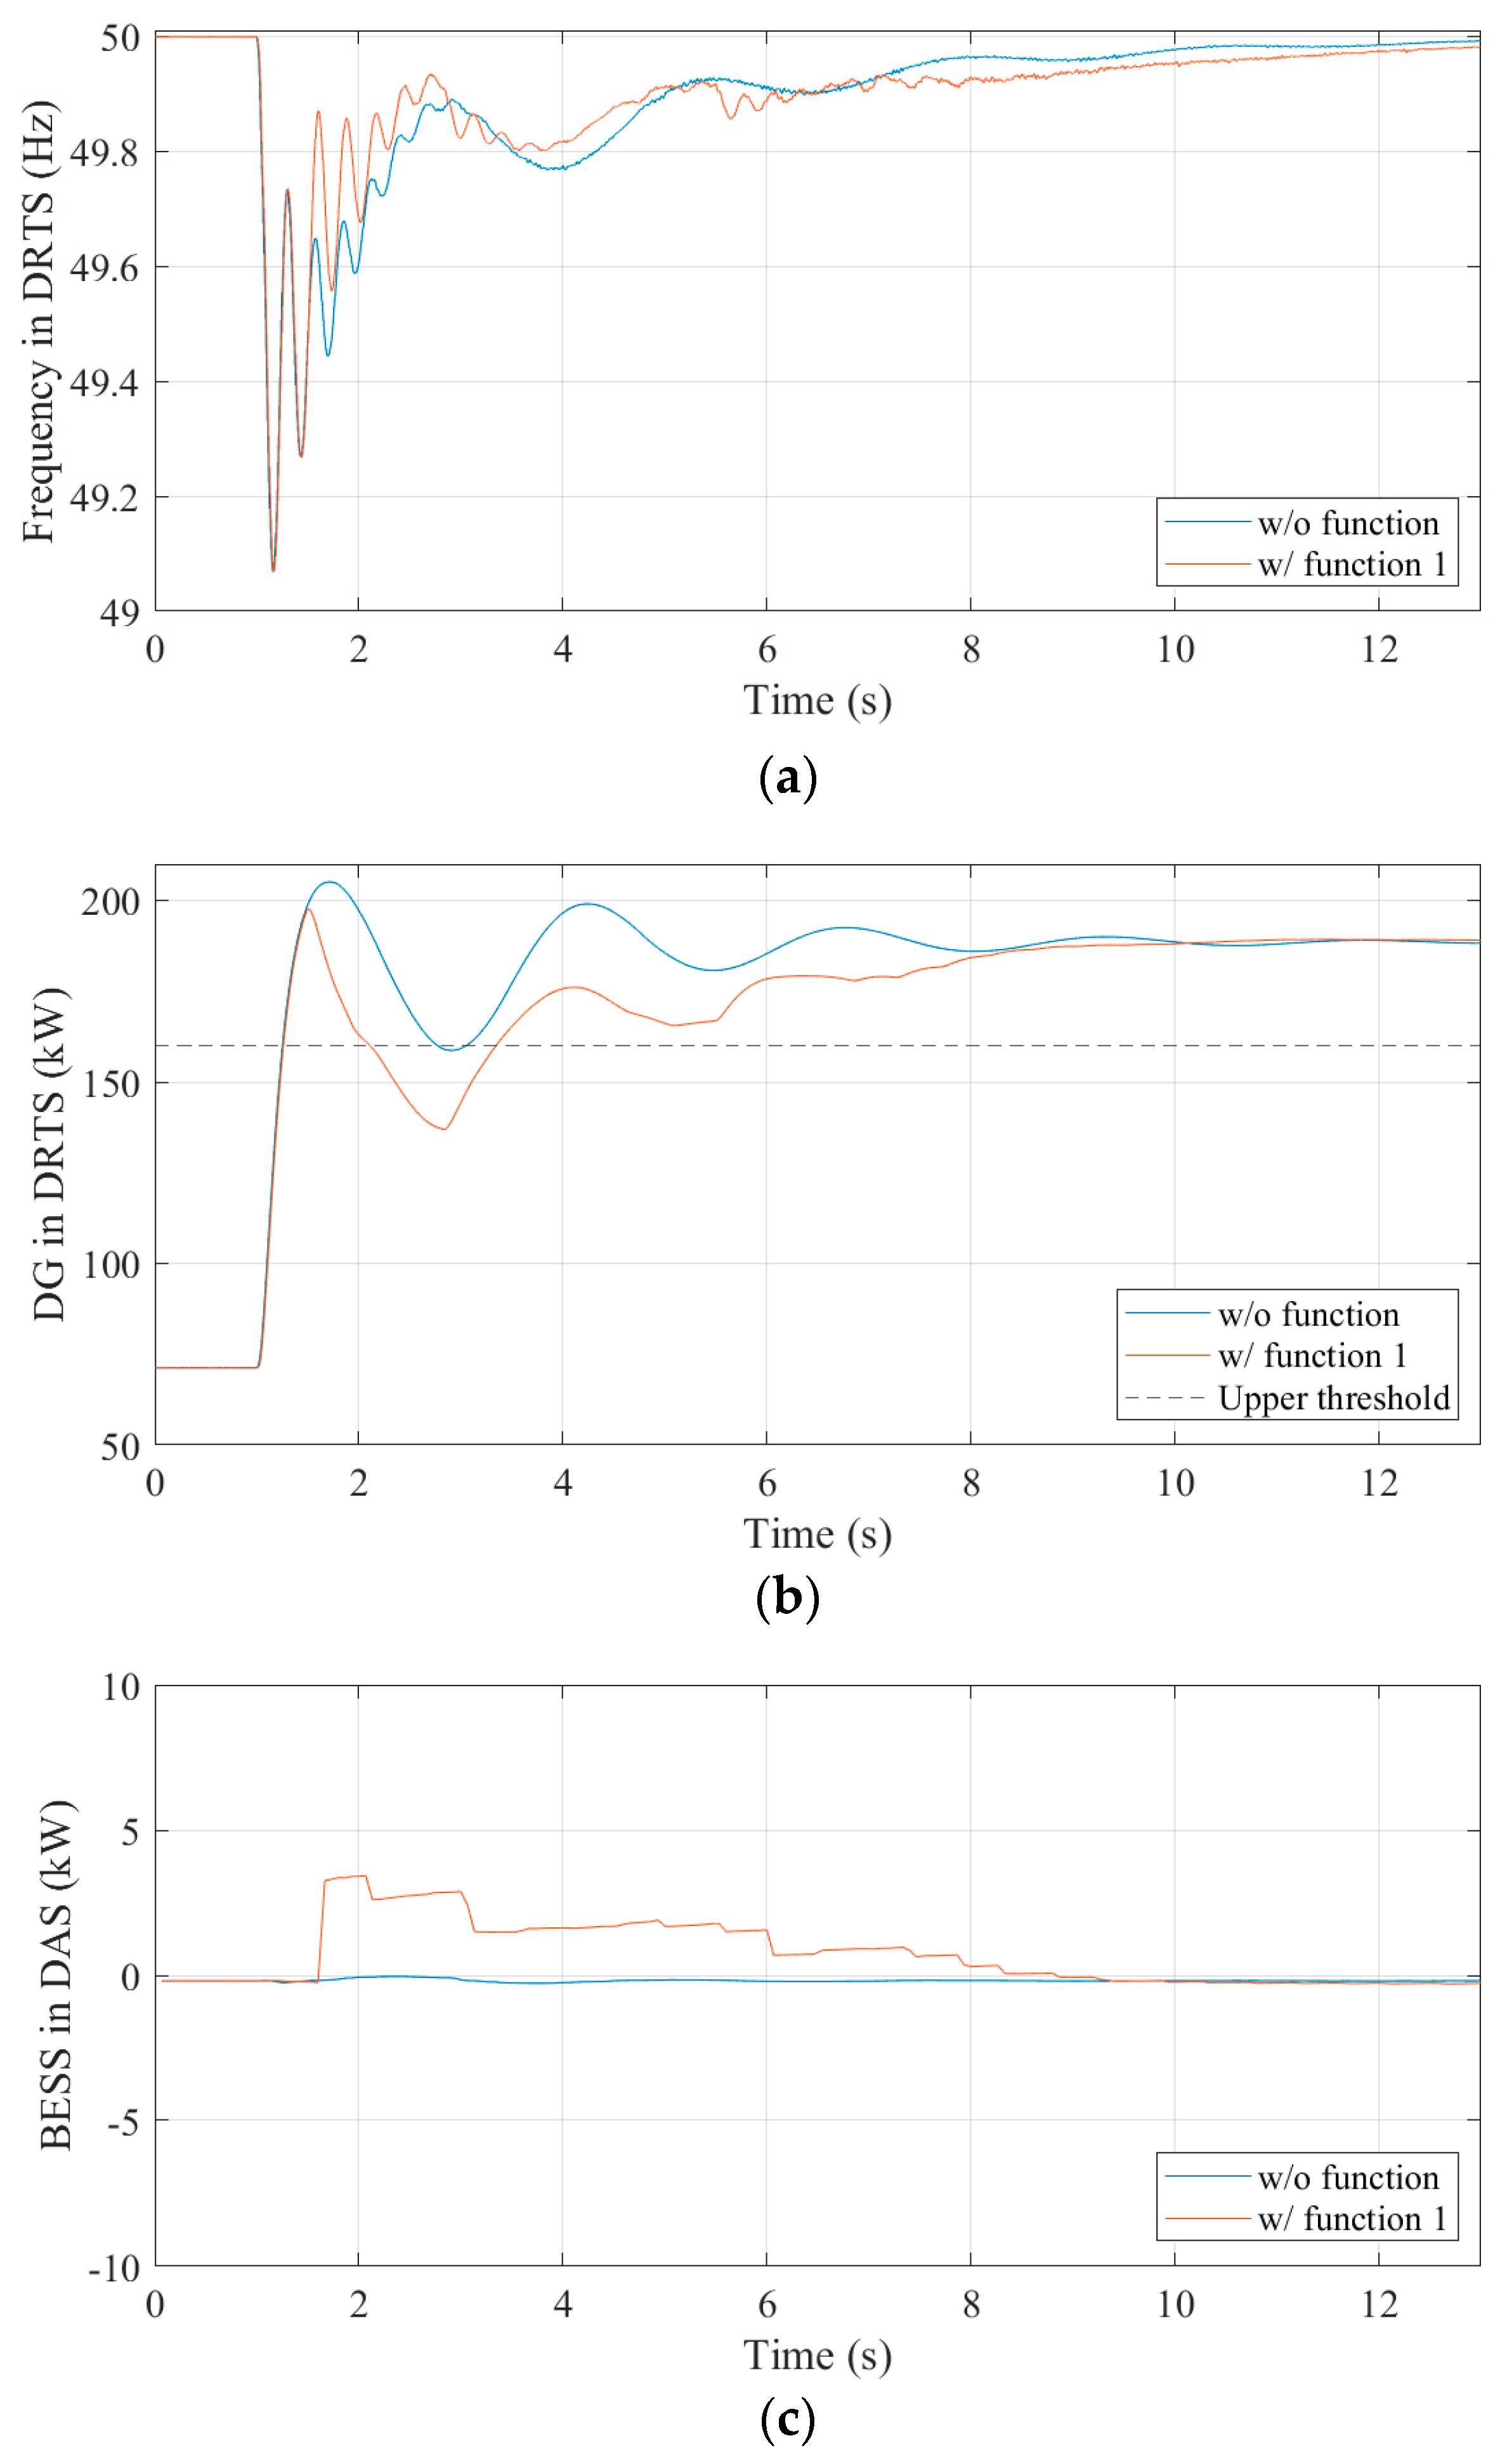
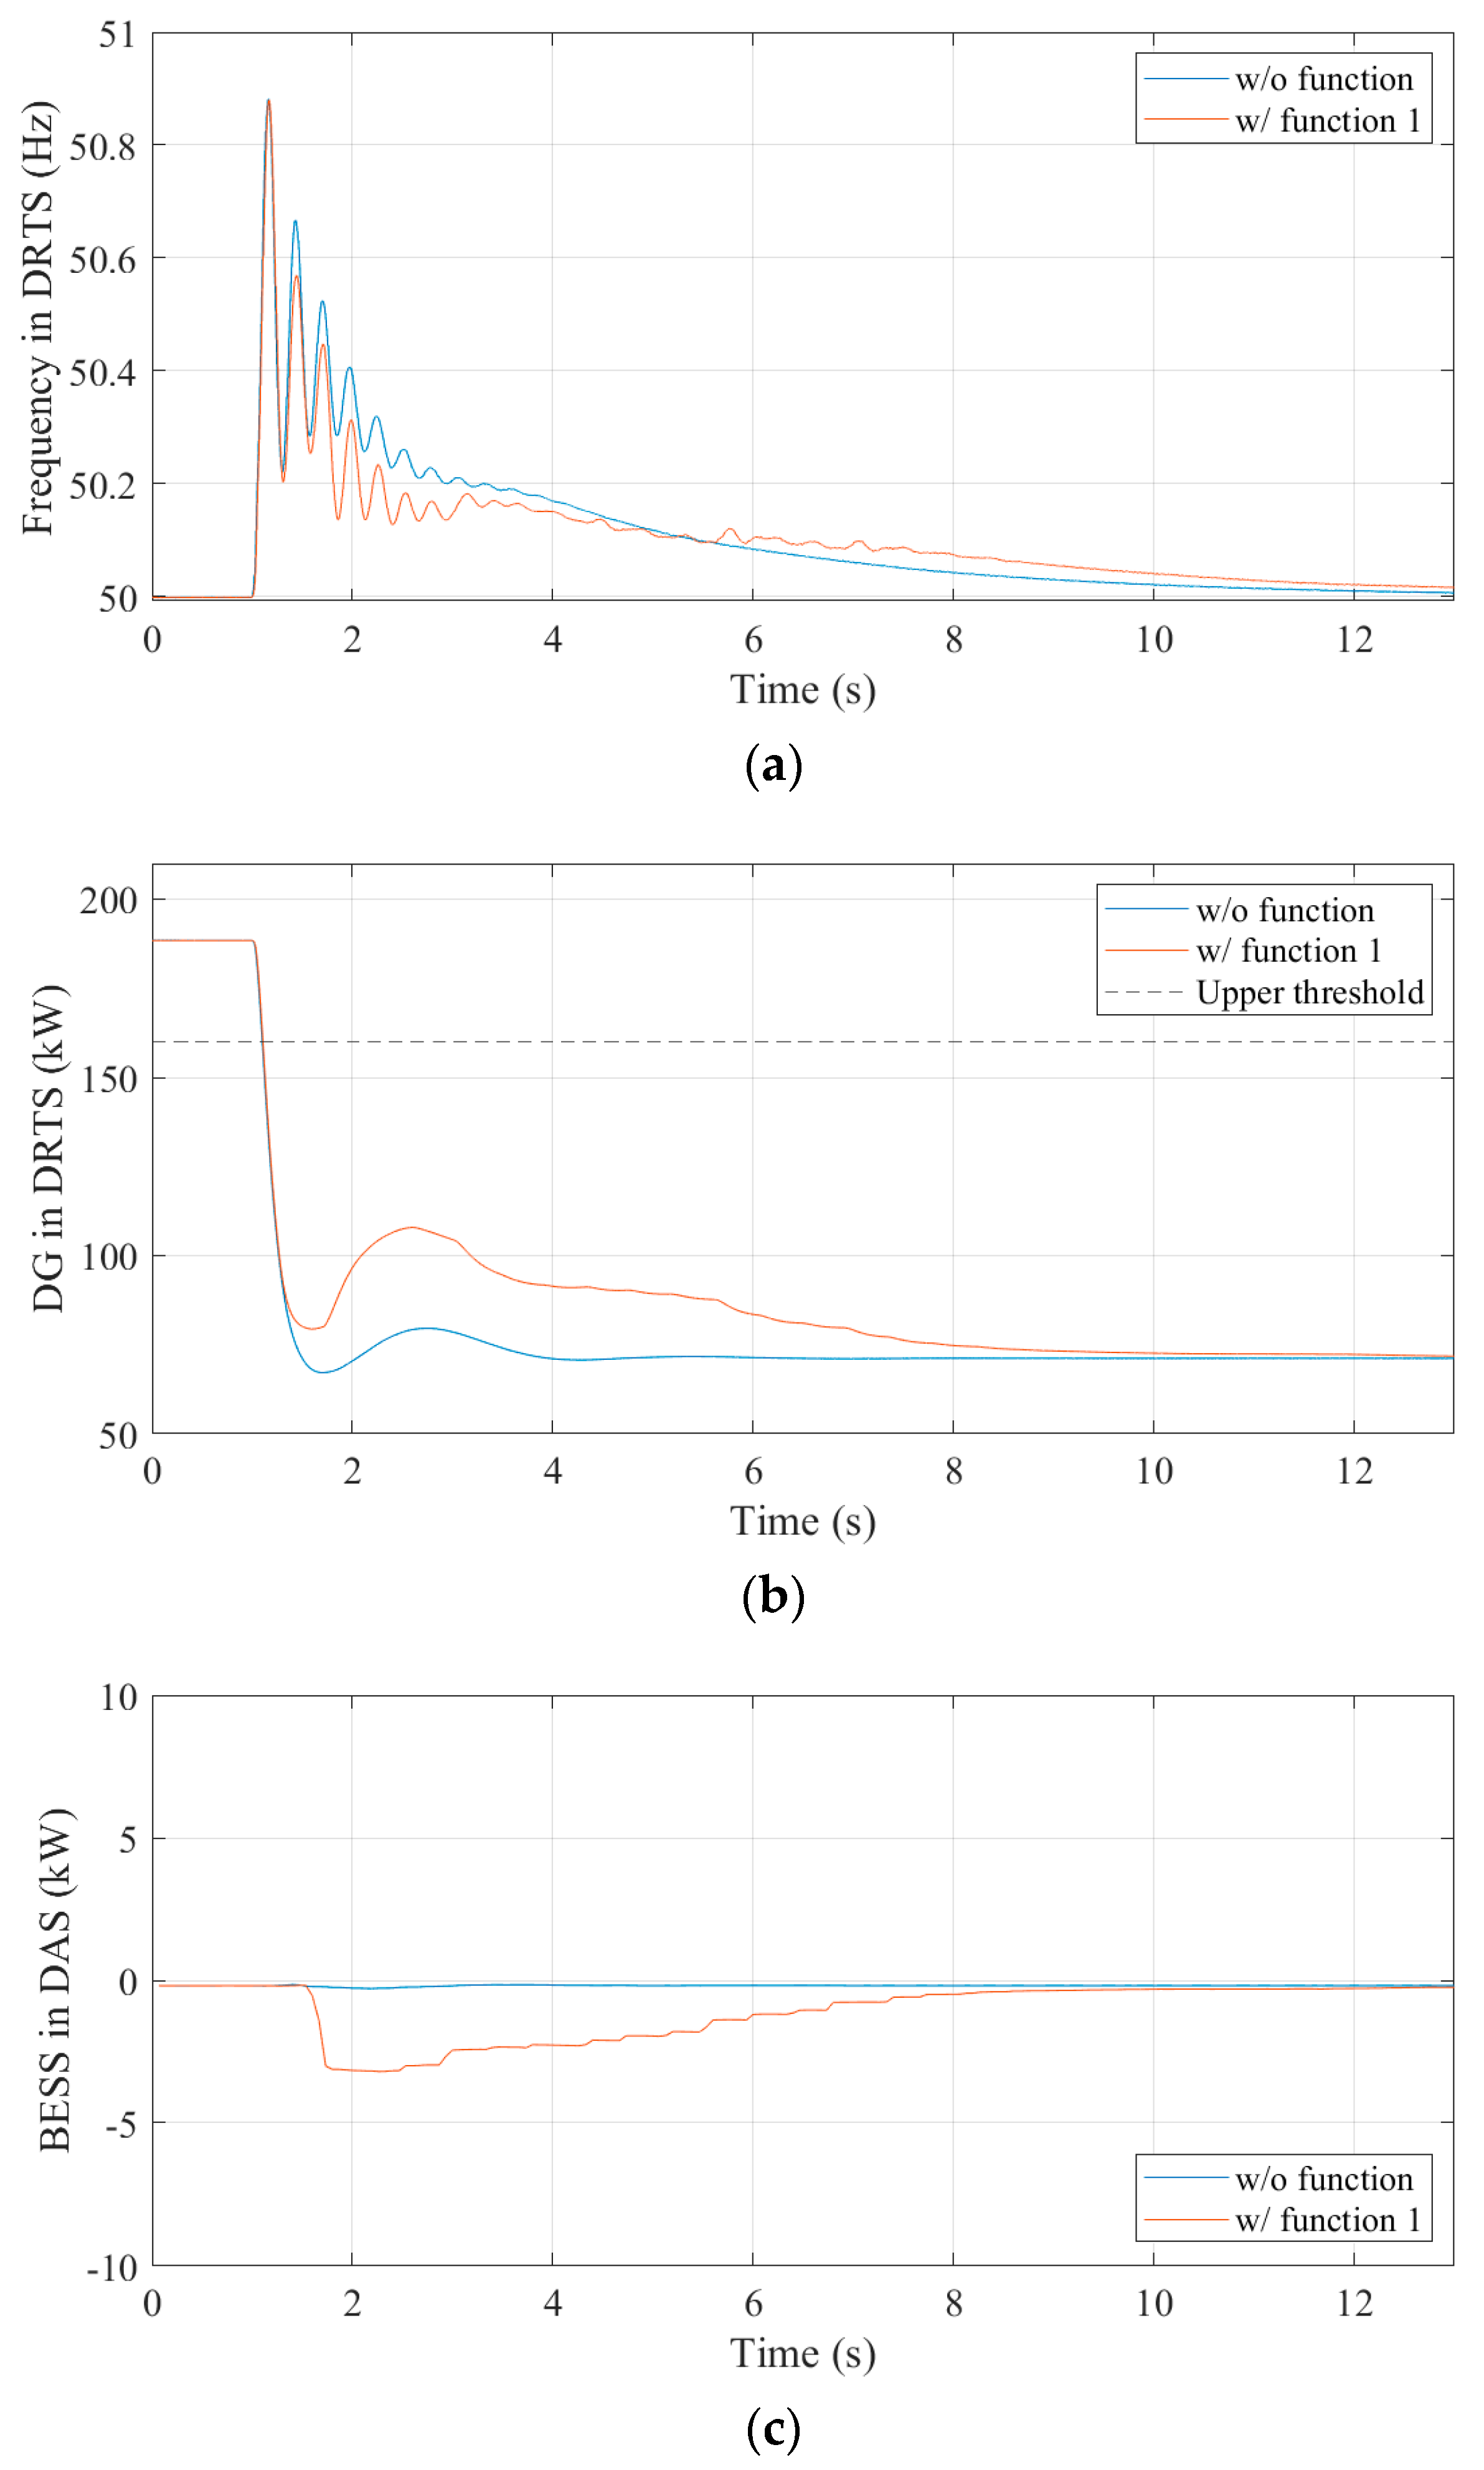
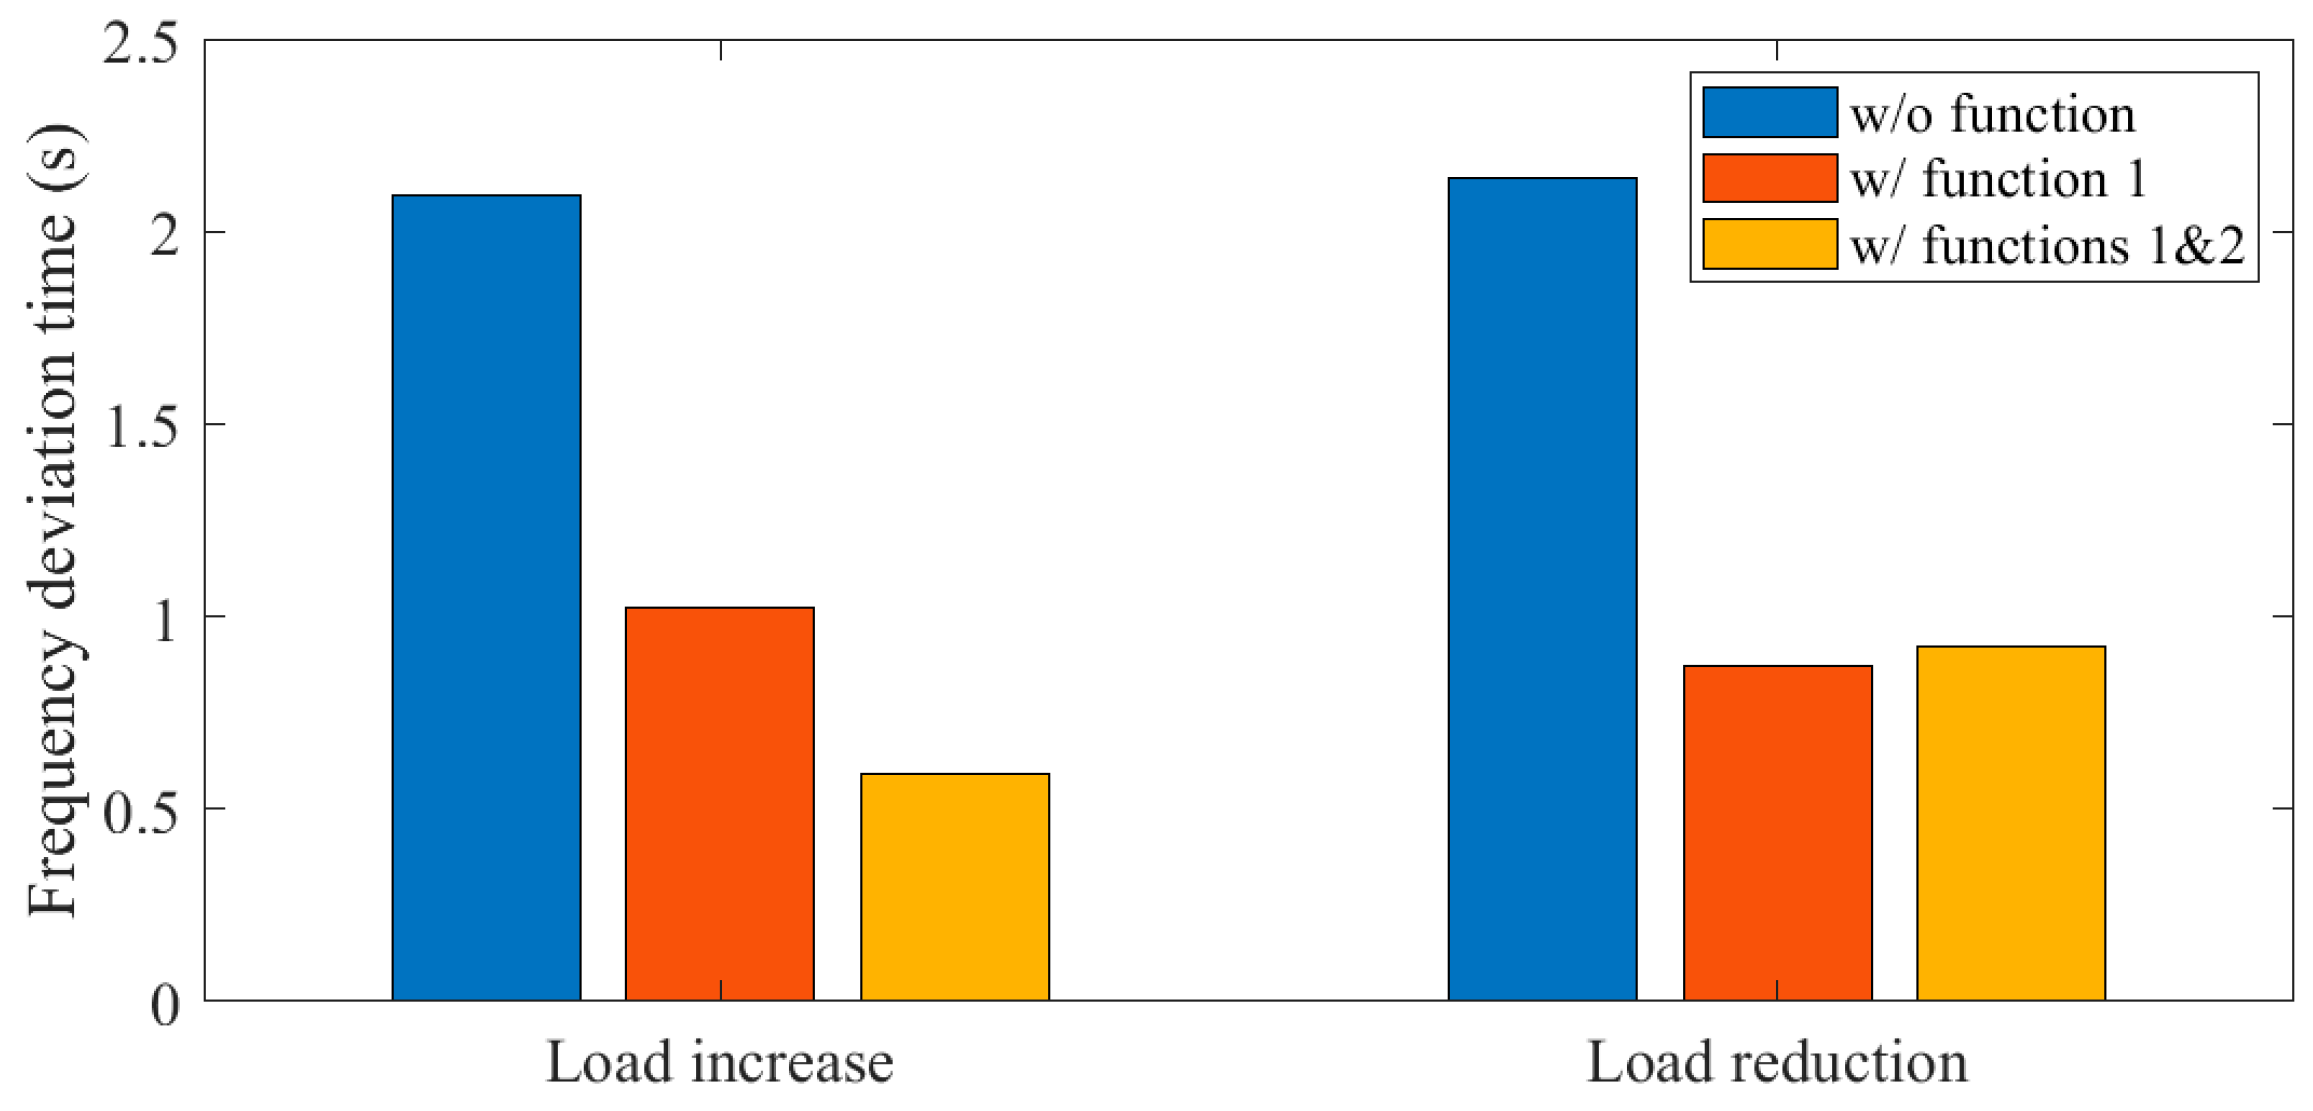
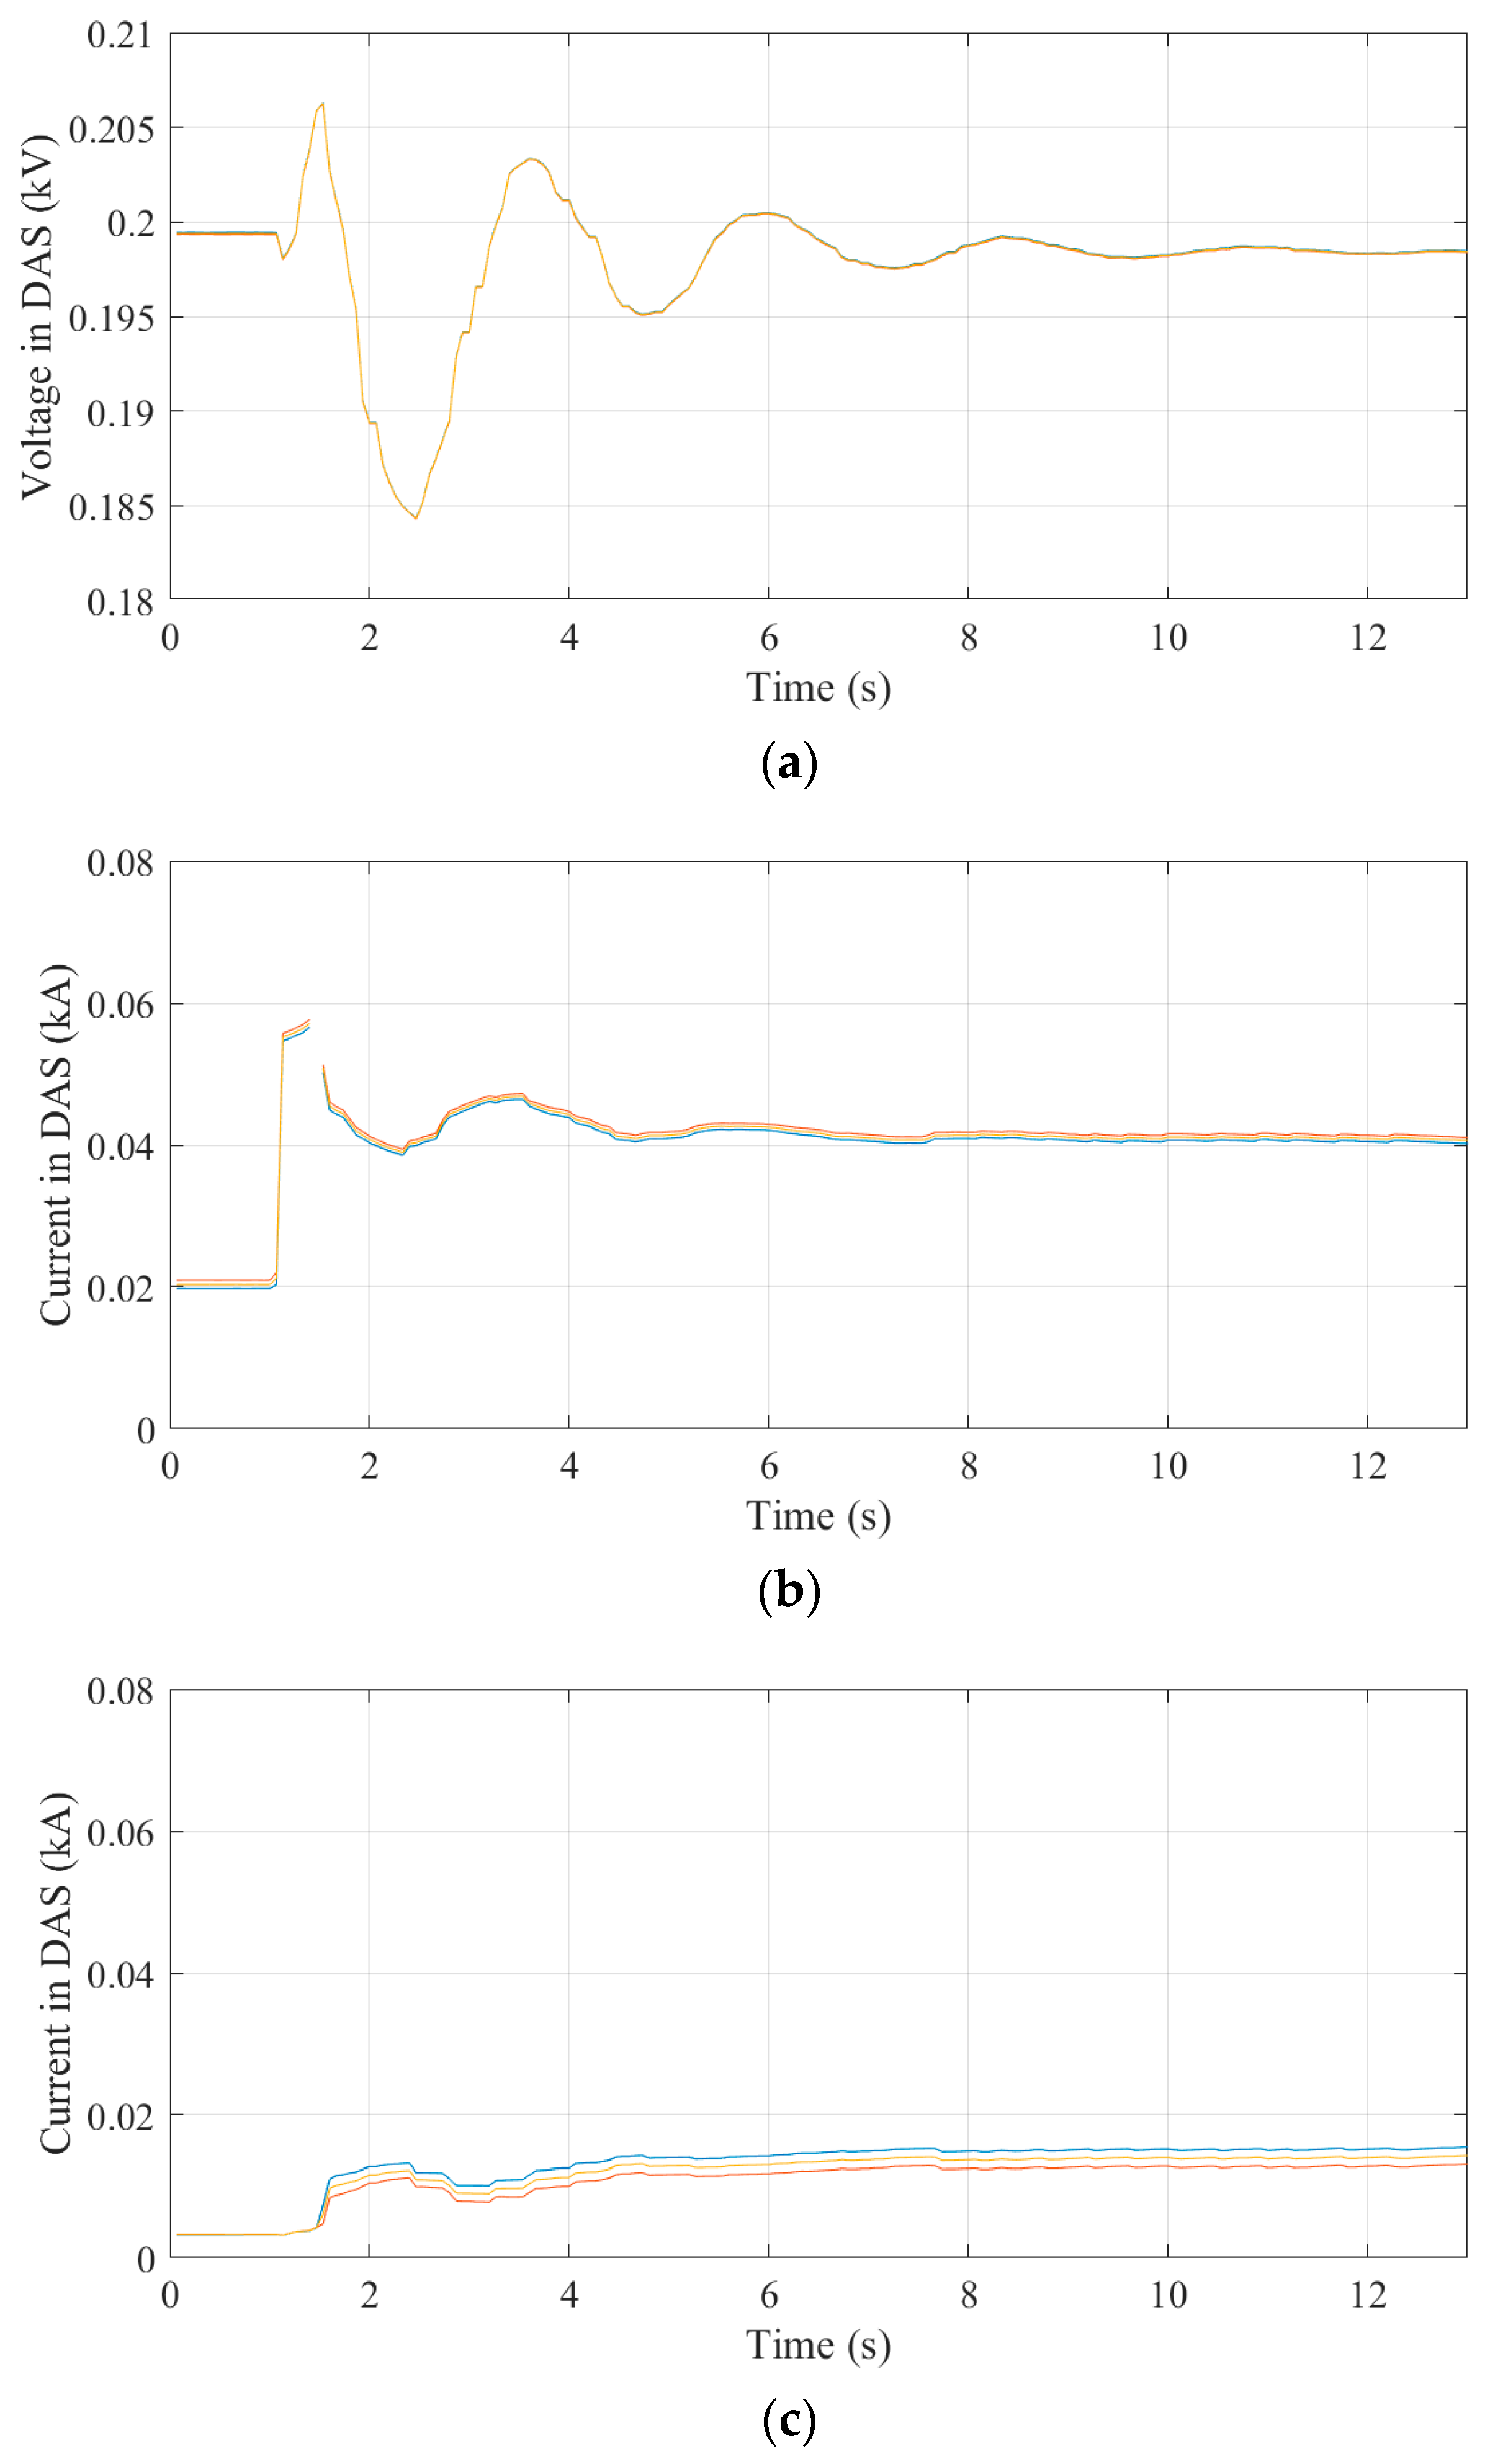
5.1. Testing Results When Function 1 Is Only Activated

Figure 6 shows the testing results of a load increase event with and without function 1, which support to maintain the frequency around the nominal one by controlling the BESS. The load is initially set to 7 kW. The DG set meets all of the demand (70 kW inside the DRTS), and the frequency value is at 50 Hz. When time t = 1.0 s, the load is increased to 19 kW. The frequency profiles, shown in Figure 6a, indicate that frequency deviation from the nominal frequency is mitigated after the second to the third swing by activating function 1. The frequency stays beyond 49.8 Hz for 1.02 seconds with function 1, while it takes 2.09 s without one. Figure 6b,c show the output of DG set and BESS. It can be found that the mitigation of frequency swing is caused by the BESS discharging control, which results in supporting the DG set control based on the command from the microgrid controller. Since function 2 is not activated in this test, the higher boundary for the output of DG set is exceeded.
Figure 7 shows the similar test results regarding a load decrease event. The load is initially set to 19 kW. The DG set meets all of the demand (190 kW inside the DRTS), and the value of operation frequency is at 50 Hz. When time t = 1.0 s, the load is reduced to 7 kW. Figure 7a shows that function 1 can mitigate the frequency deviation from the nominal frequency after the second swing. When function 1 is implemented, the frequency value is higher than 50.2 Hz for 0.87 s. Otherwise, 2.14 s of recovery time is required. The effect of BESS charging control commanded from the microgrid controller, which mitigates the frequency fluctuation, can be observed in Figure 7b,c.

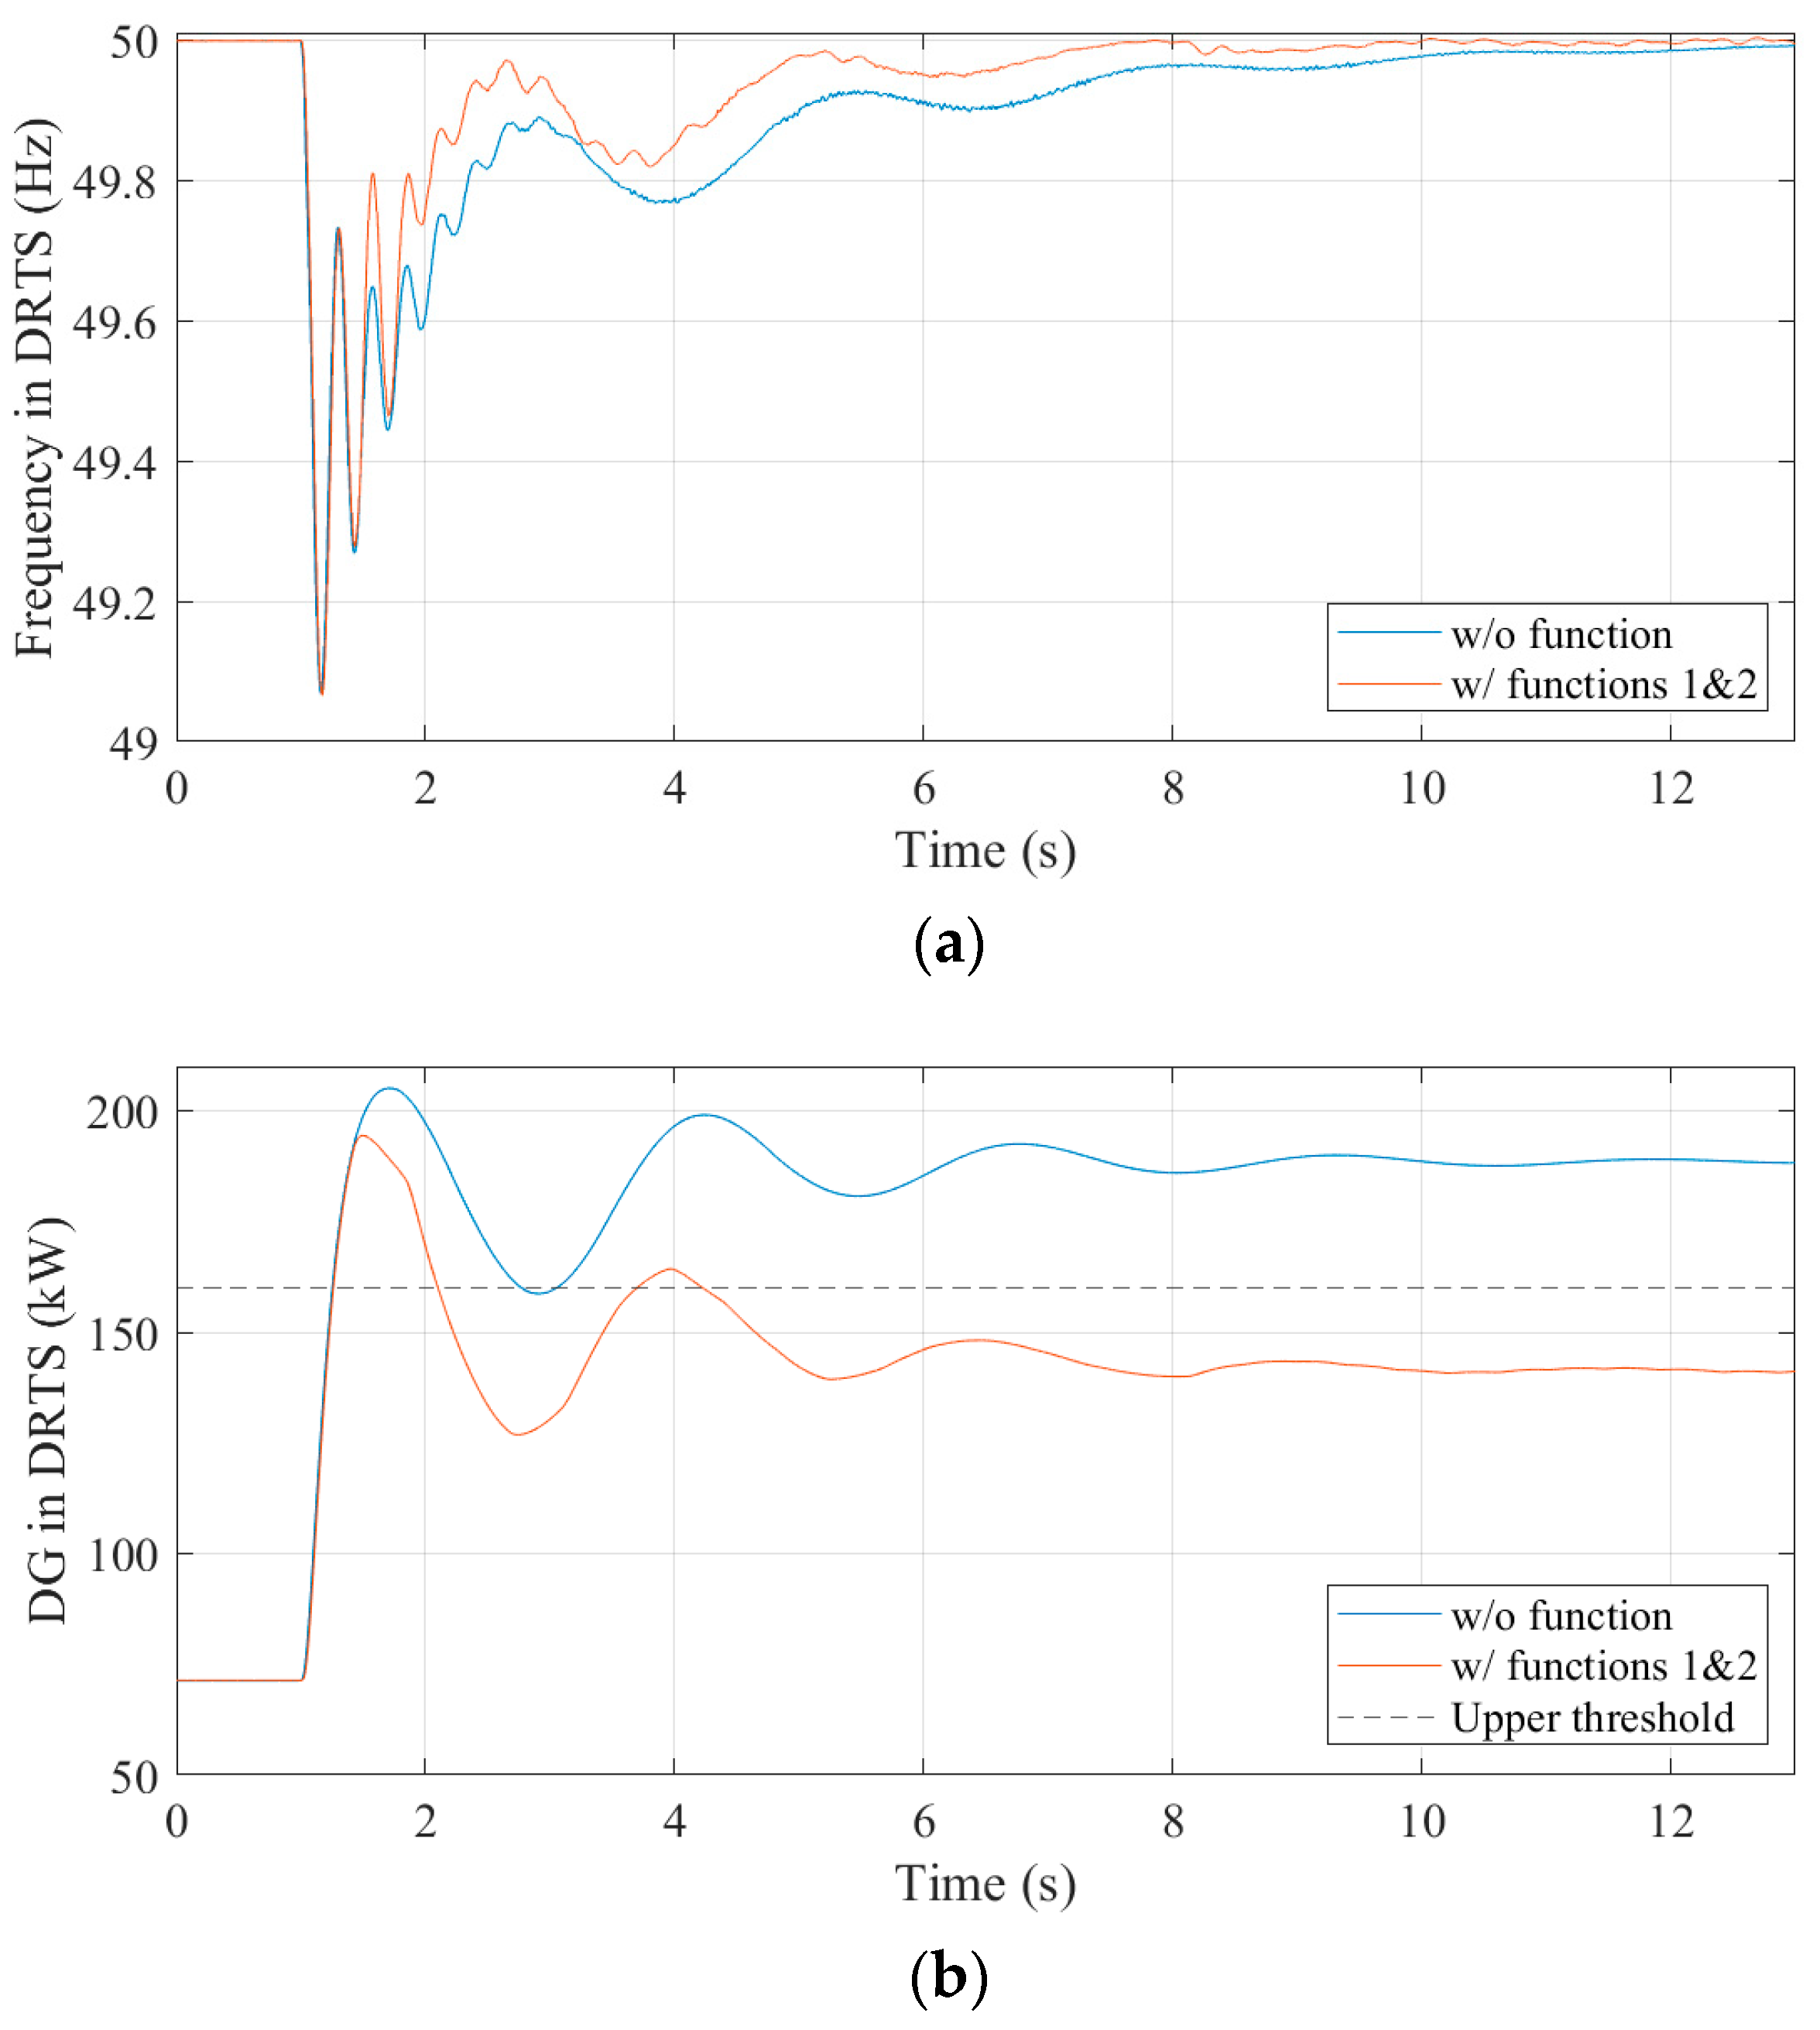
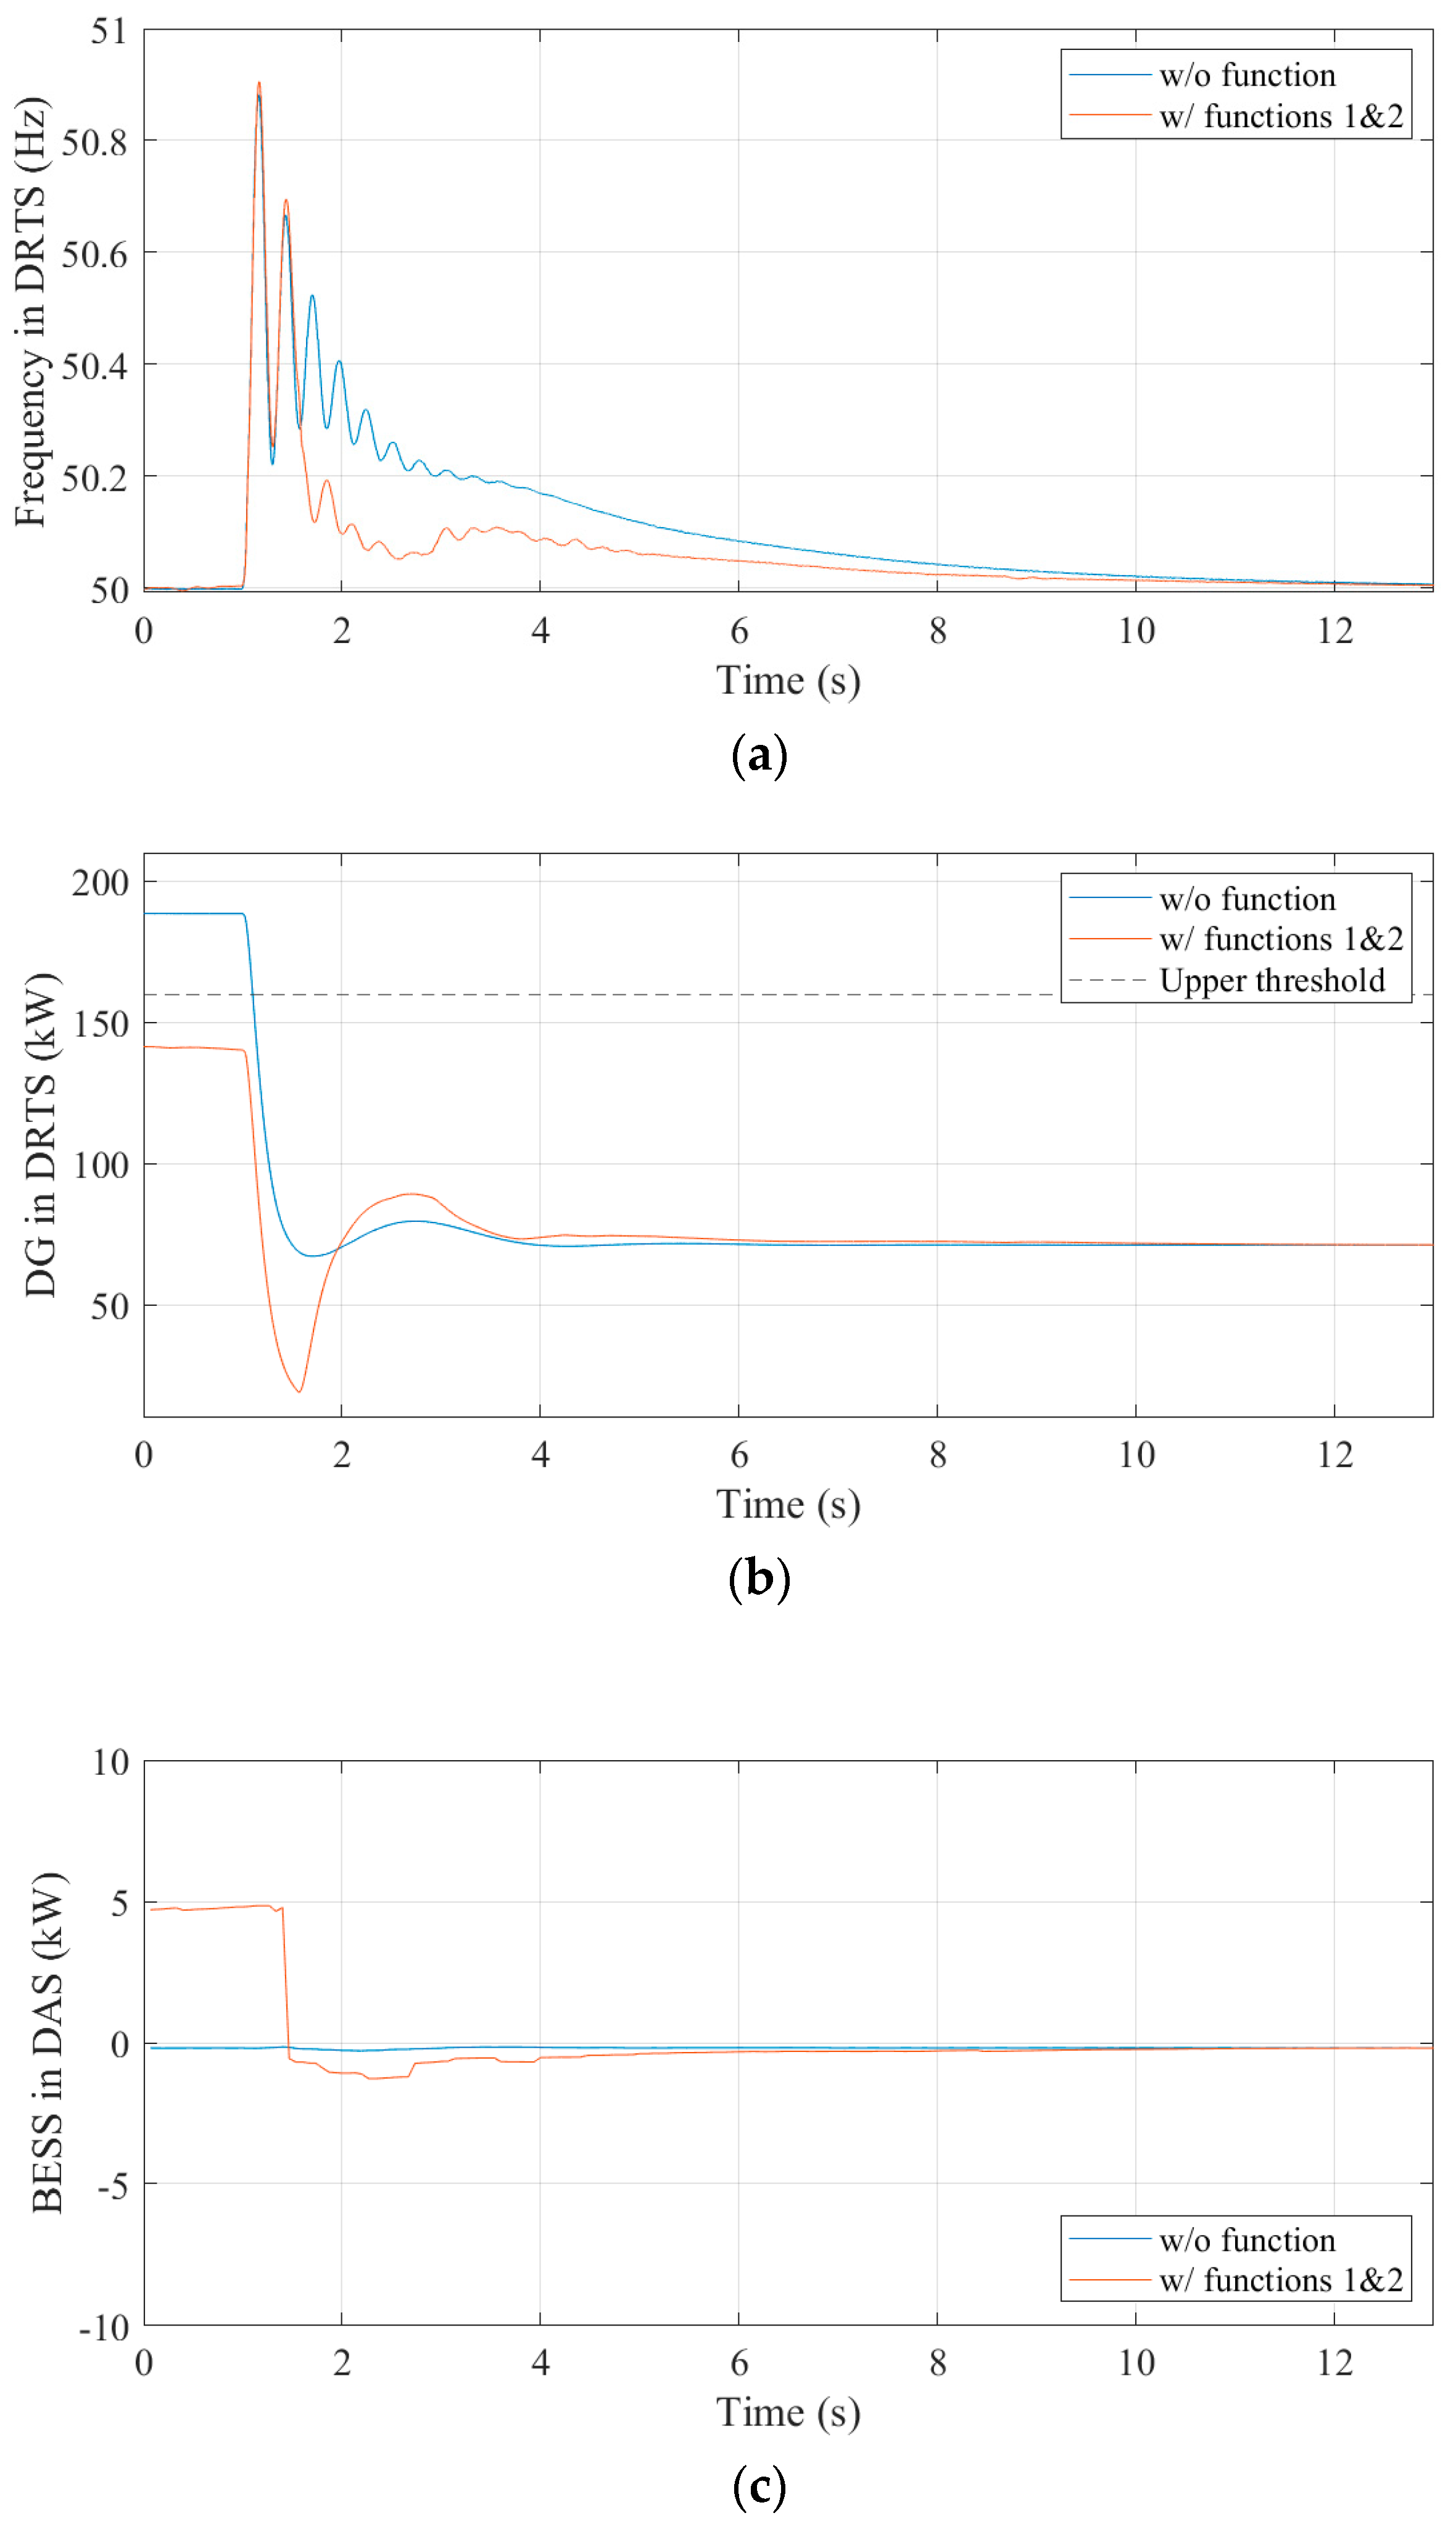
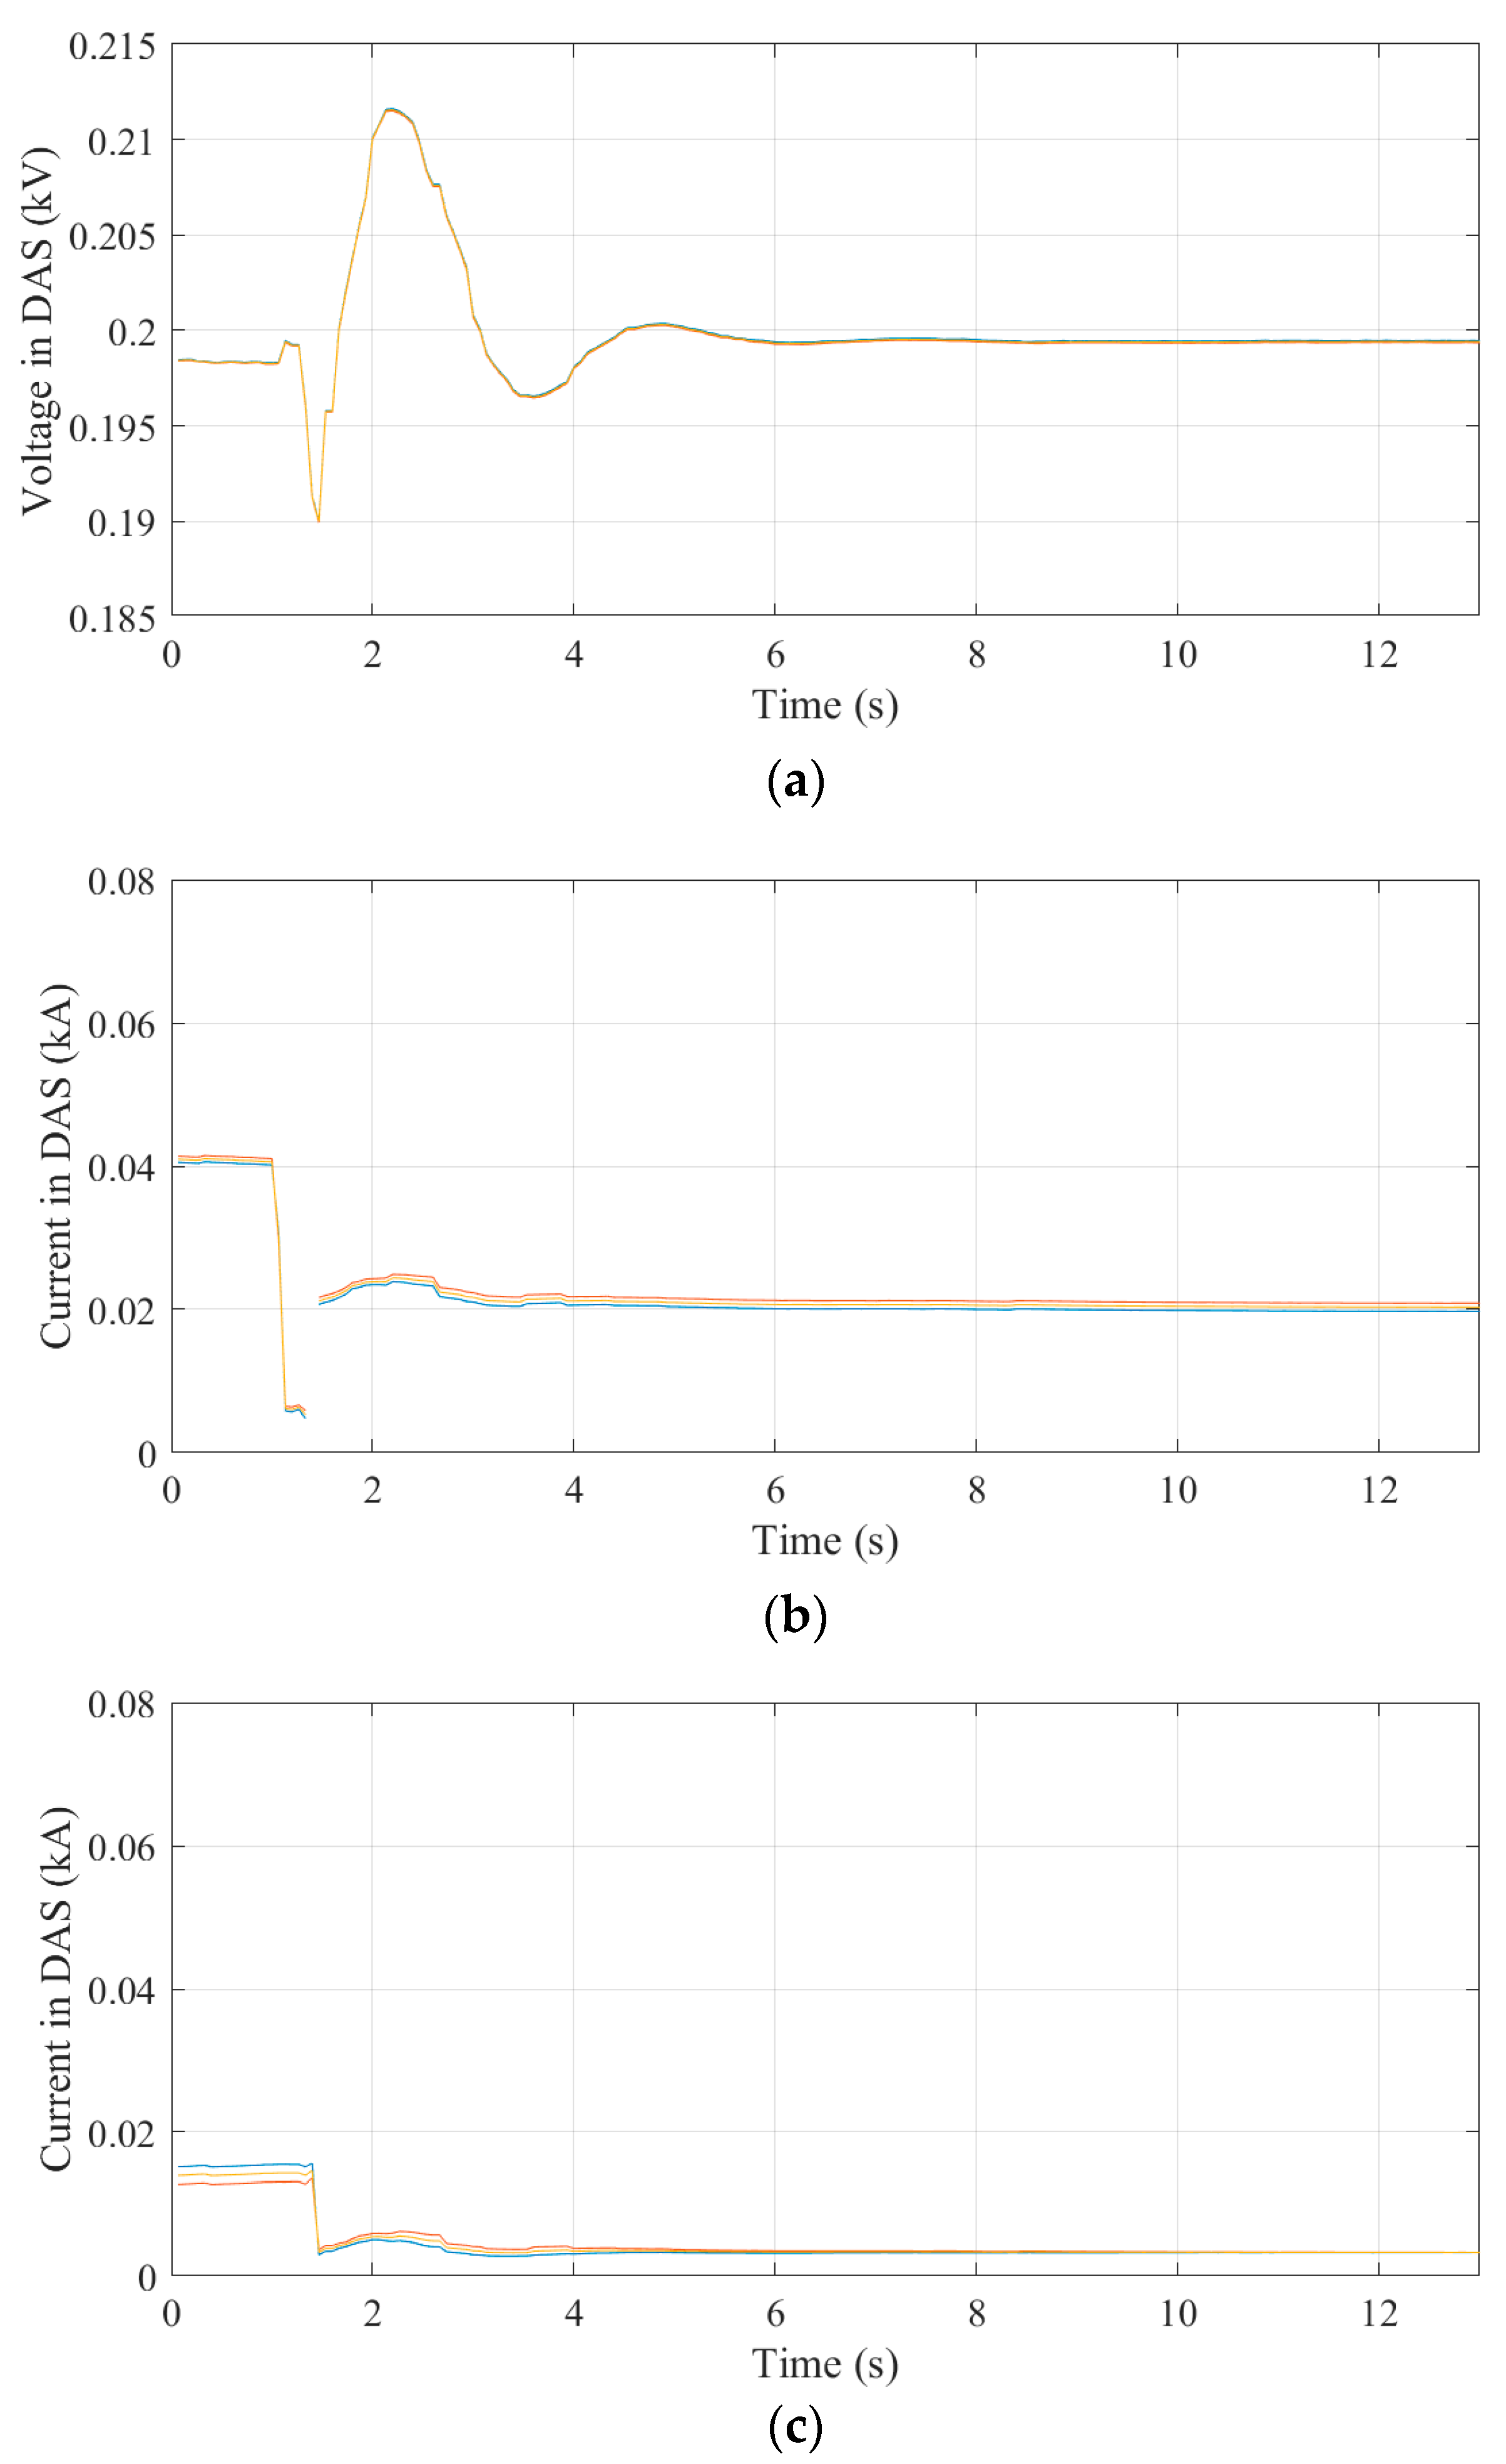
5.2. Testing Results When Both Functions 1 and 2 Are Activated

Figure 8 shows the testing results of a load increase event when both functions 1 and 2 are activated and not activated. The load is initially set to 7 kW. The DG set meets all of the demand (70 kW inside the DRTS) and keeps a frequency at 50 Hz. When time t = 1.0 s, the load value is increased to 19 kW. Figure 8a shows frequency variation with and without the functions. It suggests that the frequency fluctuation is mitigated after the second to the third swing due to the functions. The frequency stays beyond 48.9 Hz for 0.59 s with the functions, while it takes 2.09 s without any function. This result suggests that the frequency nevertheless mitigated the activation of function 2. Then, comparing Figure 8b with Figure 6b, the DG set output is reduced and maintained lower than the upper threshold by additional activation of function 2. The upper threshold is set to prevent the output of the DG set from requiring generation exceeding its capacity. Although the assumed value here would be lower than the realistic value, the test condition is sufficient to confirm the intended reaction of the microgrid controller. Comparison of Figure 8c and Figure 6c clarifies the difference of BESS control contributions. The discharging amount of the BESS increases by function 1 and stays on around 5 kW by function 2 in Figure 8c, while it gradually decreases along to the reduction of the frequency fluctuation in Figure 6c.
Figure 9 shows the similar testing results regarding a load decrease event. The load is initially set to 19 kW. The BESS provides 5 kW (50 kW in the DRTS) due to function 2 so that the DG set output is not over the upper threshold. The DG set supplies the remaining power 14 kW (140 kW inside the DRTS) with 50 Hz frequency. When time t = 1.0 s, the load value is reduced to 7 kW. Figure 9a shows the frequency variation with and without the functions. Similarly, it suggests that the frequency fluctuation is mitigated after the third swing by implementation of the functions. The frequency value stays above 50.2 Hz for 0.92 s when the functions are on and 2.13 s otherwise. This result suggests that the frequency nevertheless mitigated activation of function 2. Figure 9b,c show that the BESS discharging due to function 2 becomes zero after the load reduction, and the DG set output becomes lower than the threshold. For more detailed information, the voltage and the current measurements are shown in Appendix A.
Figure 10 summarizes the time duration that frequency deviation from the nominal frequency 50 Hz is larger than 0.2 Hz. The time duration is reduced by implementation of function 1 in both load change events. Furthermore, the additional activation of function 2 provides equal or better effect on the frequency deviation. These results as well as Figure 6b, Figure 7b, Figure 8b and Figure 9b, which show the validity of function 2, indicate functions 1 and 2 of the microgrid controller are valid, even when both functions are simultaneously activated.

6. Conclusions

Flexible testing capabilities are required to account for more dynamic power systems of the future. This means the conventional laboratory testing setups have become too limited, as they have specific configurations and ratings. The simulation is very flexible, yet the results are not as reliable. The PHIL testing technology is a solution that address these issues. It gives the necessary adaptable nature to test labs while keeping the test results as close as possible to real life. In this paper, a PHIL testing was performed to validate the operation of a microgrid controller. The main contribution of this paper was to configure the PHIL environment that:
  • can validate the communication between microgrid controller and components as well as the power interaction among microgrid components;
  • scales the power rating between physical and simulated DUT for compensating the difference between the deployment site and the laboratory.
Necessary steps of the PHIL modeling and interface were presented. Two main functions of the controller, which stabilize the frequency and maintain the DG set’s output within the certain limits by controlling the BESS, were investigated. The testing results validated the functions when a single function was independently activated as well as when both functions were simultaneously activated. Furthermore, it was shown that the built PHIL testing environment is capable of handling testing with a resolution of 100 milliseconds. These results lead us to the conclusion that other power system control or generator dispatch studies can be performed with the proposed PHIL setup. Building on the obtained results herein, a faster frequency control capability is being developed and will be integrated with the microgrid controller. The other functions of the microgrid controller are based on the power dispatching for supporting microgrid operations such as PV curtailment and peak shaving. They could be tested in the proposed PHIL configuration.

Author Contributions

Conceptualization, H.K. and K.S.; methodology, H.K. and K.S.; software, H.K. and K.S.; validation, H.K., M.S., S.S., T.S.U., K.S., R.Y., K.W. and T.S.; formal analysis, H.K., M.S., S.S., T.S.U., K.S., R.Y., K.W. and T.S.; investigation, H.K., M.S., S.S., T.S.U., K.S., R.Y., K.W. and T.S.; resources, H.K., M.S., S.S., K.S., R.Y., K.W. and T.S.; data curation, H.K., M.S., S.S., T.S.U., K.S., R.Y. and K.W.; writing—original draft preparation, H.K. and T.S.U.; writing—review and editing, J.H., K.O., T.S.U. and K.S.; visualization, H.K.; project administration, H.K., T.S.U., J.H., K.O., K.S. and T.S.; funding acquisition, J.H. and K.O. All authors have read and agreed to the published version of the manuscript.

Funding

This research was funded by Support Program for Development and Industrialization of Renewable Energy Related Technologies of Companies in Disaster Areas, FY 2019.

Conflicts of Interest

The authors declare no conflict of interest.

Appendix A

Figure A1 and Figure A2 show the supplemental figures of Figure 8 and Figure 9. These figures describe the voltage and the current measurements of the DG set and BESS. Since they are connected to the same bus, the voltage profiles are almost identical; therefore, only voltage measured at the BESS terminal is shown.
Figure A1. Voltage and current measurements when functions 1 and 2 are activated (load increase from 7 kW to 19 kW): (a) line-to-line bus voltages; (b) line currents of DG set; (c) line currents of BESS.
Energies 13 02044 g0a1
Figure A2. Test results when functions 1 and 2 are activated (load reduction from 19 kW to 7 kW): (a) line-to-line bus voltages; (b) line currents of DG set; (c) line currents of BESS.
Energies 13 02044 g0a2

References

  1. Almeshqab, F.; Ustun, T.S. Lessons learned from rural electrification initiatives in developing countries: Insights for technical, social, financial and public policy aspects. Renew. Sustain. Energy Rev. 2019, 102, 35–53. [Google Scholar] [CrossRef]
  2. Energy Access Outlook 2017; IEA: Paris, France, 2017; ISBN 9789264285569.
  3. National Energy Roadmaps for Islands; IRENA: Abu Dhabi, UAE, 2017.
  4. Hubble, A.H.; Ustun, T.S. Scaling renewable energy based microgrids in underserved communities: Latin America, South Asia, and Sub-Saharan Africa. In Proceedings of the 2016 IEEE PES PowerAfrica, Livingstone, Zambia, 29 June–3 July 2016. [Google Scholar]
  5. 2030.7-2017—IEEE Standard for the Specification of Microgrid Controllers; IEEE: New York, NY, USA, 2018; ISBN 9781504445153.
  6. 2030.8-2018—IEEE Standard for the Testing of Microgrid Controllers; IEEE: New York, NY, USA, 2018; ISBN 9781504450508.
  7. Hashimoto, J.; Rodríguez-Seco, J.E.; Merino, J.; Perez-Basante, A.; Jimeno, J.; Strasser, T.I.; Seitl, C.; Messner, C. Testing of Microgrid Control Systems According to IEEE 2030.8—Experiences and Learnings from Laboratory Tests. 36th Eur. Photovolt. Sol. Energy Conf. Exhib. 2019, 1357–1362. [Google Scholar] [CrossRef]
  8. Olivares, D.E.; Mehrizi-Sani, A.; Etemadi, A.H.; Canizares, C.A.; Iravani, R.; Kazerani, M.; Hajimiragha, A.H.; Gomis-Bellmunt, O.; Saeedifard, M.; Palma-Behnke, R.; et al. Trends in Microgrid Control. IEEE Trans. Smart Grid 2014, 5, 1905–1919. [Google Scholar] [CrossRef]
  9. Salcedo, R.; Corbett, E.; Smith, C.; Limpaecher, E.; Rekha, R.; Nowocin, J.; Lauss, G.; Fonkwe, E.; Almeida, M.; Gartner, P.; et al. Banshee distribution network benchmark and prototyping platform for hardware-in-the-loop integration of microgrid and device controllers. J. Eng. 2019, 2019, 5365–5373. [Google Scholar] [CrossRef]
  10. Meng, L.; Luna, A.; Diaz, E.; Sun, B.; Dragicevic, T.; Savaghebi, M.; Vasquez, J.; Guerrero, J.; Graells, M. Flexible System Integration and Advanced Hierarchical Control Architectures in the Microgrid Research Laboratory of Aalborg University. IEEE Trans. Ind. Appl. 2015, 52, 1736–1749. [Google Scholar] [CrossRef] [Green Version]
  11. Akagi, S.; Takahashi, R.; Kaneko, A.; Yoshinaga, J.; Ito, M.; Hayashi, Y.; Asano, H.; Konda, H. Upgrading the voltage control method based on the photovoltaic penetration rate. IEEE Trans. Smart Grid 2018, 9, 3994–4003. [Google Scholar] [CrossRef]
  12. Huerta, F.; Gruber, J.K.; Prodanovic, M.; Matatagui, P. Power-hardware-in-the-loop test beds: Evaluation tools for grid integration of distributed energy resources. IEEE Ind. Appl. Mag. 2016, 22, 18–26. [Google Scholar] [CrossRef]
  13. Kikusato, H.; Shimizu, T.; Ustun, T.S.; Suzuki, M.; Sugahara, S.; Hashimoto, J.; Otani, K.; Shirakawa, K.; Yabuki, R.; Watanabe, K. Integrated Power Hardware-in-the-Loop and Lab Testing for Microgrid Controller. In Proceedings of the 2019 IEEE Innovative Smart Grid Technologies—Asia (ISGT Asia), Chengdu, China, 21–24 May 2019; pp. 2743–2747. [Google Scholar]
  14. Xiao, B.; Starke, M.; Liu, G.; Ollis, B.; Prabakar, K.; Dowling, K.; Xu, Y. Development of hardware-in-the-loop microgrid testbed. In Proceedings of the 2015 IEEE Energy Conversion Congress and Exposition (ECCE), Montreal, QC, Canada, 20–24 September 2015; pp. 1196–1202. [Google Scholar]
  15. Huo, Y.; Gruosso, G. Hardware-in-the-Loop Framework for Validation of Ancillary Service in Microgrids: Feasibility, Problems and Improvement. IEEE Access 2019, 7, 58104–58112. [Google Scholar] [CrossRef]
  16. Oh, S.-J.; Yoo, C.-H.; Chung, I.-Y.; Won, D.-J. Hardware-in-the-Loop Simulation of Distributed Intelligent Energy Management System for Microgrids. Energies 2013, 6, 3263. [Google Scholar] [CrossRef]
  17. Wang, J.; Miller, B.; Pratt, A.; Fossum, J.; Bialek, T.; Manson, S.; Symko-Davies, M. Diesel Generator Controller Evaluation via Controller-Hardware-in-the-Loop for Various Microgrid Operation Modes. In Proceedings of the 2019 IEEE Power & Energy Society Innovative Smart Grid Technologies Conference (ISGT), Washington, DC, USA, 18–21 February 2019; pp. 1–5. [Google Scholar]
  18. Mentesidi, K.; Rikos, E.; Kleftakis, V.; Kotsampopoulos, P.; Santamaria, M.; Aguado, M. Implementation of a microgrid model for DER integration in real-time simulation platform. In Proceedings of the 2014 IEEE 23rd International Symposium on Industrial Electronics (ISIE), Istanbul, Turkey, 1–4 June 2014; pp. 2274–2279. [Google Scholar]
  19. Kotsampopoulos, P.; Lagos, D.; Hatziargyriou, N.; Faruque, M.O.; Lauss, G.; Nzimako, O.; Forsyth, P.; Steurer, M.; Ponci, F.; Monti, A.; et al. A Benchmark System for Hardware-in-the-Loop Testing of Distributed Energy Resources. IEEE Power Energy Technol. Syst. J. 2018, 5, 94–103. [Google Scholar] [CrossRef]
  20. Kakigano, H.; Hiraiwa, T.; Fujiwara, H.; Miura, Y.; Ise, T. An analysis method of a DC microgrid using hardware-in-the-loop simulation. In Proceedings of the 2012 IEEE 13th Workshop on Control and Modeling for Power Electronics (COMPEL), Kyoto, Japan, 10–13 June 2012; pp. 1–6. [Google Scholar]
  21. Kotsampopoulos, P.C.; Kleftakis, V.A.; Hatziargyriou, N.D. Laboratory Education of Modern Power Systems Using PHIL Simulation. IEEE Trans. Power Syst. 2017, 32, 3992–4001. [Google Scholar] [CrossRef]
  22. Wang, J.; Song, Y.; Li, W.; Guo, J.; Monti, A. Development of a Universal Platform for Hardware In-the-Loop Testing of Microgrids. IEEE Trans. Ind. Inform. 2014, 10, 2154–2165. [Google Scholar] [CrossRef]
  23. Ustun, T.S.; Nakamura, Y.; Hashimoto, J.; Otani, K. Performance analysis of PV panels based on different technologies after two years of outdoor exposure in Fukushima, Japan. Renew. Energy 2019, 136, 159–178. [Google Scholar] [CrossRef]
  24. Nippon Koei Develops Storage Battery Control System for Controlling Power Frequency Commencement of Balancing Services in the U.K. from 2018; Nippon Koei Co., Ltd.: Tokyo, Japan, 2018.
  25. Milano, F.; Florian, D.; Eth, Z.; Hill, D.J.; Verbič, G. Foundations and Challenges of Low-Inertia Systems. In Proceedings of the 2018 Power Systems Computation Conference (PSCC), Dublin, Ireland, 11–15 June 2018. [Google Scholar]
Figure 1. Aerial photo of power system related testing facilities in Fukushima Renewable Energy Institute, AIST (FREA) (source: Google Maps).
Energies 13 02044 g001
Figure 2. Test lab configuration.
Energies 13 02044 g002
Figure 3. Digital real-time simulation (DRTS) and devices under test (DUT) interface set up.
Energies 13 02044 g003
Figure 4. Microgrid configuration. The microgrid controller follows outputs of diesel generator (DG) set, battery energy storage system (BESS), photovoltaic (PV), and load and commands to PV and BESS according to functions 1 and 2.
Energies 13 02044 g004
Figure 5. Power-hardware-in-the-loop (PHIL) testing setup for the microgrid controller in the test lab. The limitation of lab equipment is removed by integrating test lab with DRTS as PHIL environment.
Energies 13 02044 g005
Figure 6. Function 1 results (load increase from 7 kW to 19 kW): (a) frequency; (b) DG set output; (c) BESS output. Note that 10 times scaled measurement of actual lab equipment output, i.e., BESS and load, is fed back to the DRTS in this PHIL simulation.
Energies 13 02044 g006
Figure 7. Function 1 test results (load reduction from 19 kW to 7 kW): (a) frequency; (b) DG set output; (c) BESS output. Note that 10 times scaled measurement of actual lab equipment output, i.e., BESS and load, is fed back to the DRTS in this PHIL simulation.
Energies 13 02044 g007
Figure 8. Test results when functions 1 and 2 are activated (load increase from 7 kW to 19 kW): (a) frequency; (b) DG set output; (c) battery output. Note that 10 times scaled measurement of actual lab equipment output, i.e., BESS and load, is fed back to the DRTS in this PHIL simulation.
Energies 13 02044 g008aEnergies 13 02044 g008b
Figure 9. Test results when functions 1 and 2 are activated (load reduction from 19 kW to 7 kW): (a) frequency; (b) DG set output; (c) battery output. Note that 10 times scaled measurement of actual lab equipment output, i.e., BESS and load, is fed back to the DRTS in this PHIL simulation.
Energies 13 02044 g009
Figure 10. Time duration that frequency deviation from the nominal frequency 50 Hz is larger than 0.2 Hz.
Energies 13 02044 g010
Table 1. Microgrid components.
Real Rating
(in DRTS)
Lab Equipment
CapacityTested Rating (Scaled)
DG Set225 (kW)30 (kW)22.5 (kW)
PV System50 (kW)10 (kW)5 (kW)
Load250 (kW)250 (kW)25 (kW)
BESS100 (kW)50 (kW)10 (kW)

