Abstract
A variety of greenhouse gas reduction scenarios have been proposed around the world to ensure sustainable developments and strengthen the global response to the climate change. To cope with this, it is urgently needed to reduce the amount of energy used for the heating, ventilating, air conditioning, and refrigerating (HVAC&R) systems in large buildings. This study discusses the reduction of cooling energy in large office buildings through the minimization of changes in components and equipment, such as heat source equipment and pumps, changes in the layout and operating methods of chilled water circulation pumps, and changes in the temperatures of chilled and condenser water. To do this, this study targeted an entire cooling system consisting of a hydronic system, a chiller, and a cooling tower, and conducted a quantitative analysis of the energy consumption and of the reduction achieved through a change in the pumping system type in the cooling system and a change in the Korean standard design and temperature of chiller and cooling tower via EnergyPlus simulations. The simulation results showed a cooling energy reduction of 103.2 MWh/yr, around 15.7%, where the primary constant-speed system (Case A) was changed to a primary variable-speed pump (Case B) in the configuration with a chilled water circulation pump. To reduce the cooling energy further, annually 142.3 MWh, around 21.7%, Case C in this study changed the outlet temperature of the chiller and temperature difference from 7 °C, 5 K to 9 °C, 9 K. Finally, when applying a change in the condenser water production temperature from 32 to 23.9 °C in accordance with ASHRAE Standard 90.1 for Case D, a cooling energy saving of 182.4 MWh/yr was observed, which is about 27.8%.
1. Introduction
1.1. Background of the Study
The Intergovernmental Panel on Climate Change (IPCC) proposes various greenhouse gas reduction scenarios for limiting the increase of global temperature to 1.5 °C above pre-industrial levels. They also suggest related global greenhouse gas emission pathways, in the context of strengthening the global response to the threat of climate change, sustainable development, and efforts to eradicate poverty [1]. South Korea has raised the reduction goal of greenhouse gas emissions from 25.7% to 32.5% in accordance with the 37% below business-as-usual (BAU) by 2030 goal. The carbon emission from the building sector accounts for 32.7% of the greenhouse gas emitted in South Korea [2]. The energy consumption due to electrification has continued in large-size buildings in South Korea. As a result, the ratio of power proportion has raised from 43% in 2004 to 56% in 2016 in such buildings. The heating, ventilating, air conditioning, and refrigerating (HVAC&R) system accounts for 55% of all energy consumption, out of which, around 21.7% is consumed by cooling energy [3]. Thus, it is urgently necessary to reduce the amount of energy that cooling consumes among HVAC&R systems in large-sized buildings to achieve the goal set by the government.
To reduce the heat source and transport energy in HVAC&R systems, it is necessary to prevent unnecessary cooling and heating operations, stabilize the system, reduce transport energy, and facilitate the improvement of heat source efficiency by controlling flow and pressure in the cool and hot water distribution system in response to the load change. However, although the primary-secondary configuration, which is simple and well-known to engineers, is widely used, it has been generally employed in the design of hydronic systems of chilled water plants [4,5]. Most primary-secondary systems are difficult to operate efficiently due to the small difference in chilled water temperature, which is known as the low-△T Syndrome. In particular, if pressure control is not well achieved in the hydronic system under partial load condition, the problem of reduction in energy efficiency may occur due to excessive flow supply, an increase in transport energy, and an increase in energy being used in the chiller [6,7].
Figure 1 shows the annual operation time of the cooling system and cooling load for each part load ratio (PLR) section. In the case of PLR 0.2, the annual operation time was the highest at 1094 h, and in the case of PLR 1, the annual operation time was the lowest at 0 h [8]. Generally, the capacity of the equipment system is designed after calculating the maximum load assuming the extreme conditions and then applying a safety factor. Thus, the operating hours of HVAC&R systems in most buildings are run below 50% of the building load as shown in Figure 1. In particular, for the design and selection of piping in South Korea, the safety factor is reflected in all stages without an accurate calculation criteria for the calculation of piping size and the capacity of heat source equipment from the maximum load calculation stage, which is based on the normal specifications set by the Ministry of Land, Infrastructure, and Transport (MOLIT). Thus, studies on the relationship between load calculation results in office buildings and installed heat source equipment capacity found that 10%–50% of the actual load was added by safety factors and extra rates according to the designer’s judgment [9,10].
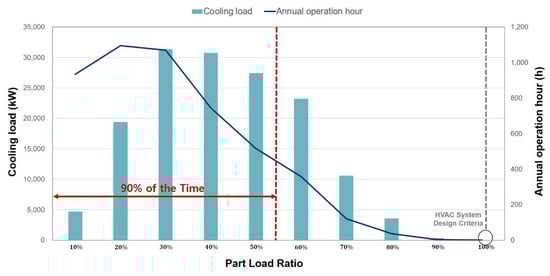
Figure 1.
Office building part load ratio.
The reason for the excessive capacity calculation of heat source equipment was because of designers trying to avoid the complaints from occupiers due to the lack of capacity and not wanting to spend time running simulations to get the right design. However, this made the heat source capacity oversized in the end, leading to the reduction in idle areas in buildings as a result of the increase in mechanical room size, the increase in building’s initial investment cost, and increase in operating cost due to the need for energy efficiency [11].
The rated conditions of chillers are specified to 12 °C for inlet temperature and 7 °C for outlet temperature according to KS B 6270:2015 in South Korea, and those with cooling towers are specified to 37 °C for inlet temperature, 32 °C for outlet temperature, and 27 °C for the wet-bulb temperature of inlet air [12,13]. The above standards aim to express the cooling capacity at the rated conditions, but failure to maintain the above conditions does not mean that the system failure occurs [14].
The outlet and inlet temperatures of chillers during the general operation of the cooling system are fixed to the above normal design conditions, and the on/off control is carried out in the cooling tower fan by fixing the condenser water outlet temperature to 32 °C. However, because the cooling capacity of the chiller changes variably depending on the chilled water outlet temperature supplied from the evaporator in the chiller and cooling tower outlet temperature introduced to the condenser, when increasing the temperature difference of normal design condition values in the current chiller and cooling tower, an effect of a reduction in the pump’s transport energy and a reduction in piping size due to changes in flow can be expected.
1.2. Research Trend and Objectives
A previous study by [15] on energy saving in a hydronic system comparatively analyzed the primary-secondary and primary-only systems in a qualitative manner, in which the circulation pumps were arranged in general buildings among variable-speed systems. The primary-only circulation pump system could reduce the annual operating cost due to the reduction in the peak load of the pumps and the initial investment cost compared to the primary-secondary circulation pump, but the complexity of bypass control and chiller staging must be considered. However, their research had a limitation that it could not quantitatively calculate the energy reduction. The authors of [16] analyzed the energy consumption in a constant-speed primary pump system and a variable-speed secondary pump system by using the pump systems while changing the distance to propose the selection criteria of pump systems for buildings. As a result, when the distance to each building from the mechanical room was 120 m, a system consisting only of the primary pump reduced energy consumption by 2773 kWh annually. However, their study did not consider the load pattern according to building purpose and the outdoor air temperature assuming specific conditions during the time of system design, and the primary pump system was designed with a constant flow rate, which did not properly practically respond to the variations in loads in buildings. Accordingly, the need to determine the energy reduction in the primary variable-speed system, which could respond to load variations, has arisen. In [17] the authors achieved the optimal number of operating pumps with the efficient control of pump motors in a circulation system and analyzed the heat source energy and pump power in the HVAC&R circulation system, which was reduced by the controlling the revolution using a variable speed pump to analyze the energy reduction effects of the HVAC&R hydronic system in office buildings through efficient energy control of variable speed pumps. As a result, their study verified that the variable speed pump had more merits in energy saving compared to the efficient control measure of pump motors in the circulation system.
Studies on energy saving in the cooling tower system have also been conducted as follows: the authors of [18] calculated a condenser water pump flow rate, the flow rate of a cooling tower fan, and the condenser water setting temperature according to changes in the dry and wet-bulb temperatures of the outdoor air in summer, which were environmental variables for the system optimization of the condenser water system thereby allowing for analysis of energy usage of component devices and the overall cooling system. As the setting temperature of condenser water was raised, the energy consumption of the chiller increased, but the energy consumption of the cooling tower fan decreased. As a result, the overall cooling energy usage tended to increase, but their study did not determine the quantitative amount of energy saving. In addition, in [19] the authors quantitatively analyzed the cooling energy saving from June to September, which required cooling, by changing the existing design of the condenser water outlet temperature (32 °C) by 1 °C through simulations. They verified a 1.4% energy saving compared to using the existing design condenser water temperature, through the control of other condensers water temperatures were different by month. In [20] the authors compared the energy usage and the cost between general and low condenser water temperature operations through the measured cooling data in a real building. The cooling water temperature during general operation was around 32 °C and the temperature during low-temperature condenser water operation varied from 24 to 32 °C, in which the power consumptions of the cooling tower system and variable refrigerant flow (VRF) outdoor unit were reduced by 24% and 5.9%, respectively, and the coefficient of performances (COP) of the outdoor unit and system improved by 7.3% and 12.7%, respectively, resulting in the reduction of operating cost by 11%.
Currently, most building facilities offices in South Korea conduct on/off control of cooling tower fans by fixing the cooling tower outlet temperature to 32 °C when designing a water-cooled chiller employs the cooling tower method, but cooling energy can be saved if the condenser water outlet temperature is lower. However, the above studies analyzed energy saving, focusing only on the cooling period, which have limitations as their studies were not conducted considering the annual operation including intermediate seasons.
Thus, the present study aims to minimize the change in the components and equipment such as heat source equipment and pumps and proposes measures to reduce the annual cooling usage only by changing the pump’s layout and operating method and changing the chilled and condenser water temperature settings, targeting large-sized office buildings. To this review, the annual cooling energy consumption cut-off quantitatively was analyzed through simulation.
2. Study Overview
2.1. Study Scope and Methodology
Figure 2 shows the overall configuration of the present study. Since a calculation model for specific buildings specification cannot represent general buildings in South Korea, the normal model for large-sized office buildings based on ANSI/ASHRAE/IES Standard 90.1 was utilized [21]. This represents 85% of all large-sized office buildings in South Korea whose total floor area is 46,320 m2 [3]. The HVAC&R system was composed of the most general things in South Korea. For simulation, the program EnergyPlus v8.0 was used, through which the specifications of the HVAC&R system in the building was selected. The operating performance of the cooling system was analyzed using the simulation tool and a change in the design temperature of chiller and cooling tower that specified in the Korean Standards (KS), and the configuration of the chilled water circulation pump, and the energy saving was determined.
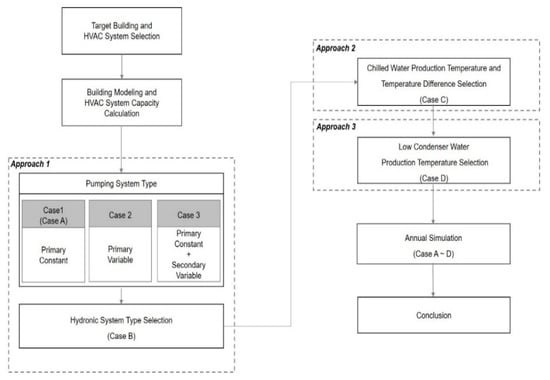
Figure 2.
Research flow chart.
2.2. Overview of the Target Building and Design Elements of HVAC&R
The target building was located in Seoul, South Korea and the standard meteorological data of the region was applied [22]. Table 1 presents the highest and lowest monthly temperatures, mean web bulb temperature, mean relative temperature, and monthly solar radiation. The monthly mean outdoor air wet-bulb temperatures in March to May and October to November, which were intermediate seasons that considered both of cooling and heating simultaneously, were 2.3, 7.1, 12.6, 10.5, and 4.8 °C , respectively, and those in June to September, which were cooling periods, were 14.8, 17.7, 18.2, and 11.2 °C, respectively. Thus, it should be no problem to produce low-temperature cooling water in the cooling tower system under such weather conditions, through which cooling energy is expected to be reduced.

Table 1.
Monthly climate data in the target area.
The building size and zoning were conducted using the large-sized office prototype in ASHRAE 90.1 for the target building. The building was a 12-story configuration with one basement and a floor area on the typical floor was 3504 m2, and the window-to-wall ratio was 40%. Figure 3 shows the zoning of the target building. The zoning was divided into interior zones, exterior zones for each direction, and one server room (information technology closet) [21].
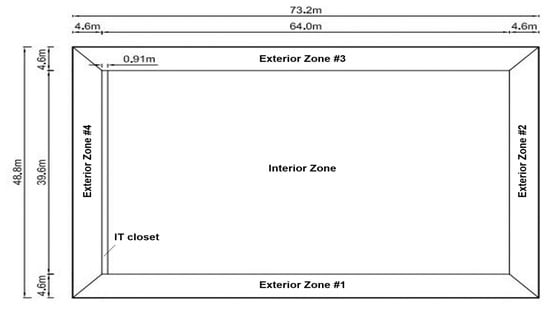
Figure 3.
Zoning of the typical floor.
Table 2, Table 3 and Table 4 present the outline of the simulation-applied building and specifications of the air handling unit (AHU) and cooling system. The insulation performance of building envelope was set as follows in accordance with the Design Standard for Energy Saving in Buildings in South Korea (2018): 0.240 W/m2·K for the outer wall, 0.150 W/m2·K for the roof, 1.5 W/m3·K for windows and doors, and the solar heat gain coefficient (SHGC) was 0.516 [23]. The ventilation and minimum outdoor airflow rate were set to 9 m3/h·person and 1.52 m3/h·m2 according to the ASHRAE 62.1(2007) standard and the internal heat generation was set as follows according to the ASHRAE 90.1 standard (2013): 8.50 W/m2 for the lighting load and 17.87 W/m2 for the equipment load [21,24]. The building operating hours were five days a week from 09:00 to 18:00. The cooling and heating setting temperatures were 26 and 20 °C, respectively, and cooling and heating setback temperatures were 30 and 15 °C, respectively. The AHU discharge temperature was set to 12.8 °C. AHU#1(CAV) in the first basement where the data center was located processes loads constantly throughout the year, and AHU#2(VAV) was located on the ground floor, which was a lobby. AHU#3(VAV) and AHU#4(VAV) were placed on the second to eleventh floors, which were reference floors, and the top floor, respectively.
Table 2.
Simulation modeling: building outlines.
Table 3.
Simulation model air handling unit (AHU) specifications.
Table 4.
Simulation model cooling system specifications.
Figure 4 shows an overview of the HVAC system in the target building. The normal design temperatures specified in the KS were applied for the chiller and cooling tower as follows. The chiller inlet and outlet temperatures were 12/7 °C for the inlet and outlet temperatures of cooling tower were 37/32 °C, and the inlet air wet-bulb temperature was 27 °C . The chiller system consisted of two turbo chillers and two primary constant-speed chilled water circulation pumps. The capacity of the turbo chiller was 1286 kW, the COP was 6.28, and the load distribution scheme of the chiller is a sequential load distribution so that if the first chiller’s capacity is excessive when responding to the load, the second chiller is sequentially run [25]. The cooling tower system consisted of two cross-flow cooling towers and two constant-speed condenser water circulation pumps. The capacity of the cross-flow cooling tower was 1571 kW, and the condenser water temperature was set to 32 °C, and the on/off control of the cooling tower fan was applied.
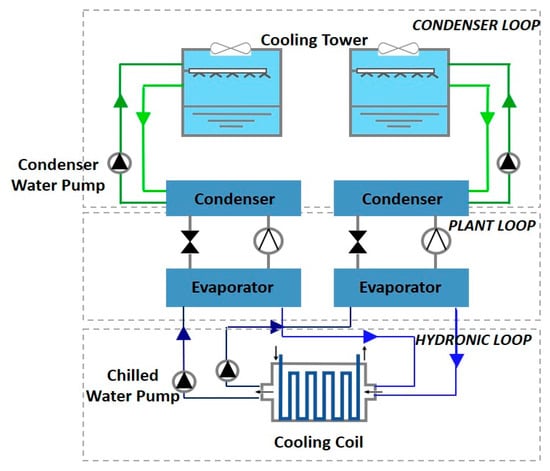
Figure 4.
HVAC system schematic of the target building.
3. Energy Usage Analysis Using Simulations
3.1. Analysis of Cooling Energy Consumption According to Hydronic System Type
The hydronic system is a transport energy system that connects all HVAC&R equipment and the selection of the hydronic system should consider optimal economy according to operating and load conditions [26]. The hydronic systems in most buildings are a closed loop, and piping and circulation pumps are arranged in parallel. In such conditions, if a different load occurs in each zone and pumps and valves are not properly controlled, the chilled water temperature difference may be smaller than the design value thereby generating low-△T syndrome where the energy consumption of pumps and chillers increase [27]. The layout of the chilled water circulation pumps in the target building was divided into a primary constant-speed pump system (hereinafter referred to as Case 1), a primary variable-speed pump system (hereinafter referred to as Case 2), and a primary constant-speed pump and secondary variable-speed pump system (hereinafter referred to as Case 3) based on the pumping system type as defined by ASHRAE Handbook (2016) [28]. The specifications according to the system are presented in Table 5.
Table 5.
Pump specifications by pumping system type.
The pump specifications of Cases 1 and 2 are the same except for the presence of an inverter. In Case 3, a constant speed was applied to the primary pump that transported the chilled water produced in the chiller, and a variable speed was applied to the secondary pump that corresponded to the load side. Table 6 presents the calculation and comparison of energy consumptions per component of the cooling system in Cases 1 to 3 after selecting representative weeks in August and May, in which annual maximum cooling load and partial load operations occur.
Table 6.
Energy consumption by hydronic system components (unit: kWh).
The change in energy consumption by the AHU fan and the condenser water pump for each case during the cooling period of August were minimal, and the total consumptions of cooling energy in Cases 1 to 3 were 22,178, 20,370, and 21,833 kWh. The energy consumptions of the chiller, chilled water pump, and cooling tower in Case 2 were reduced by 9.7%, 15.5%, and 17.8%, respectively, compared to those of Case 1, which was the existing design condition, but those of Case 3 all increased, except for that of chilled water pump. Consequently, the energy consumption during the representative week showed that the design conditions of Cases 2 and 3 reduced the energy consumption of the chiller by 8.1% and 1.6%, respectively, compared to that of Case 1. The reason for the relatively large energy cut-off in Case 2 was due to the heat loss and pressure drop caused by the pipes in the secondary side helping to handle the cooling load, resistance by the header, and differences in pressure loss at the pump on the secondary side.
The energy consumptions of Cases 1 to 3 in the intermediate season whose partial load was relatively large were 12,119, 10,455, and 12,082 kWh, respectively, indicating the consumptions of Cases 2 and 3 were reduced by 13.7% and 0.3%, respectively, compared to that of Case 1. In addition, the reduction effect of energy consumption in the intermediate season was larger than that of the cooling period.
3.2. Analysis of Energy Consumption according to Chilled Water Production Temperature and Temperature Difference
Basically, the efficiency of chillers changes variably according to the chilled water outlet temperature supplied from the evaporator and the condenser water inlet temperature introduced to the condenser. As the power consumed in the compressor is reduced as the chilled water production temperature is higher, the COP of the chiller increases. However, the load requirement generated in a building is the same. Thus, with the raising in chilled water outlet temperature, the flow rate of chilled water increases thereby increasing the transport energy of the chilled water pump as well. To investigate the relationship between the reduction in energy in the chiller with the increase in chilled water production temperature and increase in conveyance energy of the pump, an increment of 1 °C was applied within a range of 5–9 °C of chilled water outlet temperature. For the chilled water circulation pump layout, the variable-speed system in the primary side was applied using the previously identified results.
Table 7 presents the calculated results of energy consumption according to chilled water production temperature in the chiller and chilled water temperature difference during the representative weeks in the cooling and intermediate seasons. The chilled water temperature and the chilled water temperature difference when the energy consumption was the largest were 5 °C and 10 K, and the total energy consumption of the system during the representative week in August and May were 20,476 and 10,273 kWh, respectively. The outlet temperature of the chiller and chilled water temperature difference when the energy consumption was the least were 9 °C and 9 K, and the summed consumptions in cooling and intermediate seasons were 18,695 and 9425 kWh, indicating that the change in energy consumption between two seasons was similar.
Table 7.
Energy consumption by chilled water production temperature and temperature difference (unit: kWh).
Compared to energy consumption of 20,370 kWh in Case 2, which was the basic design condition, when the chiller outlet temperature and chilled water temperature difference were 7 °C and 5 K in Table 6, energy was reduced by 3% to 8% according to the chilled water production temperature and chilled water temperature difference except for the 5 °C of chiller outlet temperature and 10 K of chilled water temperature difference. If the chilled water production temperature was lower than 7 °C, which was the existing design condition, while processing the same load, the cooling energy increased as the chiller’s energy consumption increased. On the other hand, if it was higher than 7 °C, the air-conditioning fan energy increased due to the reduction in logarithmic mean temperature difference in the cooling coil, resulting in a larger energy saving in the chiller, leading to the overall reduction in cooling energy consumption. In addition, when the chilled water temperature difference increased more than 5 K, which was the existing difference, the flow rate required to process the same load was decreased, thereby reducing the transport energy of the chilled water pump, increasing the idle area of the building, and a reduction in piping size.
3.3. Energy Consumption Analysis with Changes in Normal Design of Cooling Tower System
Since the cooling capacity of the chiller changes according to the chilled water production temperature that is passed through the evaporator and the condenser water temperature introduced to the condenser, the cooling tower system should also be considered to reduce the consumption of cooling energy. Generally, the cooling tower can cool water up to 2–3 K temperature higher than the outdoor air wet-bulb temperature. The concept of the cooling range and cooling approach in the cooling tower is shown in Figure 5. The flow rate L (kg/h) of condenser water and fan flow rate G (kg/h) of the cooling tower are determined through the temperature condition of the condenser water and the wet-bulb temperature of the air in the inlet (Equations (1) and (2)). The cooling range in the cooling tower is determined by the heat load and the circulation flow rate but has nothing to do with the size of the cooling tower or the cooling capacity. The cooling approach is a function of the cooling tower capacity, and the condenser water outlet temperature, which is determined by the cooling capacity of the cooling tower and inlet wet-bulb temperature [28].
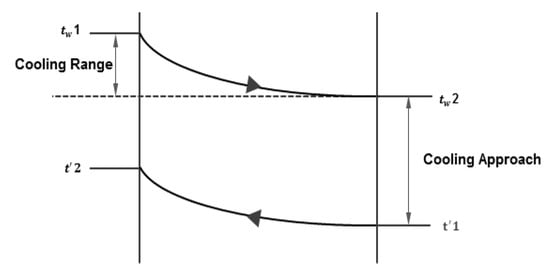
Figure 5.
Cooling range and approach at cooling tower
According to [29], because a flow rate becomes smaller with the same load the cooling range is larger, therefore, the power of the condenser water pump and energy of the cooling tower fan can be saved in terms of operating cost. In addition, since the pipe size, condenser water pump, and cooling tower capacity can be reduced from the initial investment viewpoint, the ASHRAE Green Guide (2010) recommends the chilled water temperature difference of 7–10 K [30]. Based on the previous study results [31] where the cooling energy was quantitatively identified by expanding the chilled water temperature difference from 5 to 10 K according to the normal design temperature (inlet/outlet temperatures: 37/32 °C) of the cooling tower specified in the KS, the condenser water temperature difference was selected to be 7 K.
where, : inlet wet-bulb temperature (°C), qc: cooling capacity(kcal/h); Equation (1) is : condenser water flow rate (kg/h), : condenser water inlet, outlet temperature (°C); Equation (2) is : cooling tower flow rate (kg/h), : enthalpy of saturated air same as (kcal/kg).
Generally, the condenser water setting temperature is fixed to 32 °C in South Korea when designing the chiller of a cooling tower method and water-cooled VRF thereby conducting the on/off control of the cooling tower, and the condenser water pump is configured as a constant speed type. However, intermediate seasons have increased times of the possible production of condenser water below 32 °C [32]. Thus, as the condenser water temperature drops, the refrigerant pressure drops as shown in Figure 6, leading to the improvement in COP efficiency of the chiller.
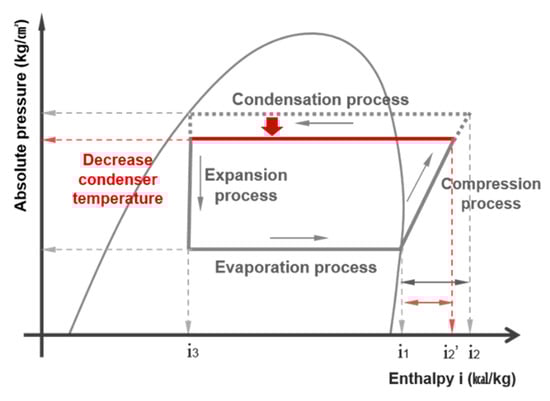
Figure 6.
Refrigeration cycle.
Thus, the present study configured a system by changing the chilled water pump to a variable speed type having a two-stage control of cooling tower fan to produce lower condenser water temperature than the existing condenser water setting temperature (32 °C). The monthly mean outdoor air wet-bulb temperature during the cooling (June to September) and intermediate (March to May, October, and November) seasons at the target building were 11.2–18.2 °C and 2.3–12.6 °C. Accordingly, the region could produce lower condenser water than 32 °C, which was the existing design condition. The condenser water setting temperature in the cooling tower was changed to 23.9 °C according to the ASHRAE 90.1 regulations, and the calculation and analysis of the energy consumption were conducted through simulations [21].
Figure 7 shows the changes in the condenser water temperature in the representative week of cooling and intermediate seasons when the condenser water setting temperatures are 32 and 23.9 °C. When the condenser water setting temperature was changed to 23.9 °C, the condenser water temperature ranged from 23.9 to 29.2 °C, indicating that around 22% and 98% of the operating time during the cooling and intermediate seasons could be reduced by setting the condenser water temperature to 23.9 °C.
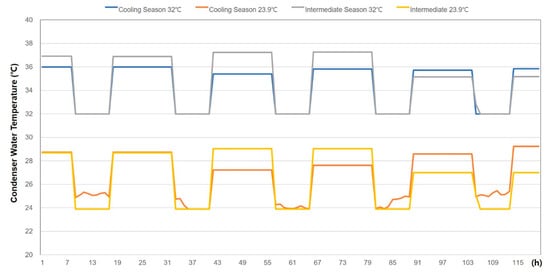
Figure 7.
Condenser water temperature according to condenser water setting temperature.
Table 8 presents the energy consumption by the cooling system components in the representative weeks of the cooling and intermediate seasons when the condenser water setting temperatures are 32 and 23.9 °C. The energy consumptions of the cooling system in the cooling and intermediate seasons were 18,848 and 9314 kWh when the condenser water setting temperature was 32 °C. In contrast, when the condenser water setting temperature was changed to 23.9 °C, the energy consumptions were reduced by 1404 and 1015 kWh, respectively, achieving the energy saving by 7.5% and 10.9% compared to those at 32 °C. Furthermore, compared to the rated COP of the chiller (6.28), the COP in the cooling and intermediate seasons was 6.20 and 5.67 when the condenser water temperature was 32 °C, which indicated a reduction by around 1.3% and 9.7% compared to the rated values. The COP at 23.9 °C was 7.54 and 7.06, which was increased by around 20.1% and 12.4% compared to the rated values.
Table 8.
Energy consumption by condenser water set temperature (kWh).
When the condenser water setting temperature was changed to 23.9 °C, the energy consumption of the chiller in the cooling season was reduced by 18.4% due to the effect of the low condenser water temperature, but the energy consumption in the cooling tower increased by 364.4%. This was because the operating hours of the cooling tower increased to produce more low-temperature condenser water, but the energy saved by the increase in efficiency of the chiller was larger consequential, thereby reducing the total energy consumption in the system. Moreover, low condenser water temperature could be more easily produced in the intermediate season than in the cooling season, thereby reducing the cooling energy by 10.9% compared to 7.5% in the cooling season.
3.4. Analysis of Annual Cooling Energy Consumption in Whole Cooling Heat Source Systems
In this section, Case A refers to the cooling system where the general designs were applied. To investigate a measure to save cooling energy, investigation cases were made by changing the design parameters of the system one by one as shown in Table 9.
Table 9.
Case classification due to design parameter changes.
Case A consisted of a primary constant-speed chilled water pump, the outlet temperature of the cooling tower fixed at 32 °C, on/off control of cooling tower fan, and constant-speed condenser water pump. To verify the effect of transport energy saving in the pump and heat source of the cooling system through the change in the existing design and control measure of the hydronic system, Case B consisted of a primary variable-speed circulation pump for the layout of the chilled water circulation pump. In Case C, the existing chiller outlet temperature and normal design chilled water temperature difference, which were 7 °C and 5 K, were changed to 9 °C and 9 K, and in Case D, the condenser water temperature difference was changed to 7 K to save the transport energy of the pump and heat source of the cooling system by changing the existing design and control measures in the cooling tower system. In addition, the cooling tower fan was controlled in response to the load produced by the low-temperature condenser water, the condenser water pump was changed to a variable-speed type, and the condenser water setting temperature in the cooling tower was set to 23.9 °C according to the ASHRAE 90.1 regulations. Figure 8 shows the annual cooling energy consumption for each case.
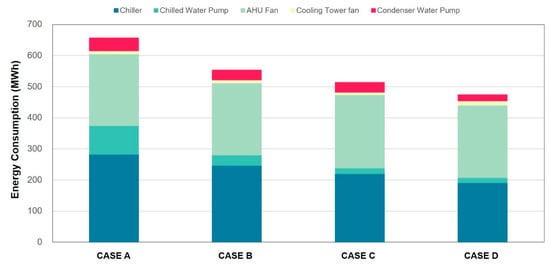
Figure 8.
Annual energy consumption.
Case B saved 103.2 MWh of cooling energy compared to Case A where general cooling system designs were applied, and the saving rate was around 15.7%. More specifically, energy savings were 64.0% in the chilled water pump, 22% in the condenser water pump, 12.5% in the chiller, and 7.2% in the cooling tower fan, which was due to the effective operation of the flow rate being reduced in the partial load conditions by the variable-speed pump. In Case C, annually 39.1 MWh and around 7.1% of cooling energy were additionally saved compared to those of Case B, in which 42.9% in the chilled water pump, 15.1% in the cooling tower fan, and 11.1% in the chiller were saved. In particular, the reason for the largest ratio of saving energy consumption in the chilled water pump was due to the reduced transport energy as the flow rate of chilled water was additionally reduced as a result of a large difference in chilled water temperature in the chiller of Case C.
Case D reduced the total cooling system energy consumption by changing the existing cooling tower system design, which saved 40.1 MWh annually compared to that of Case C. The additional saving rate was around 7.8%, in which 38.2% in condenser water pump, 13.1% in chiller, and 12.3% in chilled water pump were saved, but the energy consumption of the cooling tower fan increased by approximately 67.6%. This was due to the increase in cooling tower fan flow rate and the reduction in the flow rate of condenser water as a result of the production of low condenser water temperature of 23.9 °C, which was compared to the existing condenser water temperature of 32 °C.
Finally, compared to Case A, which was the general cooling system designs, the annual energy saving and ratio of Case D, which reflected the changes in all designs, were 182.4 MWh and 27.8%. In addition, the components of the cooling system revealed that the energy consumption of the cooling tower fan increased by around 32.0% due to the low-temperature condenser water, but 32.4% in the chiller, 81.9% in the chilled water pump, and 50.8% in the condenser water pump were saved.
4. Conclusions
This study aimed to lower cooling energy consumption only by changing the type of pumping system, the operating method, and chilled water and condenser water setting temperatures in large office buildings. To do this, the whole cooling system consisting of a hydronic system, a chiller, and a cooling tower was modeled using the EnergyPlus tool, and a quantitative analysis of energy consumption considering the change in pumping system type and the normal design temperature of the chiller and the cooling tower was conducted.
The analysis results exhibited that compared to the general design conditions, which was Case A, Case B where the hydronic system was changed from primary constant-speed pump to a primary variable-speed pump achieved 103.2 MWh of annual cooling energy consumption saving, and around a 15.7% saving ratio. Case C where the chilled water leaving temperature and temperature differences were changed from 7 °C and 5 K to 9 °C and 9 K achieved 142.3 MWh of annual energy consumption saving and around a 21.7% saving ratio. Finally, Case D where all the design parameters were applied achieved 182.4 MWh annual energy consumption saving and around a 27.8% saving ratio.
Author Contributions
J.-w.H. searched the literature, made simulation models, and wrote the paper; S.C. and H.-y.K. examined calculated values and reviewed the draft phase; Y.-h.S. conceived and designed the methodology the paper. All authors have read and agree to the published version of the manuscript.
Funding
This work was supported by the National Research Foundation of Korea (NRF) through a grant funded by the Korean government (MSIT) (No. 2017R1A2B2006424).
Conflicts of Interest
The authors declare no conflict of interest.
References
- Masson-Delmotte, V.; Zhai, P.; Pörtner, H.; Roberts, D.; Skea, J.; Shukla, P.R.; Pirani, A.; Moufouma-Okia, W.; Péan, C.; Pidcock, R.; et al. Global Warning of 1.5 ℃ Summary for Policymakers Technical Summary; Intergovernmental Panel on Climate Change (IPCC): Geneva, Switzerland, 2018. [Google Scholar]
- Ministry of Environment (ME). The Revised 2030 National GHG Reduction Roadmap; ME: Sejong, Korea, 2018. [Google Scholar]
- Ministry of Trade, Industry and Energy (MOTIE). 2017 Energy Consumption Survey; MOTIE: Sejong, Korea, 2018. [Google Scholar]
- Wang, S. Intelligent Buildings and Building Automation; Spon Press (Taylor & Francis): London, UK; New York, NY, USA, 2010. [Google Scholar]
- Kirsner, W. The demise of the Primary-Secondary Pumping Paradigm for Chilled Water Plant Design. HPAC Eng. 1996, 68, 73–78. [Google Scholar]
- Wang, S.; Ma, Z.; Gao, D. Performance enhancement of a complex chilled water system using a check valve: Experimental validation. Appl. Therm. Eng. 2010, 30, 2827–2832. [Google Scholar] [CrossRef]
- Rhee, K.N.; Yeo, M.S.; Kim, K.W. Evaluation of the control performance of hydronic radiant heating systems based on the emulation using hardware-in-the-loop simulation. Build. Environ. 2011, 46, 2012–2022. [Google Scholar] [CrossRef]
- Seo, B.M. Comparison of Cooling Energy Performance Between Conventional AHU System and DX AHU-Water Source VRF Heat Pump System in an Office Building. Master’s Thesis, Hanbat National University, Daejeon, Korea, 2017. [Google Scholar]
- Kim, S.H.; Kim, D.G. A Survey Study on Optimal Cooling Equipment Capacity in Office Buildings. J. Archit. Inst. Korea Plan. Des. 2007, 23, 247–254. [Google Scholar]
- Jung, J.R.; Kim, S.H.; Lee, K.H. A study on the Application of Safety Factors for optimal Sizing, of Central Plant Equipment. J. Archit. Inst. Korea Plan. Des. 2000, 16, 77–84. [Google Scholar]
- Gang, W.; Wang, S.; Shan, K.; Gao, D. Impacts of cooling load calculation uncertainties on the design optimization of building cooling systems. Energy Build. 2015, 94, 1–9. [Google Scholar] [CrossRef]
- Korean Standards Association (KSA). Centrifugal Water Chillers; KS B 6270: 2015; KSA: Seoul, Korea, 2015. [Google Scholar]
- Korean Standards Association (KSA). Performance Tests of Mechanical Draft Cooling Tower; KS B 6364: 2014; KSA: Seoul, Korea, 2014. [Google Scholar]
- Takahashi, T. Understanding and Application of HVAC Control in Buildings; Sejinbook: Seoul, Korea, 2012. [Google Scholar]
- Taylor, S.T. Primary-Only vs. Primary-Secondary Variable Flow Systems. ASHRAE J. 2002, 44, 25–29. [Google Scholar]
- Shin, D.S.; Park, S.B.; Jun, T.I.; Ma, K.I.; Kim, T.H.; Lee, S.G. Energy Consumption Evaluation in Pumping System with Different Building Characteristics. Korean J. Air-Cond. Refrig. Eng. 2016, 28, 242–247. [Google Scholar] [CrossRef][Green Version]
- Kim, S.H.; Kwak, R.Y. Evaluation of Energy Savings Applying Energy Efficient Control of Variable Speed Pump in HVAC Hydronic Systems. J. Archit. Inst. Korea Plan. Des. 2012, 28, 207–214. [Google Scholar]
- Ahn, B.C. The Effects of Operational Conditions of Cooling Water System on Energy Consumption for Central Cooling System. Trans. Korea Soc. Geotherm. Energy Eng. 2017, 13, 8–13. [Google Scholar]
- Kwak, Y.H.; Kong, D.S.; Cheon, S.H.; Kwak, R.Y.; Huh, J.H. Analysis of Energy Potential Savings by a condensing water temperature control through EMS Simulation. In Proceedings of the SAREK 2011 Summer Conference, Pyeongchang, Korea, 6–8 July 2011. [Google Scholar]
- Lee, J.H.; Kim, H.M.; Song, Y.H. A Study on verification of changes in performance of a water-cooled VRF system with control change based on measuring data. Energy Build. 2018, 158, 712–720. [Google Scholar] [CrossRef]
- American Society of Heating, Refrigerating and Air-conditioning Engineers (ASHRAE). Energy Standard for Buildings Except Low-Rise Residential Buildings; ASHRAE Standard 90.1; ASHRAE: Atlanta, GA, USA, 2013. [Google Scholar]
- Passive House Institute Korea (PHIKO). Available online: https://climate.onebuilding.org/ (accessed on 1 February 2020).
- Ministry of Land, Infrastructure and Transport (MOLIT). Building Energy Saving Design Standards; MOLIT: Sejong, Korea, 2018. [Google Scholar]
- American Society of Heating, Refrigerating and Air-conditioning Engineers (ASHRAE). Ventilation for Acceptable Indoor Air Quality; ASHRAE Standard 62.1; ASHRAE: Atlanta, GA, USA, 2007. [Google Scholar]
- The U.S. Department of Energy. EnergyPlus Engineering Reference. Available online: https://energyplus.net/sites/all/modules/custom/nrel_custom/pdfs/pdfs_v8.9.0/EngineeringReference.pdf (accessed on 19 April 2020).
- American Society of Heating, Refrigerating and Air-conditioning Engineers (ASHRAE). ASHRAE Handbook Fundamentals; ASHRAE: Atlanta, GA, USA, 2017. [Google Scholar]
- Taylor, S.T. Degrading Chilled Water Plant Delta-T: Causes and Mitigation. ASHRAE Trans. 2001, 108, 641–653. [Google Scholar]
- American Society of Heating, Refrigerating and Air-conditioning Engineers (ASHRAE). ASHRAE Handbook HVAC Systems and Equipment; ASHRAE: Atlanta, GA, USA, 2016. [Google Scholar]
- Taylor, S.T. Optimizing Design & Control of Chilled Water Plants Part 3: Pipe Sizing and Optimizing △T. ASHRAE J. 2011, 53, 22–35. [Google Scholar]
- American Society of Heating, Refrigerating and Air-conditioning Engineers (ASHRAE). ASHRAE Green Guide: The Design, Construction, and Operation of Sustainable Buildings, 3rd ed.; ASHRAE: Atlanta, GA, USA, 2010. [Google Scholar]
- Ha, J.W.; Park, K.S.; Kim, H.Y.; Song, Y.H. A Study on Annual Cooling Energy Consumption Cut-off with Cooling Tower Control Change. J. KIAEBS 2019, 13, 503–514. [Google Scholar]
- Takahashi, T. Building Energy and HVAC Control; Sejinbook: Seoul, Korea, 2012. [Google Scholar]


© 2020 by the authors. Licensee MDPI, Basel, Switzerland. This article is an open access article distributed under the terms and conditions of the Creative Commons Attribution (CC BY) license (http://creativecommons.org/licenses/by/4.0/).