Abstract
Today’s market leading electric vehicles, driven on typical UK motorways, have real-world range estimation inaccuracy of up to 27%, at around 10 °C outside temperature. The inaccuracy worsens for city driving or lower outside temperature. The reliability of range estimation largely depends on the accuracy of the battery’s underlying state estimators, e.g., state-of-charge and state-of-energy. This is affected by accuracy of the models embedded in the battery management system. The performance of these models fundamentally depends on experimentally obtained parameterisation and validation data. These experiments are mostly performed within thermal chambers, which maintain pre-set temperatures using forced air convection. Although these setups claim to maintain isothermal test conditions, they rarely do so. In this paper, we show that this is potentially the root-cause for deterioration of range estimation at low temperatures. This is because, while such setups produce results comparable to isothermal conditions at higher temperatures (25 °C), they fail to achieve isothermal conditions at sub-zero temperatures. Employing an immersed oil-cooled experimental setup, which can create close-to isothermal conditions, we show battery state estimation can be improved by reducing error from 49.3% to 11.7% at −15 °C. These findings provide a way forward towards improving range estimation in cold weather conditions.
1. Introduction
Reduction in fossil fuel consumption is a key avenue towards reducing rising worldwide carbon emissions [1]. Electric vehicles (EVs) can potentially not only reduce fossil fuel consumption, but also satisfy customer demands [2]. The percentage of EVs in global light vehicle production is expected to rise from <2% in 2016 to about 6% by end of 2020, and to at least 22% by 2030 [3]. In an EV, the cost of the battery pack can be as much as 25% of the total cost. To become cost comparable with internal combustion engines, the battery pack cost will need to decrease from around $ 200–300 per kWh presently, to around $ 100–150 per kWh by 2025, which is predicted to happen [1,4].
Lithium-ion batteries have become the most popular energy storage technology used in EVs, due to their high gravimetric and volumetric energy densities, excellent cycling performance and long calendar life [5]. Building on the success of land based EVs, aerospace electrification is also emerging. Norway and Sweden have already announced plans to use electric airplanes for all short-haul flights in their airspace [6,7]. From recent prototypes, it is clear that the electric aircraft will use lithium-ion or similar comparable future battery technology.
Countries like Norway and Sweden, and large parts of continental Europe and North America, are characterised by seasonally extreme cold weather down to −20 °C [8,9]. In these conditions, a lithium-ion battery’s capacity, maximum output power and charge acceptance capability are reduced. At lower ambient temperatures (≤10 °C), due to slower chemical kinetics, charge transfer at the electrode-electrolyte interphase slows down, leading to higher overpotentials [10]. Furthermore, lower ionic conductivity in the electrolyte and slower diffusion, particularly in the electrode contribute to higher voltage loss at lower temperatures [11]. These manifest as reductions in driving range and performance of EVs at low ambient temperatures [12]. This performance reduction is worsened by increased energy/power demands due to higher cabin heating requirements in cold weather conditions [13,14].
Low ambient temperatures also lead to large reductions in real time range/performance estimation of EVs [15,16,17]. For example, the real-world usable range of the Nissan Leaf is 298.7 km at −2 ℃ [12,18]. This is a substantial reduction from the 385 km range claimed in advertisements. These factors exacerbate predisposed range anxiety and have forced users to consider alternatives, limiting the customer acceptance of EVs [19]. Inaccuracies in range estimation, rarely have led to catastrophic failure in road transport EVs; however, in electric aircrafts they would. For example, following an aborted landing, inaccurate range estimation could be the difference between an aircraft undertaking a safe holding pattern or an unsafe rough landing. Therefore, with burgeoning aircraft electrification, accurate range estimation has never been more important.
Results from galvanostatic battery experiments, at different ambient temperatures and C-rates, are employed to directly model the usable charge/discharge capacity of lithium-ion cells under different operating scenarios [20]. In these model parameterisation experiments, it is assumed that the test conditions are isothermal. However, at low ambient temperatures, due to higher cell internal resistances (R), (, cells heat up more [21]. This effect is compounded if the operating current is high. Grandjean et al. recently argued that self-heating is a performance enhancement feature for lithium-ion cells operating at low ambient temperatures [22]. They conducted galvanostatic discharge cycle experiments at −10 °C ambient temperature. Towards the end of discharge at 5C, the cell surface temperature was about 30 °C; a nearly 40 °C temperature rise due to self-heating. On the other hand, if the cells were not allowed to heat up, the cell voltage would have decreased at a faster rate and likely resulted in a lower capacity discharged. This implies that while the starting cell temperature may be close to the ambient temperature, at the end of a discharge cycle the cell temperature can be considerably higher than the ambient temperature, particularly for high load currents.
Furthermore, there is a vast literature on lithium-ion cell models, where researchers have claimed that model parameters have been obtained from battery experiments conducted under isothermal conditions [15,23,24,25,26]. On closer examination of the literature, claimed isothermal conditions are often found to be non-isothermal. For example, to parameterise their equivalent circuit model, Jaguemont et al. obtained discharge capacities for their cells at −20, −10, 0 and 25 °C ambient temperatures [23]. For 1C discharge at −20 °C, the final cell temperature was −5.6 °C and for 1C discharge at −10 °C, the final cell temperature was 0.9 °C. This means that the discharge characteristics were representative of a test temperature much higher than either the −20 or −10 °C starting ambient temperature. In fact, the final cell temperature for the test at −20 °C is 4.4 °C higher than the starting ambient temperature of the next parameterisation point, −10 °C, which leads to redundancy.
While beneficial for a drive cycle, self-heating is an issue for a parameterisation experiment where repeatability is key. Clearly, the tests performed in literature are not isothermal, so attention should be paid to the test setup to improve this shortcoming.
The effects are particularly important for low temperature parameterisation where the effects of self-heating are much larger than at room temperature. This is a prominent limitation because by allowing the cells’ operating temperature to diverge from the ambient (or test) temperature, the effect of temperature and current on the accessible capacity can become convoluted. This is because, if the capacity performance is being assessed at a particular temperature, the cell itself should be anchored to that temperature for the duration of the parameterisation test. This is because cell overpotential is a function of both operating current and operating temperature [27]. To draw out the effect of one, the other should be fixed for a particular experiment.
Conventionally, battery cycling is conducted in commercially available thermal test chambers. A thermal chamber allows control of operating temperature and humidity conditions during a test. In particular, temperature control is achieved by forced convection of air within the chamber. As widely reported in the literature, for experiments conducted in air-based thermal chambers, as a lithium-ion cell self-heats under load, its operating temperature increases [22,23]. This means that for ‘air’ cooling, the cell operating (surface) temperature is not fixed to the starting ambient temperature and changes significantly during a parameterisation cycle. Limited investigation has shown that battery parameters are more in line with those from temperatures higher than the starting ambient temperature [28]. In their study, Ardani et al. employed Peltier elements to control cell surface temperature during pulse discharge. However, this case did not represent the more extreme case of a continuous discharge at an ambient temperature (for example, 1C discharge).
In the literature, active thermal management of lithium-ion cells (such as those employing oil baths) has largely been investigated from the perspective of the performance characteristics of the heating/cooling system [29,30]. Bolsinger et al. investigated the effect of different cooling configurations for cylindrical cells and argued that tab (or terminal) cooling is better than surface cooling. Similarly, other researchers have compared the pros and cons of choosing between air cooling and liquid cooling [29,31,32]. The comparisons were made on the basis of cost, complexity, efficiency, direct versus indirect cooling, and so on. Air has poor thermal properties compared to other materials (such as mineral/silicone oils) (Table 1), and so the cooling capability may be insufficient to counter the rapid heat generation seen for high load currents and/or low ambient temperatures. This means that for a similar cooling area and coolant mass, the cooling capability of air is substantially lower than that of a direct liquid cooling system [33]. Compared to conductive cooling with Peltier elements [28], an immersed oil bath allows simultaneous cooling of all cell surfaces (including the tabs) and is independent of cell format or size.

Table 1.
Comparison of physical properties of different coolants [32].
In operation, cells naturally heat up, however, the aim of this paper is to improve parameterisation data for range estimation. Therefore, the contribution of this paper is to show that traditional (air) thermal control methods potentially lead to overestimation of remaining driving range by inaccurately assessing usable capacity/energy characteristics. This paper offers a methodology to conduct close-to-isothermal experiments by better tracking accessible capacity as a function of temperature and current. This allows better correlation of accessible battery capacity/energy with remaining driving range. This is done by parameterising the cells within an immersed oil bath with direct liquid cooling to allow isothermal control. Results will be compared with the air thermal control method. A validation of the distinction between ‘air’ and ‘oil’ based parameterisation data will be shown by tracking SOC evolution by employing a typical 1st order battery electrical equivalent circuit model, parameterised with two different datasets.
The paper is structured as follows. In Section 2, the experimental and modelling methods employed for this study are described, including the experimental setup and test matrix chosen. Then in Section 3, the results are presented and discussed. The effect of choosing oil cooling compared to air cooling will be shown. Then, combined with a typical first order equivalent circuit model (ECM) with hysteresis parameterised between −20 and 25 °C, SOC evolution and remaining driving range estimation for both air and oil approaches are compared for a legislative drive cycle (2 US06 cycles, back-to-back). Finally, in Section 4, the key learnings from this study are summarised.
2. Materials and Methods
For this study, three 40 Ah lithium-ion pouch cells were procured from Xalt Energy. The cells contained a Nickel-Manganese-Cobalt (NMC) cathode and graphite anode (Table 2). The cells were chosen based on properties such as capacity, form factor and chemistry, making them comparable to cells used in popular passenger battery electric vehicles (BEVs) such as the Nissan Leaf [34]. The cells had a nominal voltage of 3.7 V and a discharge temperature range between −20 to 60 ℃. The composition of the electrolyte was not made available on request to the manufacturer. However, generally, the electrolytes include 1.0–1.2 mol LiPF6 combined with a blend of 2–3 organic solvents, such as ethylene carbonate (EC), dimethyl carbonate (DMC) and diethyl carbonate (DEC). Since decreased ionic conductivity of the electrolyte is a major factor for poor battery performance at low temperatures, improving electrolyte properties is an open research question [11].
Table 2.
Performance characteristics of 40 Ah lithium-ion pouch cell.
As part of the ‘oil cooling’ based active thermal management system (immersed oil bath with direct liquid cooling), a low-viscosity silicone oil (Kryo 95) with excellent dielectric properties was employed (Table 3). The oil is insoluble in water and fluid properties such as specific heat capacity, kinematic viscosity and density were advertised to be consistent across operating temperature range (−20 to 60 °C) of the experiments.
Table 3.
Performance characteristics of kryo-95 silicone oil for low temperature applications.
2.1. Experimental Setup
All experiments were conducted in an Espec Platinous J Series thermal chamber with spatial temperature accuracy of ±0.3 °C. The cells were cycled using a Maccor Series 4000 cell cycler and relevant cycling control software was employed. To ensure that there was no free air flow from outside the chamber into the chamber, any gaps (due to current carrying cables, etc.) were sealed using thermally-insulating putty. To measure the surface temperature of the cells, hermetically sealed T-type thermocouples were used with ±0.5 °C accuracy. At each experimental condition, measurements from three cells were used to ensure statistical significance, as well as to account for cell-to-cell variations [35]. A schematic diagram for the immersed oil bath with a cooling system is given in Figure 1. A Lauda Pro unit (model RP 245 E) was employed as the chilling system, which uses a Pt-100 thermocouple placed inside the oil bath (close to the cells) to control the inlet coolant temperature. The Lauda unit had a working temperature range of −45 to 200 °C and a maximum cooling capability of 2.5 kW.
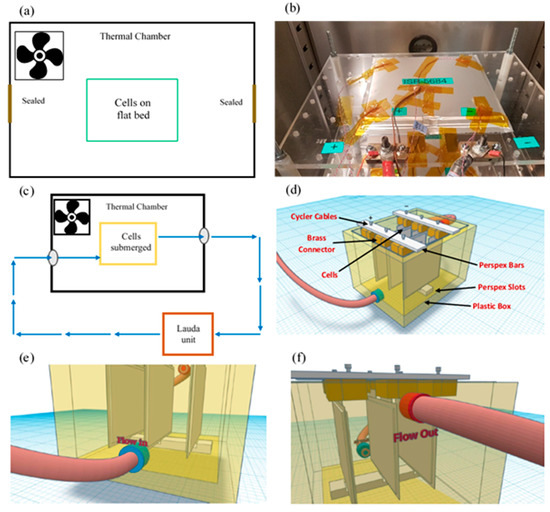
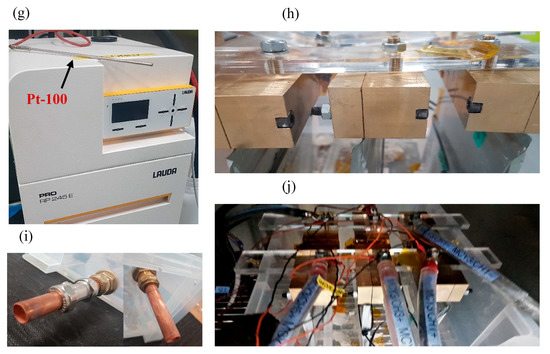
Figure 1.
Experimental Setup: (a) schematic representation of air based thermal control system, (b) traditional flat-bed test setup in forced air based thermal chamber, (c) schematic representation of oil based thermal control system, (d) cooling configuration for oil based immersion bath with cells connected, (e & f) coolant inlet and outlet for connections from thermal control unit, respectively, (g) Lauda Pro RP 245E used for this study and Pt-100 unit, (h) cells connected in box using brass blocks and Perspex bars, (i) pipework for box (left: inlet & right: outlet) and (j) cells connected inside box within thermal chamber.
The cells were placed within the box (with an open lid) and the entire setup was placed inside the thermal chamber (Figure 1 c–j). A cell cycler channel was connected to each cell and a T-type thermocouple was placed on the geometric centre of the cell surface (according to latest IEC 62660-1 test standard) using a perspex block and cable tie. This setup was tested for thermal mass distribution and temperature homogeneity within the box. For direct liquid cooling with an immersed oil rig, the thermal gradients across the cell surface are expected to be miminal, given that the cells and oil bath (~20 l) were controlled at the ambient temperature for 4 h before any charge/discharge operation, and the cooling capability of the Lauda unit is 2.5 kW. In future work, to investigate the performance of the thermal management system and its effect on thermal gradients on cell surface, more temperature measurement points should be added, including, if possible, a thermal camera, or temperature sensors inside the cell. Note that, for ‘air cooling’ experiments, the Lauda unit was switched-off and the oil bath was emptied and the box removed to allow free flow of air around the cells (Figure 1 a, b).
2.1.1. Galvanostatic Cycling Performance
Galvanostatic discharge cycles were performed at different ambient temperatures for various discharge C-rates. As part of these galvanostatic tests, the ambient temperatures considered were −20, −10, 0 and 25 °C. The discharge C-rates considered were 0.25C, 1C and 3C. This suite of tests was performed for both ‘air cooling’ and ‘oil cooling’ cases. Between each discharge test, the cells were charged at 25 °C ambient temperature using the Constant Current Constant Voltage (CCCV) protocol (0.5C charge current to 4.2 V, where the cells were held until current reduced to 0.05C). This was done to ensure that the cells were fully charged at the same level, 25 °C, prior to low temperature discharge. This is important because the cells are not being tested for real-world usage, but are characterised in close-to-isothermal lab conditions to improve applicability of the subsequent models in the real world.
2.1.2. Open Circuit Voltage (OCV) versus State-of-Charge (SOC) Characterisation
To obtain the OCV-SOC relationship of the cells, the cells were charged using the CCCV protocol with a C-rate of 0.5C, to a maximum voltage of 4.2 V and a 0.05C cut-off. Then, the cells were discharged using 1C until 4% of the nominal cell capacity (40 Ah) was discharged. Then, the cells were at rest for 4 h and the voltage recorded. After this, the 4% discharge step and 4 h rest period regime was repeated until the cells reached the 2.7 V cut-off. A similar process was used to obtain the charge OCV-SOC relationship of the cells.
2.2. Modelling Methodology
To compare the effects of the two thermal control approaches for model parameterisation, the cells were cycled for US06 duty cycles at different ambient temperatures. The vehicle level duty cycle was scaled down for the cells used for this study [36]. A backward facing model was used to achieve the scaling of the duty cycle, which converted the legislative speed versus time profile to a vehicle level power versus time profile [37,38].
The conversion was conducted for a typical passenger BEV which had a kerb weight of 1600 kg [36]. The other relevant parameters were: Coefficient of Drag, CD = 0.28, Density of Air, ρ = 1.225 kg/m3, Friction Coefficient, fr = 0.01, Frontal Area of Vehicle, A = 2.744 m2, Gravitational Acceleration, g = 9.81 m/s2 [39,40]. The gear-box ratio (G) was 7.94. It was assumed that the motor efficiency was 0.9 [13,38], and the regenerative-braking efficiency was 100% (RE). A 5 kW load for cabin-heating was added at each time step, since the study is focused at low temperatures [41]. To scale it to cell level, the battery pack considered, had 48 modules and each module had four cells connected in a 2P2S configuration [9]. From Table 2, the nominal voltage of a single cell was 3.7 V. Thus, the nominal pack voltage was 355.2 V. Therefore, the pack capacity was 80 Ah, and the pack energy was 28.4 kWh, making it comparable to a real BEV [42]. This was used to calculate the power demand at which the cells were cycled. Using this method, two back to back US06 drive cycles (2xUS06) were applied at 65% starting SOC and the ambient temperatures considered were −15, −5 and 5 °C, to be between the parameterisation temperature points. For translating the difference between air and oil approaches at a parameterisation level to remaining driving range (RDR) estimation level, the following equation for SOC as proposed by [43] was employed:
here is the battery capacity at different temperatures and discharge C-rates. The inputs to parameterise accessible battery capacity are experimental operating current and measured surface temperature.
3. Results and Discussion
Table 4 presents the capacity test results for the air cooling parameterisation condition. Capacity measured at a particular discharge rate was decreasing with temperature, and cell surface temperature was higher at lower temperature, as expected [23,44,45]. At 25 °C, both capacity and total energy discharged decreased with discharge rate. In contrast, it was increasing at lower temperatures, e.g., at −20 °C capacity increased by 0.9 % and 8.8 % at 1C and 3C, compared to 0.25C. This is directly linked to the temperature raise of the cell. For example, at −20°C, as discharge current increases from 0.25C to 3C, the temperature rise changes from 4.7 °C to 30.7 °C with respect to the ambient temperature. This implies that the capacity/energy performance cannot just be ascribed to the starting ambient temperature. Although cell capacity takes into account the change in lithium concentration in the electrode’s active material, it does not consider the energy used to change the concentration. The energy delivered is the energy that is transferred to an external load when the cell is being discharged. Thus, depending upon the cell voltage, the energy delivered can be different for a particular capacity (Ah) discharged. As shown in Table 4, this is the case at 0 °C ambient temperature, where discharge capacity increases as discharge current increases from 1C to 3C, but the discharge energy decreases. This implies that the effect of self-heating is not enough to affect the voltage as much as it affects the cell overpotential.
Table 4.
Discharge characteristics for different C-rates at different ambient temperatures for ‘air cooling’ test cases.
3.1. Comparison between Air and Oil Based Thermal Control System for Low Ambient Temperatures and High Load Currents
Table 5 presents the capacity test results for the oil cooling method. Conducting experiments using an oil-based thermal control system makes a substantial difference to the discharge capacity of the cell compared to air control in a thermal chamber. For example, Figure 2 shows 1C discharge curves at −20 °C for both air- and oil-cooled methods. The air cooling method produces 31.7% higher capacity (39.2% higher energy) than when employing active thermal management (oil cooled). This implies that self-heating is substantially affecting cell discharge behaviour at −20 °C ambient temperature. This is reflected in the voltage profiles as well, which is the cause for higher percentage of total energy. For the same discharge current, the voltage for the oil cooling case decreases much faster than for the air cooling case. The counterintuitive increase in cell voltage observed for the air cooling case, which was also reported in previous research [46], is not seen for the oil cooling case, as it is likely related to the temperature increase of the cell.
Table 5.
Discharge characteristics for different C-rates at different ambient temperatures for ‘oil cooling’ test cases.
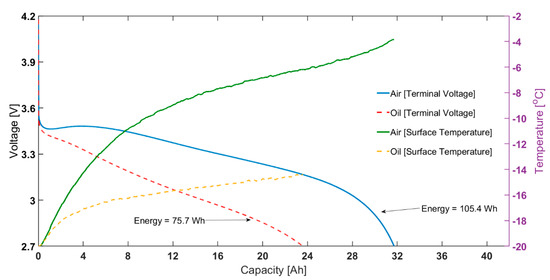
Figure 2.
At −20 °C ambient temperature: capacity vs voltage for 1C constant current discharge (left) and surface temperature rise for the same test (right).
As also shown in Figure 2, for the same test, the final surface temperature for the ‘air cooling’ case is −3.9 °C, considerably higher than the −15.3 °C measured for the ‘oil cooling’ case. Note that, even for the oil cooling case, there is a temperature rise seen during the discharge cycle, indicating it is also not completely adiabatic. This is due to the limited cooling capability of the oil-based immersion rig; this is limited by the performance of the Lauda unit at −20 ℃ and below. This is possibly complicated by the decreased heat capacity, increased viscosity and decreased viscosity of Kryo-95 in such conditions; although the oil is rated for use till −95 ℃. Therefore, the difference in capacity seen will be higher when the surface temperature is controlled exactly at the ambient temperature. The shape of temperature change, i.e., a sharp increase at the beginning and slower increase for remaining discharge duration likely due to the change of resistance with temperature and SOC.
Resistance was measured using 1C discharge pulses of 10 s at 20%, 50% and 80% SOC, at −20, −10, 0 and 25 °C. The pure Ohmic part (Ro) of the resistance is not expected to remain constant over the SOC range tested. Figure 3 presents the Ro values parameterised at different temperatures averaged across the SOC set points. For a −20 °C ambient temperature, the Ro is 21.7 mΩ. Whereas at 25 °C, the DCR is 1.8 mΩ. DCR increases with decreasing ambient temperature because of higher overpotentials induced due to charge transfer, lower ionic conductivity and sluggish diffusion in the electrode active material [23,47].
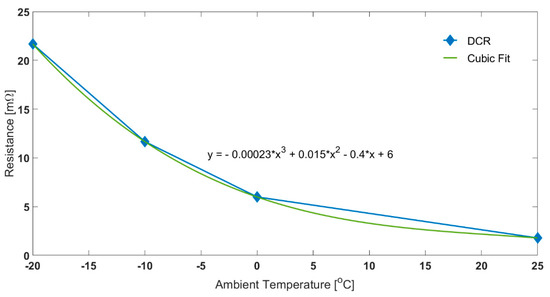
Figure 3.
Effect of Temperature on Ohmic Resistance for 1C Discharge Pulse.
For both oil and air cases, the electrical characteristics for the constant current discharges are similar until self-heating takes effect and becomes dominant. At the end of discharge, when the load current was removed, it was seen that, for the air test, the Ohmic resistance was 7.8 mΩ (assuming cubic fit for resistance at −3.9 °C). On the other hand, for the oil test, the corresponding value was 16.3 mΩ (fit at −15.3 °C). In fact, the difference between the two thermal control methods, and thus the impact of self-heating, is reflected in the rising cell voltage seen for discharge using air cooling (red circle in Figure 2). As temperature increases, Ro drops, producing less heat, slowing the temperature rise rate.
In Figure 4, it is shown that the discrepancy between choosing air based and oil based thermal control system for parameterisation tends to become more prominent as ambient temperature decreases and/or discharge C-rate increases. For the air cooling case, higher discharge C-rate and lower ambient temperature means greater self-heating and higher cell temperatures. However, for the oil cooling cases, the surface temperature rise seen was suppressed to a considerably smaller value. This was reflected in the capacity characteristics for the oil cooling cases compared to the air cooling cases. For example, for 3C discharge at −10 °C, the capacity discharged for the air cooling case was higher by 9.5% than that discharged for 0.25C. However, for the oil cooling case, the capacity discharged for 3C was lower than that for 0.25C by 22.3%.
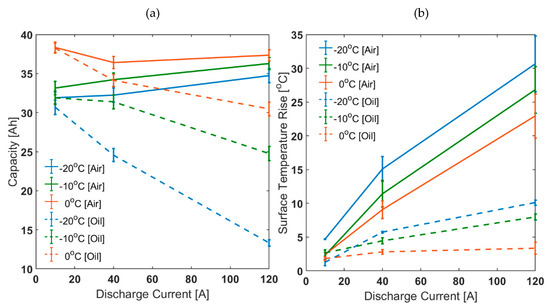
Figure 4.
Discharge characteristics at different ambient temperatures for Various C-rates: (a) capacity and (b) surface temperature rise.
Forced air convection or ‘air cooling’ is employed as part of traditional parameterisation methods. However, this method overestimates capacity available at low ambient temperatures due to rapid degree of self-heating making corresponding models unreliable. This means that depending on the thermal control system, any conclusions regarding the effect of self-heating can be different. Therefore, when reviewing models, the temperature rise for the capacity test is important because the lower the temperature rise, the more reliable the data. Thus, it is recommended that active thermal management or ‘oil cooling’ is employed as part of standardised parameterisation methods.
To validate the effect of overpotential for both cases (‘air cooling’ and ‘oil cooling’ parameterisation), after discharge at the low ambient temperature was terminated, the cells were brought up to 25 °C ambient temperature and then discharged with a nominal 0.10C constant discharge current. This is shown in Figure 5 and is termed as the residual capacity [48]. To investigate the effect of low ambient temperature induced cell overpotential, the OCV-SOC discharge relationship of the cells was also included in the comparison. While the residual capacity for the ‘air cooling’ case was 9.8 Ah, the corresponding value for the ‘oil cooling’ case was 18.0 Ah. This aggregates to a total capacity discharged of 41.7 Ah and 41.8 Ah, respectively. Furthermore, the total capacity discharged for the OCV case was similar (42 Ah).
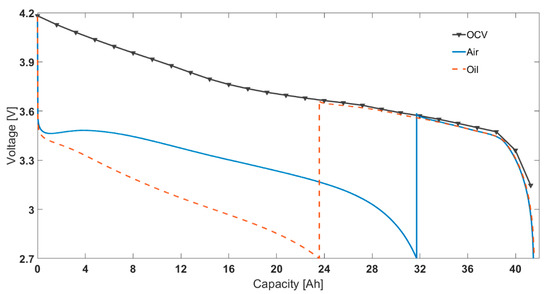
Figure 5.
Comparison of discharge characteristics for 1c at −20 °c ambient temperature.
In the literature, it is argued that self-heating helps improve discharge performance of cells at low ambient temperatures. While self-heating is beneficial in terms of real-world performance, it adversely affects the cell characterisation data for battery modelling, where the performance of the cell is required to be maintained at the desired parameterisation temperature. For example, to obtain capacity values for different C-rates at an ambient temperature (for example −20 °C), it is imperative that the cell operating temperature remains close to the ambient temperature throughout the experiment, i.e., isothermal test conditions.
For the air cooling cases, for example for 1C discharge, the final cell temperature was −4.9 °C. This means that the capacity value obtained would be for an effective temperature between −20 and −4.9 °C rather than at the chosen ambient temperature. In this section, it has been shown that by keeping the test conditions more isothermal (using oil cooling), the capacity values obtained are considerably lower than those seen in the air cooling cases. This issue has been shown to become more prominent as ambient temperature decreased and/or discharge C-rate increased. For example, at 25 °C ambient temperature and 0.25C discharge current, the ‘air cooling’ capacity was only higher by 0.5% than the ‘oil cooling’ capacity (Figure 6). However, at −20 °C and for 3C discharge, the ‘air cooling’ capacity was 61.7% higher than the corresponding ‘oil cooling capacity’. Finally, due to convolution of electrical and thermal phenomena, for 3C discharge, as ambient temperature decreases from 25 to −20 °C, the capacity reduction should be about 66% (oil cooling case), rather than just 12.1% (air cooling case).
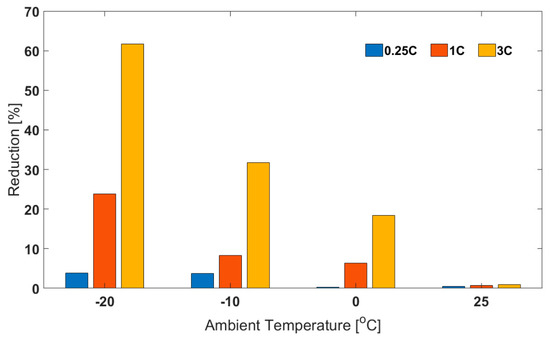
Figure 6.
Percentage Reduction in Capacity for Oil Cooling Relative to Corresponding Capacity for Air Cooling at Different Ambient Temperatures and Discharge C-rates.
Overall, there is a significant difference between characterising lithium-ion cells for performance investigation and for model parameterisation. In real-world applications at low ambient temperature, it is better for cells to heat up faster to achieve better performance. However, for model parameterisation involving current and temperature as separate model inputs, it is better that the effects are separated and that the temperature of the cell is maintained at a constant level. The modelling implications are demonstrated in the following section.
3.2. Validation Using SOC Estimation: Effect of Legislative Drive Cycles
To compare the effect of choosing different thermal control methods (air based and oil based), the cells were cycled for two legislative drive cycles. The starting SOC chosen was 65%. The ambient temperatures chosen were −15, −5, and 5 °C. Fully charged cells were first discharged to 65% SOC using 0.5C operating current at 25 °C ambient temperature. Then, the cells were cooled down to the test temperature and rested for at least 4 h before employing the drive cycle. Note, the drive cycle experiments were conducted in a standard thermal chamber with forced air convection. This is in contrast to the SOC parameterisation experiments that were conducted for both ‘air cooling’ and ‘oil cooling’ cases. The power, current, voltage and surface temperature profiles are given in Figure 7. For translating the difference between air and oil approaches at a parameterisation level to RDR estimation level, it was assumed that the inputs were experimental operating current and measured surface temperature. That is, for estimating SOC for 2xUS06 at 65% starting SOC and −15 °C starting ambient temperature, the inputs considered in the model were current and surface temperature (as per Figure 7 b, d). For the 2xUS06 cycling for −15 °C starting ambient temperature, the experimental capacity and energy discharged were 11.3 Ah and 33.9 Wh, respectively. From the model, the end SOC estimated for the air case was 33.3% and for the oil case it was 24.9% (Figure 8). The SOC difference between the two approaches is 8.4%. Assuming a 100 mile remaining driving range for 100% SOC, the remaining driving range would therefore be 8.4 miles lower for the oil approach compared to air approach. The mean power for the drive cycle was 140 W. To validate the SOC estimated, after the cells were cycled for 2xUS06 cycles, the cells were immediately further discharged at 140 W until their power delivery reduced by 50% (i.e., to 70 W under 2.7 V cut-off voltage). Assuming a 42 Ah capacity from the rest voltage in Figure 5, the approximate real SOC was 22.3%. Therefore, employing an ‘air’ parameterised dataset will lead to inaccurate assessment of usable capacity and cause models to overestimate remaining driving range compared to those parameterised using ‘oil cooling’, using data from the cell closer to the aim parameterisation temperature.
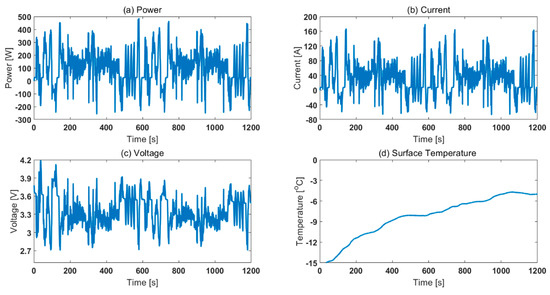
Figure 7.
Experimental characteristics of 2xUS06 for 65% starting SOC and −15 °C starting ambient temperature: (a) power, (b) current, (c) voltage and (d) surface temperature.
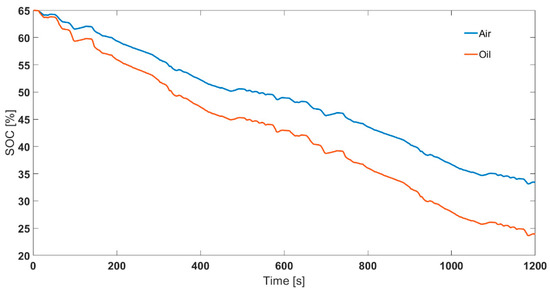
Figure 8.
Comparison between air and oil parameterised SOC profiles for 2 back-to-back US06 cycles (2xUS06) at 65% starting SOC and −15 °C ambient temperature.
The significance of ensuring isothermal operating conditions may have been overlooked, as most battery testing is conducted at higher operating conditions where the degree of self-heating is lower. This is due to the cell internal resistances being lower (Figure 3). The reduced impact of ‘isothermal operation’ is illustrated in Figure 9a. It is shown that for the 2xUS06, the end SOC values parameterised for air and oil cases converge at higher ambient temperatures. Correspondingly, the surface temperature rise is also reduced as ambient temperature increases (Figure 9b). The difference in the end SOC values for air compared to oil decreases from 8.4% (at −15 °C ambient temperature) to 0.2% at 25 °C ambient temperature. The corresponding values for surface temperature rise are 10.2 °C and 1.1°C, respectively. The cell core temperature will be higher due to poor through-plane thermal conductivity of lithium-ion cells [49], which can be estimated through an appropriate thermal model. If temperature is measured at the core, a better thermal control can be effected [50]. This would be ideal, allowing better separation of thermal and electrical phenomena by maintaining exact isothermal conditions during the experiment.
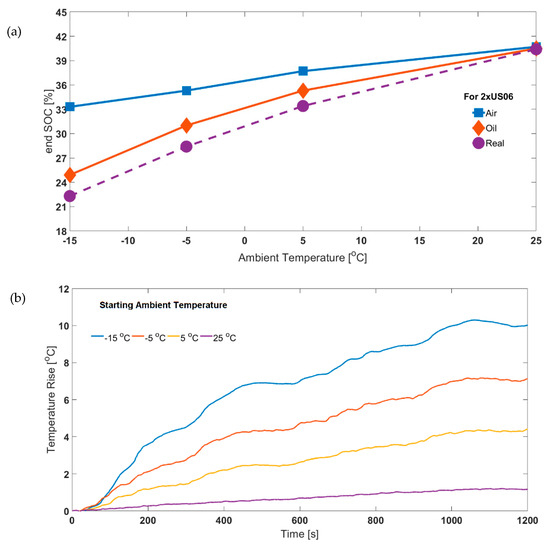
Figure 9.
(a) Effect of using air and oil based parameters on end SOC at different starting ambient temperatures (for 65% starting SOC) for experimental air based 2xUS06 and (b) experimental surface temperature rise for air based 2xUS06.
Overall, the results have demonstrated that maintaining isothermal test conditions during model parameterisation experiments have a direct effect on battery state evolution. However, the latest testing standards, such as the IEC 62660-1 and UNECE 38.3, only specify the ambient temperature. This is because most standards are defined to emulate testing for real-world performance of lithium-ion cells. However, for modelling purposes, particularly to parameterise models, there do not exist any testing standards. Most researchers and OEMs rely on engineering best practices to obtain repeatable data [20]. Within this, the effect of thermal boundary condition during a charge/discharge process has been ignored. It is recommended that, future testing standards should include adherence to isothermal test conditions and a maximum tolerance level, so as to improve the quality of model parameterisation data and in turn battery states relying on them.
Immersion oil cooling using dielectric fluids is a promising technique to reduce thermal gradients within a real-world battery pack due to the large thermal mass of the cooling system [32]. In future work, effect of this thermal management system can be investigated at module level, particularly to investigate thermal performance for motorsport applications and cycling life for passenger applications. Furthermore, similar products such as boiling fluids, have shown additional potential as a thermal runaway deterrent if the cells are immersed in it [51]. Based on this, further work can be conducted to investigate if expensive thermal chambers, rated at European Council for Automotive R&D (EUCAR) hazard level 6, can be replaced with cheaper immersion oil baths to conduct the same experiments, while maintaining similar safety standards and allowing for better thermal control.
4. Conclusions
Battery models are reliant on the accuracy of their parameters and the experiments conducted to obtain them. In this paper, the direct impact of using inaccurate parameterisation data on battery state evolution is shown.
This article presents a novel methodology to track accessible battery capacity for model parameterisation, using ‘oil based’ active thermal management, allowing for close-to isothermal test conditions. It is shown that the traditional ‘air based’ methodology for tracking accessible battery capacity overestimates capacity at low ambient temperatures. This is mainly due to the increase in cell internal resistance, and the overpotential that adds.
While self-heating is beneficial for battery performance in the real world, this can be detrimental to battery model parameterisation. A model parameterised under far-from-isothermal conditions will overestimate remaining driving range in real world applications at low temperature. Validation results for this hypothesis have been presented in this article using legislative drive cycles.
The significance of ensuring isothermal operating conditions have been overlooked as most battery testing is conducted at higher operating temperatures where the degree of self-heating and their impact on accessible capacity are lower. Therefore, existing model parameterisation testing programmes should attempt to separate battery electrical and thermal behaviour by conducting parameterisation experiments in isothermal test conditions, especially for low temperatures.
Author Contributions
Conceptualization, Y.T. and A.B.; Formal analysis, Y.T.; Funding acquisition, A.M.; Methodology, Y.T.; Supervision, A.M. and A.B.; Validation, Y.T.; Writing—original draft, Y.T.; Writing—review & editing, A.M. and A.B. All authors have read and agreed to the published version of the manuscript.
Funding
The research presented within this paper is supported by the Innovate UK through the Warwick Manufacturing Group (WMG) center High Value Manufacturing (HVM) Catapult (https://hvm.catapult.org.uk/) in collaboration with Jaguar Land Rover.
Acknowledgments
Y.T is especially grateful to the technician support provided in EIC. This work forms part of Y.T.’s PhD research programme, scholarship for which was provided by WMG, University of Warwick.
Conflicts of Interest
The authors declare no conflict of interest.
References
- Li, H.; Hosoi, K.; Amine, K.; Howell, D.; Passerini, S.; Zeisel, H.; Bresser, D. Perspectives of automotive battery R&D in China, Germany, Japan, and the USA. J. Power Sources 2018, 382, 176–178. [Google Scholar]
- Emadi, A.; Rajashekara, K.; Williamson, S.S.; Lukic, S.M. Topological overview of hybrid electric and fuel cell vehicular power system architectures and configurations. IEEE Trans. Veh. Technol. 2005, 54, 763–770. [Google Scholar] [CrossRef]
- Lithium and Cobalt: A Tale of Two Commodities|McKinsey. Available online: https://www.mckinsey.com/industries/metals-and-mining/our-insights/lithium-and-cobalt-a-tale-of-two-commodities (accessed on 2 February 2020).
- Nykvist, B.; Nilsson, M. Rapidly falling costs of battery packs for electric vehicles. Nat. Clim. Chang. 2015, 5, 329–332. [Google Scholar] [CrossRef]
- Miller, P. Automotive lithium-ion batteries. Johns. Matthey Technol. Rev. 2015, 59, 4–13. [Google Scholar] [CrossRef]
- World’s First Fully Electric Commercial Aircraft Takes Flight in Canada|World News|The Guardian. Available online: https://www.theguardian.com/world/2019/dec/11/worlds-first-fully-electric-commercial-aircraft-takes-flight-in-canada (accessed on 11 February 2020).
- Green Flyway: Norway, Sweden Create Airspace For Electric Plane Tests. Available online: https://www.forbes.com/sites/davidnikel/2020/01/30/green-flyway-norway-sweden-create-airspace-for-electric-plane-tests/#28ea997541b9 (accessed on 11 February 2020).
- Zahabi, S.A.H.; Miranda-Moreno, L.; Barla, P.; Vincent, B. Fuel economy of hybrid-electric versus conventional gasoline vehicles in real-world conditions: A case study of cold cities in Quebec, Canada. Transp. Res. Part D Transp. Environ. 2014, 32, 184–192. [Google Scholar] [CrossRef]
- Tripathy, Y.; Mcgordon, A.; Low, J.; Marco, J. Low temperature performance of lithium-ion batteries for different drive cycles. In Proceedings of the Electric Vehicle Symposium (EVS 29), Montréal, QC, Canada, 19–21 Junary 2016; pp. 1–12. [Google Scholar]
- Singer, J.P.; Birke, K.P. Kinetic study of low temperature capacity fading in Li-ion cells. J. Energy Storage 2017, 13, 129–136. [Google Scholar] [CrossRef]
- Zhu, G.; Wen, K.; Lv, W.; Zhou, X.; Liang, Y.; Yang, F.; Chen, Z.; Zou, M.; Li, J.; Zhang, Y.; et al. Materials insights into low-temperature performances of lithium-ion batteries. J. Power Sources 2015, 300, 29–40. [Google Scholar] [CrossRef]
- Rizalino, J.; Reyes, M.D.; Member, A.; Parsons, R.V.; Hoemsen, R. Winter happens: The effect of ambient temperature on the travel range of electric vehicles. IEEE Trans. Veh. Technol. 2016, 65, 4016–4022. [Google Scholar]
- Jeffs, J.; McGordon, A.; Picarelli, A.; Robinson, S.; Tripathy, Y.; Widanage, W. Complex heat pump operational mode identification and comparison for use in electric vehicles. Energies 2018, 11, 2000. [Google Scholar] [CrossRef]
- Zhang, Z.; Li, W.; Zhang, C.; Chen, J. Climate control loads prediction of electric vehicles. Appl. Therm. Eng. 2017, 110, 1183–1188. [Google Scholar] [CrossRef]
- Nejad, S.; Gladwin, D.T.; Stone, D.A. A systematic review of lumped-parameter equivalent circuit models for real-time estimation of lithium-ion battery states. J. Power Sources 2016, 316, 183–196. [Google Scholar] [CrossRef]
- We Drove These Electric Cars Until They DIED!—YouTube. Available online: https://www.youtube.com/watch?v=ZH7V2tU3iFc (accessed on 8 April 2020).
- Varga, B.; Sagoian, A.; Mariasiu, F. Prediction of electric vehicle range: A comprehensive review of current issues and challenges. Energies 2019, 12, 946. [Google Scholar] [CrossRef]
- Biggest Winter Range Test Ever Reveals Best EVs For Cold Weather. Available online: https://insideevs.com/news/404632/winter-range-test-best-evs-cold-weather/ (accessed on 28 March 2020).
- Neubauer, J.; Wood, E. The impact of range anxiety and home, workplace, and public charging infrastructure on simulated battery electric vehicle lifetime utility. J. Power Sources 2014, 257, 12–20. [Google Scholar] [CrossRef]
- Barai, A.; Uddin, K.; Dubarry, M.; Somerville, L.; McGordon, A.; Jennings, P.; Bloom, I. A comparison of methodologies for the non-invasive characterisation of commercial Li-ion cells. Prog. Energy Combust. Sci. 2019, 72, 1–31. [Google Scholar] [CrossRef]
- Ji, Y.; Wang, C.Y. Heating strategies for Li-ion batteries operated from subzero temperatures. Electrochim. Acta 2013, 107, 664–674. [Google Scholar] [CrossRef]
- Grandjean, T.; McGordon, A.; Jennings, P. Structural identifiability of equivalent circuit models for li-ion batteries. Energies 2017, 10, 90. [Google Scholar] [CrossRef]
- Jaguemont, J.; Boulon, L.; Dube, Y. Characterization and modeling of a hybrid-electric-vehicle lithium-ion battery pack at low temperatures. IEEE Trans. Veh. Technol. 2016, 65, 1–14. [Google Scholar] [CrossRef]
- Silva, L.I.; Jaguemont, J.; De Angelo, C.H. Modeling an Electric Vehicle Lithium-Ion Battery Pack Considering Low Temperature behavior. In Proceedings of the 2016 IEEE Vehicle Power and Propulsion Conference (VPPC), Hangzhou, China, 17–20 October 2016. [Google Scholar]
- Watrin, N.; Roche, R.; Ostermann, H.; Blunier, B.; Miraoui, A. Multiphysical lithium-based battery model for use in state-of-charge determination. IEEE Trans. Veh. Technol. 2012, 61, 3420–3429. [Google Scholar] [CrossRef]
- Hu, X.; Li, S.; Peng, H. A comparative study of equivalent circuit models for Li-ion batteries. J. Power Sources 2012, 198, 359–367. [Google Scholar] [CrossRef]
- Von Srbik, M.T.; Marinescu, M.; Martinez-Botas, R.F.; Offer, G.J. A physically meaningful equivalent circuit network model of a lithium-ion battery accounting for local electrochemical and thermal behaviour, variable double layer capacitance and degradation. J. Power Sources 2016, 325, 171–184. [Google Scholar] [CrossRef]
- Ardani, M.I.; Patel, Y.; Siddiq, A.; Offer, G.J.; Martinez-Botas, R.F. Combined experimental and numerical evaluation of the differences between convective and conductive thermal control on the performance of a lithium ion cell. Energy 2018, 144, 81–97. [Google Scholar] [CrossRef]
- Chen, D.; Jiang, J.; Kim, G.H.; Yang, C.; Pesaran, A. Comparison of different cooling methods for lithium ion battery cells. Appl. Therm. Eng. 2016, 94, 846–854. [Google Scholar] [CrossRef]
- Bolsinger, C.; Birke, K.P. Effect of different cooling configurations on thermal gradients inside cylindrical battery cells. J. Energy Storage 2019, 21, 222–230. [Google Scholar] [CrossRef]
- Liu, H.; Wei, Z.; He, W.; Zhao, J. Thermal issues about Li-ion batteries and recent progress in battery thermal management systems: A review. Energy Convers. Manag. 2017, 150, 304–330. [Google Scholar] [CrossRef]
- Deng, Y.; Feng, C.; E, J.; Zhu, H.; Chen, J.; Wen, M.; Yin, H. Effects of different coolants and cooling strategies on the cooling performance of the power lithium ion battery system: A review. Appl. Therm. Eng. 2018, 142, 10–29. [Google Scholar] [CrossRef]
- Wu, W.; Wang, S.; Wu, W.; Chen, K.; Hong, S.; Lai, Y. A critical review of battery thermal performance and liquid based battery thermal management. Energy Convers. Manag. 2019, 262–281. [Google Scholar] [CrossRef]
- Nissan LEAF Charger|Pod Point. Available online: https://pod-point.com/landing-pages/nissan-leaf-charging (accessed on 17 January 2019).
- Barai, A.; Uddin, K.; Chevalier, J.; Chouchelamane, G.H.; McGordon, A.; Low, J.; Jennings, P. Transportation safety of lithium iron phosphate batteries—A feasibility study of storing at very low states of charge. Sci. Rep. 2017, 7, 1–10. [Google Scholar] [CrossRef]
- Tripathy, Y.; McGordon, A.; Low, C.T.J. A new consideration for validating battery performance at low ambient temperatures. Energies 2018, 11, 2439. [Google Scholar] [CrossRef]
- Birrell, S.A.; McGordon, A.; Jennings, P.A. Defining the accuracy of real-world range estimations of an electric vehicle. In Proceedings of the 17th International IEEE Conference on Intelligent Transportation Systems (ITSC), Qingdao, China, 8–11 October 2014; pp. 2590–2595. [Google Scholar]
- Gao, Z.; LaClair, T.; Ou, S.; Huff, S.; Wu, G.; Hao, P.; Boriboonsomsin, K.; Barth, M. Evaluation of electric vehicle component performance over eco-driving cycles. Energy 2019, 172, 823–839. [Google Scholar] [CrossRef]
- Doucette, R.T.; Mcculloch, M.D. Modeling the CO 2 emissions from battery electric vehicles given the power generation mixes of different countries. Energy Policy 2010, 39, 803–811. [Google Scholar] [CrossRef]
- Fiori, C.; Ahn, K.; Rakha, H.A. Power-based electric vehicle energy consumption model: Model development and validation. Appl. Energy 2016, 168, 257–268. [Google Scholar] [CrossRef]
- Kambly, K.; Bradley, T.H. Geographical and temporal differences in electric vehicle range due to cabin conditioning energy consumption. J. Power Sources 2015, 275, 468–475. [Google Scholar] [CrossRef]
- Myall, D.; Ivanov, D.; Larason, W.; Nixon, M.; Moller, H. Accelerated reported battery capacity loss in 30 kWh variants of the nissan leaf. Preprints 2018, 2018, 2018030122. [Google Scholar]
- Nikolian, A.; Jaguemont, J.; de Hoog, J.; Goutam, S.; Omar, N.; Van Den Bossche, P.; Van Mierlo, J. Complete cell-level lithium-ion electrical ECM model for different chemistries (NMC, LFP, LTO) and temperatures (−5 °C to 45 °C)—Optimized modelling techniques. Int. J. Electr. Power Energy Syst. 2018, 98, 133–146. [Google Scholar] [CrossRef]
- Jaguemont, J.; Boulon, L.; Venet, P.; Dube, Y.; Sari, A. Lithium-ion battery aging experiments at subzero temperatures and model development for capacity fade estimation. IEEE Trans. Veh. Technol. 2016, 65, 4328–4343. [Google Scholar] [CrossRef]
- Ji, Y.; Zhang, Y.; Wang, C.-Y. Li-ion cell operation at low temperatures. J. Electrochem. Soc. 2013, 160, A636–A649. [Google Scholar] [CrossRef]
- Grandjean, T.; Barai, A.; Hosseinzadeh, E.; Guo, Y.; Mcgordon, A.; Marco, J. Large format lithium ion pouch cell full thermal characterisation for improved electric vehicle thermal management. J. Power Sources 2017, 359, 215–225. [Google Scholar] [CrossRef]
- Waag, W.; Käbitz, S.; Sauer, D.U. Experimental investigation of the lithium-ion battery impedance characteristic at various conditions and aging states and its influence on the application. Appl. Energy 2013, 102, 885–897. [Google Scholar] [CrossRef]
- Dubarry, M.; Svoboda, V.; Hwu, R.; Liaw, B.Y. Capacity loss in rechargeable lithium cells during cycle life testing: The importance of determining state-of-charge. J. Power Sources 2007, 174, 1121–1125. [Google Scholar] [CrossRef]
- Veth, C.; Dragicevic, D.; Merten, C. Thermal characterizations of a large-format lithium ion cell focused on high current discharges. J. Power Sources 2014, 267, 760–769. [Google Scholar] [CrossRef]
- Osswald, P.J.; Del Rosario, M.; Garche, J.; Jossen, A.; Hoster, H.E. Fast and accurate measurement of entropy profiles of commercial lithium-ion cells. Electrochim. Acta 2015, 177, 270–276. [Google Scholar] [CrossRef]
- Everson, J.; Tripathy, Y.; Barai, A.; Amor-Segan, M. Thermal runaway suppression capability of state-of-the-art coolant fluids for lithium-ion battery applications. In Proceedings of the ECS Meeting Abstracts, Atlanta, GA, USA, 13–17 October 2019. [Google Scholar]


© 2020 by the authors. Licensee MDPI, Basel, Switzerland. This article is an open access article distributed under the terms and conditions of the Creative Commons Attribution (CC BY) license (http://creativecommons.org/licenses/by/4.0/).