Article

Numerical Studies on Teeter Bed Separator for Particle Separation

School of Chemical and Environmental Engineering, China University of Mining and Technology (Beijing), Beijing 100083, China
*
Author to whom correspondence should be addressed.
Energies 2020, 13(8), 2025; https://doi.org/10.3390/en13082025
Submission received: 21 January 2020 / Revised: 13 April 2020 / Accepted: 16 April 2020 / Published: 18 April 2020
(This article belongs to the Section L: Energy Sources)

Abstract

:
Teeter Bed Separators (TBS) are liquid–solid fluidized beds that are widely used in separation of coarse particles in coal mining industry. The coal particles settle in the self-generating medium bed resulting in separation according to density. Due to the existence of self-generating medium beds, it is difficult to study the sedimentation of particles in TBS through experiments and detection methods. In the present research, a model was built to investigate the bed expansion characteristics with water velocity based on the Euler–Euler approach, and to investigate the settling of foreign particles through bed based on the Euler–Lagrange approach in TBS. Results show that the separation of in TBS should be carried out at low water velocity under the condition of stable fluidized bed. Large particles have a high slip velocity, and they are easily flowing through the bed into the light product leading to a mismatch. The importance of self-generating bed on separation of particle with narrow size ranges are clarified. The model provides a way for investigating the separation of particles in a liquid–solid fluidized bed and provides suggestions for the selection of operation conditions in TBS application.

Graphical Abstract

1. Introduction

Fluidization technology has been widely used in chemical reactions, mineral/coal separation and pneumatic conveying in the past few decades [1,2,3,4]. Teeter bed separator (TBS) is one of liquid–solid fluidized beds mainly applied to the separation of coal fines and mineral, desliming and tailings recovery [5,6,7,8]. It is one kind of gravity separators based on the principle of fluidization and hindering settling, in which particles with a wide range of densities and sizes have different settling velocities. The heavy particles have a higher settling velocity and settle through a multi-particle suspension consisting of water and intermediate mass particles, while the light particles have a lower settling velocity and rise through the suspension, thereby achieving the particle separation.
There are many investigations focusing on the application of TBS. For improving the separation efficiency, several measures were taken on the equipment, such as optimization of the feeding structure, installation of inclined plates and introducing of the pulsating water flow and bubbles and thus, a series of new separators were produced [9,10,11,12]. It has been reported that new separators were well applied in mineral sand, low grade iron ore, chromite and coal fines in industry, as well as pyrite, phosphate ore, heavy minerals, electronic waste and hematite in laboratory and pilot plants [13,14,15]. Applications separating these materials have been illustrated the improvement for separation performance of TBS. Moreover, the influence of operating variables, including bed density, water velocity, feed concentration and feed rate on classification or separation performance for coal and non-coal materials was studied [16,17,18]. Research showed that water velocity and bed density are much crucial for particles separation or classification and the significance of the parameters on cut size/density, possible error, grade and recovery of products varied with the different distribution of particle size and density in the feed. Thus, the parameters should be adjusted according to the real samples and demand. Several researches were also attempted to model the particle separation based on convection-diffusion equation, CFD simulation and hindered particle settling model incorporated with operating and design variables [19,20,21]. However, in these applications, the mechanism of the particle movement is the basic and most important for a good prediction and optimization of TBS.
Particles move in TBS by two processes: fluidization and hindered settling, both of which have been investigated by both theoretical and experimental studies. The most classic theory is that of Richardson and Zaki (R-Z) [22], who proposed a settling velocity model for uniform particle in 1954. Ergun [23] proposed a pressure drop formula for uniform particles in 1949. On the above basis, some formulas have been provided for describing the momentum exchange coefficient between liquid and solid phases, based on the hypothesis of a pseudo-fluid for the solids [24,25,26,27]. Other empirical equations have also been studied for predicting the settling velocity of particles in suspension [28,29,30,31,32]. All of these investigations are for the purpose of exploring the laws governing multiphase flow motion and can provide some reference for TBS study. However, the motion of particles in TBS is so complicated, and due to the lack of effective detection technology, it is still difficult to study this process experimentally, particularly for the tracing of particles. In recent years, numerical simulations have been verified as the most effective method to study the fundamental behavior of particle–liquid flow systems.
At present, there are mainly three methods for numerically studying particle–liquid flows in fluidized beds: the pseudo-fluid approach, the discrete phase method and direct numerical simulation.
The pseudo-fluid approach is based on the Euler–Euler (E–E) model in which liquid and solid phases are treated as interpenetrating, continuous phases. Related research using this method has paid more attention to the study of segregation and intermixing of binary particles [33,34,35,36,37,38]. The effect of fluidized water velocity, flow patterns, operating conditions, fluid properties, particle properties, bed dimensions and the drag laws on the motion of binary particles were studied. However, the disadvantage of the method is that it cannot track the particle at any time.
The discrete phase method is based on the Euler–Lagrange (E–L) model. In this model, particles are not processed into continuous phases as in the pseudo-fluid approach, but as discrete phases. The interaction forces, positions and velocities of particles can be tracked according to Newton’s Second Law at each instant. In recent years, CFD-DEM is dominant in this method for the popularity in simulation of the particle–liquid flow. Substantial researches have also focused on various aspects of binary mixtures. Mukherjee and Mishra [39] investigated the characteristics of different binary systems, consisting of two species with wide size in sand, coal, magnetite powder and glass beads. Di Renzo et al. [40] assessed the suitability of a drag force model for describing the particle–liquid flow motion in binary systems and analyzed the hydrodynamics in three binary systems involving different particle species, particle size ratio and operating variables based on the drag model. The crucial velocity for layer inversion was also predicted. Peng and Joshi [41] observed the effect of the collision force on the dispersion of suspension at lower and higher Reynolds number. Vivacqua et al. [42] investigated the effect of liquid temperature on particle stratification. Molaei et al. [43] found that the reason for the layer inversion of binary particles is the imbalance of resistance and pressure gradient force. Peng [44] found that the collision force between foreign particle and fluidized particles can reach 10–50 times that of gravity. The disadvantage of CFD-DEM is that it needs a large consumption of computational resources. Currently, simplifying geometric models and using a relatively fewer number of particles (less than 20,000) are common methods to decrease the consumption in literature studies. It is important to mention that the consequence of using only a small number of particles is that only relatively small volumes of slurry can be simulated. Consequently, the main application of the method is to understand the phenomena occurring, rather than to simulate industrial situation.
Direct numerical simulation (DNS) is another effective method used to simulate the motion of particles. The basic idea of the model is to reduce the grid size around one particle to below the particle size to perform numerical calculation. In other words, the simulation is conducted at a particle scale. The forces acting on particles are not calculated through the existing models but obtained by integrating viscous force and pressure force on the particle surface. There is no doubt that this method needs a huge amount of computational calculation. To better use this method, two methods called fictitious domain method and immersed boundary method have been developed to reduce the computational consumption, in which the domain grids will not change with flow time. Macro and micro information such as the law of particle force, particle trajectory, the velocity of particle and fluid and particle pulsation can be obtained by using these methods [45,46]. The dynamic mesh method, in which the mesh dynamically changes with flow time, is more practical for calculating the flow field due to the boundary motion. A good case is to simulate the change of flow field in a cylinder with piston motion. The method was also utilized to simulate the particle motion. Mitra et al. [47] studied the collision process between one glass bead and one water droplet. Ghatage et al. [32] predicted the settling velocity of a 6 mm foreign particle in a liquid–solid fluidized bed by the E–E approach coupled with dynamic mesh method. Presently, DNS method is still limited by the total number of particles.
As has mentioned, particles in TBS are fine in size and have wide range of densities. they move through the self-generating medium bed, resisting counter water flow and forces from fluidized particles. In the experimental investigations of Grbavčić and Vuković [28] and Van der Wielen et al. [30], they conducted the experiments by preparing special fluidized particles, using stopwatch and laying strong light behind the bed to trace the particle in a column. Even though PIV (particle image velocimetry) detected technology was utilized in the experiment of Ghatage [32], the fluidized particles made of glass were required to be larger in size for a good transparency. Based on the work of Richardson and Zaki [22], Galvin [21] proposed an empirical expression of the particle slip velocity in combination with the actual parameters of bed pressure in TBS. We can see that the experimental investigations are always difficult for high costs, limited experimental conditions and detection tools. However, the particle motion is fundamental and most important, whether it is for the evaluation of operating parameters on separation performance or a good prediction and optimization on the separation process. Numerical literature review demonstrated that the particle motion behavior in liquid fluidized bed can be simulated well. More details of particle–liquid flow were obtained which can be used to make up for the defects of the experiment effectively. It was also found that limited efforts have been put on numerical studies on the characteristics of teeter bed and particle settling behavior in TBS specifically. It is thought desirable to complete studies on two aspects for a good understanding of the separation process. Considering applicability of three numerical methods, we proposed that the pseudo-fluid method is suitable to simulate the fluidized bed composed of a large number of fine particles with less computational consumption. Discrete phase method is more preferable to track the motion of particles through fluidized bed.
Thus, an attempt is made to study the change of bed characteristics with operating water velocity and the settling behavior of particles introduced to the bed based on a combination of the Euler–Euler and Euler–Lagrange approach. The simulation results are compared with the empirical formulas from literature studies. In addition, the influence of operating water velocity on the separation is analyzed from the perspective of flow regimes in bed. The significance of this research is to establish a reasonable approach to study the fundamentals of particle–liquid flow in TBS numerically. The empirical formulas for comparison with simulated results are summarized in Table 1.

2. Model Description

The simulation was carried out on a commercial software, called FLUENT 15.0 based on the finite volume method. The present modeling of the fluidized bed (teeter bed) was based on a two-dimensional Euler–Euler approach where the fluidized particles are considered as continuous phase, namely pseudo-fluid. The resolve of their equation is based on the kinetic theory of granular flow. Then the Euler–Lagrange approach is combined to model the foreign particles motion in which particle is treated as discrete phase. The relevant governing equations for two approaches have been well developed and documented in the literature [34,35,52]. For a clear understanding, here, the models are briefly described below.

2.1. Governing Equation for Liquid and Solid Phases

The liquid and solid phases are considered as continuous phase, respectively, in the Euler–Euler approach, so they have the similar mass and momentum transport equations. These equations can be written as follows:
The mass transport equations for liquid and solid phases are:
( ρ L ε L   ) t + ( ρ L ε L u L ) = 0
( ρ S ε S   ) t + ( ρ S ε S u S ) = 0
The momentum transport equations for liquid and solid phases are:
( ε L ρ L u L   ) t + ( ε L ρ L u L u L ) = ε L p + · τ L = + ε L ρ L g + K S L ( u S u L )
( ε S ρ S u S   ) t + ( ε S ρ S u S u S ) = ε S p + p S + · τ S = + ε S ρ S g + K S L ( u L u S )
where τ S = presents stress tensor, Pa; p S presents the solid pressure, Pa. The interphase exchange coefficient ( K S L ) is modeled using the Huilin–Gidaspow model which is suitable for both high-concentration system and dilute system and it is improved based on the coefficient of Wen and Yu and Eurgun [35]. The Huilin–Gidaspow model coefficient is defined as:
K S L = ψ K S L E u g u r n + ( 1 ψ ) K S L W e n y u ,
where:
ψ = 1 2 + tan 1 ( 262.5 ( ε S 0.2 ) ) π .
For ε L > 0.8
K S L W e n y u = 3 4 C D 1 ε S ε L ρ L | u S   u L | d S ε L 2.65 ,
where:
C D 1 = 24 ε S R e S [ 1 + 0.15 ( ε L R e S ) 0.687 ] .
For ε L < 0.8
K S L E u g u r n = 150 ε S ( 1 ε L ) μ L ε L d S + 1.75 ρ L ε S d S | u S u L | ,
where:
R e S = ρ L d S | u S u L | μ L .
If one foreign particle reaches the force balance in teeter bed, the motion equation for this individual particle is:
d u D d t = 18 μ L ρ S d S × C D 2 R e D 24 ( u S u L ) + g ( ρ D ρ L ) ρ S + F o t h e r
where g is gravitational acceleration originated from particles gravity. The term of C D 2 presents drag force. F o t h e r is other force caused by virtual mass force, pressure gradient force and Saffman lift. C D 2 is defined as follows:
C D 2 = a 1 + a 2 R e + a 2 R e 2
where a 1 ,   a 2 and a 3 are constants that apply over several ranges of R e ( R e D ),
C D 2 = { 24.0 R e                      R e < 0.1 3.69 + 22.73 / R e + 0.0903 / R e 2            R e = 0.1 1 1.222 + 29.1667 / R e 3.8889 / R e 2            R e = 1 10 0.6167 + 46.5 / R e 116.67 / R e 2            R e = 10 100 0.3644 + 98.33 / R e 2778 / R e 2            R e = 100 1000 0.357 + 148.62 / R e 4.75 / R e 2            R e = 1000 5000 0.46 490.546 / R e 57.87 × 10 4 / R e 2            R e = 5000 10 , 000 0.5191 1662.5 / R e 5.1467 × 10 6 / R e 2            R e > 10 , 000  

2.2. Simulation Conditions

A 2D geometric model with a diameter of 120 mm and height of 800 mm is utilized in the present simulation and the details for physical and geometrical parameters are given in Table 2. The mesh is divided with the ICEM CFD software contained in the software package of Ansys15.0. The mesh size is selected as 2 mm based on the literature [34,35] in which particles have the similar size and density with present work, and the Euler–Euler approach are also used to simulate the fluidized bed. In the literature study, the mesh size of 0.5 mm, 1 mm, 2 mm, 3 mm and 3.5 mm is set to explore the mesh-independent simulation. It is found that the bed voidage does not change below 2 mm size. Therefore, we choose the same mesh size of 2 mm. The literature also conducted investigations for the independence of time step and the value of 0.001 s is referred to the present study. In our paper, these setting parameters are finally compared with R-Z model in the next section of result and discussion. Choosing a right turbulence model is also crucial for the accuracy of the simulation. Although the operating water velocity is small, the strong turbulence existed in the bed is obvious. The standard k-ε is incorporated in the simulation of fluidized beds extensively and it exhibits a good description for the turbulence flow in bed. The theory about k-ε turbulence model can be referred to the publications [35]. The collision coefficient between fluidized particles is used with a default value of 0.9. The SIMPLE algorithm is employed to solve the pressure-velocity coupling and the governing equations are discretized by the second-order upwind scheme.
The whole simulation is performed in two steps. The first step is the study of the change of bed properties with water velocity based on the Euler–Euler approach. In this step, fluidized particles with size of 1 mm and a density of 2607 kg/m3 filled the region of 120 mm width × 200 mm height of the column with an initial volume fraction of 0.55. The water flow is introduced from the bottom of the column and the boundary condition of the bottom is defined as velocity inlet. The boundary condition of the top of the column is set as pressure outlet, and two vertical walls are considered as walls with no slip boundary conditions. When all things are prepared well, the teeter bed begins to be fluidized under a wide variety of water velocities of 0.008–0.056 m/s. The judgment of the steady state of fluidization is that the calculated residuals is converged, and the particle volume fraction does not change with the simulated time. After the bed fluidization has stabilized. The DPM (discrete phase model) in FLUENT 15.0 based on Euler–Lagrange approach is started to inject foreign particles from the top of the column separately, and to track their classification velocity through the bed. The final data can be exported from FLUENT 15.0 by the selection of “export” option, and the subsequent data processing is conducted in Microsoft Excel. A schematic diagram of the bed fluidization and particle settling in the bed appears in Figure 1. According to Figure 1, the slip velocity of one foreign particle through the teeter bed can be calculated by using Equation (13):
u D = u D + u L 0 ,
where u D is the slip velocity of foreign particle, also called relative velocity.   u D presents the classification velocity which is the absolute velocity observed relative to the column. u L 0 is the interstitial liquid velocity.

3. Results and Discussion

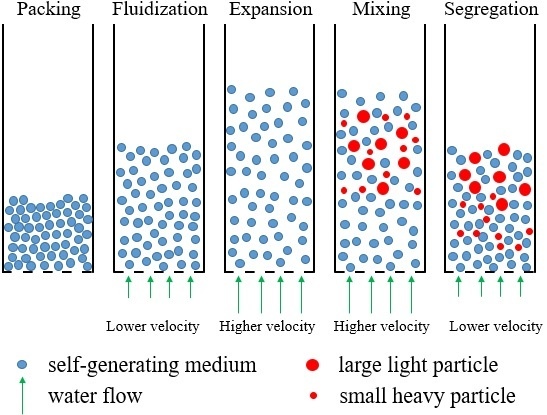
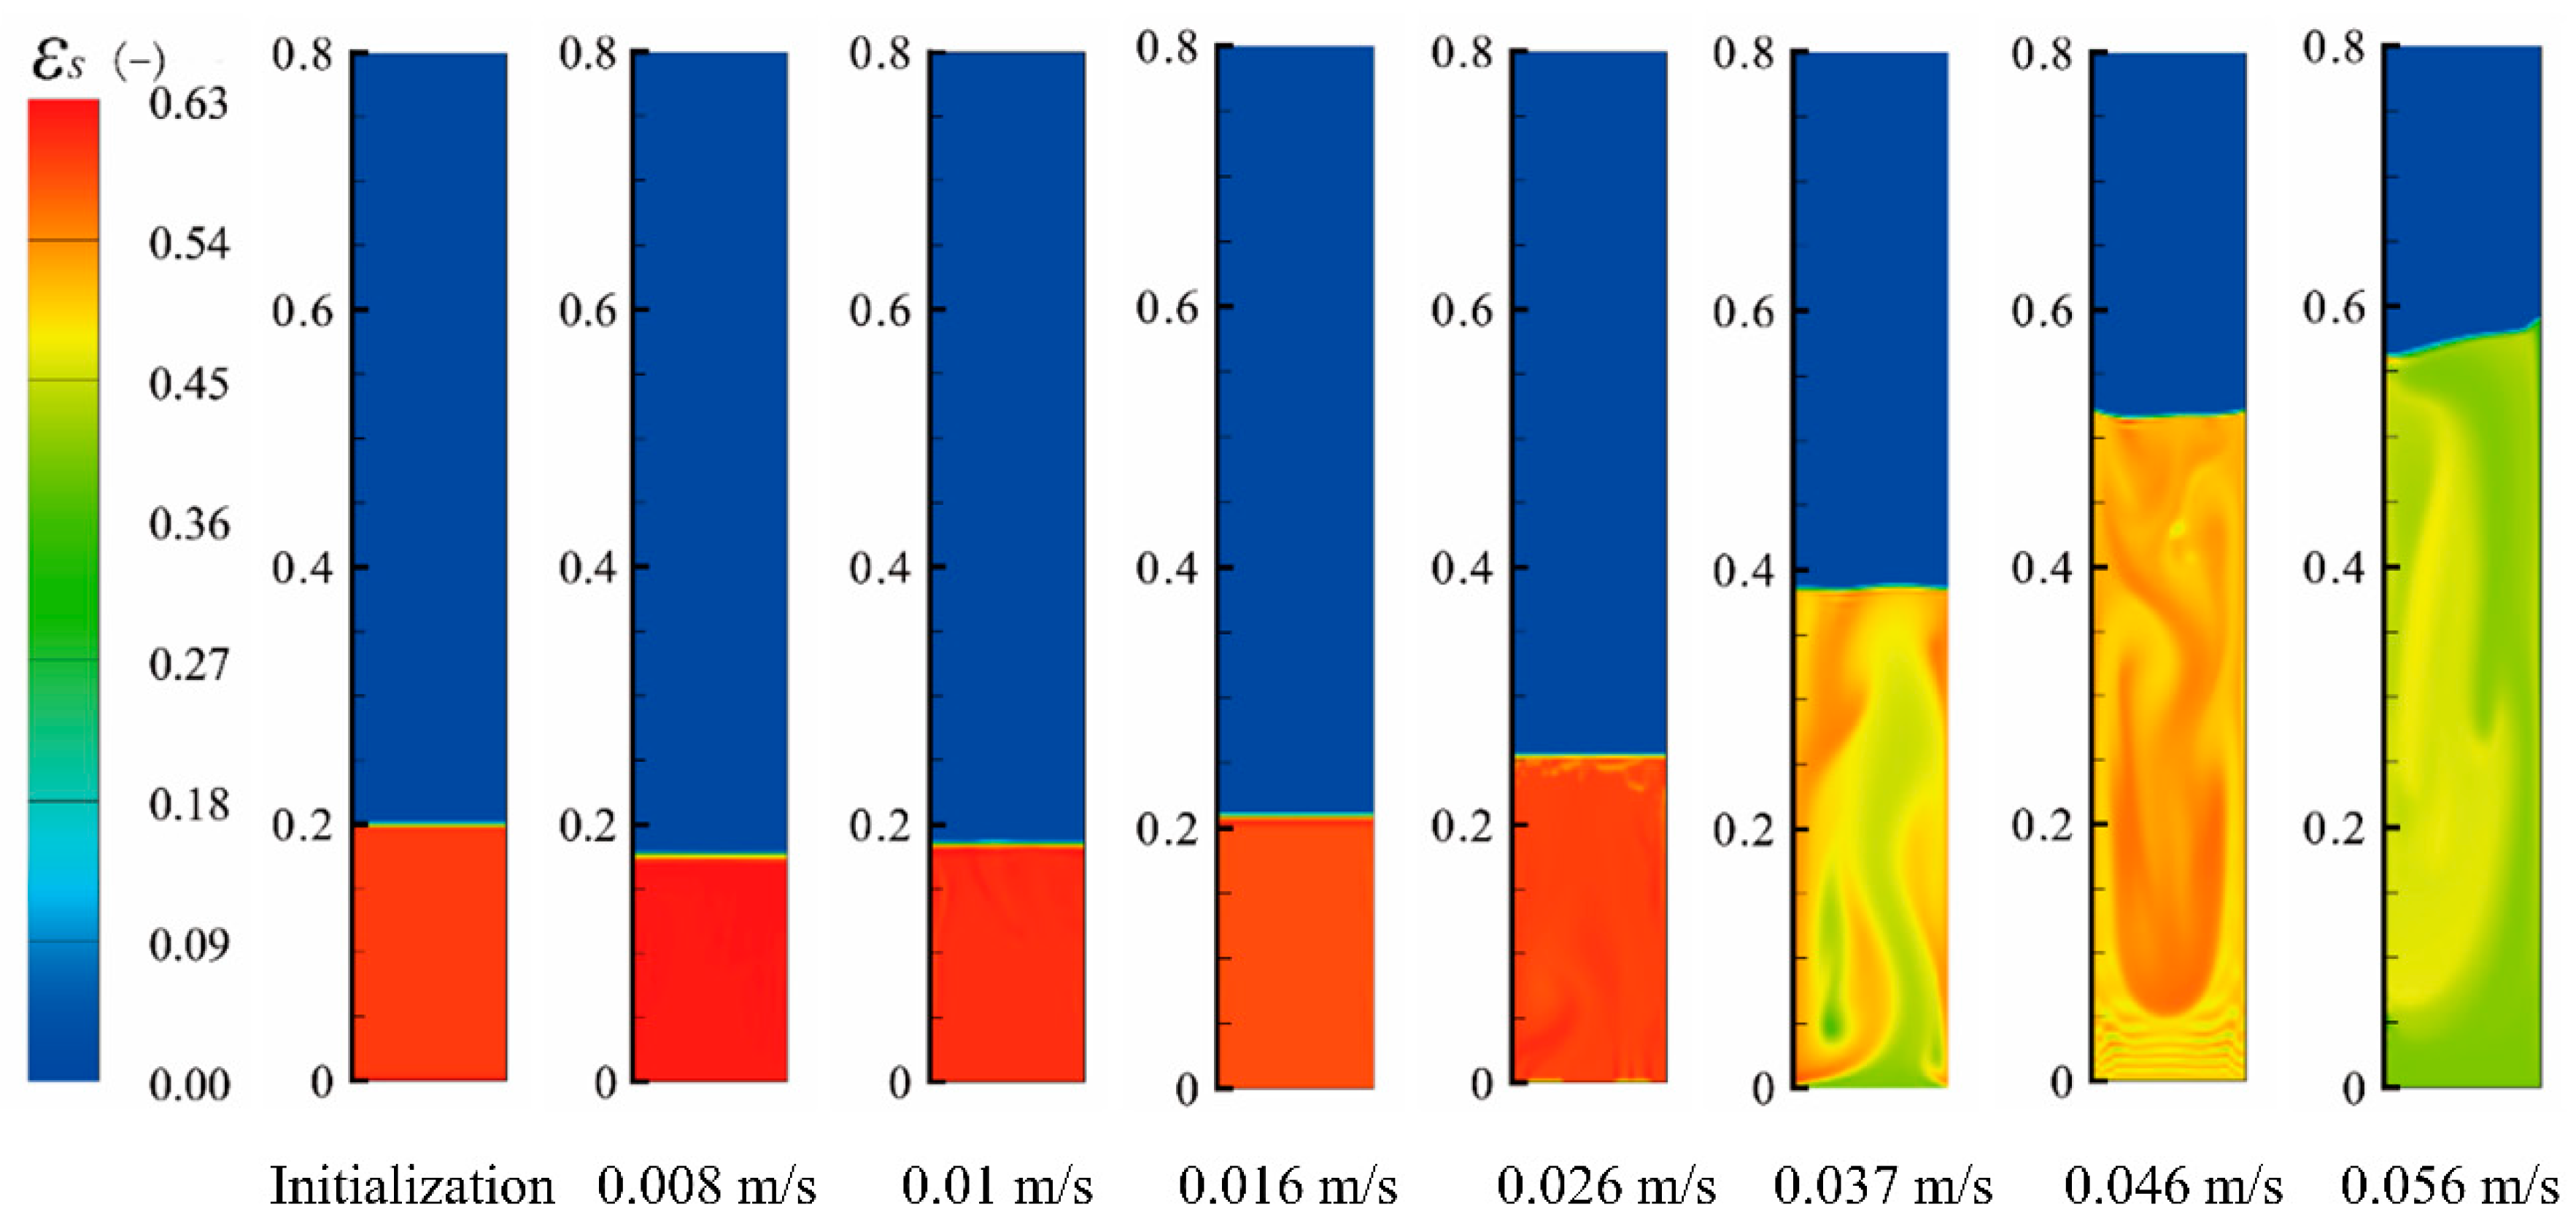
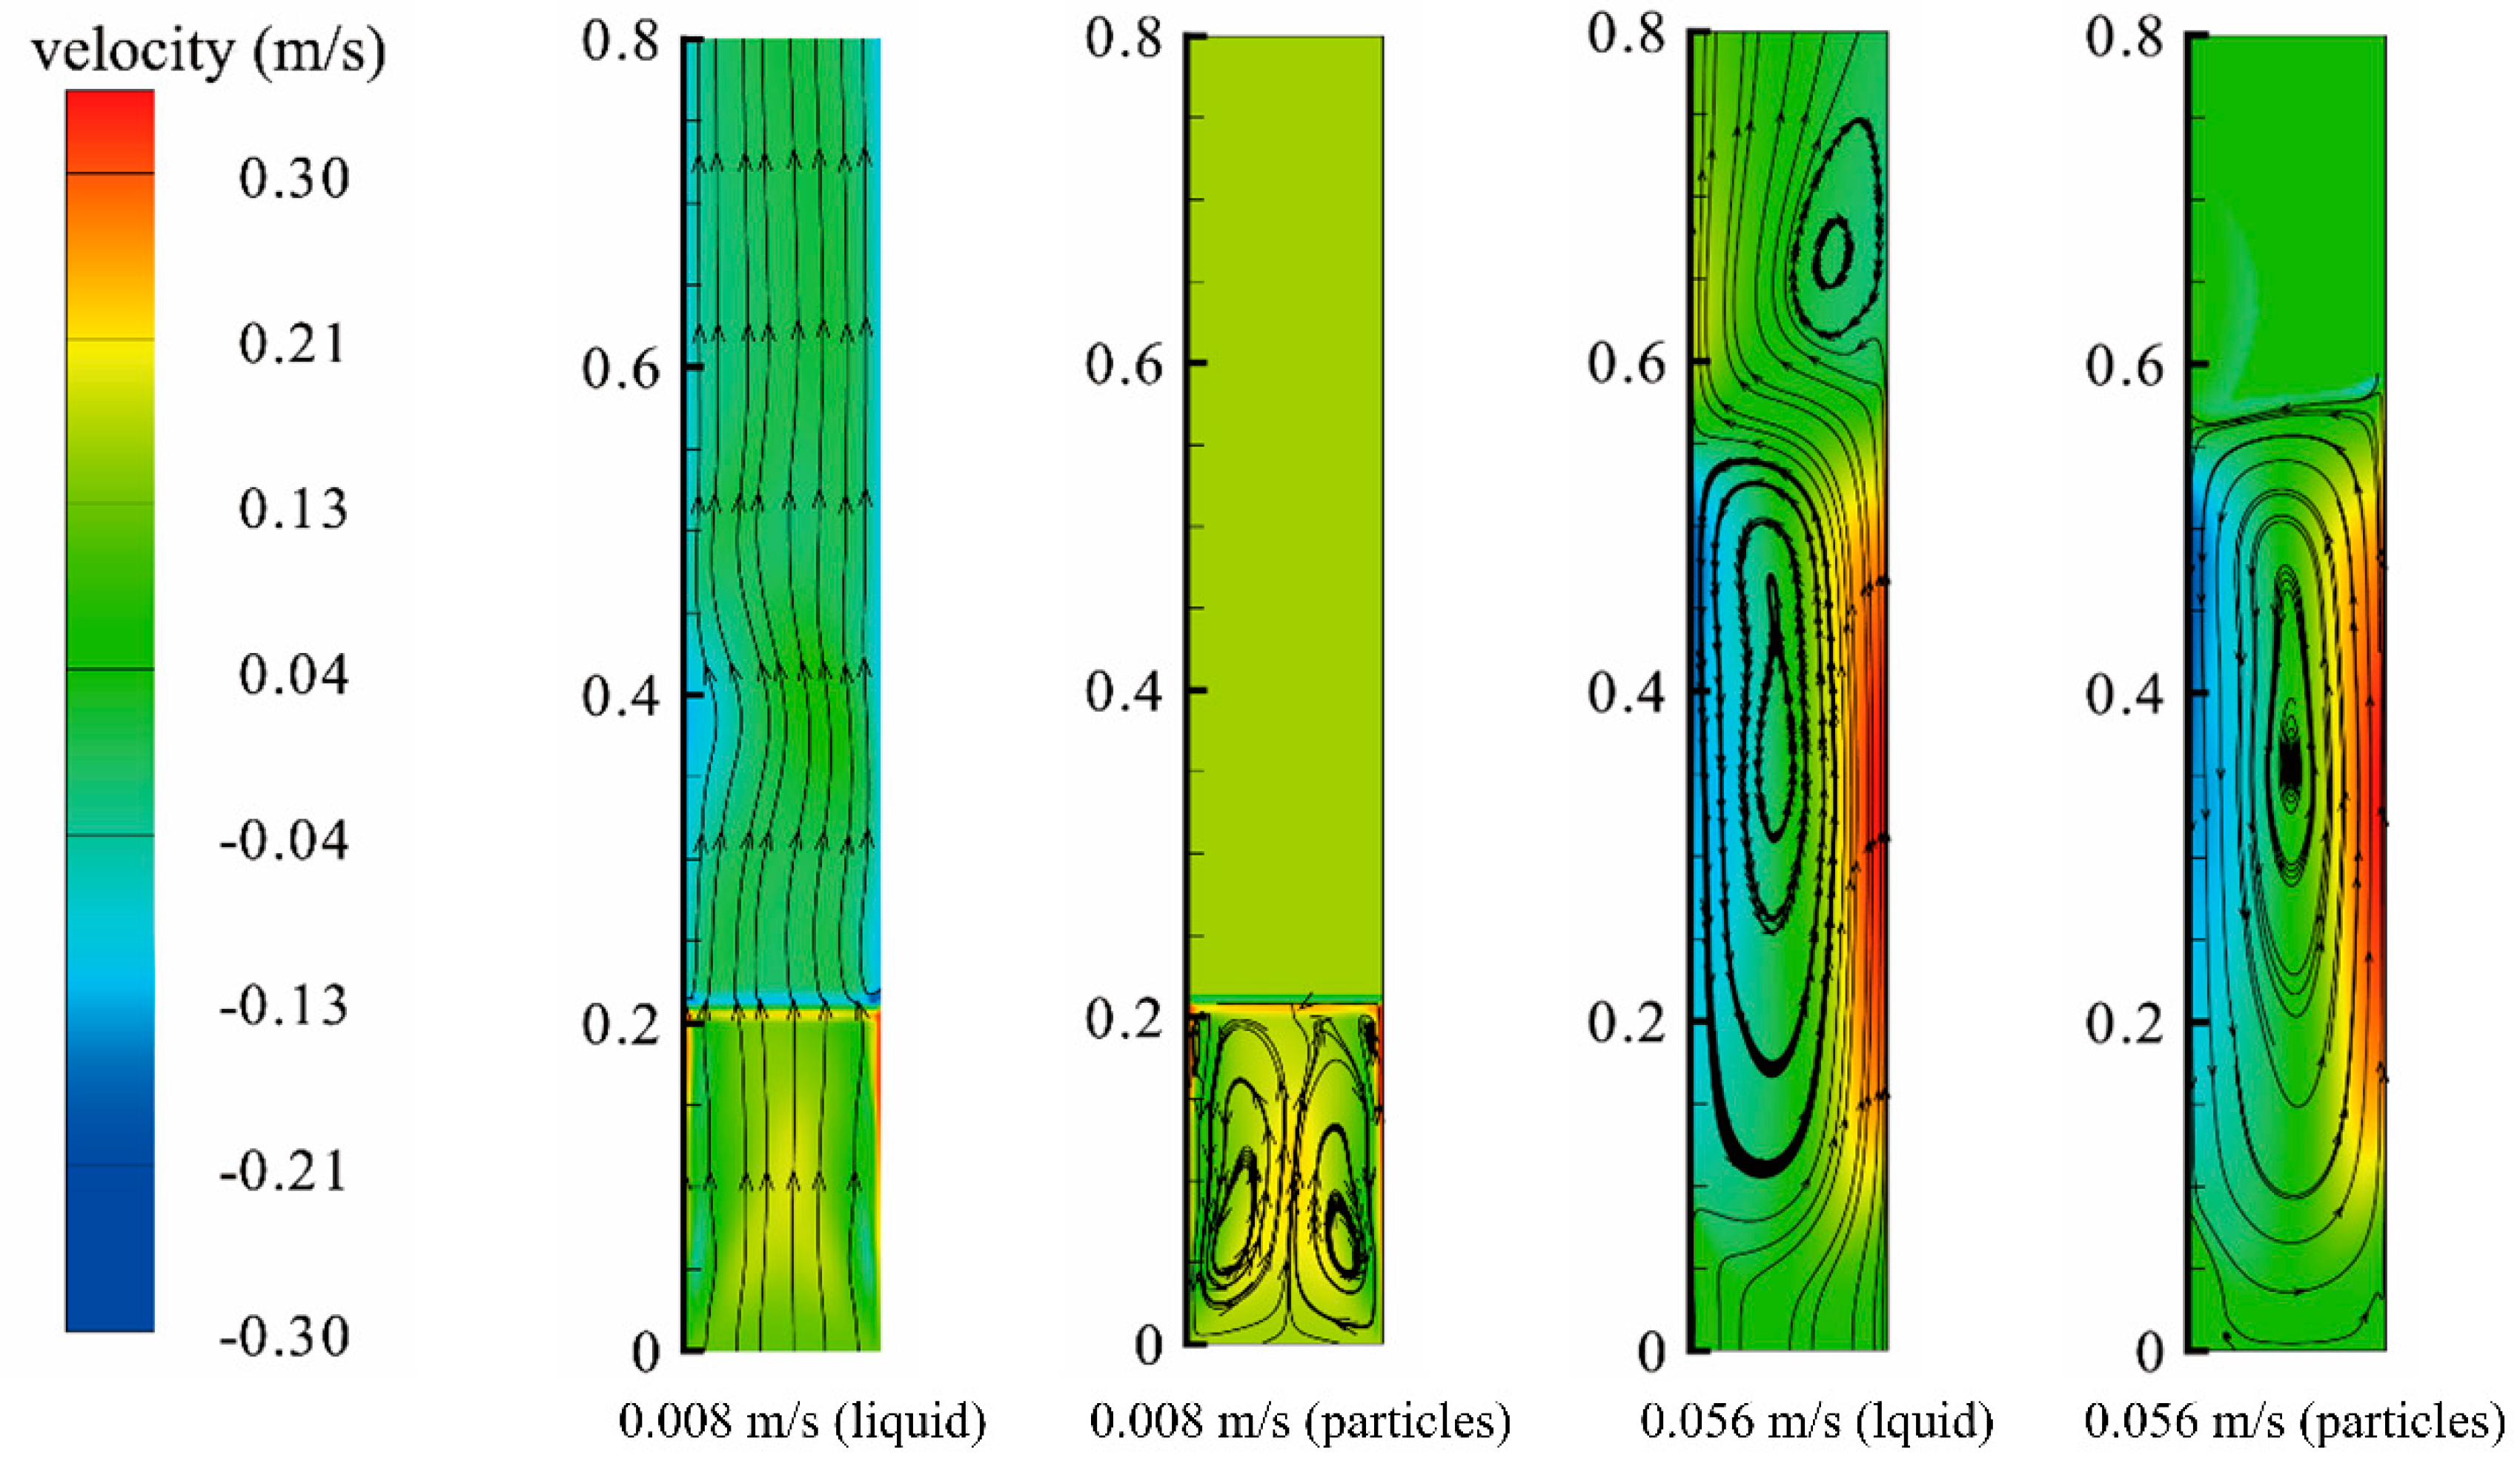
3.1. The Bed Expansion Characteristics

In coal processing, a large amount of narrow sized particles are fluidized in counter water flow to form the teeter bed. Therefore, water velocity is a key factor affecting the bed characteristics and also an important operating parameter for coal separation. In this section, the simplification of mono size particles was assumed to form a self-generating medium bed. Figure 2 shows the change of bed expansion with fluidization velocity varied from 0.008 to 0.056 m/s. It can be seen that the bed was fluidized at all water velocity. For the lower water velocity of 0.008 m/s and 0.01 m/s, the bed height was lower than the initial state value, and corresponding volume fraction was larger than the initial value of 0.55. As the water velocity increases, the bed expansion gradually increases and at the water velocity of 0.016 m/s, the bed height has exceeded the initial state. When water velocities in the range of 0.008–0.160 m/s, the consistent color in the figure revealed that the local volume fraction of particles was uniform along the whole column. When the water velocity increases further, especially in higher value of 0.056 m/s, the uniformity of the bed deteriorates because of the strong turbulence caused by many eddies. This phenomenon can also be illustrated from the flow patterns of the bed in Figure 3. The liquid flow along the column was stable and very regular at the relative lower water velocity, and the particle flows was small and symmetric which was helpful to achieve the homogeneous regime. However, at high water velocity, the regularity of the flow state was disturbed, for large circulation flows of liquid and particles increases the turbulence intensity resulting in heterogeneous regime in the bed.
Figure 4 shows the changes in specific values of the bed characteristics during bed expansion. The volume fraction of particles along the axial direction of the column during bed expansion can be seen in Figure 4a. It shows that the volume fraction of particles decreases with the increase of water velocity and from the waved curves, we can see that the dispersion of particles was not uniform at higher water velocity. Finally, the values of the volume fraction of particles at each water velocity were calculated by averaging values in all grid nodes along the central axial direction (The intersection of the horizontal and vertical axes was located at the half width of the bottom of the column. The central axis was a vertical line passing the intersection). The corresponding volume fractions for each water velocity of 0.008 m/s, 0.01 m/s, 0.016 m/s, 0.026 m/s, 0.037 m/s, 0.046 m/s and 0.056 m/s were 0.615, 0.587, 0.518, 0.430, 0.279, 0.214 and 0.194. Thus, we can calculate the velocity of particles according to the Richardson and Zaki (R-Z) model [22] and compare model data with present water velocity to examine the simulation results. The R-Z model was intensively used in several publications to compare their study results with model values. The predicted values in the present model were also compared with parts of experimental and simulated data of the publication [34,35,53], which is summarized in Figure 5. It can see from Figure 5 that the present values exhibit good consistence with experimental data of the literature and R-Z model. Thus, it was can be concluded that Figure 5 show a good illustration for the rationality of present simulated values. In order to have a clear observation, Figure 4b plots again to show the consistency of the simulated value and R-Z model. The changes of bed drop (ΔP) with flow time at water velocity of 0.046 m/s appears in Figure 4c. It was shown that the pressure drop fluctuates at the beginning and stabilized in 1730–1740 Pa with increase of flow time. The abnormal pressure drop occurred at the beginning may be caused by the local channel flow. Figure 4d shows the pressure drop changes with water velocity. It can be observed that the bed drop hardly varies with water velocity and the simulated value was mostly around the theoretical value of 1736.06 Pa in Figure 4d calculated by the Equation (14). This phenomenon proves the validity of the simulation results again.
Δ P = L ( 1 ε L ) ( ρ S ρ L ) g
where L presents the initial bed height. Its value was 200 mm in the present study.
Bed density is a reflection of particle density, solids volume fraction and liquid velocity. As shown in Figure 6, bed density reduces as the increase of water velocity and they show a good power relationship, which can be quantified by the fitting Equation (15). In real separation cases, when the bed density reduces resulting from the increase in water velocity, most of light particles were directly dragged to the overflow subjected to the hydraulic force without effective separation. When the water velocity was lower, the bed density increases as the solid phase becomes dense inside bed. At the same time the viscosity of the suspension also increased as a large number of particles were crowded together. Thus, in a system with high concentration particles, the properties of the fluidized suspension was close to that of heavy liquid, in which particles were separated according to density.
ρ b = 3128.008 · u 0.339 + 2607 ,
where ρ b is bed density, g/cm3; u is water velocity, m/s.
Fluidized particles move differently with water velocity during the whole bed expansion process. Figure 7 plots the particle velocity along the height of the bed at different water velocity. The overall trend was that the particle velocity increases as the water velocity increases. At lower water velocity, the bed reaches good homogeneity which can be seen from former analysis and the velocity distribution of particles was also relatively uniform. The higher water velocity brings degradation for the uniformity of the particle velocity distribution. The result was consistent with former analysis of the impact of water velocity on the volume fraction of particles in the bed.
The above analysis shows that the movement of fluidized particles was relatively regular, and a better homogeneous flow was formed at lower water velocity, which was conducive to maintaining the bed internal stability. At higher water velocity, a large number of vortices will not only make the fluidized particles fluctuated strongly, but also promote fine particles easily to directly enter the overflow or underflow without being separated. Therefore, for coal material with a wide range of size and density, a better separation was recommended under the operating condition of a lower water velocity.

3.2. Settling Behavior of Foreign Particles in Bed

The teeter bed above provided a hindering settling environment for other particles (here, called foreign particles) which have different properties (size or density) with the fluidized particles. Foreign particles move resisting forces from the bed to the overflow or underflow and achieve the separation. In this section, several foreign particles were introduced to the teetered bed to study their motion behavior. The results are shown in Figure 8a that a 4 mm foreign particle with density of 2607 kg/m3 was introduced from the top of the column. We can see that the particle has gone through four stages: accelerating, reaching balance in water, deceleration and reaching equilibrium in the bed. The particle velocity decreased significantly due to the resisting force from the bed; it decreased as the volume fraction of particles increased. For a clear comparison of simulated slip velocity with that of literature models, the particle slip velocity was normalized by dividing the free settling velocity. Figure 8b compares the normalized slip velocity of foreign particle of 4 mm size and density of 2607 kg/m3 with the literature values. What needs to be explained: the free settling velocity of all particles involved in these models were the simulated data. For 2-mm, 4-mm and 6-mm glass particles, the simulated free settling velocities were 0.282 m/s, 0.445 m/s, 0.565 m/s, and for 2 mm, 4 mm, 6 mm steel particles, the values were 0.644 m/s, 0.969 m/s, 1.173 m/s. The deviation of simulated free settling velocity of particles were within 8% compared with Zigrang and Sylvester model [54]. In Figure 8b, it was observed that the classification velocity of the particle decreased with the increase of volume fraction of particles. The phenomenon is exhibited in both simulated values and literature models. It implies that the resisting force acting on foreign particles increased as the volume fraction of particles in bed increased. Moreover, the normalized slip velocity of the 4 mm particle through the bed was close to that of Joshi model.
To further explore the agreement between the simulation results and the Joshi model, the settling behavior of 2 mm, 4 mm and 6 mm glass beads and 2 mm, 4 mm and 6 mm steel particle through the bed with a volume fraction of 0.55 was studied in Figure 8c,d. It can be seen that the simulation results keep good agreements with the Joshi model. The influence of a high concentration of fluidized particles on foreign particle sedimentation was significant and can decreased by about 20% of free settling velocity. We can also see that there were some differences between the simulated data and the predicted values in other models. It can also be seen from Figure 8c, the predicted slip velocity for glass beads in models of Di Felice, Van der Wielen and Grbavcic presents a good consistency. In these models, the particle velocity was greatly reduced more than half of the value, and the values in Kunii model was between Joshi model and other three models. Figure 8d shows that the predicted values of steel particles in Kunii and De Felice model were relatively close and were also close to the present simulated results. The particle velocity assessed by Van der Wielen and Grbavcic models existed some difference, but still decreased the particle velocity significantly. In principle, the motion of the foreign particle was governed by various forces from the bed. These forces generally includes drag force, the pressure gradient force, virtual mass force and the collision force, etc. In such a high concentration system, the resisting force caused by water drag force and collision force between particles was dominant and they can obviously decrease the settling velocity of the particles. The simulation data reflects the effect of fluid drag on particle velocity under this high concentration system and they were referenceable.
It was significant that the velocity of the foreign particles was reduced due to the drag force in teeter bed comparing with that of in pure water. The higher volume fraction of particles in bed was more preferable to achieve the separation of particles according to their density because it increases bed density and further increases the difference in settling velocity among foreign particles. Further, for particles with the same density, the slip velocity increases with the increase of particle size, which makes larges particles moving through the fluidized bed into light product more easily. Therefore, there was the influence of both density and particle size on the separation process in TBS. To reduce the number of mismatches and improve the accuracy of separation in TBS, the particle size of feeding materials was more likely to be narrowly distributed.

4. Conclusions

The particles in TBS are fine in size and the principle of their motion is complex in TBS, which brings difficulty for experimental study. A CFD model was implemented to investigate particle separation. It was found that lower water velocity was conducive to forming a homogeneous and stable fluidization bed. Higher water velocity was likely to cause strong turbulence flow, leading to large eddies in the bed. Therefore, a lower water velocity is recommended for the practical operation of TBS. The slip velocity gradually increased with an increase of particle size and a decrease of solid volume fraction. Therefore, in TBS, large particles may flow through the self-generating medium bed into the light product. Based on the movement of particles with various size and densities, the influence of a self-generating medium bed on the separation of particles with narrow size distributions in TBS by density was clarified in the model.

Author Contributions

X.Z. provided simulation method and wrote the paper; J.L. analyzed the data; Y.D., C.C. and T.W. contributed analysis tools. All authors have read and agreed to the published version of the manuscript.

Funding

The project was supported by the National Natural Science Foundation of China (Grant No. 51604281 and 51904160).

Acknowledgments

The authors thank anonymous reviewers for fruitful discussion and useful comments.

Conflicts of Interest

The authors declare no conflict of interest.

Nomenclature

ρ L liquid density, kg/m3
ε L volume fraction of liquid, dimensionless
u L liquid velocity, m/s
ρ S fluidized particles density, kg/m3
ε S volume fraction of fluidized particles, dimensionless
u S fluidized particle velocity, m/s
C D drag force coefficient, dimensionless
R e S fluidized particle Reynolds number, dimensionless
d S diameter of fluidized particle, m
ρ D foreign particle density, kg/m3
d D foreign particle diameter, m
u D foreign particle velocity, m/s
g gravity acceleration, m/s2
u D foreign particle slip velocity in indefinite medium, m/s
u D w bounded settling velocity for foreign particle, m/s
ρ M mixture/pseudo-fluid density, kg/m3
u S fluidized particle velocity in indefinite medium, m/s
μ M pseudo-fluid viscosity, Pa·s
μ L liquid viscosity, Pa·s
u D foreign particle classification velocity, m/s
L initial bed height, m
n D R-Z index, dimensionless
ρ e f f effective density, kg/m3
r particle size, dimensionless
f friction factor, dimensionless
N number of displaced particles
K collision coefficient, dimensionless
Greek letters
μviscosity, Pa·s
ρdensity, kg/m3
εvolume fraction, dimensionless
ΔPpressure drop, N/m2
Subscripts
Lliquid
Sfluidized particles
Dforeign particle
Mmixture
effeffective
infinite medium

References

  1. Ma, T.; Fan, C.; Hao, L.; Li, S.; Jensen, P.A.; Song, W.; Lin, W.; Dam-Johansen, K. Biomass ash induced agglomeration in fluidized bed. Part 2: Effect of potassium salts in different gas composition. Fuel Process. Technol. 2018, 180, 130–139. [Google Scholar] [CrossRef]
  2. Zhu, X.; Dong, P.; Tu, Q.; Zhu, Z.; Yang, W.; Wang, H. Investigation of gas–solid flow characteristics in the cyclone dipleg of a pressurised circulating fluidised bed by ECT measurement and CPFD simulation. Meas. Sci. Technol. 2019, 30, 054002. [Google Scholar] [CrossRef]
  3. Jiang, H.; Huang, L.; Lu, Q.; Zhao, Y.; Luo, Z.; Duan, C.; Dong, L.; Chen, Z.; Lv, B.; Zhao, J.; et al. Separation performance of coal in an air dense medium fluidized bed at varying feeding positions. Fuel 2019, 243, 449–457. [Google Scholar] [CrossRef]
  4. He, J.; Zhao, Y.; Huang, G.; Liu, C. Evaluation of the separation performance of an air dense medium gas-solid fluidized bed for coal cleaning: Effect of the binary dense media. Adv. Powder Technol. 2018, 29, 3265–3273. [Google Scholar] [CrossRef]
  5. Sarkar, B.; Das, A.; Mehrotra, S.P. Study of separation features in floatex density separator for cleaning fine coal. Int. J. Miner. Process. 2008, 86, 40–49. [Google Scholar] [CrossRef]
  6. Tripathy, S.K.; Mallick, M.K.; Singh, V.; Murthy, Y.R. Preliminary studies on teeter bed separator for separation of manganese fines. Powder Technol. 2013, 239, 284–289. [Google Scholar] [CrossRef]
  7. Carpenter, J.L.; Iveson, S.M.; Galvin, K.P. Ultrafine desliming using a REFLUX (TM) classifier subjected to centrifugal G forces. Miner. Eng. 2019, 134, 372–380. [Google Scholar] [CrossRef]
  8. Sarkar, B.; Das, A.; Roy, S.; Rai, S.K. In depth analysis of alumina removal from iron ore fines using teetered bed gravity separator. Miner. Process. Extr. Metall. 2008, 117, 48–55. [Google Scholar] [CrossRef]
  9. Kohmuench, J.N.; Mankosa, M.J.; Honaker, R.Q.; Bratton, R.C. Applications of the CrossFlow teeter-bed separator in the US coal industry. Miner. Metall. Process. 2006, 23, 187–195. [Google Scholar]
  10. Nguyentranlam, G.; Galvin, K.P. Particle classification in the reflux classifier. Miner. Eng. 2001, 14, 1081–1091. [Google Scholar] [CrossRef]
  11. Xing, Y.; Gui, X.; Wang, Y.; Cao, Y.; Zhang, Y. Optimization of Teetered Bed Separator Using Pulsed Water. Int. J. Coal Prep. Util. 2015, 36, 283–292. [Google Scholar] [CrossRef]
  12. Fosu, S.; Awatey, B.; Skinner, W.; Zanin, M. Flotation of coarse composite particles in mechanical cell vs. the fluidised-bed separator (The HydroFloat™). Miner. Eng. 2015, 77, 137–149. [Google Scholar] [CrossRef]
  13. Das, A.; Sarkar, B. Advanced Gravity Concentration of Fine Particles: A Review. Miner. Process. Extr. Metall. Rev. 2018, 39, 359–394. [Google Scholar] [CrossRef]
  14. Mukherjee, A.K.; Kumar, A. Liquid/Solid Fluidization Its Role and Limitation in Fine Beneficiation—A Review. Miner. Process. Extr. Metall. Rev. 2009, 30, 280–306. [Google Scholar] [CrossRef]
  15. Tripathy, S.K.; Bhoja, S.K.; Kumar, C.R.; Suresh, N. A short review on hydraulic classification and its development in mineral industry. Powder Technol. 2015, 270, 205–220. [Google Scholar] [CrossRef]
  16. Kumar, C.R.; Tripathy, S.; Rao, D.S. Characterisation and Pre-concentration of Chromite Values from Plant Tailings Using Floatex Density Separator. J. Miner. Mater. Charact. Eng. 2009, 8, 367–378. [Google Scholar] [CrossRef]
  17. Ozcan, Ö.; Ergun, S.L. Performance of teetered bed separator for non-coal applications. Sep. Sci. Technol. 2017, 52, 1486–1495. [Google Scholar] [CrossRef]
  18. Roy, S.; Mandal, S.K.; Das, A. Segregation and Process Features in a Teeter Bed Separator as Revealed by High-Speed Videography and Image Processing. Miner. Process. Extr. Metall. Rev. 2013, 35, 15–22. [Google Scholar] [CrossRef]
  19. Kim, B.H.; Klima, M.S. Simulation of Hindered-Settling Column Separations When Processing Fine Anthracite Refuse. Coal Prep. 2004, 24, 261–275. [Google Scholar] [CrossRef]
  20. Xia, Y.K. CFD Simulation of Fine Particle Gravity Separation in Hindered-settling Bed Separators. Chem. Prod. Process. Model. 2007, 2, 1–21. [Google Scholar] [CrossRef]
  21. Das, A.; Sarkar, B.; Mehrotra, S.P. Prediction of separation performance of Floatex Density Separator for processing of fine coal particles. Int. J. Miner. Process. 2009, 91, 41–49. [Google Scholar] [CrossRef]
  22. Richardson, J.; Zaki, W. Sedimentation and fluidization: Part-1. Trans. Inst. Chem. Eng. 1954, 32, 35–53. [Google Scholar]
  23. Ergun, S.; Orning, A.A. Fluid Flow through Randomly Packed Columns and Fluidized Beds. Ind. Eng. Chem. 1949, 41, 1179–1184. [Google Scholar] [CrossRef]
  24. Wen, C.Y.; Yu, Y.H. Mechanics of fluidization. Chem. Eng. Prog. Symp. Ser. 1966, 62, 100–111. [Google Scholar]
  25. Syamlal, M.; O’Brien, T.J. Computer simulation of bubbles in a fluidized bed. In Fluidization and Fluid Particle Systems: Fundamentals and Applications; AIChE: Washington, DC, USA, 1989; pp. 22–31. [Google Scholar]
  26. Gidaspow, D. Multiphase Flow and Fluidization: Continuum and Kinetic Theory Descriptions; Elsevier Inc.: Amsterdam, The Netherlands, 2012. [Google Scholar]
  27. Huilin, L.; Gidaspow, D.; Lu, H. Hydrodynamics of binary fluidization in a riser: CFD simulation using two granular temperatures. Chem. Eng. Sci. 2003, 58, 3777–3792. [Google Scholar] [CrossRef]
  28. Grbavčić, Ž.B.; Vuković, D.V. Single-particle settling velocity through liquid fluidized beds. Powder Technol. 1991, 66, 293–295. [Google Scholar] [CrossRef]
  29. Grbavcic, Z.B.; Vuković, D.V.; Jovanović, S.D.; Littman, H. The effective buoyancy and drag on spheres in a water-fluidized bed. Chem. Eng. Sci. 1992, 47, 2120–2124. [Google Scholar] [CrossRef]
  30. Van Der Wielen, L.A.M.; Van Dam, M.H.H.; Luyben, K.C.A.M. On the relative motion of a particle in a swarm of different particles. Chem. Eng. Sci. 1996, 51, 995–1008. [Google Scholar] [CrossRef]
  31. Ghatage, S.V.; Sathe, M.J.; Doroodchi, E.; Joshi, J.B.; Evans, G.M. Effect of turbulence on particle and bubble slip velocity. Chem. Eng. Sci. 2013, 100, 120–136. [Google Scholar] [CrossRef]
  32. Ghatage, S.V.; Khan, S.M.; Peng, Z.; Doroodchi, E.; Moghtaderi, B.; Padhiyar, N.; Joshi, J.B.; Evans, G.M.; Mitra, S. Settling/rising of a foreign particle in solid-liquid fluidized beds: Application of dynamic mesh technique. Chem. Eng. Sci. 2017, 170, 139–153. [Google Scholar] [CrossRef]
  33. Cheng, Y.; Zhu, J.-X. CFD Modelling and Simulation of Hydrodynamics in Liquid-Solid Circulating Fluidized Beds. Can. J. Chem. Eng. 2005, 83, 177–185. [Google Scholar] [CrossRef]
  34. Cornelissen, J.T.; Taghipour, F.; Escudié, R.; Ellis, N.; Grace, J.R. CFD modelling of a liquid–solid fluidized bed. Chem. Eng. Sci. 2007, 62, 6334–6348. [Google Scholar] [CrossRef]
  35. Reddy, R.K.; Joshi, J.B. CFD modeling of solid–liquid fluidized beds of mono and binary particle mixtures. Chem. Eng. Sci. 2009, 64, 3641–3658. [Google Scholar] [CrossRef]
  36. Syamlal, M.; O’Brien, T.J. Simulation of granular layer inversion in liquid fluidized beds. Int. J. Multiph. Flow 1988, 14, 473–481. [Google Scholar] [CrossRef]
  37. Doroodchi, E.; Galvin, K.P.; Fletcher, D.F. The influence of inclined plates on expansion behaviour of solid suspensions in a liquid fluidised bed—A computational fluid dynamics study. Powder Technol. 2005, 156, 1–7. [Google Scholar] [CrossRef]
  38. Lettieri, P.; Di Felice, R.; Pacciani, R.; Owoyemi, O. CFD modelling of liquid fluidized beds in slugging mode. Powder Technol. 2006, 167, 94–103. [Google Scholar] [CrossRef]
  39. Mukherjee, A.K.; Mishra, B.K. Experimental and simulation studies on the role of fluid velocity during particle separation in a liquid–solid fluidized bed. Int. J. Miner. Process. 2007, 82, 211–221. [Google Scholar] [CrossRef]
  40. Di Renzo, A.; Cello, F.; Di Maio, F.P. Simulation of the layer inversion phenomenon in binary liquid--fluidized beds by DEM–CFD with a drag law for polydisperse systems. Chem. Eng. Sci. 2011, 66, 2945–2958. [Google Scholar] [CrossRef]
  41. Peng, Z.; Joshi, J.B.; Moghtaderi, B.; Khan, M.S.; Evans, G.M.; Doroodchi, E. Segregation and dispersion of binary solids in liquid fluidised beds: A CFD-DEM study. Chem. Eng. Sci. 2016, 152, 65–83. [Google Scholar] [CrossRef]
  42. Vivacqua, V.; Vashisth, S.; Hébrard, G.; Grace, J.R.; Epstein, N. Characterization of fluidized bed layer inversion in a 191-mm-diameter column using both experimental and CPFD approaches. Chem. Eng. Sci. 2012, 80, 419–428. [Google Scholar] [CrossRef]
  43. Molaei, E.A.; Yu, A.B.; Zhou, Z.Y. Investigation of causes of layer inversion and prediction of inversion velocity in liquid fluidizations of binary particle mixtures. Powder Technol. 2019, 342, 418–432. [Google Scholar] [CrossRef]
  44. Peng, Z.; Ghatage, S.V.; Doroodchi, E.; Joshi, J.B.; Evans, G.M.; Moghtaderi, B. Forces acting on a single introduced particle in a solid–liquid fluidised bed. Chem. Eng. Sci. 2014, 116, 49–70. [Google Scholar] [CrossRef]
  45. Uhlmann, M. An immersed boundary method with direct forcing for the simulation of particulate flows. J. Comput. Phys. 2005, 209, 448–476. [Google Scholar] [CrossRef] [Green Version]
  46. Ozel, A.; De Motta, J.C.B.; Abbas, M.; Fedea, P.; Masbernat, O.; Vincent, S.; Estivalezes, J.-L.; Simonin, O. Particle resolved direct numerical simulation of a liquid–solid fluidized bed: Comparison with experimental data. Int. J. Multiph. Flow 2017, 89, 228–240. [Google Scholar] [CrossRef] [Green Version]
  47. Mitra, S.; Doroodchi, E.; Pareek, V.; Joshi, J.B.; Evans, G.M. Collision behaviour of a smaller particle into a larger stationary droplet. Adv. Powder Technol. 2015, 26, 280–295. [Google Scholar] [CrossRef]
  48. Kunii, D.; Levenspiel, O. Fluidization Engineering; Elsevier: Amsterdam, The Netherlands, 2013. [Google Scholar]
  49. Joshi, J.B. Solid-liquid fluidised beds: Some design aspects. Chem. Eng. Res. Des. 1983, 61, 143–161. [Google Scholar]
  50. Di Felice, R.; Foscolo, P.U.; Gibilaro, L.; Rapagna, S. The interaction of particles with a fluid—Particle pseudo—fluid. Chem. Eng. Sci. 1991, 46, 1873–1877. [Google Scholar] [CrossRef]
  51. Grbavcic, Z.B.; Arsenijevic, Z.L.; Garić-Grulović, R.V. Prediction of single particle settling velocities through liquid fluidized beds. Powder Technol. 2009, 190, 283–291. [Google Scholar] [CrossRef]
  52. Kozołub, P.; Klimanek, A.; Bialecki, R.A.; Adamczyk, W.P. Numerical simulation of a dense solid particle flow inside a cyclone separator using the hybrid Euler–Lagrange approach. Particuology 2017, 31, 170–180. [Google Scholar] [CrossRef]
  53. Sun, M.; Yu, C.; Lv, D.; Wei, L. Numerical studies of performance of various liquid-solid momentum exchange coefficient models for fluidization behavior of particles. J. Cent. South Univ. Sci. Technol. 2019, 50, 1–8. [Google Scholar]
  54. Zigrang, D.J.; Sylvester, N.D. An explicit equation for particle settling velocities in solid-liquid systems. AIChE J. 1981, 27, 1043–1044. [Google Scholar] [CrossRef]
Figure 1. A schematic diagram of the bed fluidization and particle settling in bed.
Energies 13 02025 g001
Figure 2. The effect of water velocity on bed expansion.
Energies 13 02025 g002
Figure 3. Flow patterns in the bed.
Energies 13 02025 g003
Figure 4. Changes of the bed characteristics during bed expansion: (a) the effect of water velocity on volume fraction of particles; (b) comparison of predicted velocity with that of R-Z model; (c) pressure drop changing with simulation time at water velocity of 0.046 m/s; (d) Comparison of pressure drop with theoretical value from Equation (14).
Energies 13 02025 g004
Figure 5. Comparison of R-Z model with that of experimental and CFD value in literature [34,35,53].
Energies 13 02025 g005
Figure 6. The influence of water velocity on bed density
Energies 13 02025 g006
Figure 7. The effect of water velocity on fluidized particle velocity.
Energies 13 02025 g007
Figure 8. Motion behavior of foreign particles: (a) classification velocity of 4 mm foreign particle with density of 2607 kg/m3 in bed with various volume fraction of particles (Vof); (b) comparison of normalized slip velocity of 4 mm glass particle with literature models; (c) The normalized slip velocity of glass particles of 2 mm, 4 mm and 6 mm in bed with a volume fraction of 0.55; (d) The normalized slip velocity of steel particles of 2 mm, 4 mm and 6 mm in bed with a volume fraction of 0.55.
Energies 13 02025 g008
Table 1. Empirical formulas in the literature.
SourceFormulas
Richardson and Zaki [22] u D = u D ε L n
Kunii et al. [48] u D = k [ 3.1 ( ρ D ρ M ) d D ρ M ] 0.5 k = u D w u D
Joshi [49] u D u D = [ 1 20.45 ( 1 ε L ) 2 d D 20.45 ( 1 ε L ) 2 + 1 u S 2 u D 2 ] 0.5
Di Felice et al. [50] C D 2 π d D 2 4 ρ M { [ u M ( ε L + ε S ) ] u D } 2 = π d D 3 6 ( ρ D ρ M ) g
ρ M = ε L ρ L + ε S ρ S u M = ε L u L + ε S u S
μ M μ L = 1 + 5.5 ε S [ 4 ε S 7 / 3 + 10 ( 84 / 11 ) ε S 2 / 3 10 ( 1 ε S 10 / 3 ) 25 ε S ( 1 ε S 4 / 3 ) ]
Van der Wielen et al. [30] u D u D = ( ρ D ρ M ρ D ρ L ) n D 4.8 ε L 0.79 n D 1
Grbavcic et al. [51] u D = 4 d D g ( ρ D ρ e f f ) 3 ρ e f f [ C D 2 + K ( 1 f ) N ( ρ L ρ e f f ) ( d s d D ) 2 ]
ρ e f f = ( 1 f ) ρ L + f ρ M r = ( 1 ε L ) 1 3 d D d P f = 0.1635 ( r 1 )
N = ε S ( d D d P ) 3 K = 2.2 ε L 5.07 ( d D d S ) 1.48 ( ρ M ρ e f f ) 2.47
Table 2. Simulation conditions and parameters.
ParametersValues
Width of the column120 mm
Height of the column800 mm
Diameter of fluidized particle1 mm
Density of fluidized particle2607 kg/m3
Diameter of foreign particle2, 4, 6 mm
Density of foreign particle2607 kg/m3, 8030 kg/m3
Liquid density998.2 kg/m3
Liquid viscosity0.001003 Pa·s
Operating pressure 101,325 Pa
Grid size2 mm × 2 mm
Grid number24,000
Turbulence modelstandard κ-ε
Time step0.001 s
Max iterations/time step20
Convergence criteria10−5

