1. Introduction
The power system is currently undergoing a major revolution due to the increasing levels of renewable energy resources connected to the grid. Many of these sources are connected to the distribution networks such as the Photovoltaic Generation Systems (PVGSs). Photovoltaic (PV) technologies are one of the fastest developing renewable energy sources being integrated into electric power systems [
1]. The global PV market has grown rapidly over the past decades. It is estimated that PV capacity installed worldwide will probably be near 400 GW [
2]. The distribution utility has experienced great challenges of the PVGS’s integration.
The impacts of PVGSs on distribution networks have been widely studied and several issues, such as reverse power flow, voltage rise, voltage fluctuations, frequent operation of voltage regulation devices, and increase in power losses, were investigated in [
3]. Various challenges of distribution networks with the integration of renewable energy source are discussed in [
4]. It investigates the distribution power flow algorithms used to price the power along with the integration of distributed generation in the distribution network. A brief introduction about the energy storage, demand side management and micro grid has also been presented. A comprehensive analysis of power quality challenges with grid integration of renewable distribution generating systems and associated mitigation techniques is proposed in [
5]. Several studies were performed to determine the limiting factors for the installations of PVGSs in distribution networks [
6,
7]. Voltage rise has been found to be the one of the significant factors that limits the high penetration of PVGSs. Impact of harmonic limits on PV penetration levels in unbalanced distribution networks are studies in [
8]. The allowable PV penetration levels are determined by total harmonic voltage and individual harmonic voltage distortions, and bus voltage limits. Ref. [
9] studied high penetration residential PVs on a distribution network protection and operation. Some researchers also investigated on single-phase dynamic PV model [
10]. The impact of PV on the network performance during fault was then analyzed. The results showed that the presence of PVGSs does not significantly affect the performance of the distribution network during faults. The impact on the protection is somewhat limited due to the facts that inverters used in PVGSs can effectively limit their currents during a fault. On-line tap changers and voltage regulators are used to mitigate the over-voltage problems caused by the distributed generators [
11,
12]. Due to the intermittent nature of solar energy generation, it is also creating a large demand for energy storage to balance power. Cost reduction of battery manufacturing will further reinforce the position of renewable energy as a viable alternative to fossil fuel [
13].
The large-scale PVGS deployments within a distribution network are mainly limited by voltage and unbalance constraints. The voltage unbalance problem does not draw much attention until the increased penetration of single-phase rooftop mounted PVGSs. The single-phase PVGSs cause more serious unbalance problems than that of the three-phase PVGSs. As levels of residential PVGSs rise, single-phase PVGSs levels also increase. The approximate PV capacities can be installed considering a 2–3% voltage unbalance limit under unbalanced and balanced PVGS placements were estimated in [
14]. The voltage unbalance (VU) leading to overheating and fast thermal ageing has a harmful effect on the loads and equipment connected to grids. Development of proper mitigation techniques is essential to manage high penetration of PVGSs in distribution networks. Some research papers have focused on the unbalance issues to identify the potential challenges, impacts and solutions for the integration of PVGSs especially single-phase systems in distribution networks. A stochastic assessment method to estimate the voltage unbalance with single-phase PVGSs in secondary distribution networks is studied in [
15]. Randomized node and phase were used to determine the random locations of the single-phase PVGSs for unbalance analysis. A probabilistic risk assessment of power quality variations and events that may arise due to the high penetration of PVGS was proposed in [
16], where Monte Carlo simulation was used to assess power quality variations and events metrics.
A probabilistic framework that simulates the time-varying action of voltage magnitude and unbalance mitigation schemes was studied in [
17]. Four control schemes against voltage unbalance were also simulated. A new proposed controller was proposed in [
18] to mitigate the voltage unbalance. The new controller utilized the conjugate phase angle of the positive sequence voltage for controller alignment. The present status of PV and its associated impacts on distribution networks were reviewed in [
19]. Some mitigation methods were discussed.
In order to promote the renewable energy, the Taiwan government encourages the residents to install rooftop PVGSs [
20]. It is scheduled to reach one million sets of rooftop PVGS in the foreseeing future. As levels of residential PVGSs rise, single phase PVGSs will also increase. The integration of single phase PVGSs into distribution networks may cause voltage quality problems such as over voltage and unbalance. This paper investigates the voltage unbalance problems caused by the rooftop PVGSs and proposes a mitigation method to alleviate their impacts on distribution networks. An improving method that combines the On Load Tap Changer (OLTC) and the optimal phase arrangement of distribution transformers is proposed in this paper to mitigate the system unbalance. The OLTC-based improving method is applied first. The optimal phase arrangement of distribution transformers is further used to mitigate the system unbalance problem. Test results show that the proposed method can improve the system balance significantly even under very extreme cases.
This paper is organized as follows.
Section 2 describes the system unbalance analysis of PVGSs in distribution networks. Indices for voltage and current unbalance are also discussed. Three extreme cases and the stochastic analysis process are discussed in
Section 3.
Section 4 proposes a mitigation method to improve the system unbalance caused by the integration of rooftop PVGSs. Simulation studies are given in
Section 5. Finally,
Section 6 concludes the achievements of this paper.
2. System Unbalance Analysis
The system unbalance of distribution systems is mainly caused by the load unbalance, structure unbalance, and integration of distributed generation systems. Most loads in a distribution network are single-phase loads, and different power consumption characteristics between loads could lead to the load unbalance. In order to save expenditure on distribution transformers and maintain the flexibility for future expansion, a lot of distribution transformers are connected by the open-Y to open-Delta configuration. These unbalanced transformer configurations used in distribution networks could further deteriorate the system balance.
The PVGS’s technology for grid connected applications is growing rapidly around the world. Integration of the single-phase rooftop PVGSs could affect the system balance. When the expansion of PVGSs is unbalanced, it will deteriorate the voltage and current unbalances. This paper uses the OpenDSS and Matlab software to design a simulation tool considering the load unbalance, structure unbalance, and integration of PVGSs to analyze the system unbalance. Indices for voltage and current imbalances are discussed below.
2.1. Voltage Unbalance
Voltage unbalance is defined as the ratio of the negative or zero sequence component to the positive sequence component as shown in Equations (1) and (2). The negative or zero sequence voltages in a power system generally result from unbalanced loads causing negative or zero sequence currents to flow. Unbalance can also be estimated as the maximum deviation from the average of the three-phase voltages, divided by the average of the three-phase voltages, expressed in percent as shown in Equation (3). Equation (4) describes the maximal voltage unbalance at time
t.
where
,
, and
are the zero-sequence, positive-sequence, and negative-sequence voltage of bus k at time t.
where
Nn is the number of buses.
2.2. Current Unbalance
The neutral current of a transformer is depicted in Equation (5). It is the summation of three phase currents of the transformer. The neutral current under a specified value is important to prevent the zero-sequence from malfunction.
where
Ia0,t,
Ib0,t, and
Ic0,t are the currents of phase a, b, and c of the transformer feeding to the feeder at time t.
3. Analytic Cases of Rooftop Photovoltaic Generation Systems (PVGSs)
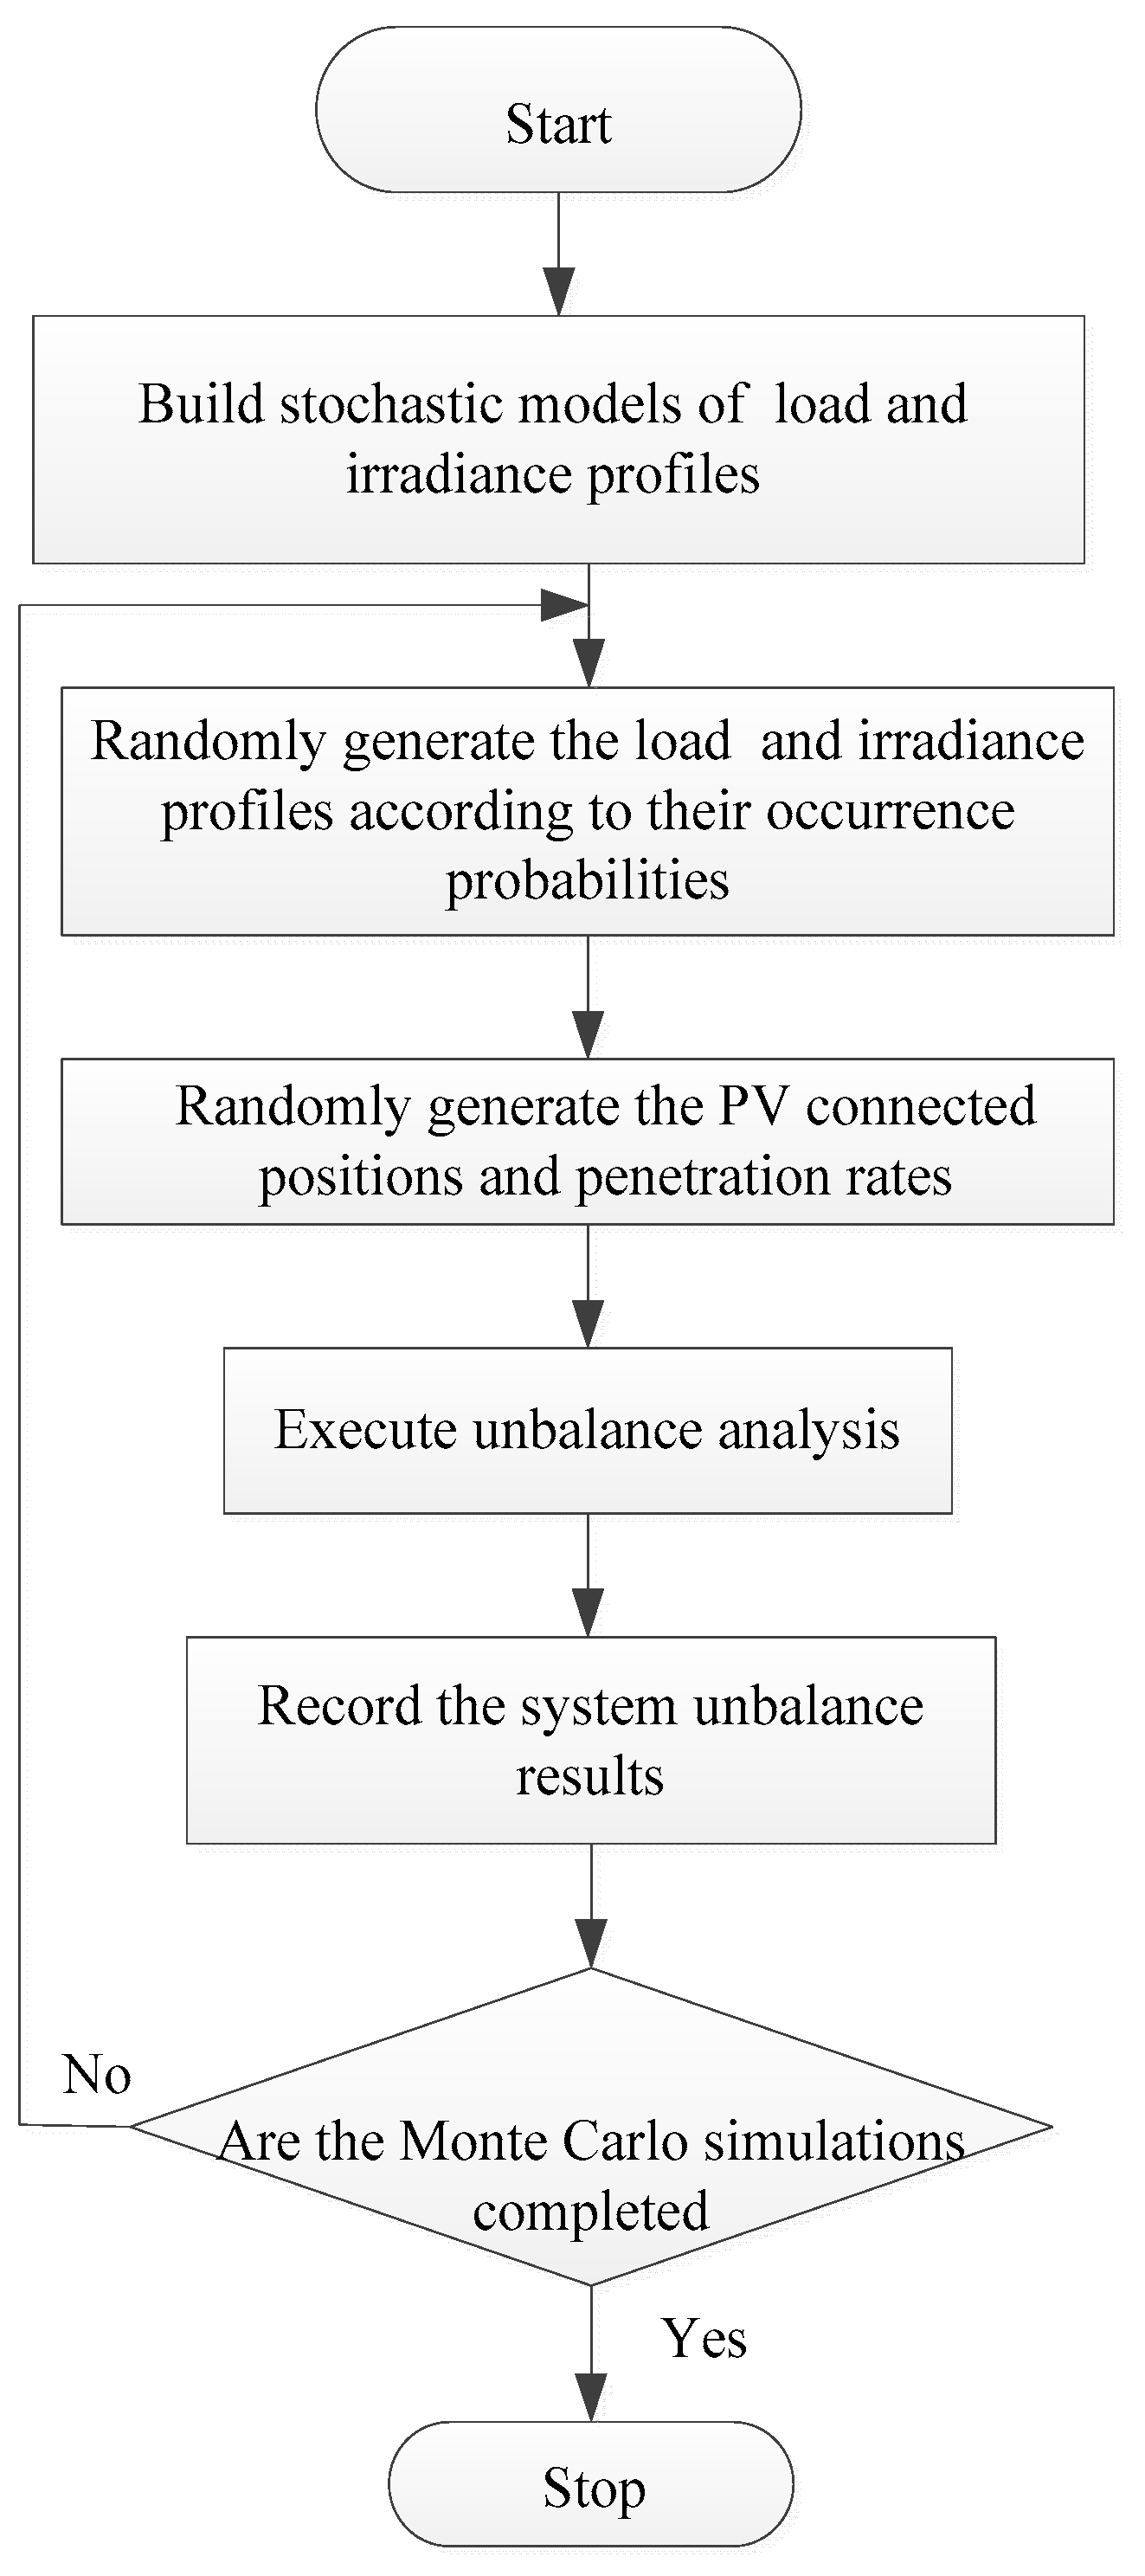
The worst cases for the rooftop PVGSs’ integrations are all of them being connected to one single phase, i.e., all the rooftop PVGSs are connected to phase a, phase b, or phase c. These three extreme cases are the most severe scenarios, and will lead to severe system unbalance. In addition to these three severe cases, the stochastic analyses of rooftop PVGSs’ integrations are considered to have a better knowledge of the possible scenarios of the system unbalance. The stochastic analysis for the rooftop PVGSs’ integration is shown in
Figure 1, and the detailed description is shown below. This paper studies impacts of these three extreme cases and stochastic cases on the distribution networks and proposes a mitigation method.
(1) Build Stochastic models of load and irradiance profiles
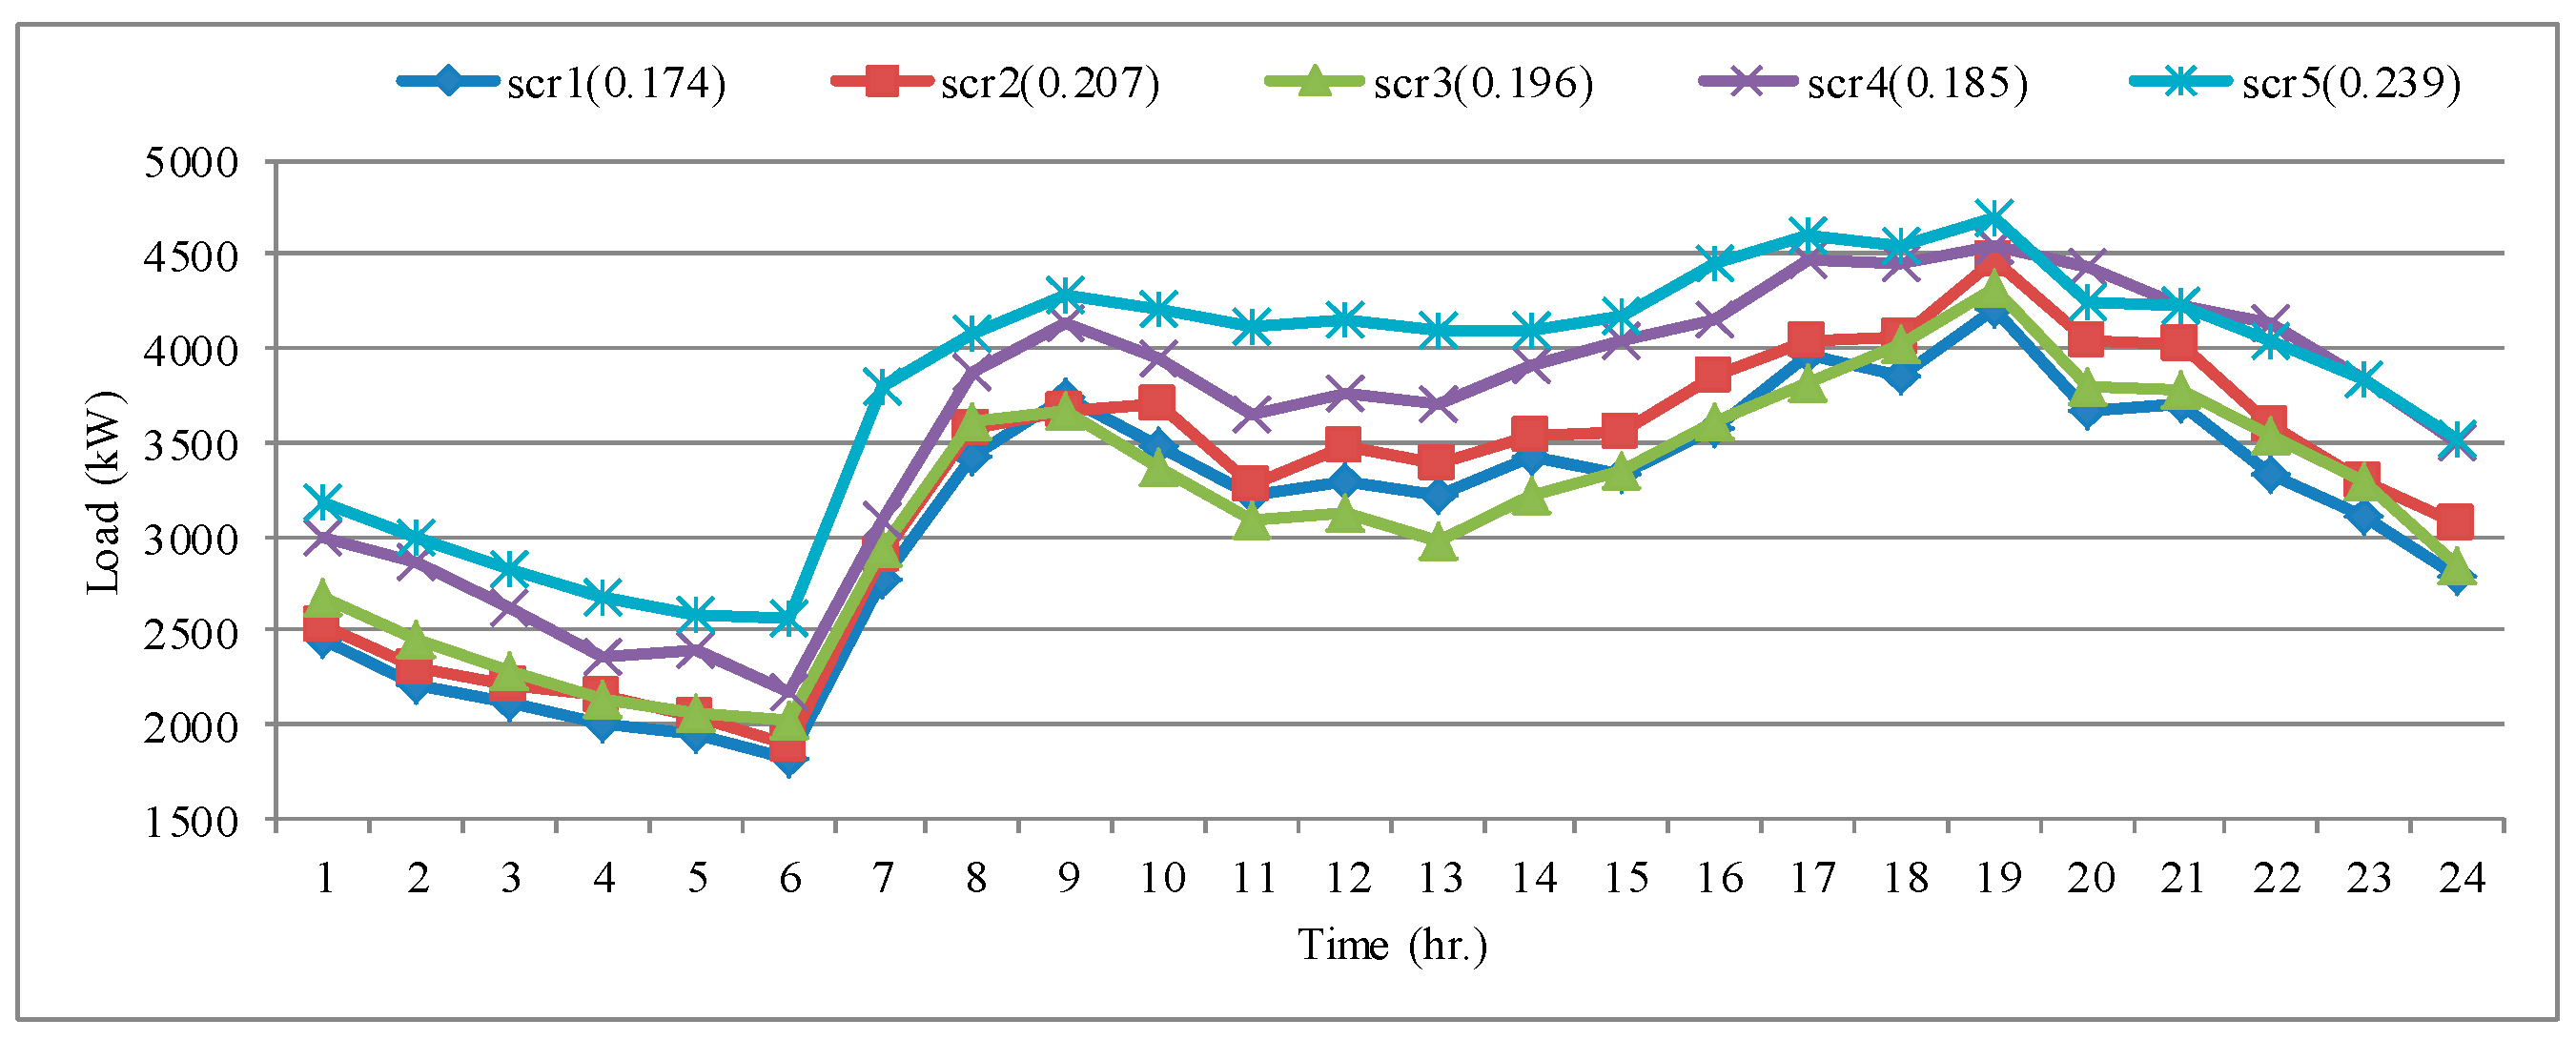
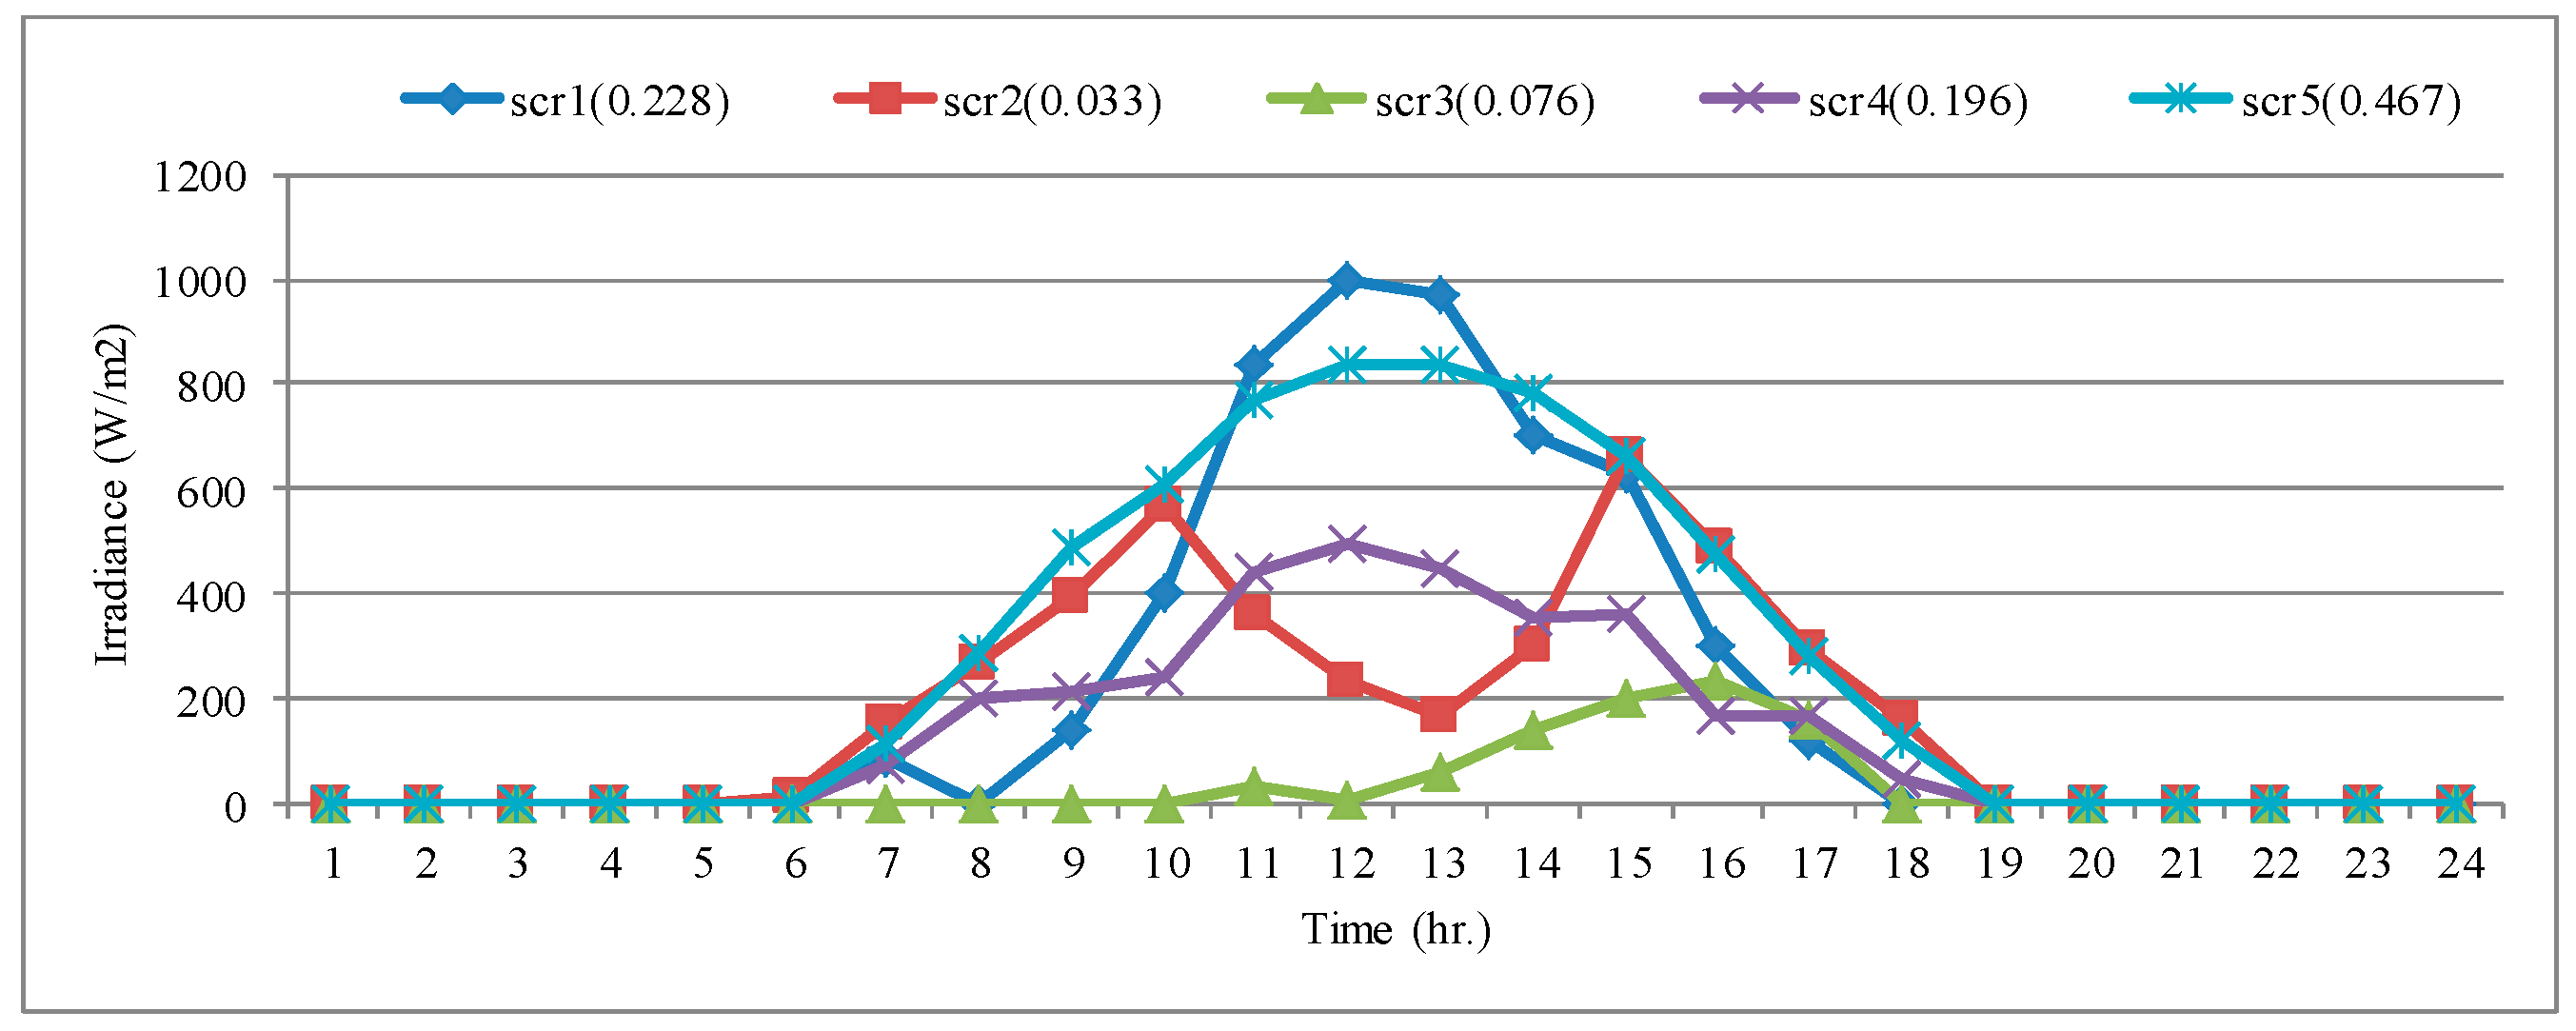
This stochastic analysis considers uncertainties of the load profiles, irradiance profiles, and the rating and location of rooftop PVGSs. Because the summer season has the largest irradiance, PVGSs’ integration will have large impacts on the system unbalance in this season. Therefore, a scenario reduction algorithm [
21,
22] is used to deduce a set of load and irradiance profile classes and occurrence probabilities from historical demand data and irradiance data respectively for the summer season.
Figure 2 and
Figure 3 show the five representative load and irradiance profiles and their corresponding occurrence probabilities labelling on the top parts of these two figures, respectively. The solar irradiance and weather data near the distribution system are obtained from the Taiwan’s Central Weather Bureau. The PV model considering the solar irradiance, temperature, inverter’s efficiency etc. in the OpenDSS software is used to generate PV AC outputs.
(2) Generate the load and irradiance profiles randomly according to their occurrence probabilities
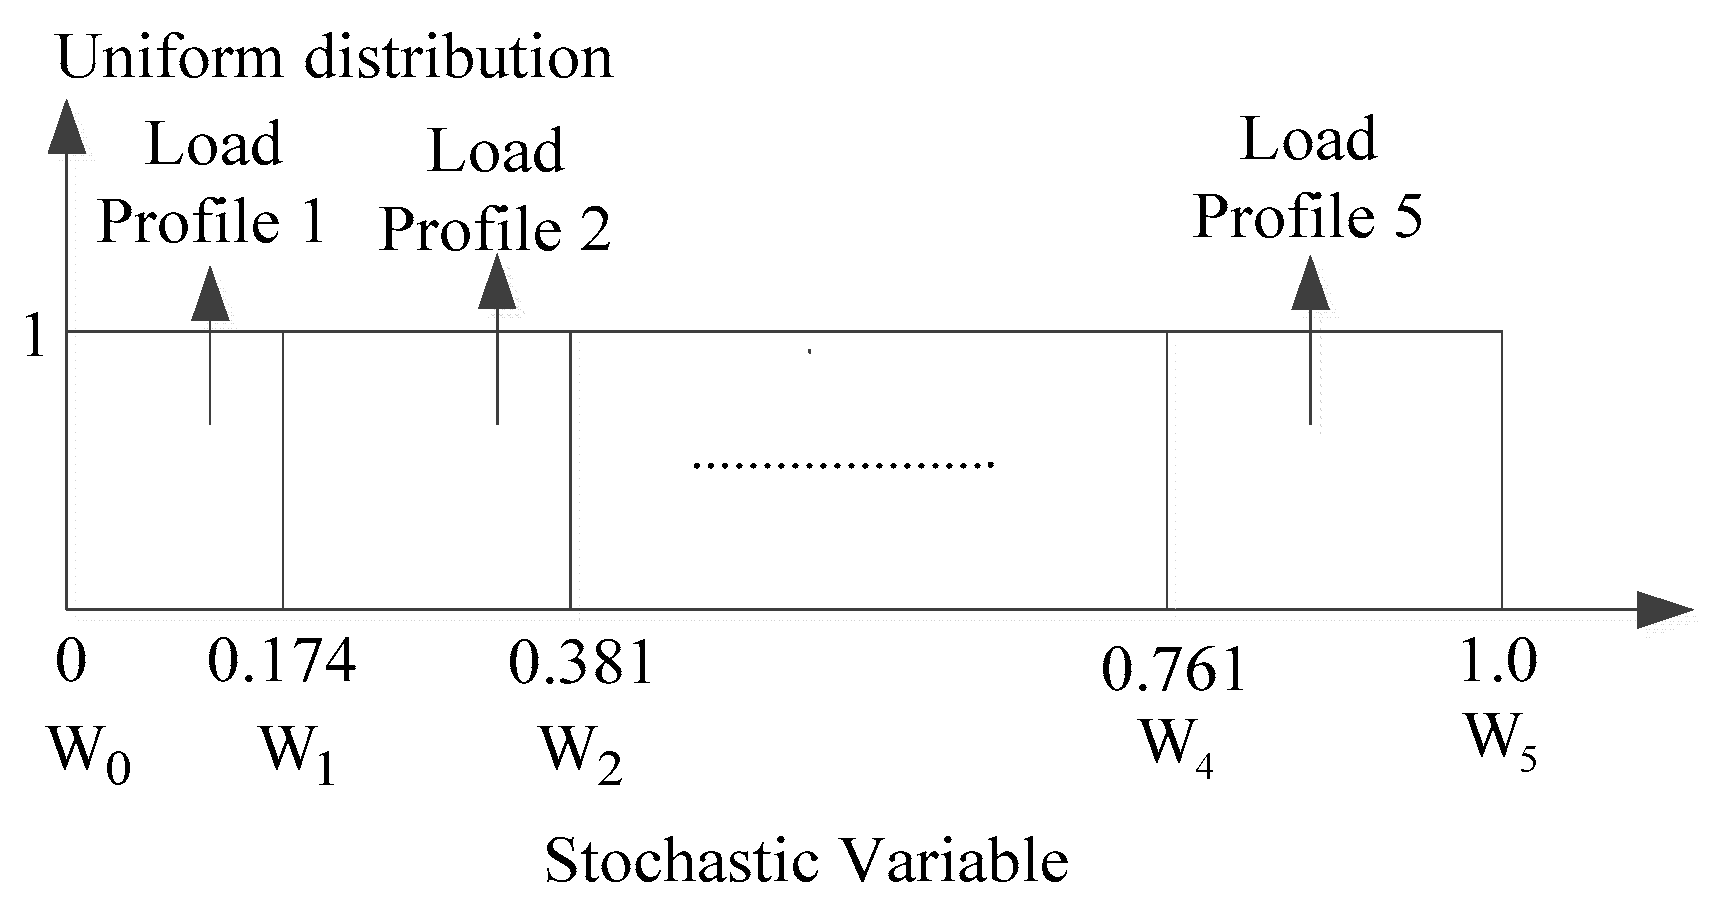
A probability distribution based on Roulette wheel selection concept that depicts the occurrence frequency of the load and irradiance profiles is used in the simulations. The Roulette wheel surface is divided into wedges representing the probabilities for each individual. The wedge
k of the stochastic model is calculated by
where f
i is the probability of the
i-th representative load profile or irradiance profile.
An example of the unequally divided uniform probability distribution of the load profile is shown in
Figure 4. In each Monte Carlo simulation, a number between 0 and 1 is generated by a random number generator to determine the load profile used in the load flow study. If the number is between
Wi-1 and
Wi, the
i-th representative load profile is selected. A representative load profile with higher probability is more likely to be selected.
(3) Randomly generate the PV connected positions and penetration rates
A random number for the connected position is created first, and then the corresponding penetration rate between 0~1 is generated.
(4) Execute unbalance analysis and record the system unbalance results
The load profile, irradiance profile, and PV data can be obtained from step 1 to 3. Using these data, the load flow analyses for 24 h are executed, and the maximal and average values for voltage unbalance and current unbalance are recorded for this iteration.
(5) Repeat this process until the completion of Monte Carlo simulations
4. Proposed Improving Method for System Unbalance
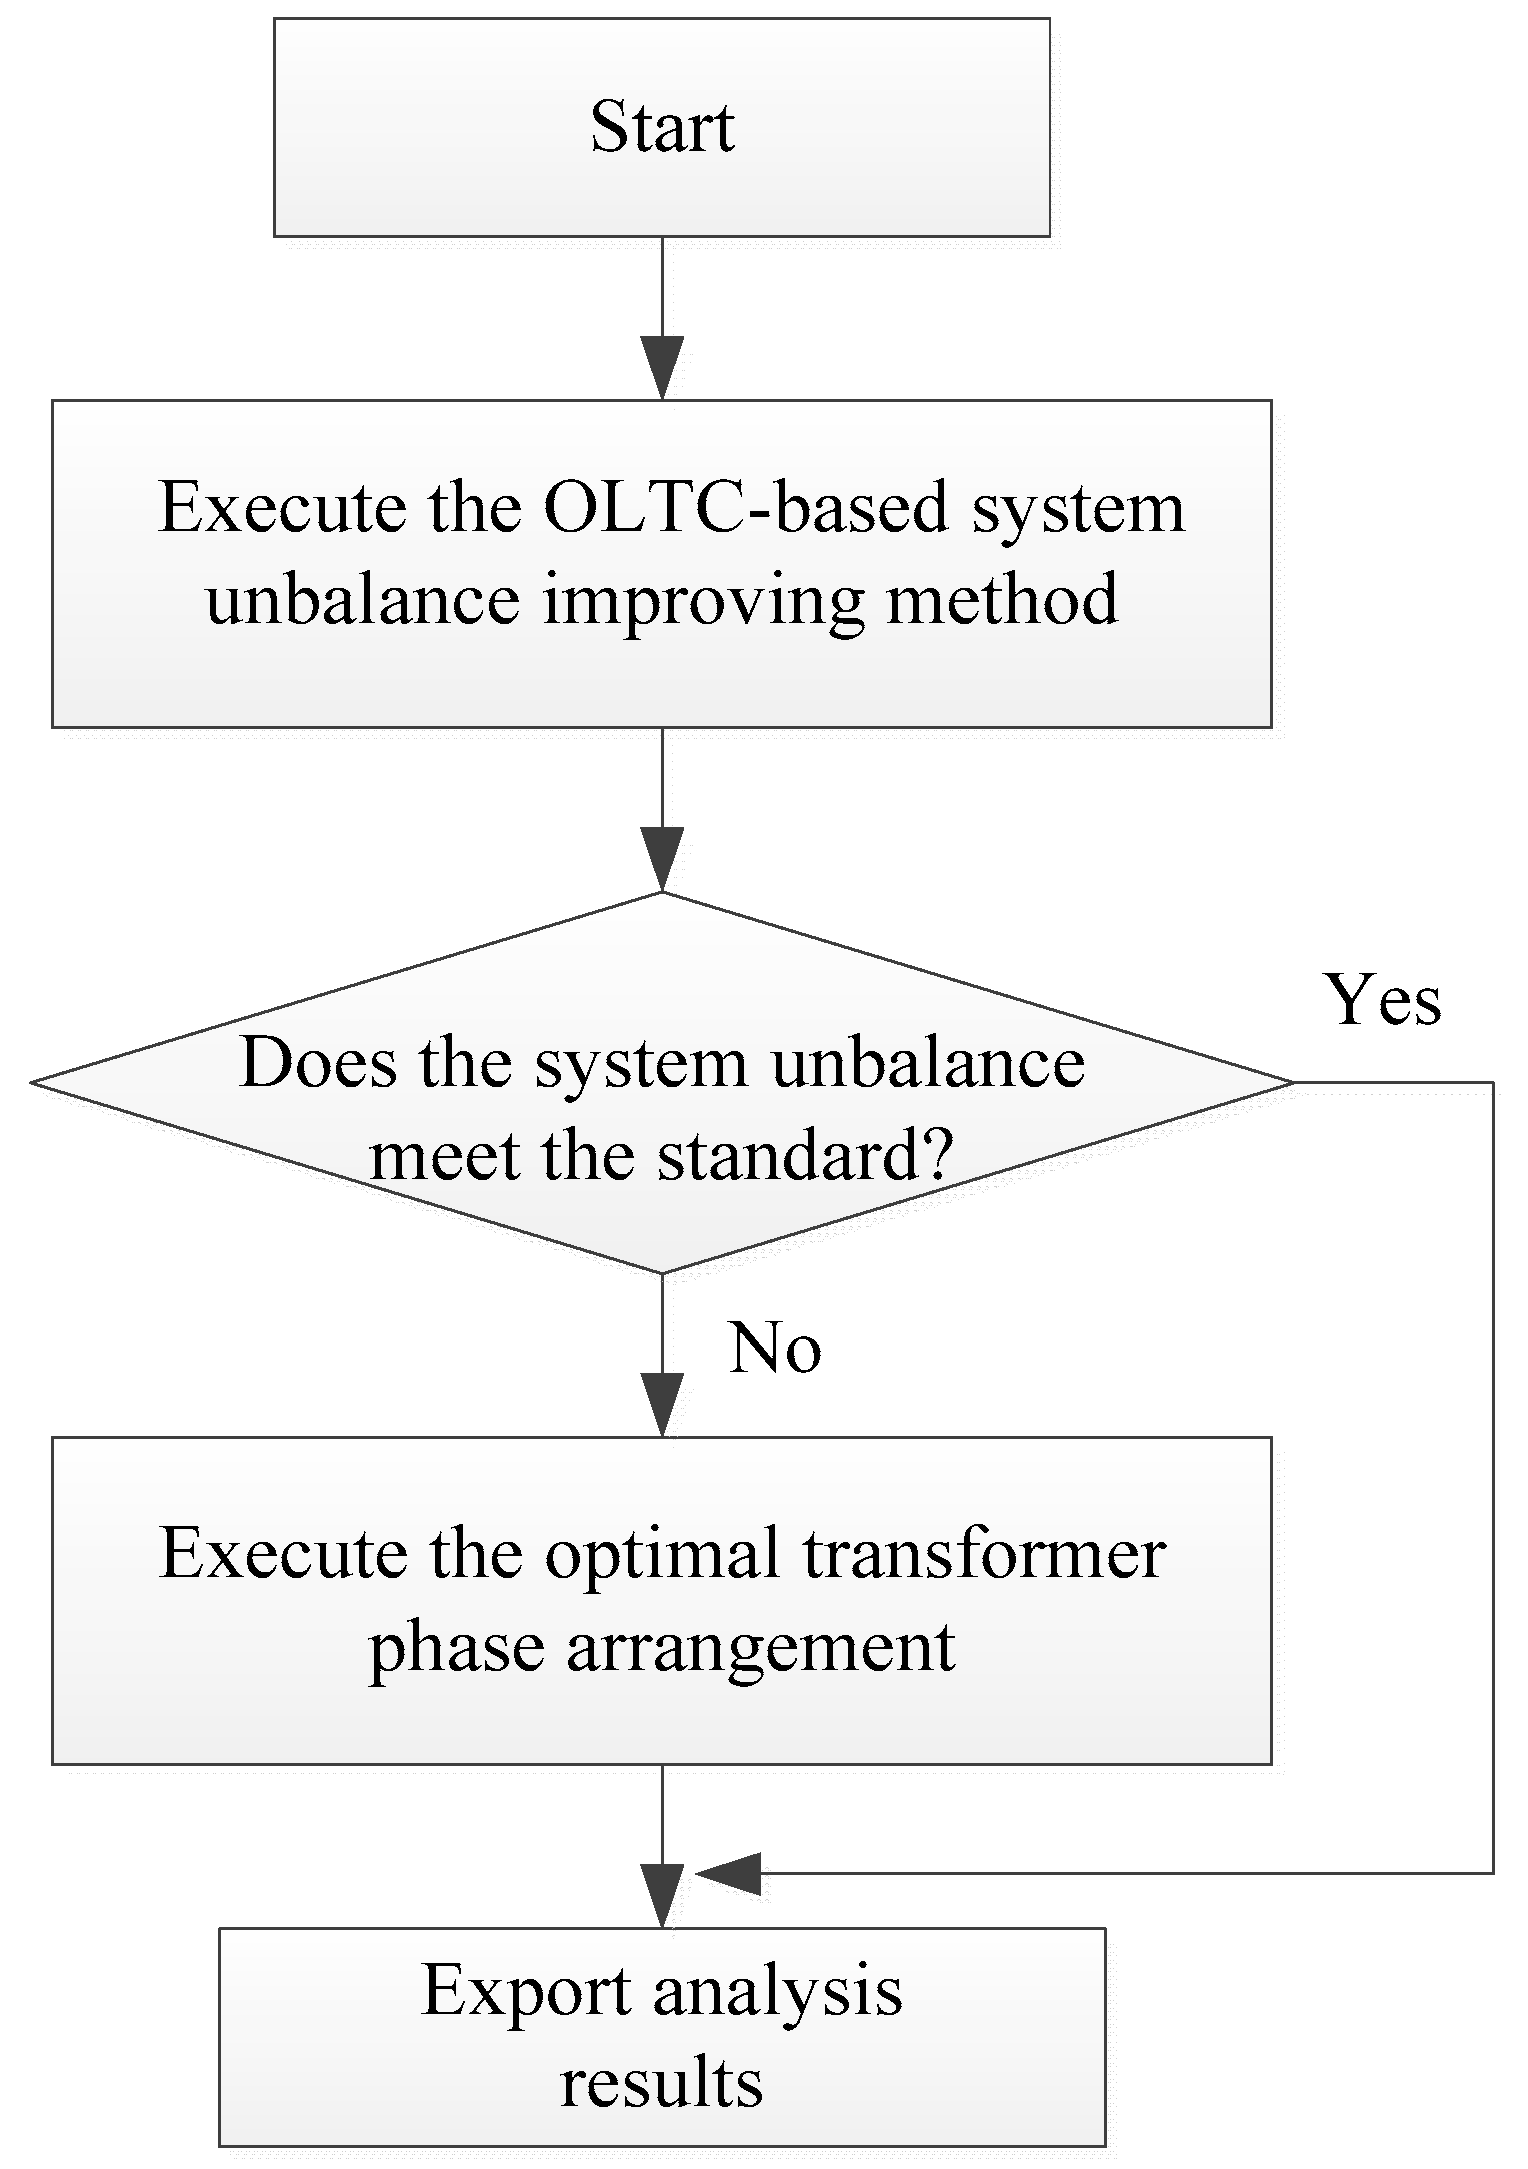
The unbalance loads and structures of transformers and unequal distributed PVGSs will lead to the system unbalance. A method shown in
Figure 5 is used to improve the system unbalance. Because using OLTC operation to mitigate the system unbalance is easier to implement than using the transformer phase arrangement, the OLTC-based solution is adopted first. If the system unbalance is still out of range, an optimal transformer phase arrangement based on the Genetic Algorithm (GA) is used to improve the system performance. The OLTC-based and optimal transformer phase arrangement models are described below.
4.1. On Load Tap Changer (OLTC)-Based Method
The tap ratio of the OLTC is changed discretely to regulate the secondary bus of remote bus voltage
Vi to achieve a set voltage
Vset. When
Vi remains outside the corresponding bandwidth
continuously for a time delay
Td, the tap position will be changed to meet the set point. The operation of the OLTC is formulated as follows [
23]:
where
e is the voltage difference between the actual bus voltage and the set-point voltage,
is the counter, n is the tap position, and d is the number of required tap steps.
This formulation describes that when e is hold larger than (or smaller than ) for a time delay Td, the OLTC will lower (or increase) the tap position for d steps. To avoid any hunting effect, the chosen bandwidth has to be larger than the magnitude of the voltage change at the bus for a single tap operation.
4.2. An Optimal Transformer Phase Arrangement
Balancing three phase currents and voltages is not an easy task. Unbalanced loads are one of the main causes of unbalanced voltages on distribution circuits and, thus, distributing single-phase loads equally across all three phases is an effective method to improve the system unbalance. A GA based method used to perform phase swap and minimize system unbalance is proposed in this section.
4.2.1. The Gene’s Representation of Optimal Transformer Phase Arrangement
A distribution system is usually a three-phase four-wire system with a radial structure in Taiwan. It provides services for single-phase and three-phase loads simultaneously. A distribution system supplies power for each area with three-, double-, or single-phase transformer depending on the area’s power consumption. Hence, various transformer connection types, such as wye-delta, open wye-open delta, and single-phase, are applied [
24].
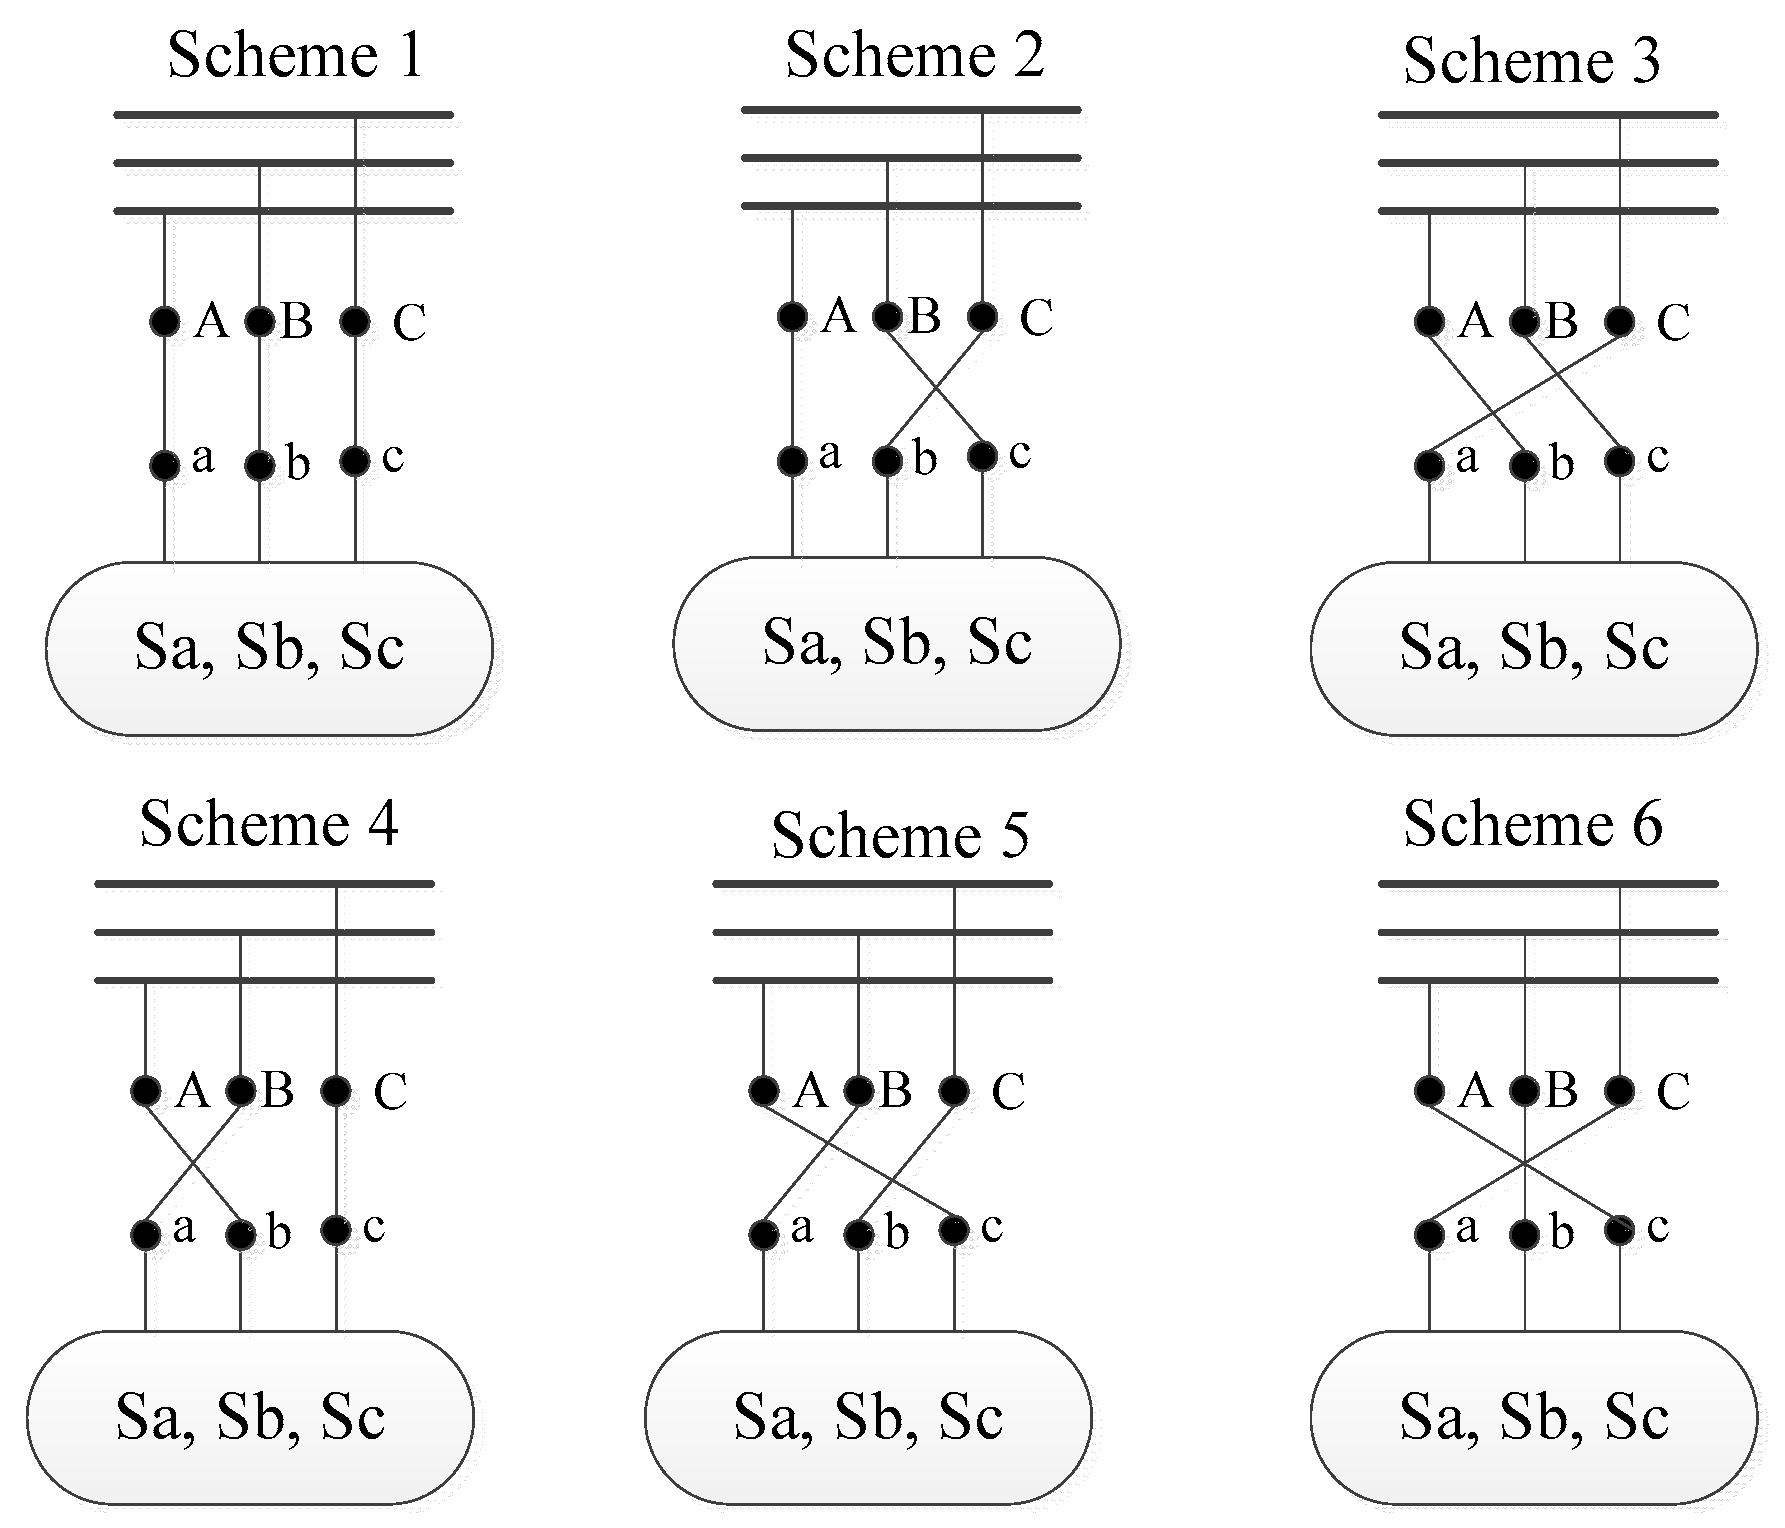
For the power supply with three-phase transformers, six possible phase arrangements can be tried to minimize the system unbalance as shown in
Figure 6. The open wye-open delta connection uses two transformers to supply electricity, therefore, two possible phase arrangements can be tried to minimize the system unbalance.
Take
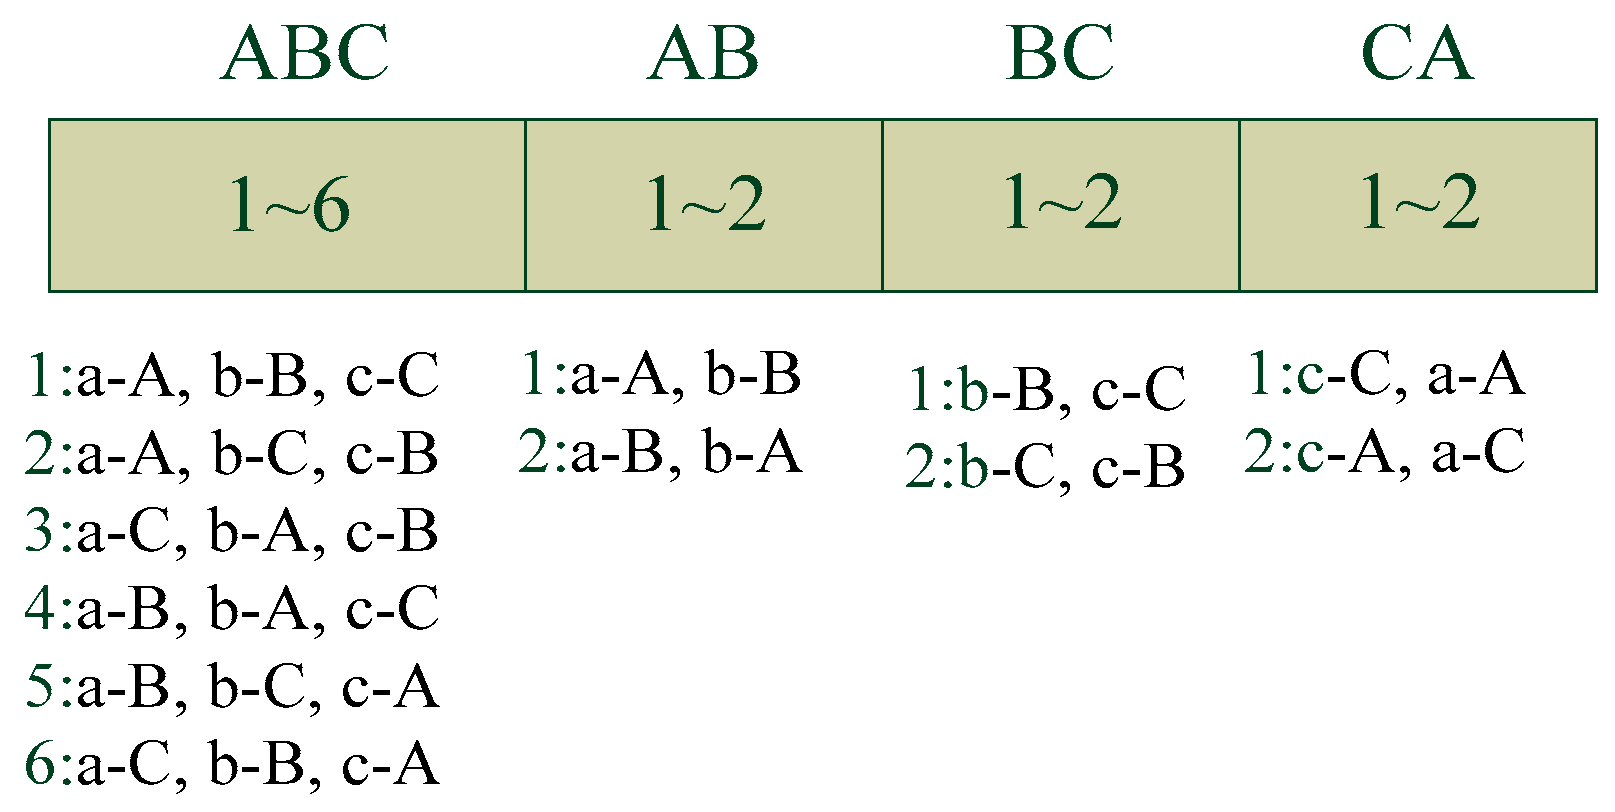
Figure 7 as an example to explain the chromosome encoding. The simple feeder contains four distribution transformers with one three-phase connection, and three open wye-open delta connections (AB, BC, and CA respectively). The gene’s format of this system is shown in
Figure 8. The six phase arrangements of the three-phase connection is encoded as number 1~6, while the open wye-open delta connection is encoded as number 1~2.
4.2.2. The Solution Method of Optimal Transformer Phase Arrangement
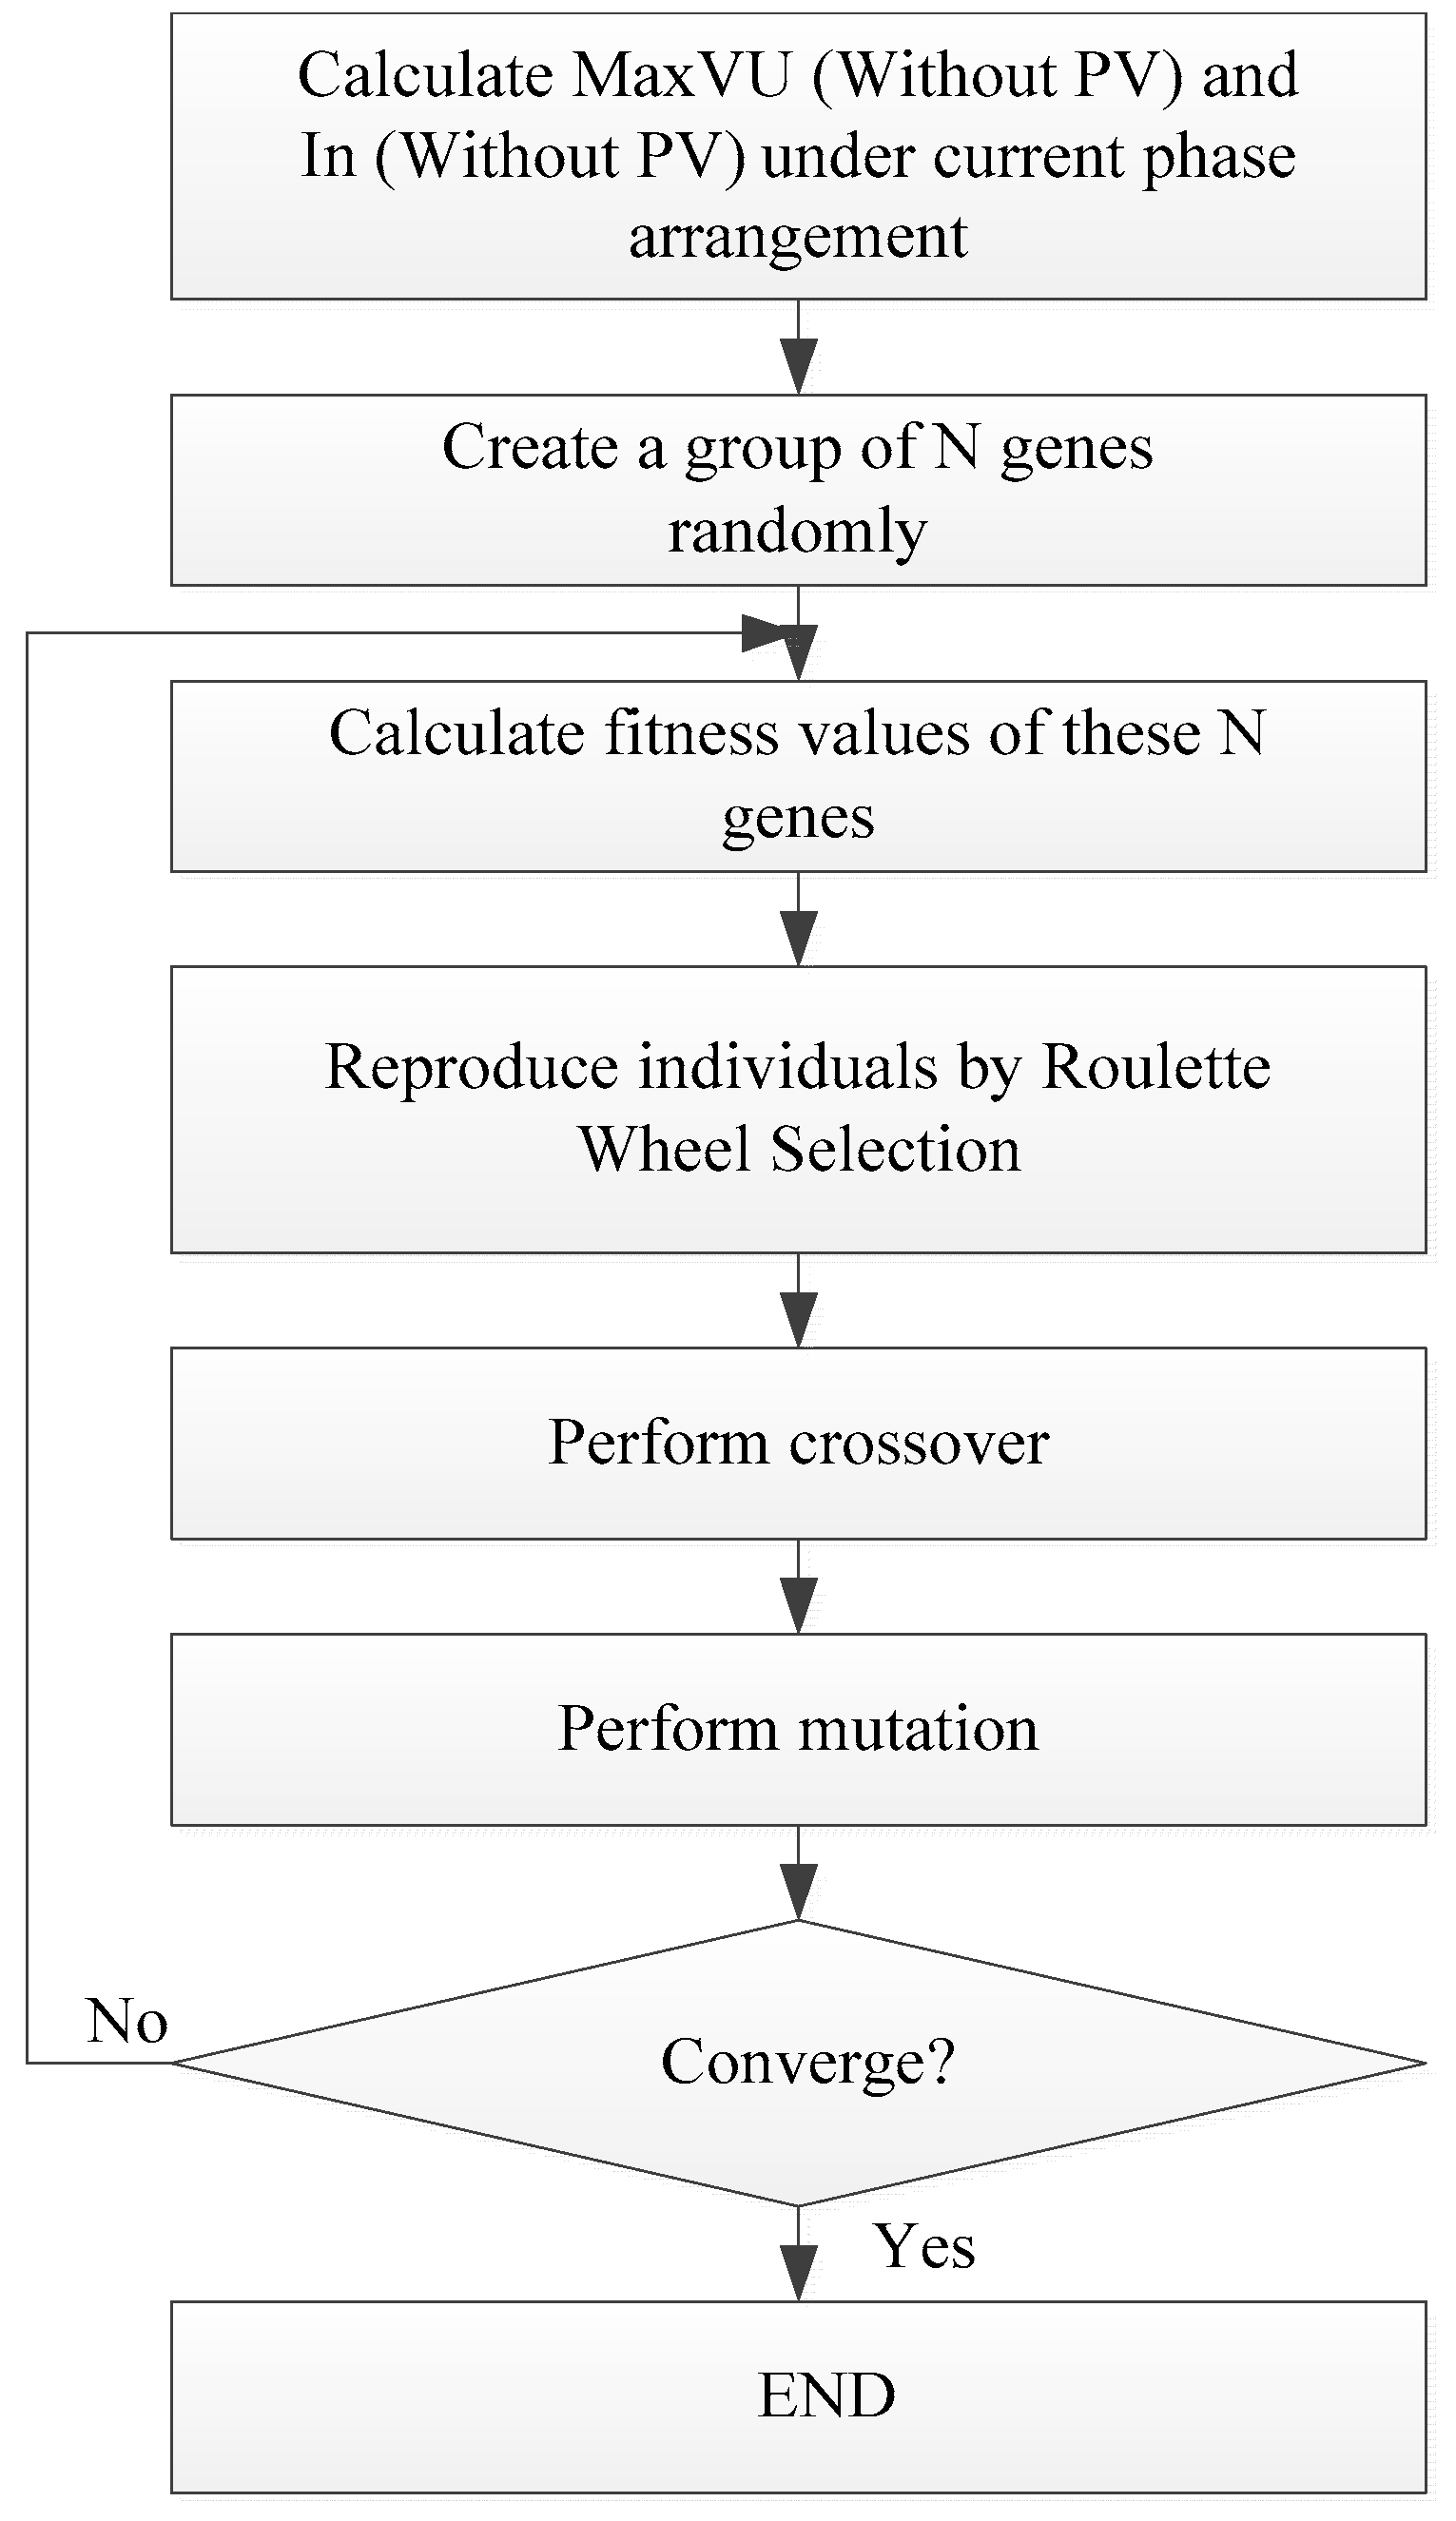
Figure 9 shows the optimal transformer phase arrangement method based on the GA. A group of N genes are created to obtain the transformer phase arrangement. The objective function and constraints are shown in Equation (11). This model considers the weighting summation of the daily mean value of maximal unbalance voltage and unbalance current as the objective function. The load flow is executed to check whether the voltage and current constraints of Equation (11) are met. The feasible gene that meets all constraints is retained, and the objective function of Equation (11) is obtained as the fitness value of this gene. The offspring individuals are reproduced and performed by Roulette Wheel selection, crossover, and mutation operations on this group of genes until the GA is converged. Detailed operations of GA can be referred to [
25].
S.T.
where
w1 and
w2 are weighting factors for the daily mean value of maximal unbalance voltage and unbalance current respectively,
Nn and
are the number of buses and branches, respectively,
Vlow and
Vhigh are the low and high limits of bus voltage,
is the flow limit of line
, and
VUmax is the voltage unbalance limit.
5. Test Results and Discussions
This section demonstrates the finding of this study. Test results for three extreme cases considering all rooftop PVGSs being connected to one single phase are presented first, and then the stochastic analyses of rooftop PVGSs’ integrations are proposed.
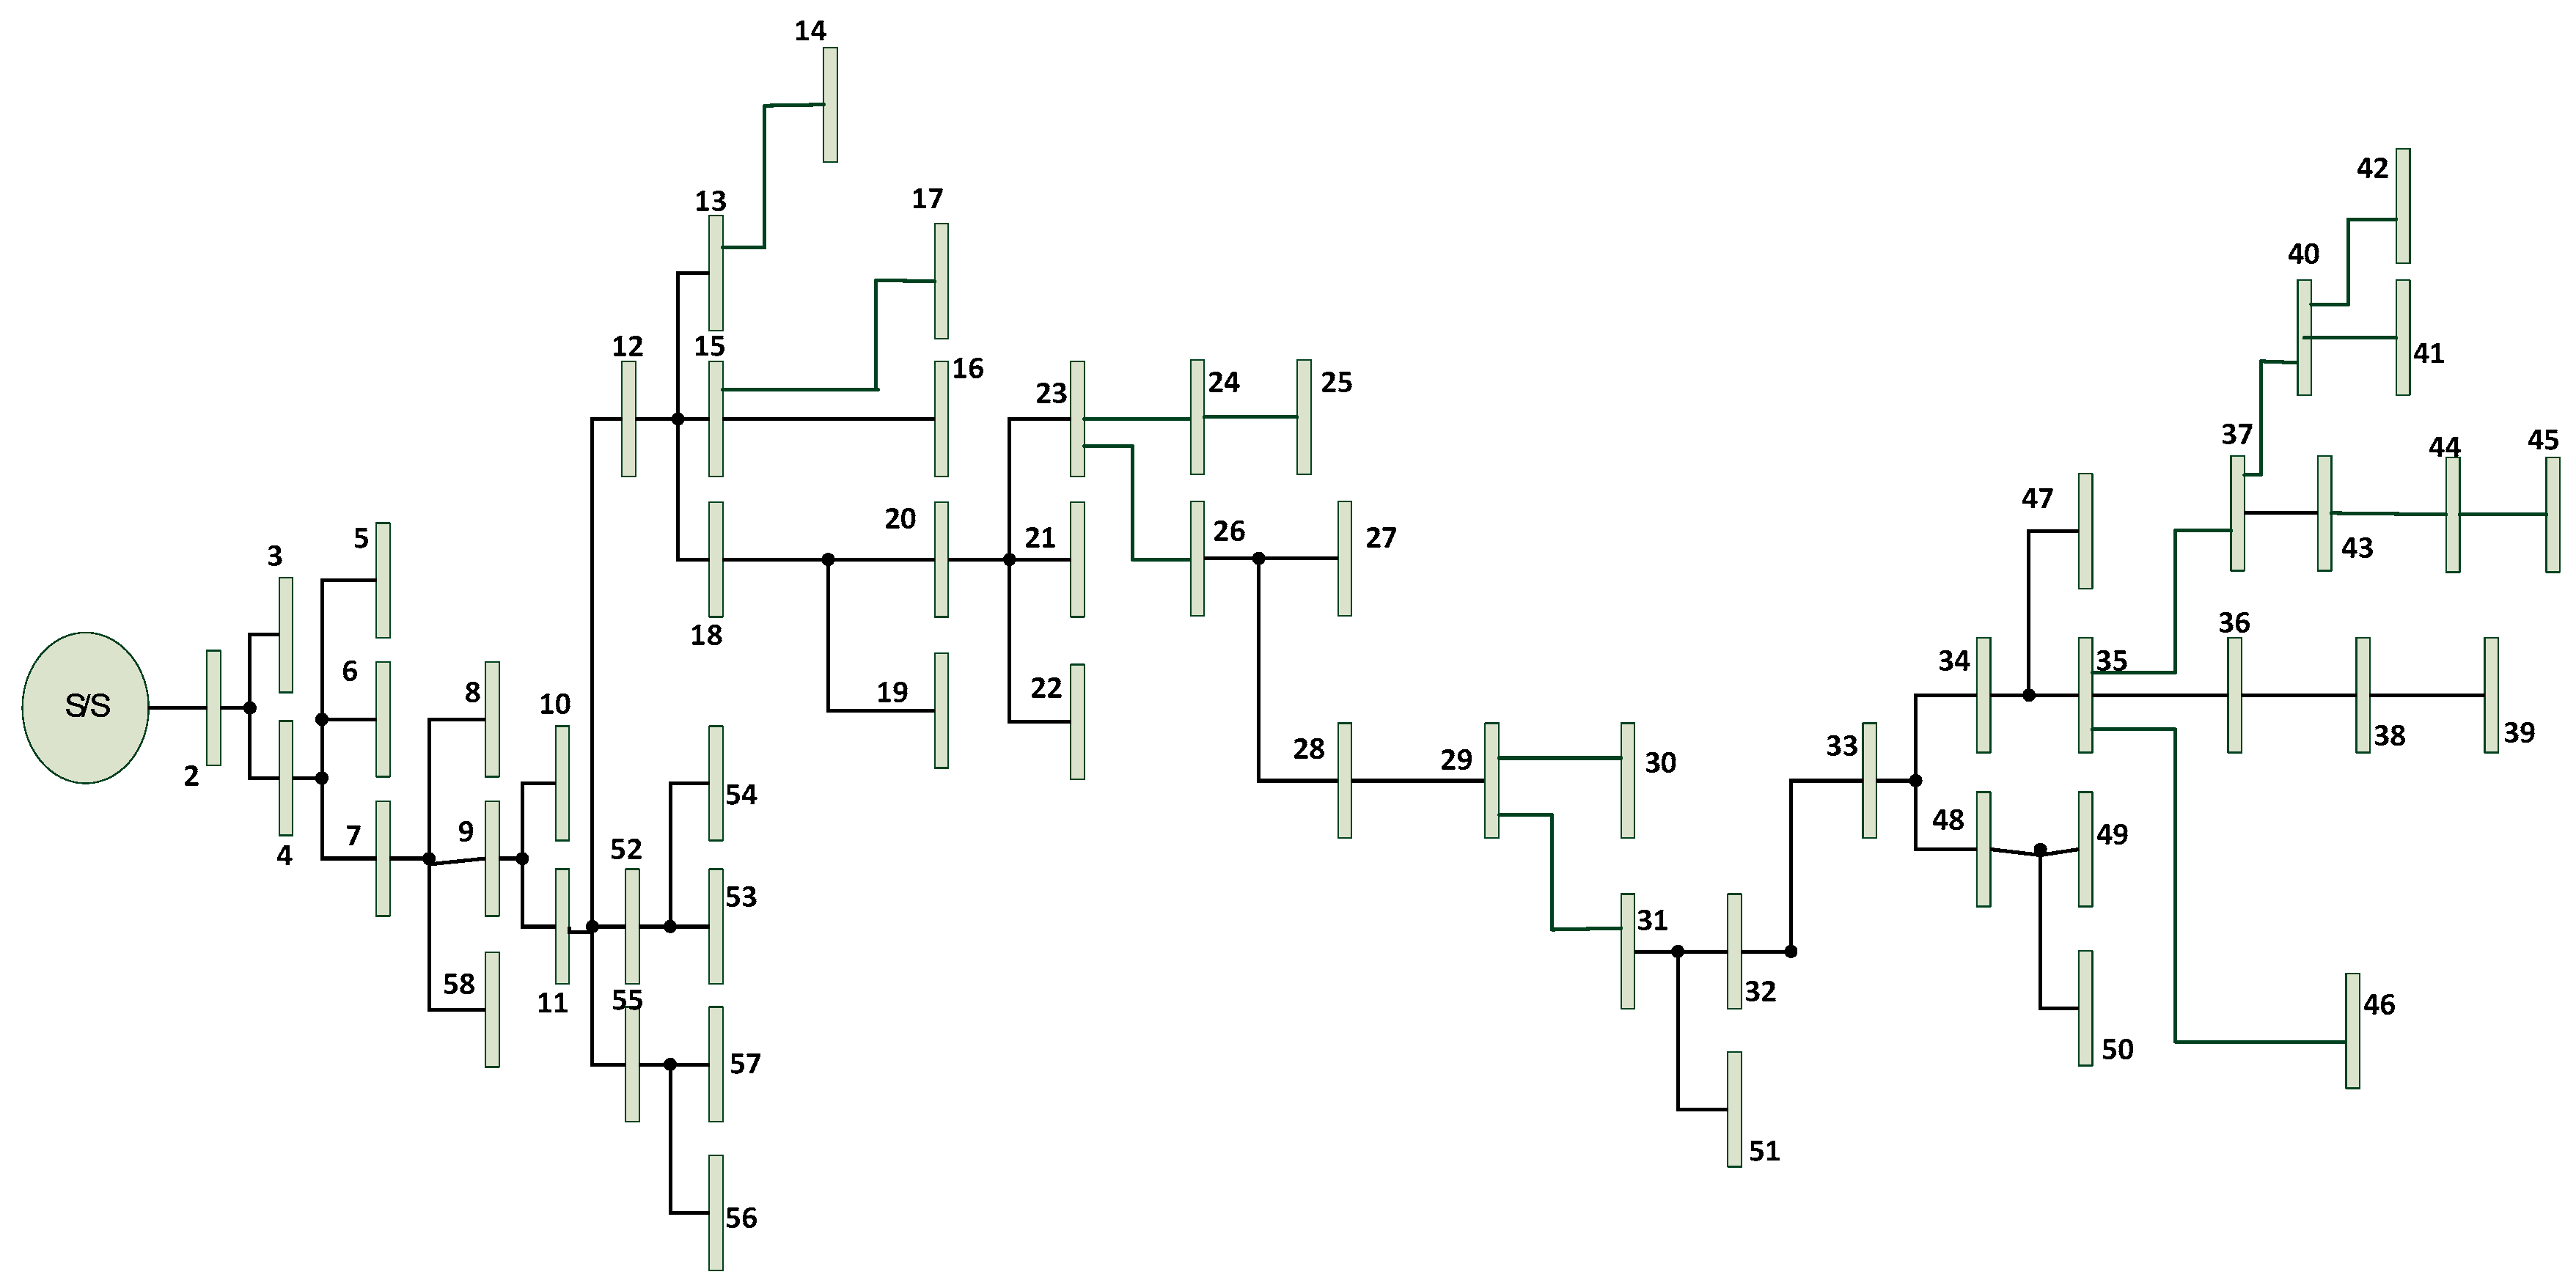
Figure 10 is an actual distribution network acquired from Taiwan Power Company. The actual distribution system is a three-phase overhead feeder supplied by 11.4 kV serving for a mix of the residential and commercial customers. The main lines employ 500 MCM and 477 MCM copper wires, and laterals of this feeder employ #1 and #2 copper wires. Technical parameters of the real distribution system are shown in
Appendix A.
5.1. Test Results of Three Extreme Cases
Three extreme cases shown below are executed and test results are demonstrated. When the PV generation is high and the load is low may create a more severe unbalance problem. Therefore, when considering these three extreme cases, the lowest load profile (scenario 3 in
Figure 2) and the highest PV generation profile (scenario 1 in
Figure 3) are used to perform these analyses.
Extreme Case 1: All rooftop PVGSs are connected to phase a.
Extreme Case 2: All rooftop PVGSs are connected to phase b.
Extreme Case 3: All rooftop PVGSs are connected to phase c.
5.1.1. Test Results of Extreme Case 1
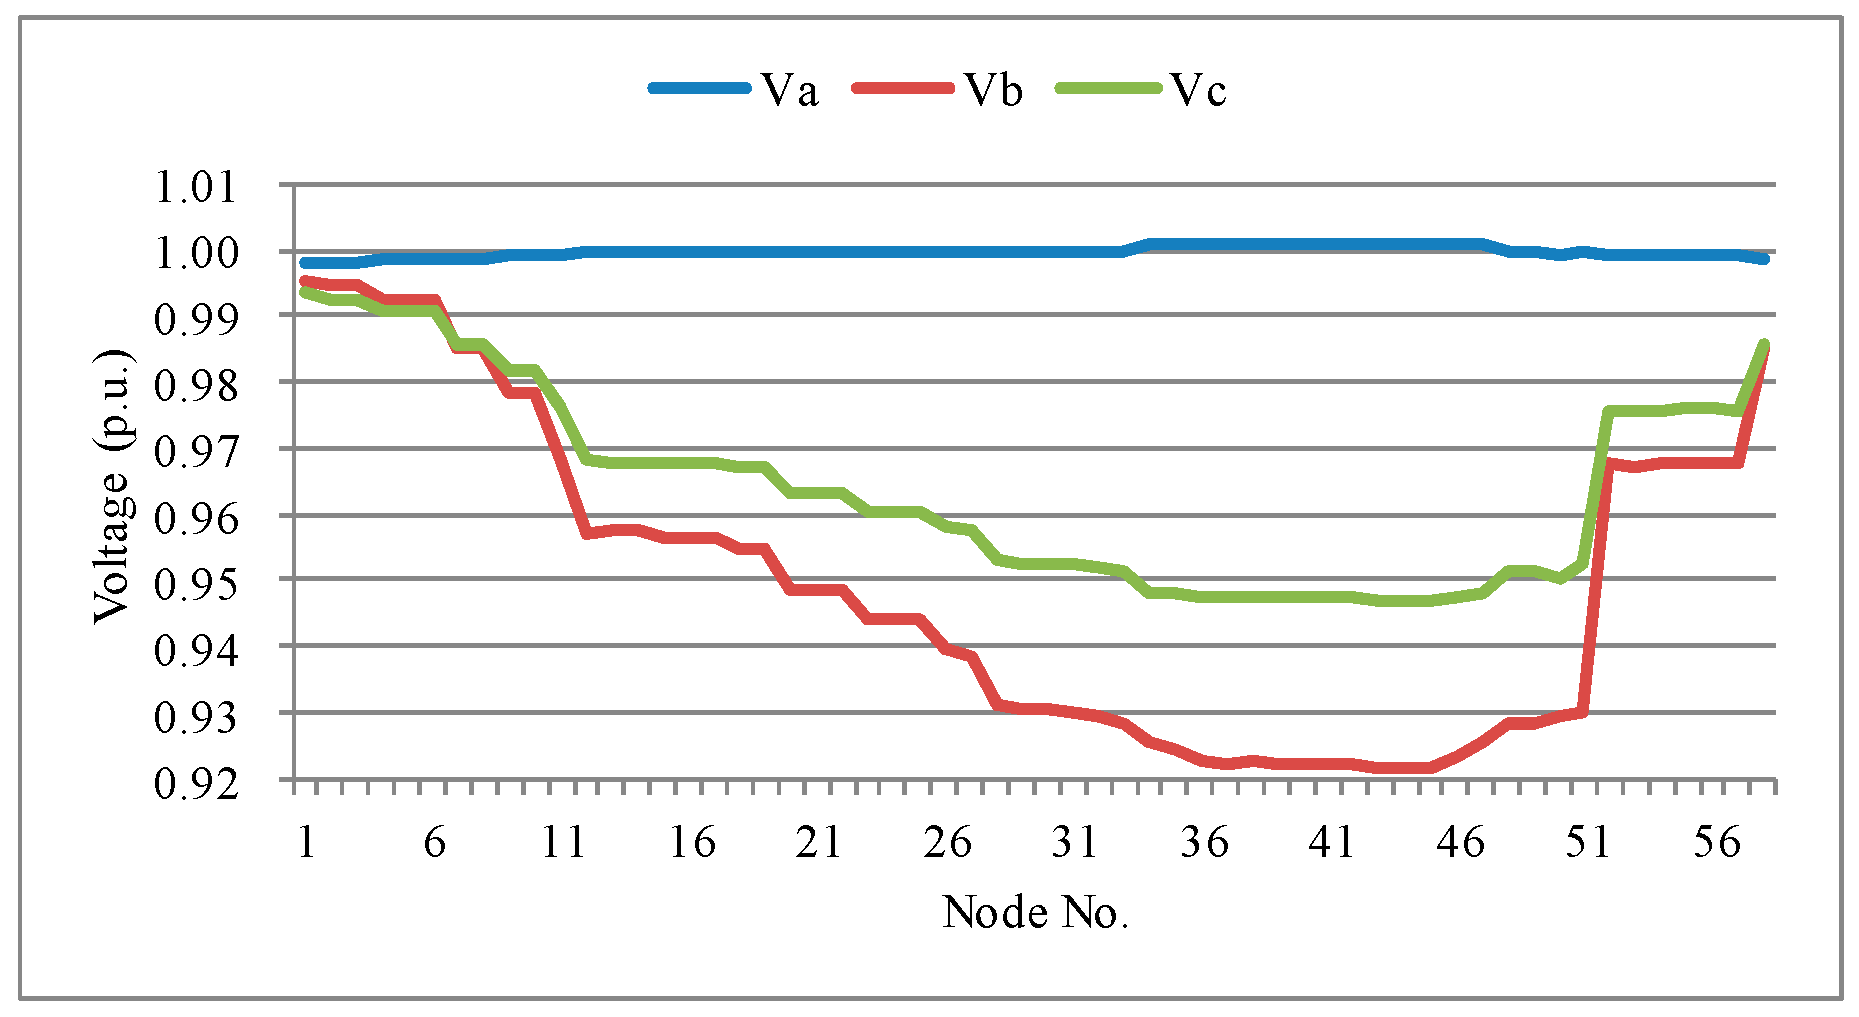
Figure 11 shows the voltage profile for the Extreme case 1 at 12:00 when the penetration rate is 1.0. The penetration rate of the network is defined as Equation (12). Because all the PVGSs are installed at phase a with the penetration rate of 1.0, the voltage level of phase a almost maintains at 1.0 p.u. for each node.
Figure 12a,b shows the voltage unbalance and current unbalance respectively for different time and penetration rates of Extreme Case 1. According to IEEE Std 1159-1995, voltage unbalance of greater than 2% should be reduced. The typical magnitude for voltage unbalance is 0.5–2% [
26]. In this Extreme case 1, the maximal voltage unbalance and current unbalance reach 4.65% and 143 A, respectively, at noon when the penetration rate is 1.0. It has violated the standard and the proposed method should be used to mitigate the system imbalance.
According to the proposed model shown in
Figure 5, the OLTC-based improving method is applied first.
Figure 13a,b shows the voltage and current imbalances for different penetration rates, respectively after adopting the OLTC to mitigate the system unbalance. The maximal voltage unbalance can be reduced to 2.40%. It means that OLTC can be effectively employed in improving voltage unbalance. However, from
Figure 13b, it can also be observed that OLTC does little on reducing the unbalance current. After using the OLTC to mitigate the system unbalance, Extreme Case 1 still violates the standard. Therefore, the optimal phase arrangement based on GA should be performed to improve the system unbalance.
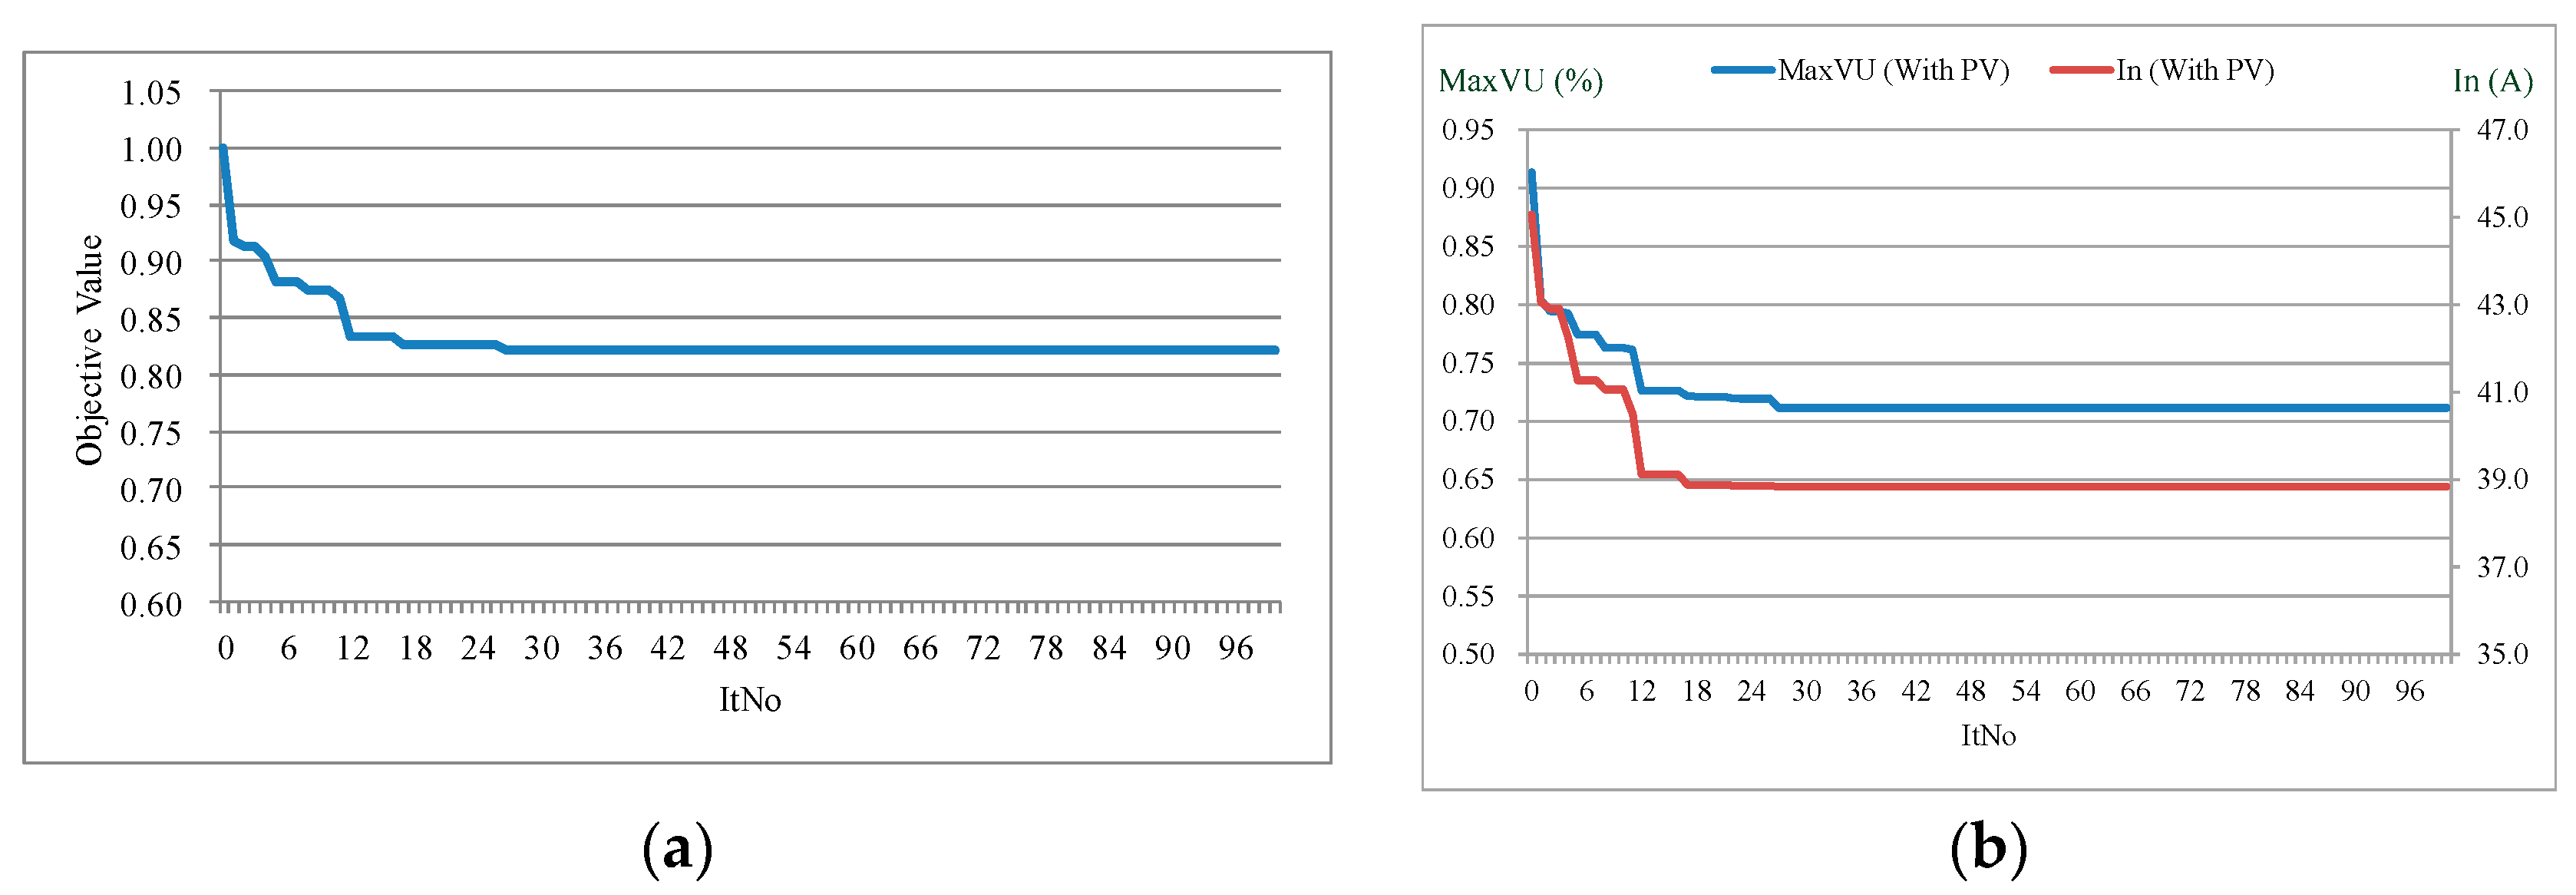
The weighting factors w1 and w2 for the maximal voltage unbalance and unbalance current in Equation (11) both equal to 0.5 due to the same concern about these two factors.
Figure 14a,b shows the converging process of the objective value, and MaxVU(With PV) and In(With PV), respectively.
Figure 15a,b shows the voltage and current imbalances, respectively for different penetration rates after adopting OLTC and optimal phase arrangement. The maximal voltage unbalance and unbalance current have been improved significantly after performing optimal phase arrangement, and the voltage unbalance is below 1.0% and therefore is within the standard.
5.1.2. Test Results of Extreme Cases 2 and 3
Figure 16a,b shows the voltage and current imbalances, respectively for different time and penetration rates of Extreme Case 2. In this Extreme case 2, the maximal voltage and current imbalances reach 4.69% and 169 A, respectively, at noon when the penetration rate is 1.0. It has violated the standard and needs to apply the proposed method to mitigate the system unbalance.
A detailed test results for the Extreme Case 1 have been given in previous paragraphs, and these three extreme cases have symmetrical properties. In order to save space, only the results of applying OLTC and optimal phase arrangement are represented for the Extreme Cases 2 and 3.
Figure 17a,b shows the voltage and current imbalances, respectively for different penetration rates after adopting OLTC and optimal phase arrangement for extreme case 2. The maximal voltage and current imbalances have been improved significantly after performing optimal phase arrangement and the system unbalance is within the standard.
Figure 18a,b shows the voltage and current imbalances, respectively for different time and penetration rates of Extreme Case 3. In this Extreme Case 3, the maximal voltage and current imbalances reach 3.69% and 140 A, respectively at noon when the penetration rate is 1.0.
Figure 19a,b shows the voltage and current imbalances, respectively for different penetration rates after adopting OLTC and optimal phase arrangement. The maximal voltage and current imbalances have been improved significantly after performing optimal phase arrangement. The system imbalance is within the standard.
5.2. Test Results of Stochastic Analyses of Rooftop PVGSs’ Integrations
After studies of three extreme cases, the stochastic case results are discussed below. Uncertainties of load, irradiance, and rooftop PVGSs’ integrating positions and capacities are addressed in the proposed model.
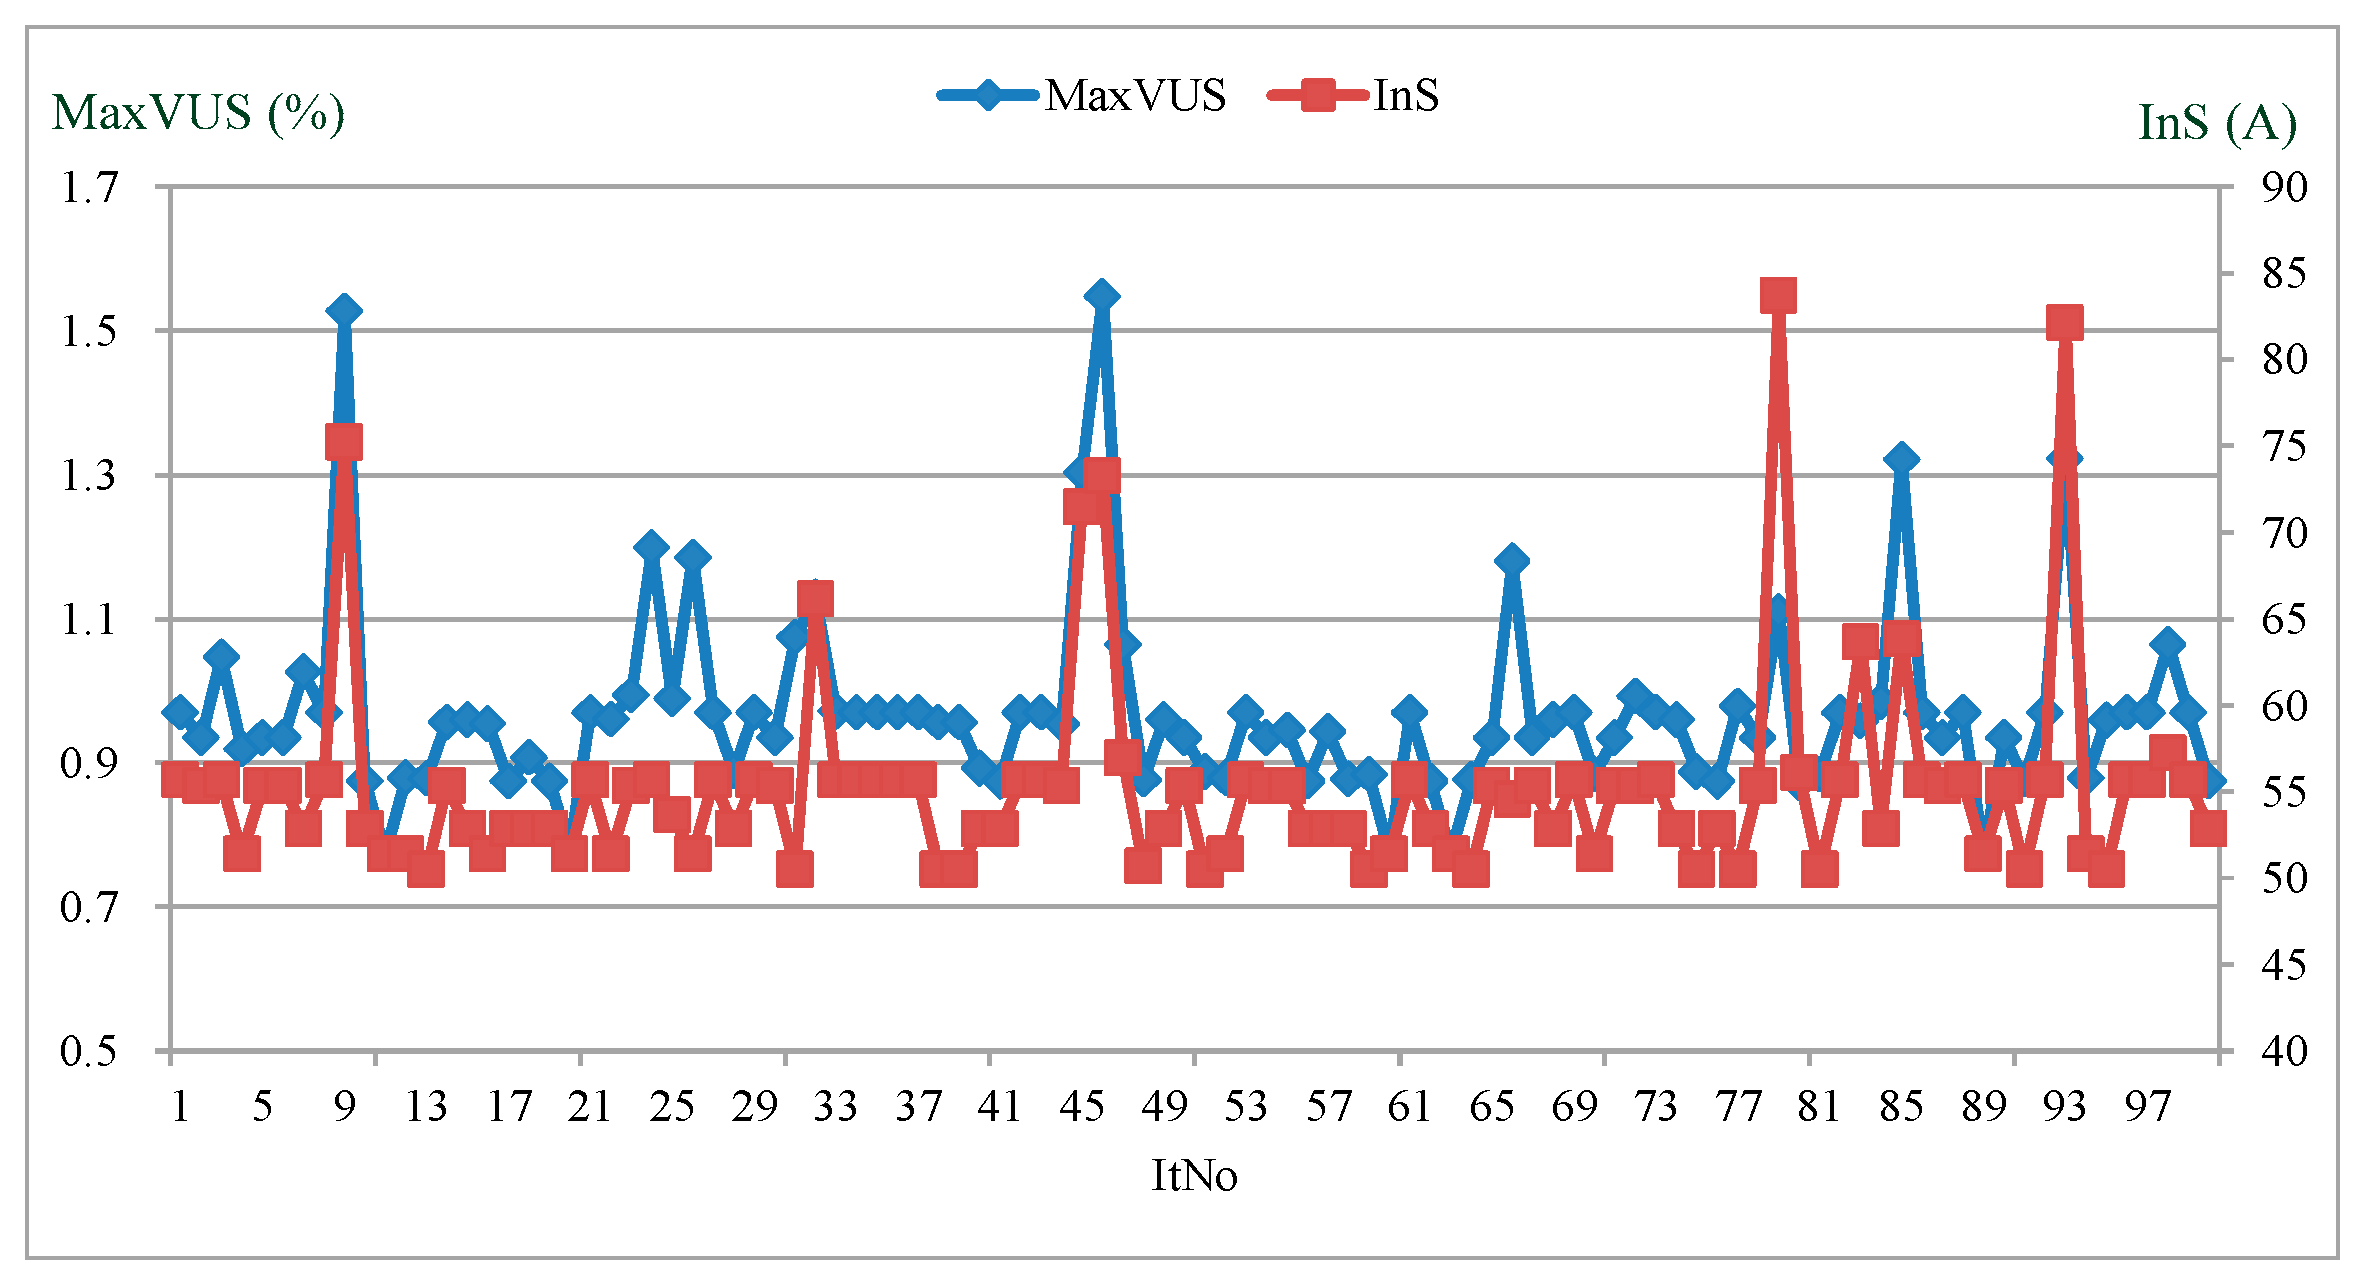
Figure 20a shows the stochastic results of the voltage and current imbalances for 100 scenarios. The MaxVUS and MaxInS are the maximal voltage unbalance and maximal current unbalance for each scenario. There are 49 times out of the 100 scenarios violating the standard. According to the proposed improving method, the OLTC is adopted first.
Figure 20b shows the voltage and current imbalances results after applying OLTC. It can be seen that the voltage unbalance has been improved after applying OLTC. No voltage unbalance is above 2%.
The voltage unbalance violation problem can be solved after applying OLTC. However, we still perform the optimal phase arrangement to understand its effects on the system unbalance.
Figure 21a shows the converging process for the optimal phase arrangement of the stochastic case with OLTC. The MaxVU and I
n in Equation (11) are amended to the average value of these 100 scenarios. The converging processes for the MaxVU (With PV) and I
n (With PV) are shown in
Figure 21b, and
Figure 22 depicts the maximal voltage unbalance and maximal current unbalance for each scenario after applying the OLTC and optimal phase arrangement. Obviously, from the test results, the performance of proposed improving method for system unbalance with OLTC and optimal phase arrangement of distribution transformers for rooftop PVGSs in distribution networks can be demonstrated.
6. Conclusions
Rooftop PVGSs may cause severe system unbalance due to their single-phase connections. This paper analyzed the possible system unbalance from three extreme cases and stochastic cases. The stochastic cases took the uncertainties of load profiles, irradiance profiles, and the rating and location of rooftop PVGSs into account and create 100 scenarios for analyses. Test results showed that three extreme cases cause severe system unbalance and about half of the stochastic cases violate the standard. In order to mitigate the system unbalance, an improving method based on the OLTC and optimal phase arrangement was proposed. Simulation results showed the proposed method can improve the system unbalance significantly even under the three extreme cases.
The penetration of PV and Electric Vehicle (EV) in the distribution network increases year by year because PV with its advantage of no pollution and EV can reduce the use of fossil fuel. Cost reduction of the energy storage system makes it a viable alternative to mitigate the intermittent nature of solar energy generation. The distribution grid is under a dramatic change to accommodate these facilities. Further studies can be implemented to investigate how these facilities impact on the system unbalance and find the associated mitigation techniques.
Author Contributions
Conceptualization, R.-C.L. and J.-H.T.; Data curation, Y.-F.L. and W.-M.L.; Investigation, Y.-F.L. and W.-M.L.; Methodology, R.-C.L.; Validation, Y.-H.L.; Writing—original draft, J.-H.T. All authors have read and agreed to the published version of the manuscript.
Funding
This research was funded by Ministry of Science and Technology of Taiwan under Contracts MOST 108-2221-E-110-041-MY3 and MOST 108-2622-E-110-007-CC2.
Conflicts of Interest
The authors declare no conflict of interest.
Appendix A
Table A1 and
Table A2 shows the distribution transformer data and line parameters of the actual distribution system shown in
Figure 10.
Table A1.
The distribution transformer data.
Table A1.
The distribution transformer data.
| Node No. | Distribution Transformer Capacity (kVA) | Connection Type |
|---|
| A | B | C |
|---|
| 2 | | 25 | 25 | Open Y Open Delta |
| 2 | | 25 | | Single Phase |
| 3 | | 50 | 50 | Open Y Open Delta |
| 3 | | 50 | | Single Phase |
| 4 | 25 | | 25 | Open Y Open Delta |
| 5 | 50 | | 50 | Open Y Open Delta |
| 5 | 50 | | | Single Phase |
| 7 | 25 | | | Single Phase |
| 8 | | 50 | 50 | Open Y Open Delta |
| 13 | 50 | | 50 | Open Y Open Delta |
| 16 | | | 25 | Single Phase |
| 17 | 100 | 100 | 100 | Y-Y |
| 21 | 25 | | 25 | Open Y Open Delta |
| 21 | 25 | | | Single Phase |
| 22 | | 25 | | Single Phase |
| 27 | 167 | 167 | 167 | Y-Y |
| 28 | 50 | | | Single Phase |
| 32 | 25 | | 25 | Open Y Open Delta |
| 32 | 25 | | | Single Phase |
| 37 | 100 | 100 | 100 | Y-Y |
| 39 | 100 | 100 | 100 | Y-Y |
| 41 | | 25 | 25 | Open Y Open Delta |
| 43 | 100 | 100 | 100 | Y-Y |
| 44 | 100 | 100 | 100 | Y-Y |
| 45 | 100 | 100 | 100 | Y-Y |
| 46 | 100 | 100 | 100 | Y-Y |
| 47 | 167 | 167 | 167 | Y-Y |
| 49 | 25 | | | Single Phase |
| 50 | 100 | | 100 | Open Y Open Delta |
| 50 | 25 | | | Single Phase |
| 53 | 167 | 167 | 167 | Y-Y |
| 56 | | 100 | | Single Phase |
| 57 | 25 | | 25 | Open Y Open Delta |
| 58 | 50 | | 50 | Open Y Open Delta |
Table A2.
The line parameters.
Table A2.
The line parameters.
| From | To | Type | Length (m) |
|---|
| 1 | 2 | 500 MCM | 119 |
| 2 | 4 | 477 MCM | 214 |
| 2 | 3 | 477 MCM | 100 |
| 4 | 7 | 477 MCM | 606 |
| 4 | 5 | 477 MCM | 24 |
| 4 | 6 | 477 MCM | 50 |
| 7 | 8 | 477 MCM | 123 |
| 7 | 58 | 477 MCM | 87 |
| 7 | 9 | 477 MCM | 589 |
| 9 | 11 | 477 MCM | 855 |
| 9 | 10 | 477 MCM | 27 |
| 11 | 52 | 477 MCM | 357 |
| 11 | 12 | 477 MCM | 1198 |
| 11 | 55 | 477 MCM | 548 |
| 12 | 15 | 477 MCM | 834 |
| 12 | 13 | #2 | 205 |
| 12 | 18 | 477 MCM | 266 |
| 13 | 14 | #2 | 459 |
| 15 | 16 | 477 MCM | 306 |
| 15 | 17 | #2 | 74 |
| 18 | 19 | 477 MCM | 139 |
| 18 | 20 | 477 MCM | 749 |
| 20 | 21 | 477 MCM | 163 |
| 20 | 22 | 477 MCM | 472 |
| 20 | 23 | 477 MCM | 600 |
| 23 | 26 | 477 MCM | 520 |
| 23 | 24 | #2 | 70 |
| 24 | 25 | #2 | 248 |
| 26 | 27 | #2 | 228 |
| 26 | 28 | 477 MCM | 1263 |
| 28 | 29 | 477 MCM | 70 |
| 29 | 30 | 477 MCM | 210 |
| 29 | 31 | 477 MCM | 87 |
| 31 | 32 | 477 MCM | 117 |
| 31 | 51 | #2 | 924 |
| 32 | 33 | 477 MCM | 126 |
| 33 | 48 | 477 MCM | 69 |
| 33 | 34 | 500 MCM | 869 |
| 34 | 35 | 477 MCM | 285 |
| 34 | 47 | 477 MCM | 178 |
| 35 | 46 | 477 MCM | 738 |
| 35 | 36 | 477 MCM | 354 |
| 36 | 37 | 477 MCM | 99 |
| 36 | 38 | 477 MCM | 126 |
| 37 | 40 | 477 MCM | 280 |
| 37 | 43 | 477 MCM | 167 |
| 38 | 39 | #2 | 44 |
| 40 | 41 | 477 MCM | 79 |
| 40 | 42 | 477 MCM | 506 |
| 43 | 44 | #1 | 73 |
| 44 | 45 | #1 | 33 |
| 48 | 49 | 477 MCM | 338 |
| 48 | 50 | #1 | 719 |
| 52 | 54 | 477 MCM | 655 |
| 52 | 53 | #2 | 59 |
| 55 | 57 | 477 MCM | 878 |
| 55 | 56 | 477 MCM | 56 |
References
- The Fastest Growing Energy Sectors of 2019. Available online: https://oilprice.com/Energy/Energy-General/The-Fastest-Growing-Energy-Sectors-Of-2019.html (accessed on 13 April 2020).
- Mather, B.; Yuan, G. Going to the Next Level: The growth of distributed energy resources. IEEE Power Energy 2018, 16, 12–17. [Google Scholar] [CrossRef]
- Katiraei, F.; Aguero, J.R. Solar PV Integration Challenges. IEEE Power Energy Mag. 2011, 9, 62–71. [Google Scholar] [CrossRef]
- Murugaanantham, B.; Gnanadass, R.; Padhy, N.P. Challenges with renewable energy sources and storage in practical distribution systems. Renew. Sustain. Energy Rev. 2017, 73, 125–134. [Google Scholar] [CrossRef]
- Bajaj, M.; Singh, A.K. Grid Integrated Renewable DG Systems: A Review of Power Quality Challenges and State-of-the-Art Mitigation Techniques. Int. J. Energy Res. 2020, 44, 26–29. [Google Scholar] [CrossRef]
- Hoke, A.; Bulter, R.; Hambrick, J.; Kroposki, B. Steady-State Analysis of Maximum Photovoltaic Penetration Levels on Typical Distribution Feeders. IEEE Trans. Sustain. Energy 2013, 4, 350–357. [Google Scholar] [CrossRef]
- Shayani, R.A.; Oliveira, M.A.G. Photovoltaic Generation Penetration Limits in Radial Distribution Systems. IEEE Trans. Power Syst. 2011, 26, 1625–1631. [Google Scholar] [CrossRef]
- Barutcu, I.C.; Karatepe, E.; Boztepe, M. Impact of Harmonic Limits on PV Penetration Levels in Unbalanced Distribution Networks Considering Load and Irradiance Uncertainty. Int. J. Electr. Power Energy Syst. 2020, 118, 713–725. [Google Scholar] [CrossRef]
- Baran, M.E.; Hooshyar, H.; Shen, Z.; Huang, A. Accommodating High PV Penetration on Distribution Feeders. IEEE Trans. Smart Grid 2012, 3, 1039–1046. [Google Scholar] [CrossRef]
- Bhagavathy, S.; Pearsall, N.; Purtrus, G.; Walker, S. Performance of UK Distribution Networks with Single-Phase PV Systems Under Fault. Int. J. Electr. Power Energy Syst. 2019, 113, 713–725. [Google Scholar] [CrossRef]
- Bagheri, P.; Liu, Y.; Xu, W.; Fekadu, D. Mitigation of DER-Caused Over-Voltage in MV Distribution Systems Using Voltage Regulators. IEEE Power Energy Technol. Syst. J. 2019, 6, 1–10. [Google Scholar] [CrossRef]
- Hu, Z.; Li, F. Cost-Benefit Analyses of Active Distribution Network Management, Part I: Annual Benefit Analysis. IEEE Trans. Smart Grid 2012, 3, 1067–1074. [Google Scholar] [CrossRef]
- Amir, A.A.; Rajendra, S. Further Cost Reduction of Battery Manufacturing. Batteries 2017, 3, 1–15. [Google Scholar]
- Lucas, A. Single-Phase Power Injection Limit due to Voltage Unbalances Applied to an Urban Reference Network Using Real-Time Simulation. Appl. Sci. 2018, 8, 1333. [Google Scholar] [CrossRef]
- Ruiz-Rodriguez, F.J.; Hernandez, J.C.; Jurado, F. Voltage Unbalance Assessment in Secondary Radial Distribution Networks with Single-Phase Photovoltaic Systems. Electr. Power Energy Syst. 2015, 64, 646–654. [Google Scholar] [CrossRef]
- Pukhrem, S.; Basu, M.; Conlon, M.F. Probabilistic Risk Assessment of Power Quality Variations and Events Under Temporal and Spatial Characteristic of Increased PV Integration in Low-Voltage Distribution Networks. IEEE Trans. Power Syst. 2018, 33, 3246–3254. [Google Scholar] [CrossRef]
- Klonari, V.; Meersman, B.; Bozalakov, D.; Vandoorn, T.L.; Vandevelde, L.; Lobry, J.; Vallee, F. A Probabilistic Framework for Evaluating Voltage Unbalance Mitigation by Photovoltaic Inverters. Sustain. Energy Grids Netw. 2016, 8, 1–11. [Google Scholar] [CrossRef]
- El-Naggar, A.; Erlish, I. Control Approach of Three-Phase Grid Connected PV Inverters for Voltage Unbalance Mitigation in Low-Voltage Distribution Grids. IET Renew. Power Gener. 2016, 10, 1577–1586. [Google Scholar] [CrossRef]
- Haque, M.M.; Wolfs, P. A Review of High PV Penetrations in LV Distribution Networks: Present Status, Impacts and Mitigation Measures. Renew. Sustain. Energy Rev. 2016, 62, 1195–1208. [Google Scholar] [CrossRef]
- Available online: https://english.ey.gov.tw/News3/9E5540D592A5FECD/777fcee7-90db-4b72-9927-573eecf9ea9e (accessed on 13 April 2020).
- Morales, J.M.; Pineda, S.; Conejo, A.J.; Carrion, M. Scenario Reduction for Future Market Trading in Electricity Markets. IEEE Trans. Power Syst. 2009, 24, 878–888. [Google Scholar] [CrossRef]
- Kuska, N.G.; Heitsch, H.; Romisch, W. Scenario Reduction and Scenario Tree Construction for Power Management Problems. In Proceedings of the IEEE Bologna Power Tech Conference, Bologna, Italy, 23–26 June 2003; pp. 1–7. [Google Scholar]
- Long, C.; Ochoa, L.F. Voltage Control of PV-Rich LV Networks: OLTC-Fitted Transformer and Capacitor Banks. IEEE Trans. Power Syst. 2016, 31, 4016–4025. [Google Scholar] [CrossRef]
- Chen, T.H.; Cherng, J.T. Optimal Phase Arrangement of Distribution Transformers Connected to a Primary Feeder for System Unbalance Improvement and Loss Reduction Using a Genetic Algorithm. IEEE Trans. Power Syst. 2000, 15, 994–1000. [Google Scholar] [CrossRef]
- El-Sharkawi, M.A.; Eberhart, R.; Marks, R.J.; Jensen, C.; Da Silva, A.A.; Tomsovic, K. Tutorial on Evolutionary Techniques and Fuzzy Logic in Power Systems; IEEE Power and Energy Society: Piscataway, NJ, USA, 2000; pp. 5–11. [Google Scholar]
- Smith, J.C.; Hensley, G.; Ray, L. IEEE Recommended Practice for Monitoring Electric Power Quality. In IEEE Std 1159-1995; The Institute of Electrical and Electronics Engineers: New York, NY, USA, 1995. [Google Scholar]
Figure 1.
The stochastic analysis of the photovoltaic generation systems’ (PVGSs’) integration.
Figure 1.
The stochastic analysis of the photovoltaic generation systems’ (PVGSs’) integration.
Figure 2.
Five representative load profiles.
Figure 2.
Five representative load profiles.
Figure 3.
Five representative irradiance profiles.
Figure 3.
Five representative irradiance profiles.
Figure 4.
Stochastic model for the load profile.
Figure 4.
Stochastic model for the load profile.
Figure 5.
The proposed model to improve the system unbalance.
Figure 5.
The proposed model to improve the system unbalance.
Figure 6.
Six possible phase arrangements for three-phase connection.
Figure 6.
Six possible phase arrangements for three-phase connection.
Figure 7.
A simple feeder diagram.
Figure 7.
A simple feeder diagram.
Figure 8.
The gene’s representation of optimal transformer phase arrangement.
Figure 8.
The gene’s representation of optimal transformer phase arrangement.
Figure 9.
The optimal transformer phase arrangement method.
Figure 9.
The optimal transformer phase arrangement method.
Figure 10.
An actual distribution system of Taiwan Power Company.
Figure 10.
An actual distribution system of Taiwan Power Company.
Figure 11.
Voltage profile for the Extreme case 1 at 12:00 for penetration rate of 1.0.
Figure 11.
Voltage profile for the Extreme case 1 at 12:00 for penetration rate of 1.0.
Figure 12.
Unbalance results for different penetration rates of Extreme Case 1 (a) Maximal voltage unbalance (b) Unbalance current.
Figure 12.
Unbalance results for different penetration rates of Extreme Case 1 (a) Maximal voltage unbalance (b) Unbalance current.
Figure 13.
Unbalance results for different penetration rates of Extreme Case 1 after adopting on load tap changer (OLTC) (a) Maximal voltage unbalance (b) Unbalance current.
Figure 13.
Unbalance results for different penetration rates of Extreme Case 1 after adopting on load tap changer (OLTC) (a) Maximal voltage unbalance (b) Unbalance current.
Figure 14.
The converging process of Extreme Case 1 (a) The objective value (b) The MaxVU(With PV) and In(With PV).
Figure 14.
The converging process of Extreme Case 1 (a) The objective value (b) The MaxVU(With PV) and In(With PV).
Figure 15.
Unbalance results for different penetration rates of Extreme Case 1 after adopting OLTC and optimal phase arrangement (a) Maximal voltage unbalance (b) Unbalance current.
Figure 15.
Unbalance results for different penetration rates of Extreme Case 1 after adopting OLTC and optimal phase arrangement (a) Maximal voltage unbalance (b) Unbalance current.
Figure 16.
Unbalance results for different penetration rates of Extreme Case 2 (a) Maximal voltage unbalance (b) Unbalance current.
Figure 16.
Unbalance results for different penetration rates of Extreme Case 2 (a) Maximal voltage unbalance (b) Unbalance current.
Figure 17.
Unbalance results for different penetration rates of Extreme Case 2 after adopting OLTC and optimal phase arrangement (a) Maximal voltage unbalance (b) Unbalance current.
Figure 17.
Unbalance results for different penetration rates of Extreme Case 2 after adopting OLTC and optimal phase arrangement (a) Maximal voltage unbalance (b) Unbalance current.
Figure 18.
Unbalance results for different penetration rates of Extreme Case 3 (a) Maximal voltage unbalance (b) Unbalance current.
Figure 18.
Unbalance results for different penetration rates of Extreme Case 3 (a) Maximal voltage unbalance (b) Unbalance current.
Figure 19.
Unbalance results for different penetration rates of Extreme Case 3 after adopting OLTC and optimal phase arrangement (a) Maximal voltage unbalance (b) Unbalance current.
Figure 19.
Unbalance results for different penetration rates of Extreme Case 3 after adopting OLTC and optimal phase arrangement (a) Maximal voltage unbalance (b) Unbalance current.
Figure 20.
Unbalance results for the stochastic case (a) Stochastic results (b) After adopting OLTC.
Figure 20.
Unbalance results for the stochastic case (a) Stochastic results (b) After adopting OLTC.
Figure 21.
The converging process of the stochastic case (a) The objective value (b) The MaxVU(With PV) and In(With PV).
Figure 21.
The converging process of the stochastic case (a) The objective value (b) The MaxVU(With PV) and In(With PV).
Figure 22.
Stochastic results of the maximal voltage unbalance and maximal current unbalance after applying OLTC and optimal phase arrangement.
Figure 22.
Stochastic results of the maximal voltage unbalance and maximal current unbalance after applying OLTC and optimal phase arrangement.
© 2020 by the authors. Licensee MDPI, Basel, Switzerland. This article is an open access article distributed under the terms and conditions of the Creative Commons Attribution (CC BY) license (http://creativecommons.org/licenses/by/4.0/).
