Article

Validation and Numerical Sensitivity Study of Air Baffle Photovoltaic-Thermal Module

1
Renewable Energy Engineering Department, University of Science and Technology, Daejeon 34113, Korea
2
Natural Resources Canada, CanmetENERGY, Ottawa, ON KIA 1M1, Canada
3
Energy Efficiency and Materials Research Department, Korea Institute of Energy Research, Daejeon 34129, Korea
*
Author to whom correspondence should be addressed.
Energies 2020, 13(8), 1990; https://doi.org/10.3390/en13081990
Submission received: 3 March 2020 / Revised: 18 March 2020 / Accepted: 23 March 2020 / Published: 17 April 2020
(This article belongs to the Special Issue Solar Thermal Energy Conversion and Storage)

Abstract

:
Photovoltaic-Thermal (PVT) is a type of technology that generates electricity and heat simultaneously at the point of use. The generated electricity could be used on site or exported to the grid while the thermal output could be utilized for space and water heating. There is a lot of research for solar air heating with experiment or CFD (Computational Fluid Dynamics), but CFD has the disadvantage that it would indicate impractical results. In this paper, a numerical PVT baseline model was developed and validated with Separate Effect Test (SET) data to increase reliability. The numerical study was conducted by considering the effect of baffle lengths and baffle slopes on outlet temperature, total heat transfer and pressure drop inside PVT air module. An optimum PVT baffle length and slope design were suggested. The baseline numerical PVT model agreed well with the test data set as indicated by 1.25% error for inlet–outlet temperatures difference. The sensitivity study was conducted by changing the PVT baffle length and slope. The optimum baffle design was concerned with both heat transfer and pressure drop at the same time with ratio. The baffle length should be kept under 150 mm and baffle slope should be greater than 30° to achieve better air mixing in PVT air channel and unit heat transfer compared to baffle slope less than 30°.

1. Introduction

The Korean government’s energy policies RE3020 call for 20% penetration of renewable energy by 2030 and the introduction of zero net buildings energy policy for the public sector from 2020 and for the private sector from 2025. In order to reach these goals in Korea a variety of renewable technologies need to be introduced and employed. Photovoltaic-Thermal (PVT) is one of these technologies that generates electricity and heat simultaneously at the point of use. The generated electricity could be used on site or exported to the grid while the heat could be utilized for space and water heating. Air based PVT system has an advantage in comparison to the water PVT system due to its lower initial capital cost and avoidance of operational issues such as fluid leakage and freezing. There are many experimental and CFD simulation studies aimed to increase PVT thermal performance and efficiency in order to contribute to government policy or environmental issues.
In experimental study, Sandenes et al. [1] compared the performance of conventional and polymer PVT absorber and analyzed PV cell cooling effect. Wei He et al. [2] developed a natural convection model in PVT system and compared it to a conventional solar thermosiphon system. Akpinar and Koçyiğit [3] conducted an experimental study on the effect of three different types of obstacles on the flat plate solar air heater performance and determined the best obstacle type for the solar heater. Tanda [4] studied the performance of rib-roughened channels in terms of heat transfer and friction factor in a solar air heater. Three different rib configurations were considered. The experimental results demonstrated that all rib configurations are better than the smooth reference channel. Herrando et al. [5] investigated PVT-heat pump system performance using typical UK dwelling electricity and hot water demand profile and compared to conventional heating system. Tina et al. [6] tested a PV and PVT twin system test for investigation of PV cell temperature effect on electricity production. Gagliano et al. [7] conducted a comparison study of PVT solar heating system experiment and TRNSYS simulation, and the study presented 12.04% and 5.29% error for thermal and electrical energy respectively.
In numerical study, Florschuetz et al. [8] performed a theoretical analysis using modified hottel whillier model. Wang et al. [9] studied the performance of a new flat plate solar collector with corrugated upward and flat downward surfaces. They obtained optimum values for important design parameters such as tilt angle, mass flow rate and air gap. In another study, Jin et al. [10,11] investigated the effect of v-shaped ribs on the flow characteristic and heat transfer of a solar air heater. They studied the effect of different ribs geometry, rib pitch and relative rib height as well the angle of attack with different Reynolds numbers. They also suggested a configuration for optimal solar air heater thermal performance. Kheifa et al. [12] studied rectangular duct type CFD modeling concerned absorber to fluid heat transfer and PVT performance using a three-dimensional simulation. They investigated the effect of rib height, pitch, and attack angle for different Reynolds numbers. The simulation results indicated that the staggered multiple V-shaped ribs provide maximum enhancement for average Nusselt number.
Numerical model performance would indicate impractical result. The numerical study needs experiment validation to make the research result more reliable. In numerical study and experiment validation, Manjunath et al. [13] investigated the effect of spherical turbulence generator on the efficiency of a solar air heater. They conducted simulations with various Reynolds numbers, sphere diameters and relative roughness pitch. Their results indicated that the thermal efficiency increases exponentially with an increase of sphere diameter and a decrease of relative roughness pitch. Guar et al. [14] investigated comparison of conventional working fluid and Phase Changing Material working fluid type PVT numerical model and the experiment result that PV electric efficiency indicated 15.4% and 16.3% in summer and 16.9% and 16.5% in winter respectively. Ayadi et al. [15,16] studied the solar collector turbulent CFD model for solar chimney power plant and validated it with experiment.
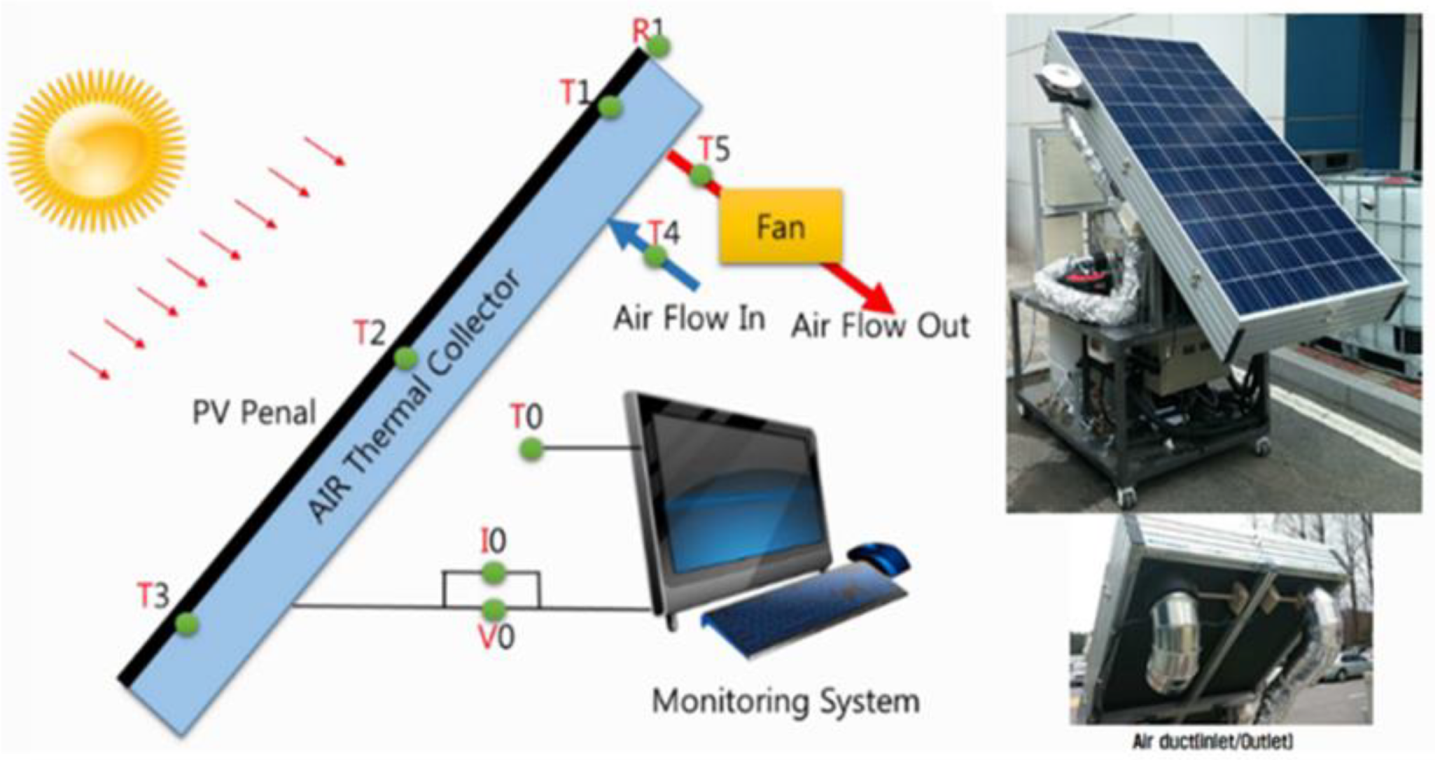
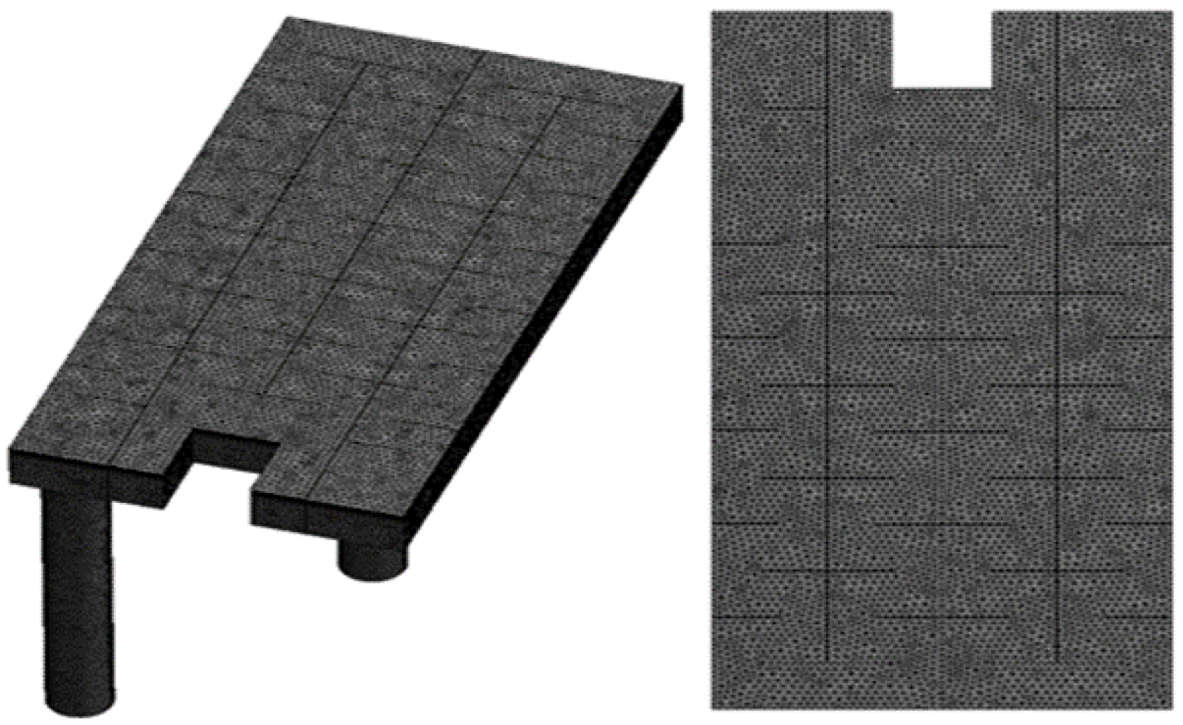
The present study focuses on investigating heat transfer coefficient and increasing the efficiency of solar collector with a design of PVT focusing on increasing thermal efficiency even though pressure drop increases Fan and pump power consumption changes relating to collector pressure drop proportionally. In this paper, to increase thermal performance of PVT with low-pressure drop, a numerical baseline PVT model validation study was conducted based on Separate Effect Test (SET) data. The validation is important to prevent imprudent mesh and boundary model design and to increase reliability of baffle sensitivity study. The numerical study was conducted considering the sensitivity of baffle lengths and baffle slope on outlet temperature, total heat transfer and pressure drop inside the PVT air module, and optimum baffle lengths and slope design were suggested.

2. Materials and Methods

A PVT performance test rig was designed according to ISO 9806 2013 [17] and setup at KIER (Korea Institute of Energy Research) Daejon (36.32 N, 127.42 E) city, South Korea. The PVT panels were installed to face south with 35° installation angle from the horizontal.

PVT Design and Test Set Up

An irradiation meter was installed on the PVT modules parallel to the PVT surface. J-type thermocouples used to measure PVT surface temperatures and RTD sensors to measure ambient (inlet) and outlet duct temperatures. Each sensor had measurement uncertainty within the limits of ISO 9806 and data were collected and recorded every second. The PVT test rig diagram is presented in Figure 1.
Figure 2 shows PVT air baffle design and configuration. The baffle is designed as open type, using ambient air as inlet air. Aluminum material is used for baffle case and baffles and polyethylene for PVT insulation. PVT air baffle detail information is presented in Table 1 and ISO standard sensor uncertainty is presented in Table 2.
The PVT geometry was created in CAD software and imported as an ANSYS workbench 16 file. Tetrahedral mesh was used for all geometries and baffle arrangements. Total number of mesh nodes in this study was close to 600 k and Figure 3 is a demonstration of mesh modeling. The k-ε model was used for simulation of the turbulent flow and heat transfer. The model governing equations for continuity, momentum and energy are as follows [18,19,20,21]:
u ¯ i x i = 0
ρ u ¯ j ( u ¯ i x j ) = p x i + μ x j ( u ¯ i x j ) x j ( ρ u ¯ i u ¯ j )
u ¯ i T ¯ x i = k ρ c p x j ( T ¯ x i ) x i ( u i i ¯ T ¯ )
The Reynolds stress, ρ u ¯ i u j ¯ could be calculated using Equation (4):
ρ u ¯ i u j ¯ = ( u ¯ i x j + u ¯ j x i ) 2 3 ( ρ k + μ t u k ¯ x k ) δ i j
The turbulence kinetic energy and dissipation rate are described by the following equations:
( ρ u ¯ i k ) = x j [ ( μ + μ t σ k ) k x j ] ρ u i ¯ u j ¯ u j ¯ x i ρ ε
( ρ u ¯ i ε ) = x j [ ( μ + μ t σ s ) ε x j ] c 2 ε ρ ε 2 k c 1 ε ε k ( ρ u i ¯ u j ¯ u i ¯ x i )
The turbulence kinetic energy and dissipation rate are calculated using the formula ( μ t = ρ c μ k 2 / ε ) with the following model constants:
c 1 ε = 1.44 ,   c 2 ε = 1.92 ,   c μ = 0.09 ,   σ k = 1 ,   σ ε = 1.3
Heat flux boundary conditions are imposed on the PV module surface. A simplified energy balance on the surface of the PV module is used to calculate it as Heat flow entering the panel [W/m2] = Solar irradiation on panel surface [W/m2]-Convective losses [W/m2]–Long wave radiation losses [W/m2] [18,19,20,21]:
q = α G + ε σ ( T s k y 4 T s 4 ) h ( T s T a )
where σ is Stefan Botzmann coefficient 5.67 × 10 −8 W/m2 ··· K, Ta (K) is the ambient temperature, Ts (K) is the surface temperature, G is the total radiation perpendicular to the panel surface, α is the solar absorptivity, ε is the long wave emissivity. Sky temperature Tsky (K) is calculated according to [18,19,21,22,23,24]:
T s k y = 0.0552 T a 1.5 [ K ]
The convective heat transfer (h) coefficient was calculated using:
h G l a s s _ s u r f a c e = 5.7 + 3.8 V W [ W / ( m 2 · K ) ]
h O t h e r _ s u r f a c e = 2.8 + 3.0 V W [ W / ( m 2 · K ) ]
A User Define Function (UDF) was applied to the model with the heat flux corresponding to radiation and convection heat transfer on the PVT module surface. The sidewalls of the PVT are considered to be adiabatic. K-epsilon standard turbulence model was used with 5% default value of turbulence intensity. A simple algorithm was used to handle the velocity pressure coupling and the second order upwind scheme to discretize the governing transport equations. The convergence criteria were set to 10-6 for all of the governing equations.

3. Results

3.1. Experiment PVT Results

A PVT thermal performance SET was conducted outdoor from 10:00 to 16:00 with 160 m3/hr flow rate in KIER Deajon according to ISO 9806 test performance method. The data were recorded with 1-minute intervals and used for comparison and numerical validation. Table 3 presents the experimental conditions and the output of PVT baseline design. The PVT data was used to analyze over 700 W/m2 irradiances. The peak point data indicated 12.90 ℃ temperature difference and 37.33% PVT thermal efficiency and the average data indicated 10.46 ℃ temperature difference and 35.92% PVT efficiency. The efficiency is calculated by ratio of fluid inlet–outlet heat energy and irradiance:
η = ρ Q f l o w   C p ( T o u t T i n ) ˙ G · A

3.2. Baseline Numerical Model Results

The baseline numerical model uses k-ε model and constant radiation for boundary condition. The input values of baseline boundary conditions such as radiation, inlet temperature and flow rate are the same as the average experiment data. Table 4 presents the comparison results between experimental and numerical model data. The numerical baseline model results for outlet temperature and thermal efficiency presented good agreement with the experimental SET data. The numerical baseline PVT CFD post demonstrates in Figure 4.

3.3. Baffle Length Sensitivity Numerical Model Results

Numerical study has been conducted for four baffle lengths: 125 mm, 150 mm, 175 mm and 200 mm. As seen in Figure 5 the air outlet temperature (a) and the total unit heat transfer (b) increase exponentially with the baffle length growth from 125 to 200 mm. This is due to increased air path length allowing more heat to be extracted. Figure 5c demonstrates changes in pressure drop along the PVT air baffle from inlet to the outlet as pressure drop increases rapidly with baffle length longer than 175 mm. This clearly indicates that the baffle length should be kept under 175 mm due to increase pressure drop. The results indicated that pressure drop would increase as much as air path geometry being complicated configuration.
Figure 6 demonstrates the temperature contours for different PVT baffle lengths. The temperature contours confirm that the air temperature increases with the length of the baffle from 125 mm to 200 mm. The temperature contours also indicate that the temperature distribution becomes uniform with the length of the baffle due to increased air path length and contract area.
Figure 7 demonstrates the streamlines inside the PVT. As seen from the figure, the size of the vortices increases with the baffle length. With the increase of vortice size between the baffles, the air mixing strength of vortices increases, leading to a more uniform temperature distribution in the PVT but also higher pressure drop. In between baffle length 175 and 200 mm, the vortices’ size increased which indicated baffle length longer than 175 mm, causing dramatic pressure drop and fan power consumption. The white spaces in Figure 7 mean a very close flow field to the streamline. The enhanced air mixing also explains and supports the increase in outlet temperatures with growth baffle length. The Table 5 present CFD simulation results depending on baffle length.

3.4. Baffle Angle Sensitivity Numerical Model Results

Figure 8 demonstrates the effect of different baffle length and slope on the air outlet temperature (a), total heat transfer (b) and pressure drop (c). As seen from the figure, both air outlet temperature and total heat transfer rate increase with the increase of baffle slopes. Figure 8c also demonstrates that both +30 and −30° baffle slopes have smaller pressure drops compared to the baseline model. This indicates the baffles with positive inclination slope providing higher heat transfer rate and lower pressure drop at the same time. The positive inclination slope baffle are recommended for optimal PVT design.
The contours of temperature distribution inside the PVT for baffle slopes of +30 and −30° and length of 125 mm and 150 mm are demonstrated in Figure 9. It can be noticed that the temperature distribution is more uniform for baffle slopes of +30°. The contours also demonstrate higher outlet temperatures for baffle length of 150 mm.
Figure 10 demonstrates the streamlines for different baffle slopes and lengths. The white space means a very close flow field to the streamline. As seen for the baffle slope of +30°, the vortices are moved towards the center of the channel contrary to the baffle slope of −30°, in which the vortices are more uniform at the corners of the baffles due to increased air path length and contact area, which also increase pressure drop because of positive slope angle acting obstacle. The existence of vortices at the center of the channel helps for better mixing of the main flow and enhances the heat transfer compared to the baffle slope of −30°. The Table 6 present CFD simulation results depending on baffle slope.

4. Discussion

The modelling and test results showed that the power consumption has a significant impact on the overall PVT system performance and should be considered in Heating and Ventilating and Air-Conditioning (HVAC) system design [25]. Even though solar air collector has high thermal performance, high fan power consumption would reduce energy saving in the overall system. However, fan power consumption is indirectly valued so ISO 9806 suggested to measure the pressure drop that is related to fan power consumption [17]. Bovand et al. [26] investigated numerical simulation of heat transfer enhancement and pressure drop penalty in porous solar heater with porous material. Balaji et al. [27] investigated heat transfer and pumping power of forced circulation flat plate solar collector with rod and heat transfer enhancer that presented maximum pumping power of 1.44 and 1.26 respectively higher than plane tube.
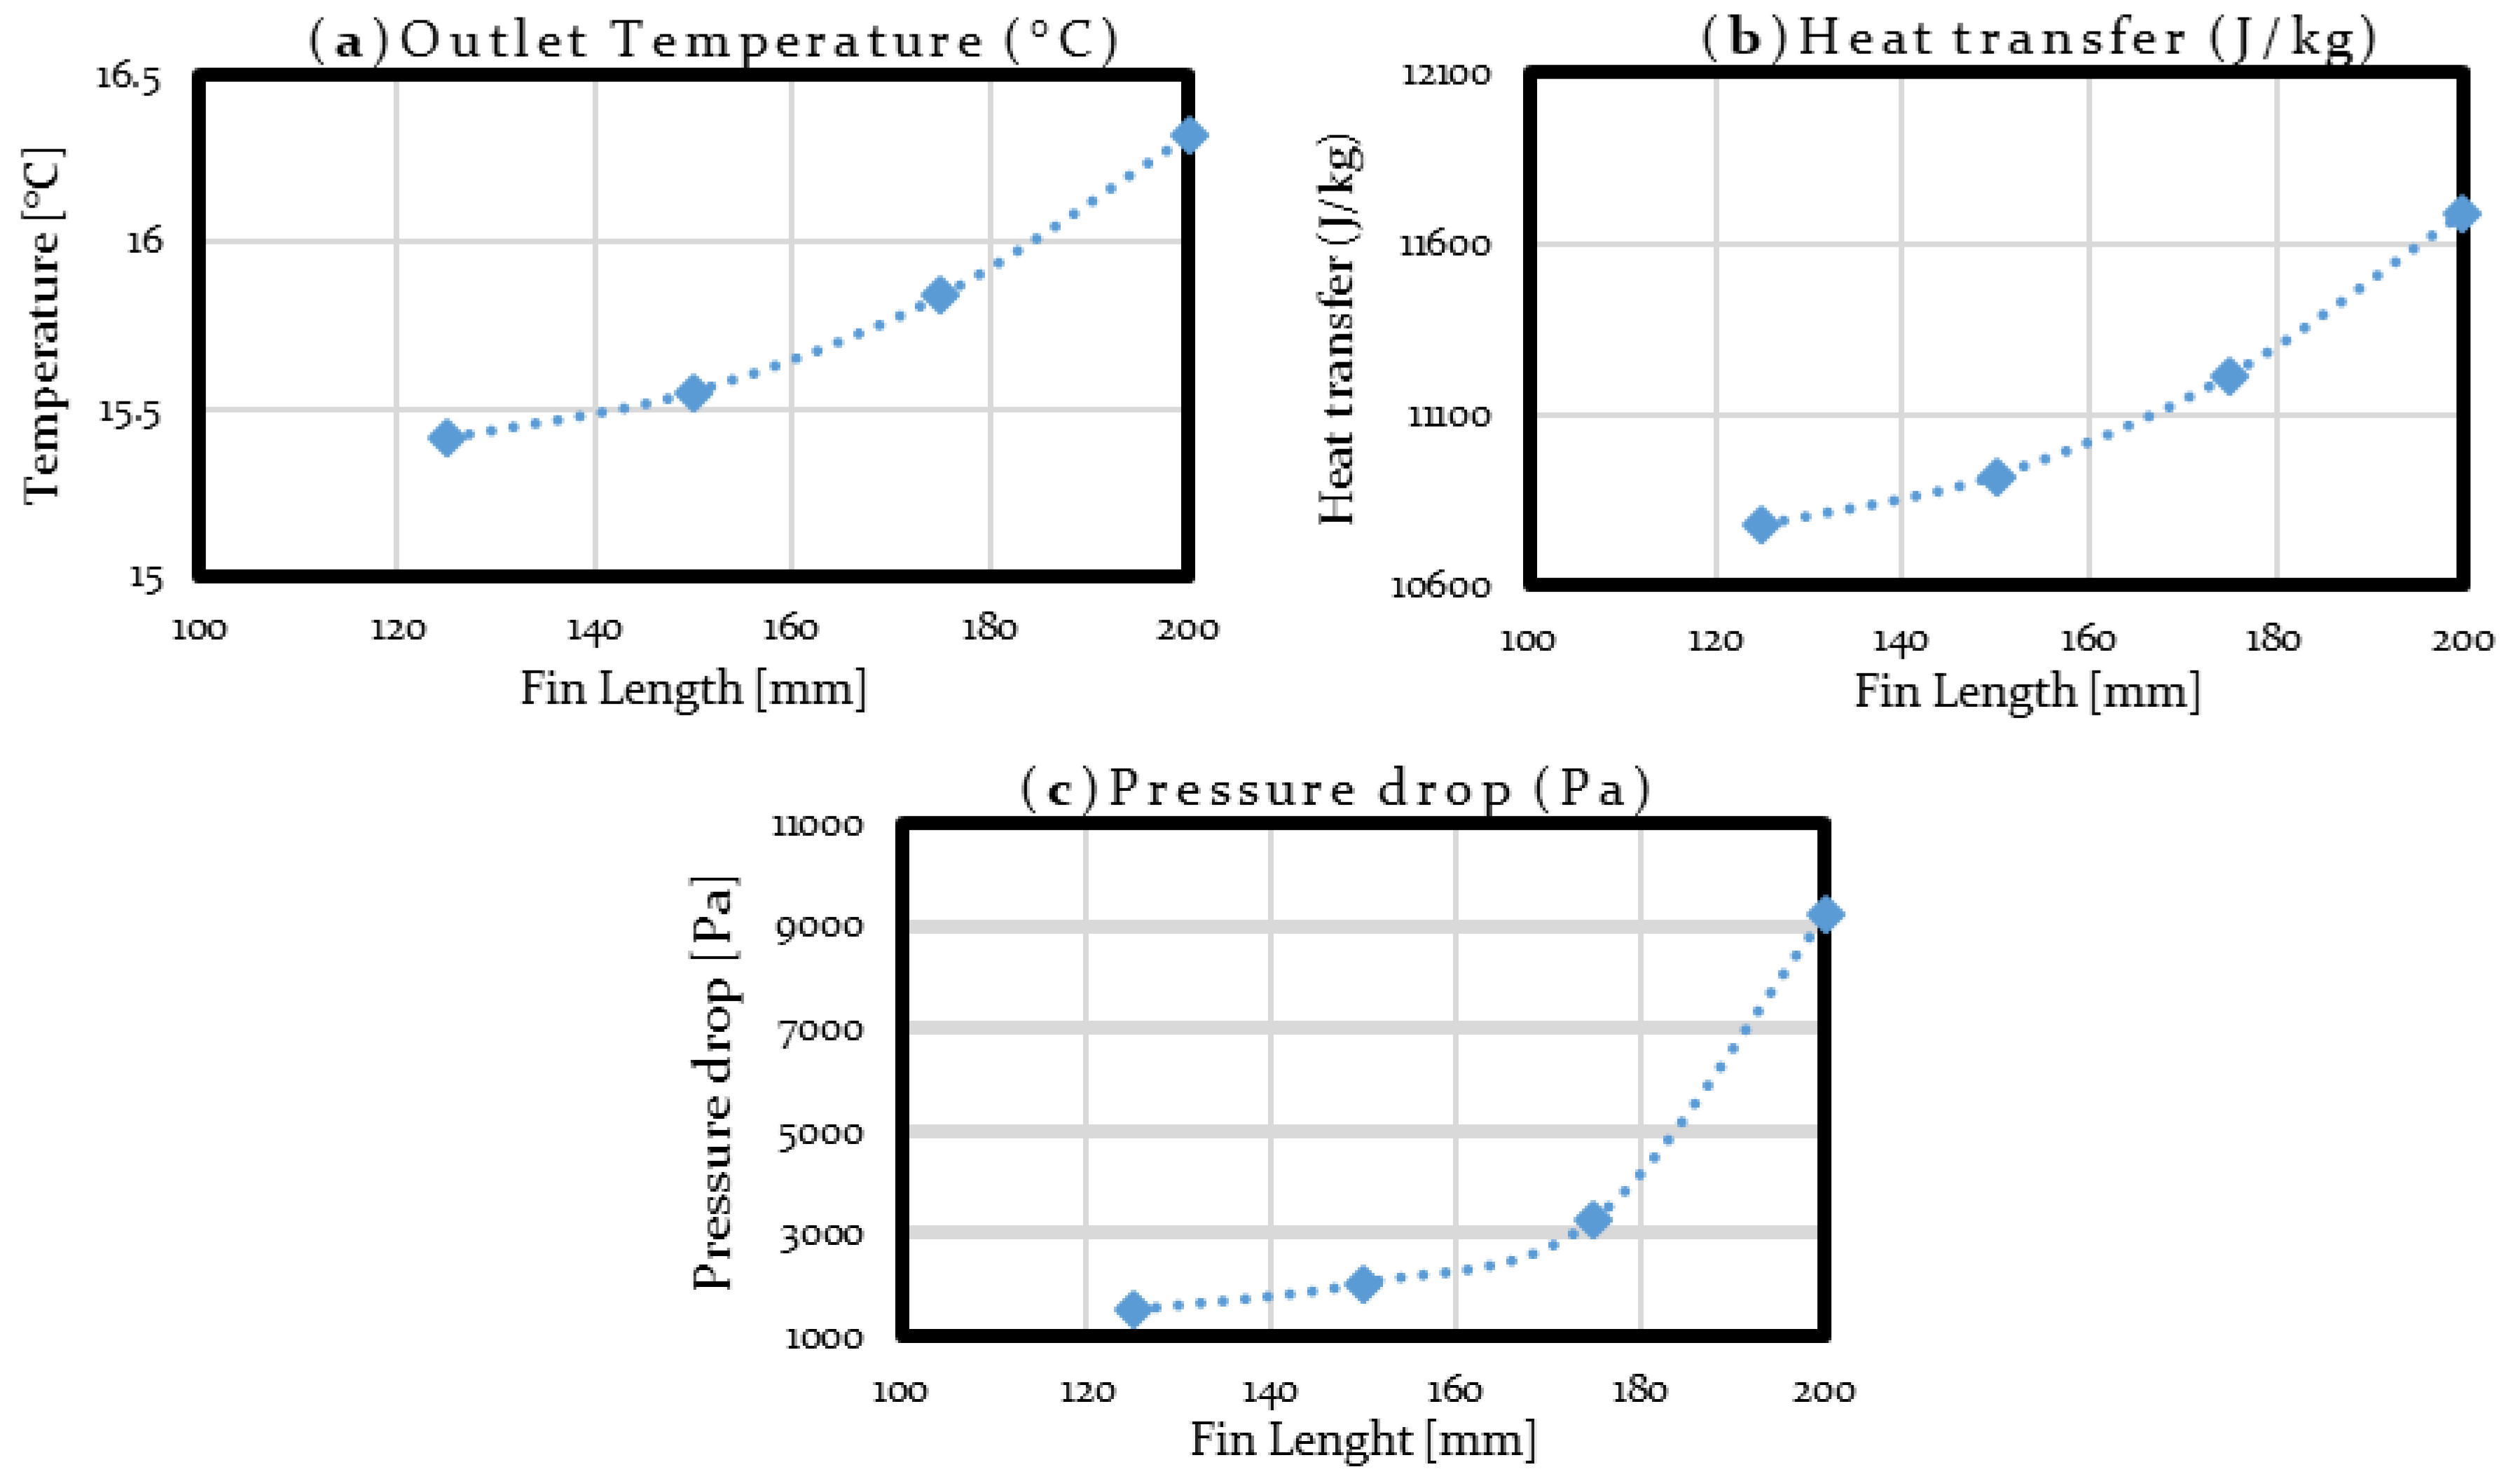
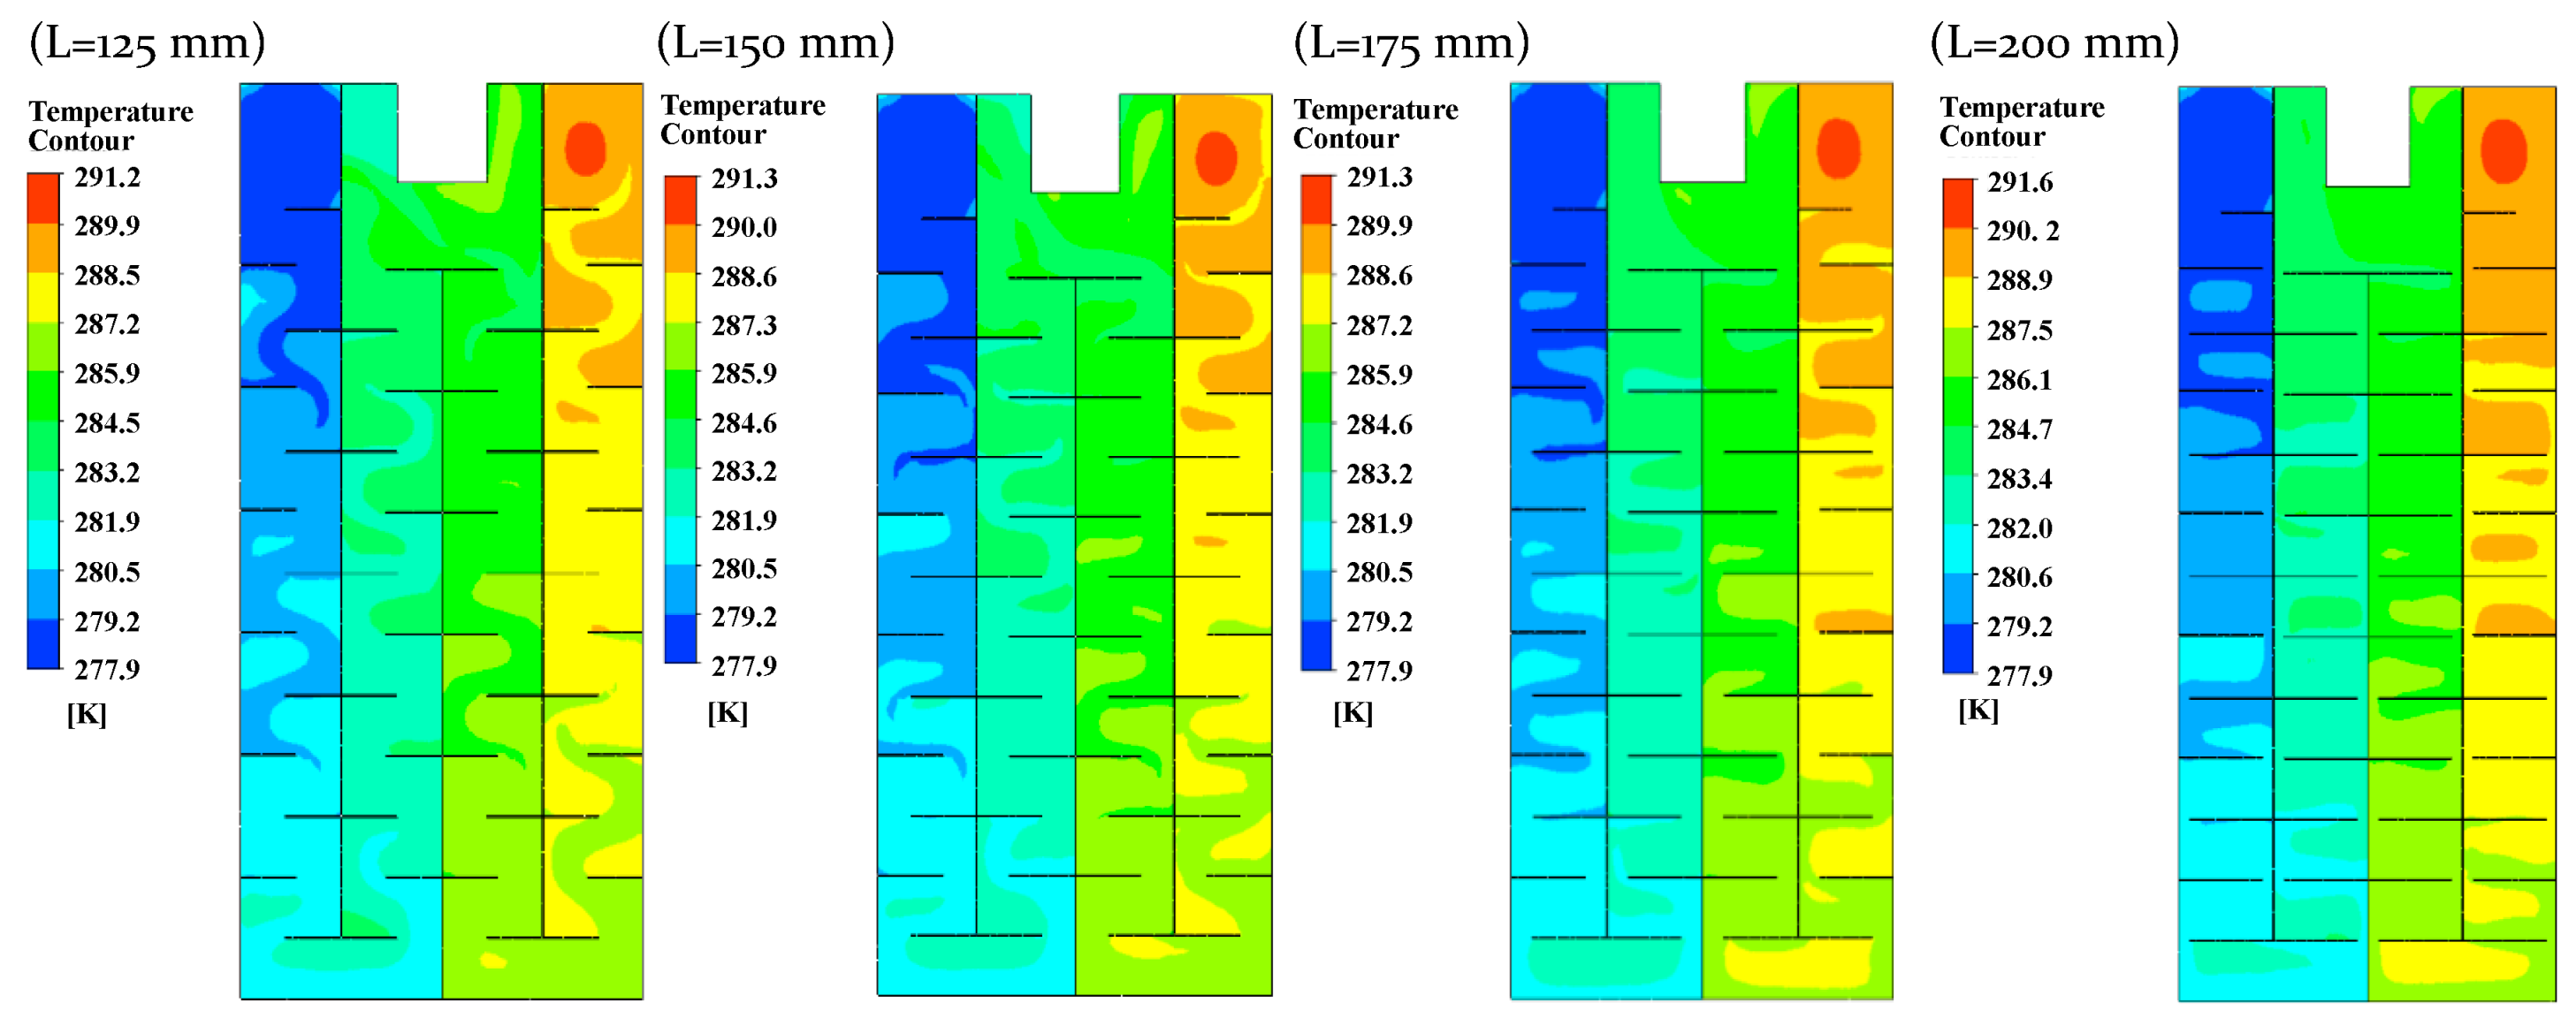
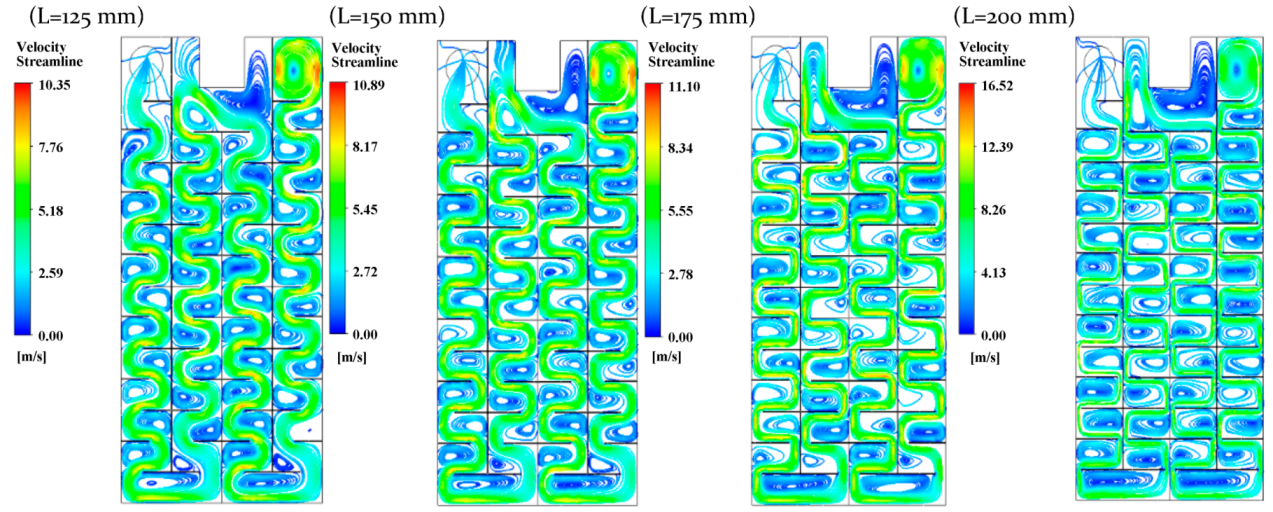
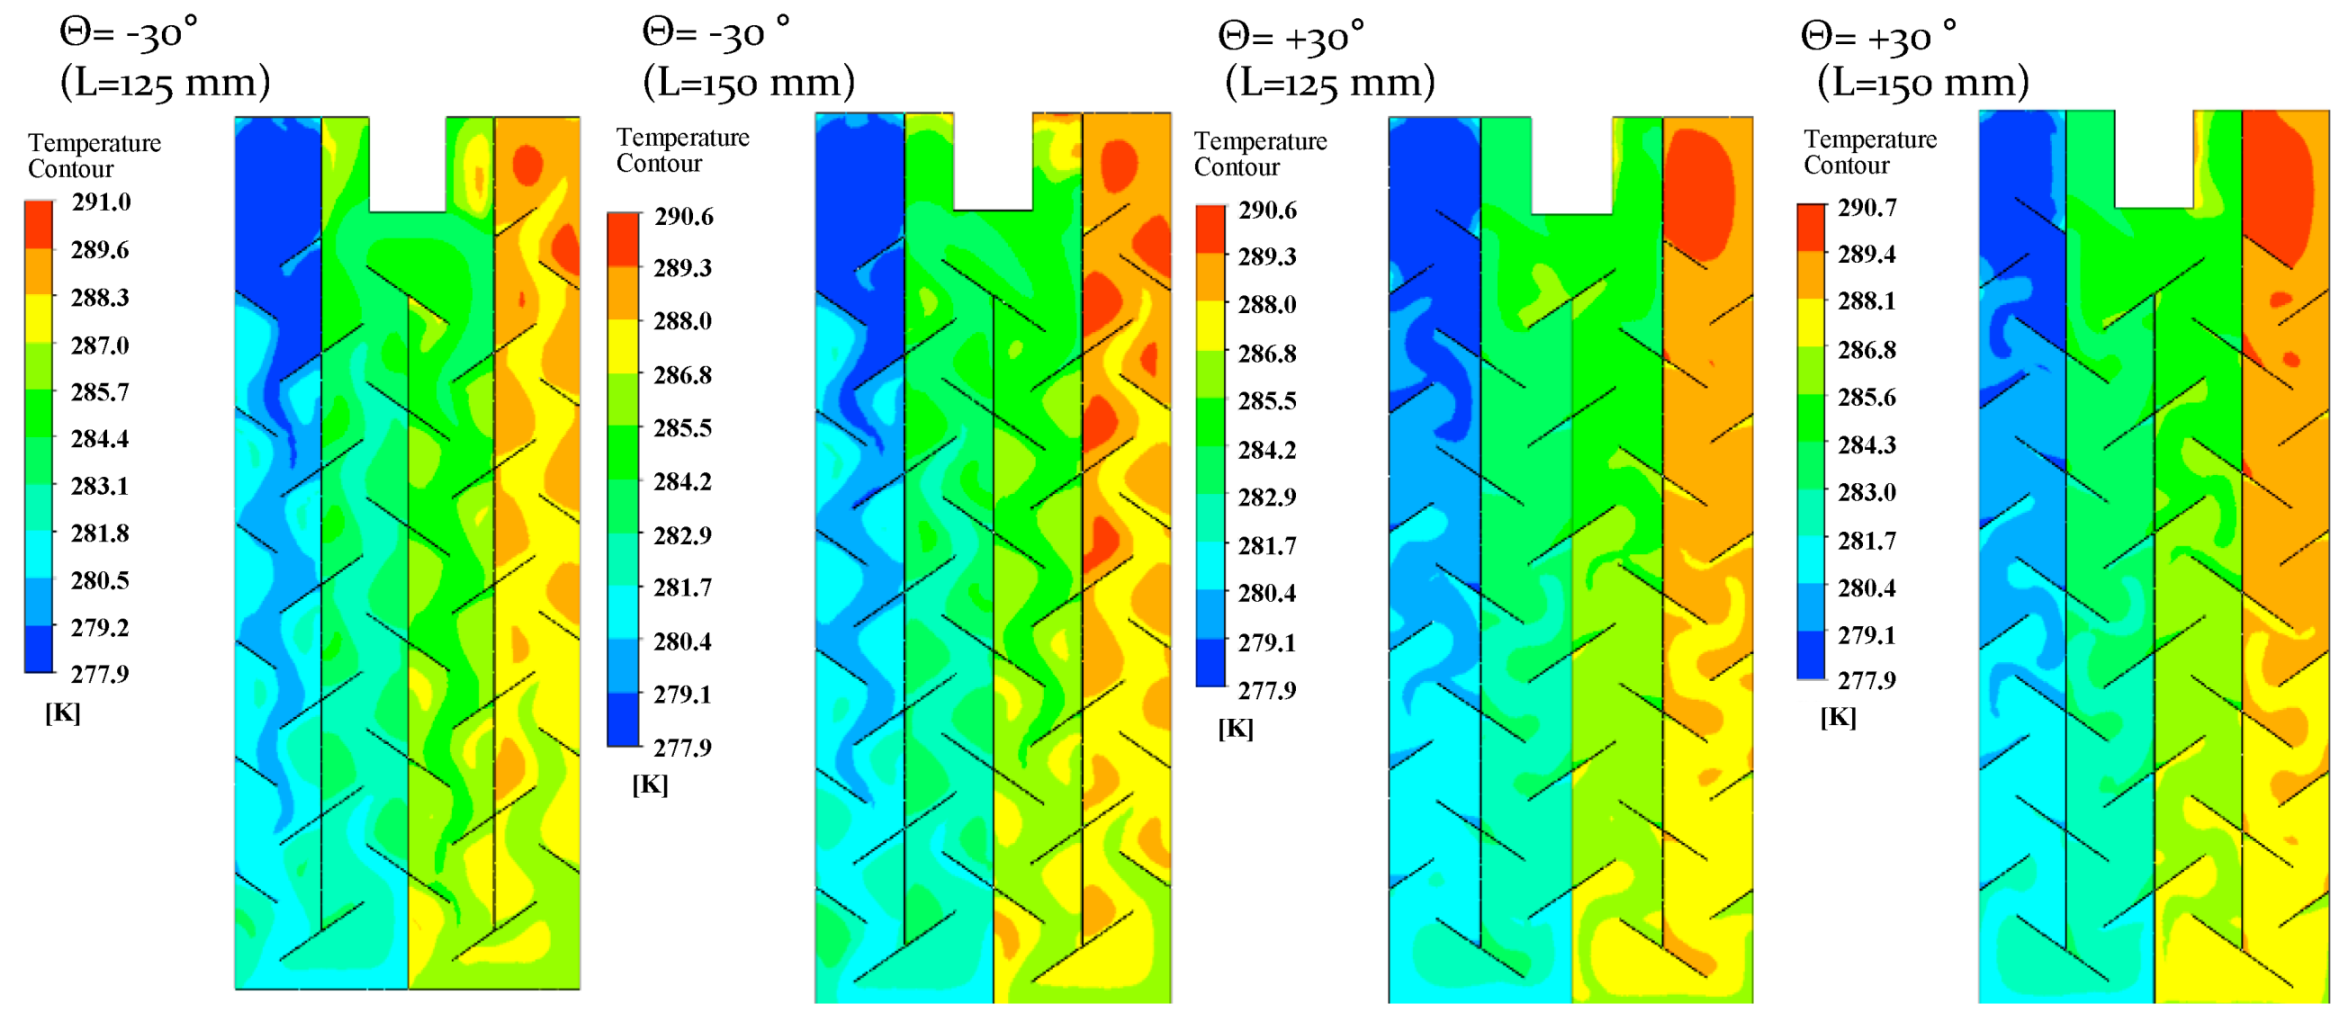
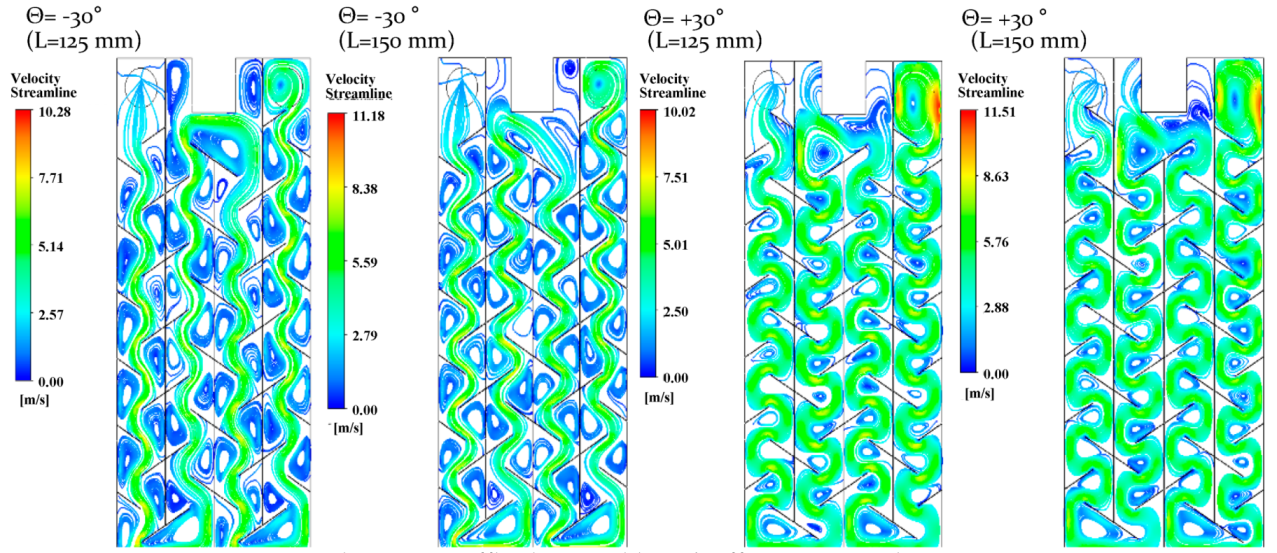
As seen from the results in Section 3.3 and 
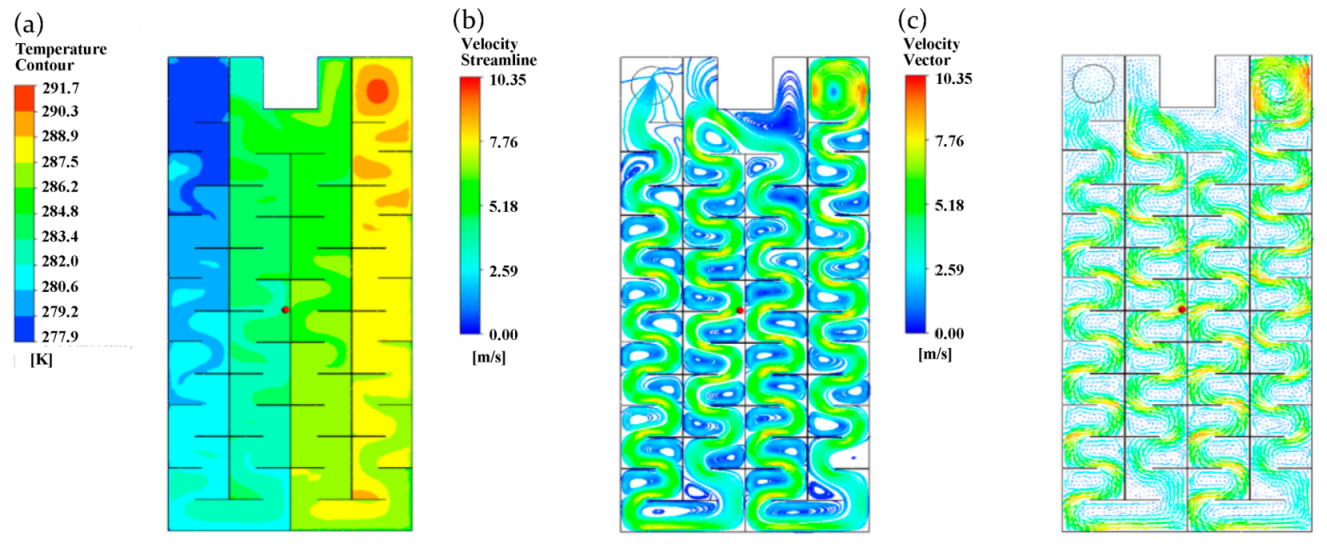
Section 3.4, baffle length and slope influence heat transfer and pressure drop. For optimal air channel design, heat transfer and pressure drop need to be considered at the same time. As shown in 
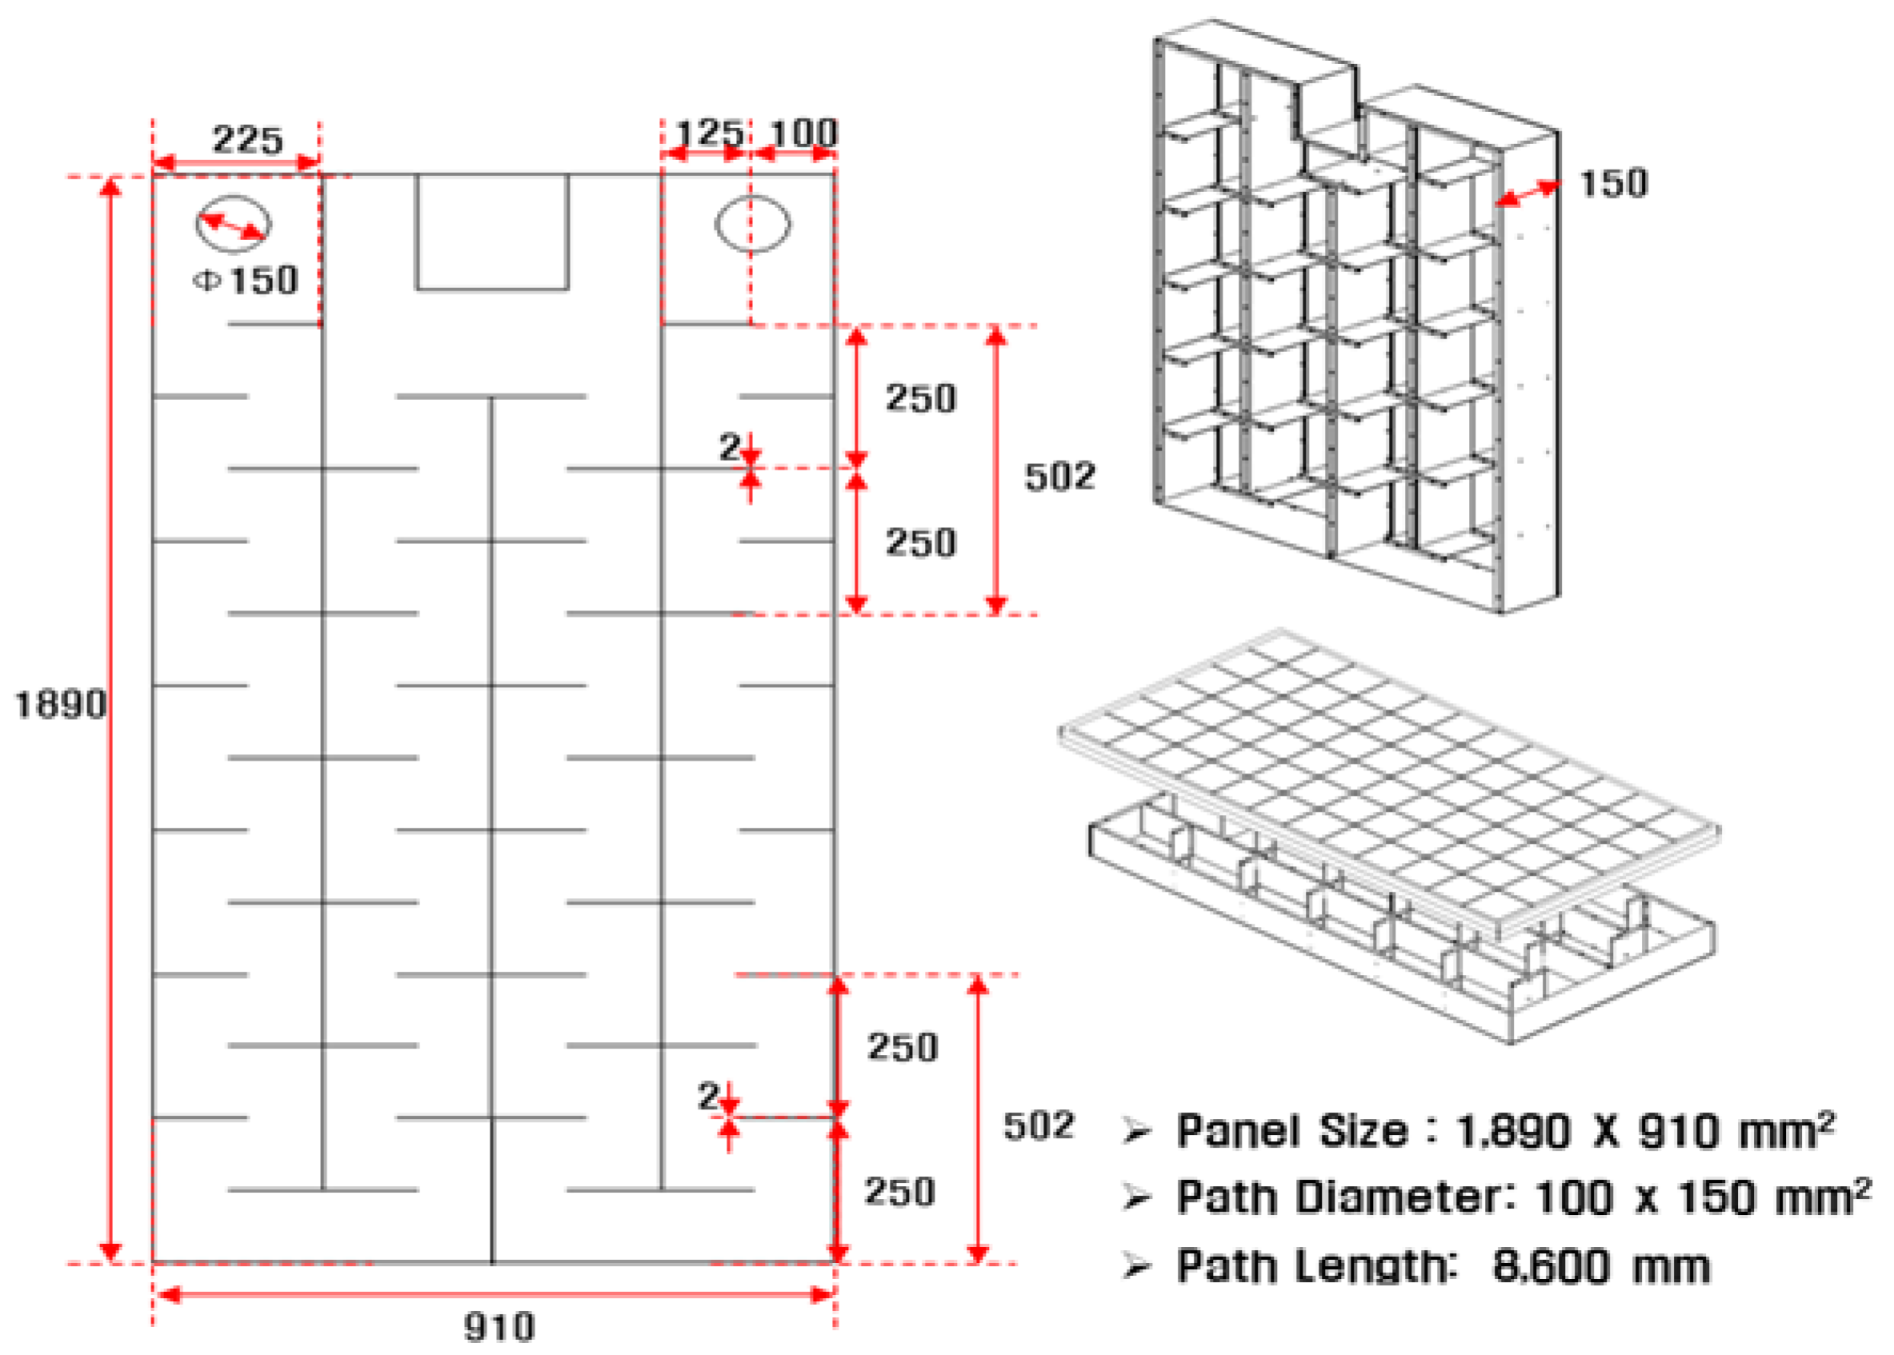
Table 7, the pressure drop and inlet to outlet temperature difference ratio increase exponentially with the baffle length growth from 125 to 200 mm. The pressure drop and temperature difference ratio rapidly increase from 150 to 175 mm, which indicates baffle length should be kept under 150 mm. 
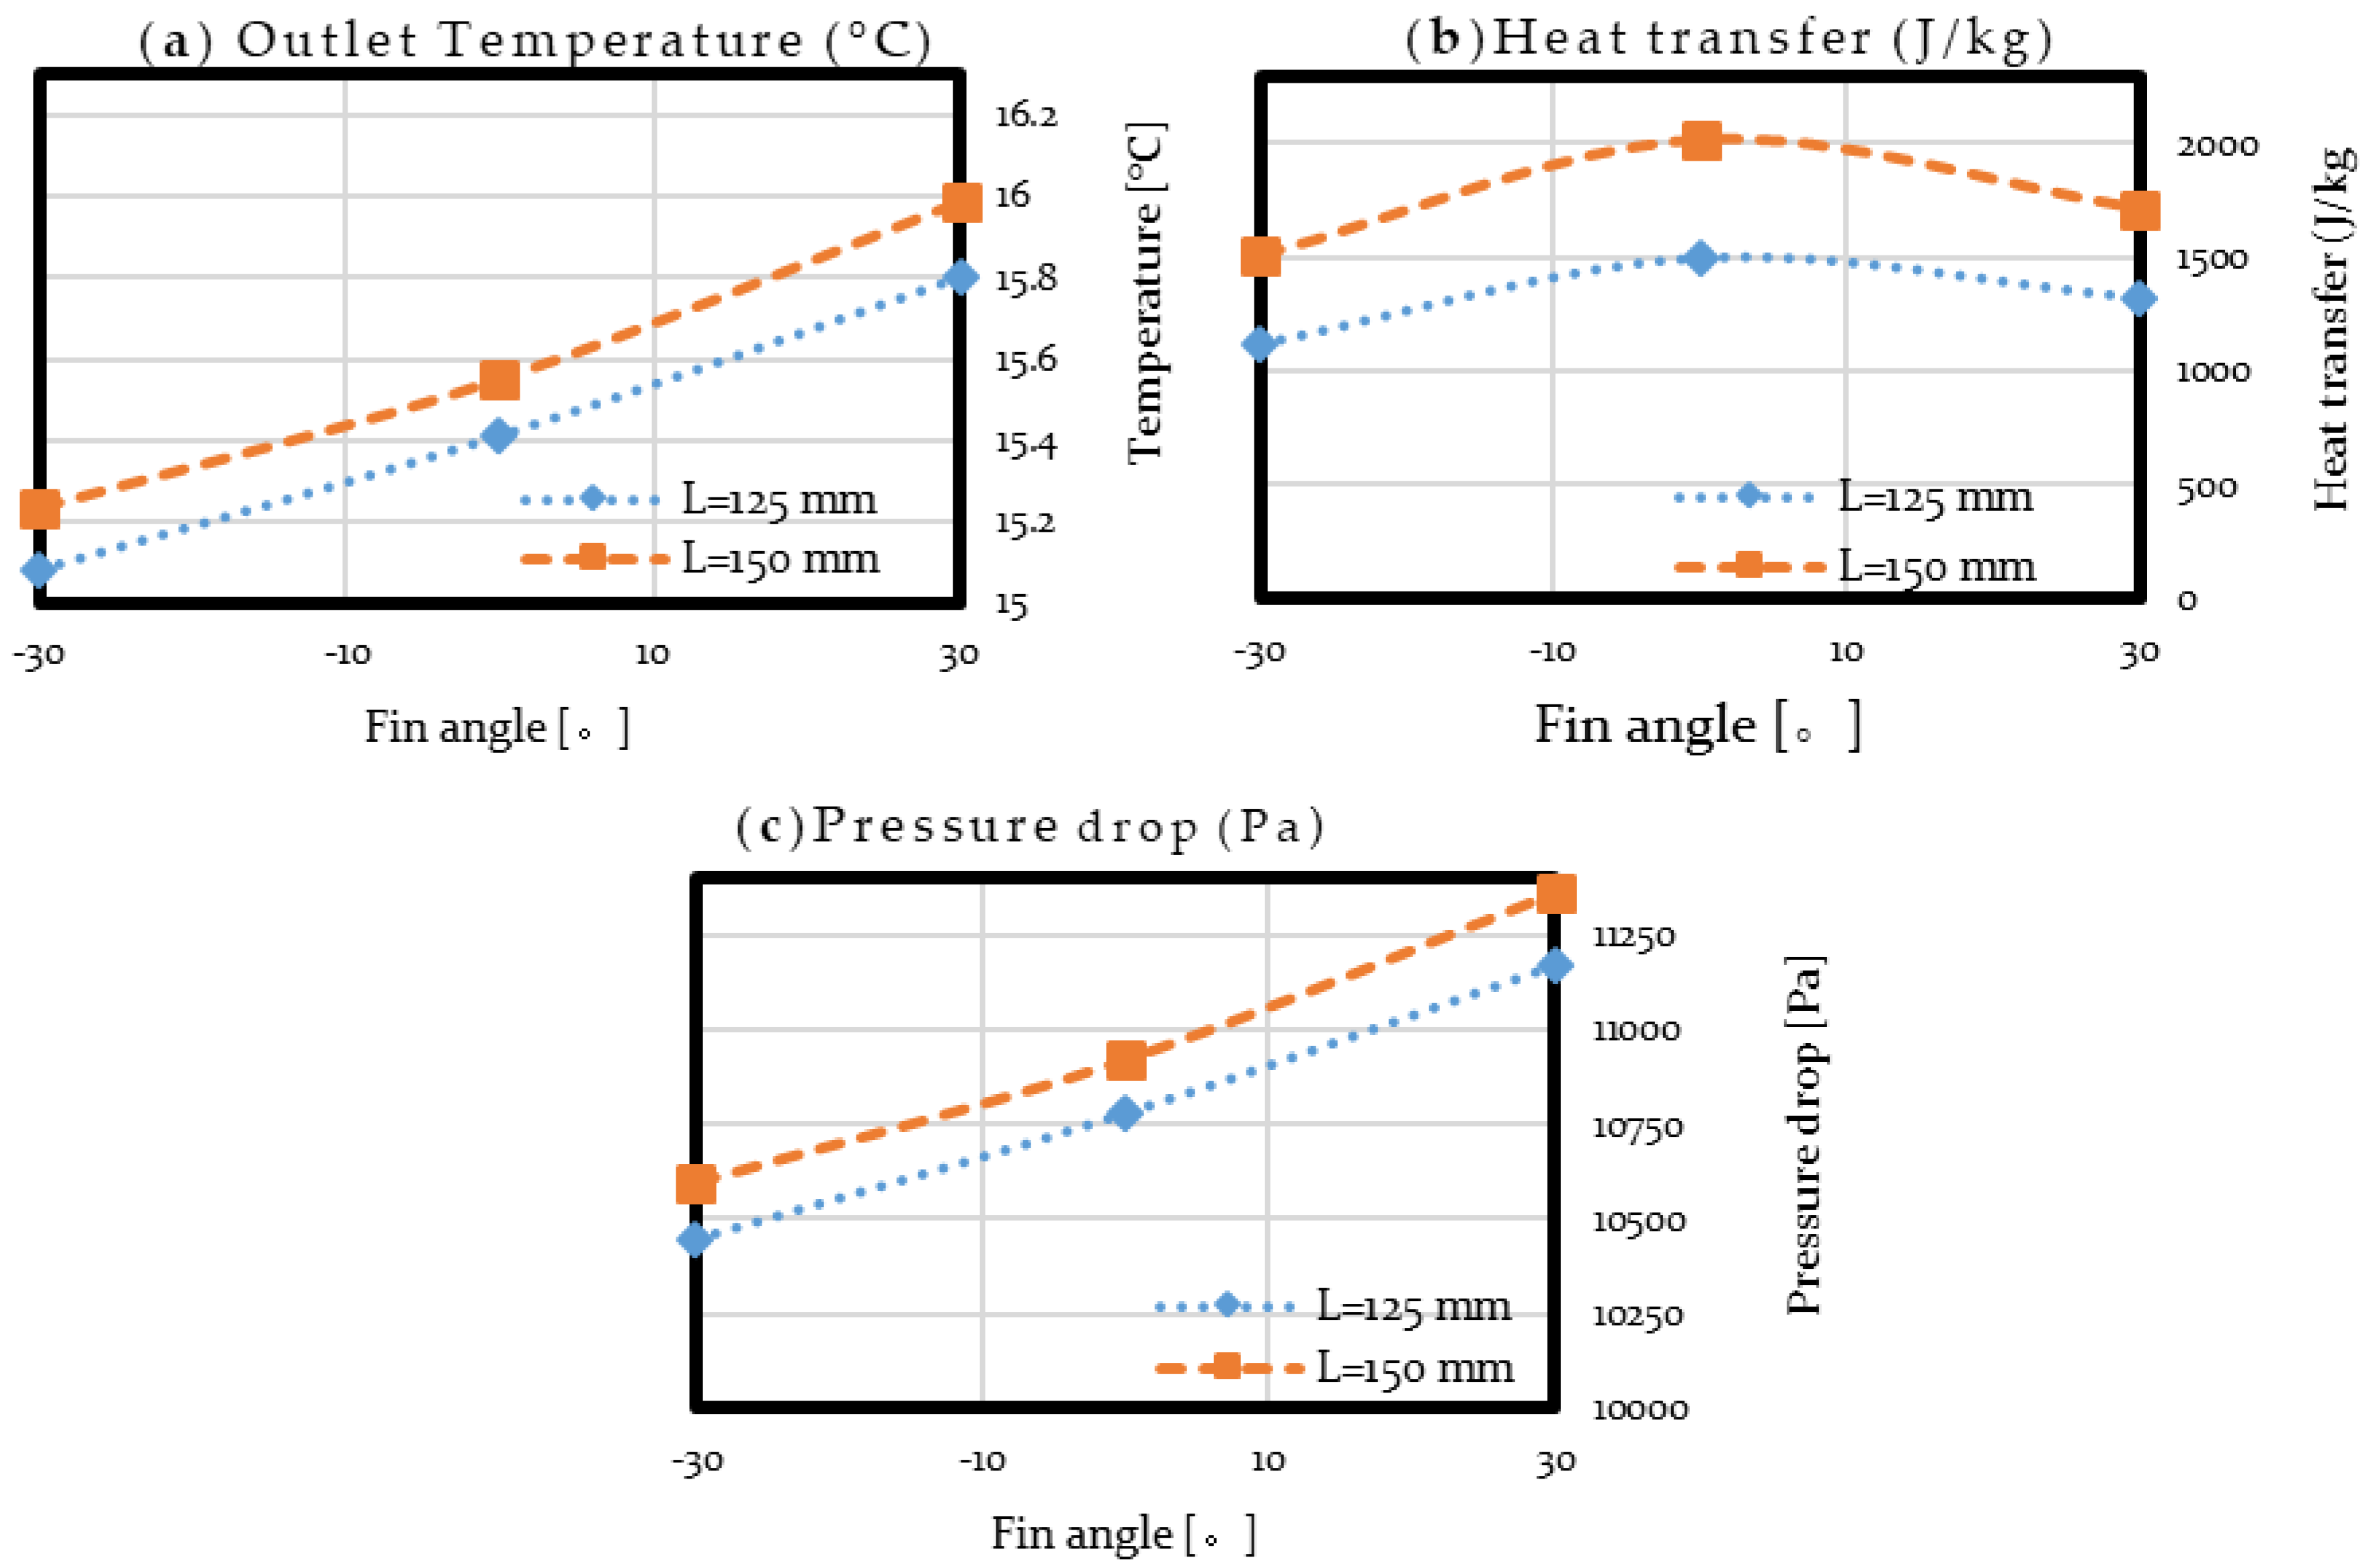
Table 8 presents the ratio change depending on baffle length and slope. Base slope 0° presented highest ratio and slope −30° presented lowest ratio but not much lower than +30°.

5. Conclusions

The PVT thermal performance test SET was conducted at KIER Deajeon according to ISO 9806. The effects of different PVT baffle slopes and length on the air outlet temperature, total heat transfer and pressure drop were studied numerically. The heat flux on the surface of the absorber was calculated using energy balance equations and modelled in ANSYS Fluent 16 CFD simulation platform. The following conclusions can be drawn:
  • A numerical PVT model was developed and validated with experimental SET data. The baseline numerical PVT model agrees well with the test data with 1.25% error in inlet–outlet temperatures.
  • A numerical study was conducted to investigate the baffle length and baffle slope effect on outlet temperature, total heat transfer and pressure drop inside the PVT air module. It was found that the outlet temperatures and heat transfer increase with the baffle length, and pressure drop increases rapidly with baffle length greater than 175 mm. Baffle slope of −30° moves the vortices toward the center of the channels contrary to baffle slope +30°; this helps for better mixing of the main stream flow and enhances the heat transfer rate.
  • Optimal baffle length and slope design were suggested. It was found that baffle length of 150 mm has the highest outlet temperature with least pressure drop in comparison to the 125 mm length. Baffle slope of −30° indicates a better air mixing in the PVT baffle and heat transfer compared to +30° baffle slope.

Author Contributions

Conceptualization, Y.-J.K., E.-J.L.; methodology, Y.-J.K.; validation, K.-S.L. and E.-C.K.; formal analysis, Y.-J.K., L.Y. and E.E.; investigation, K.-S.L. and E.-C.K. data curation, K.-S.L.; writing—original draft preparation, Y.-J.K.; writing—review and editing, L.Y., E.E. and E.-J.L. All authors have read and agreed to the published version of the manuscript.

Funding

This research was funded by the Korea Institute of Energy Technology Evaluation and Planning (KETEP) and the Ministry of Trade, Industry & Energy (MOTIE) of the Republic of Korea, grant number 20188550000430.

Acknowledgments

This work was supported by the Korea Institute of Energy Technology Evaluation and Planning(KETEP) and the Ministry of Trade, Industry & Energy(MOTIE) of the Republic of Korea (No. 20188550000430).

Conflicts of Interest

The authors declare no conflicts of interest.

Nomenclature

AAbsorber Area
CPSpecific heat
GTotal Irradiance
hGlass_surfaceGlass to ambient heat loss coefficient
hOther_surfaceOther surface to ambient heat loss coefficient
kThermal Conductivity
kabsAbsorber conductivity
PdropPressure Drop
qHeat Flux Irradiance
QflowFlow rate
TTemperature
TsSurface Temperature
TaAmbient Temperature
TinInlet Temperature
ToutOutlet Temperature
TskySky Temperature
∆TTemperature Difference
VwWind Velocity
αSolar absorptivity
εLong wave emissivity
ηThermal Efficiency
μWorking Fluid velocity
ρDensity
σStefan Boltzmann coefficient

References

  1. Sandnes, B.; Rekstad, J. A photovoltaic/thermal (PV/T) collector with a polymer absorber plate. Experimental study and analytical model. Sol. Energy 2002, 72, 63–73. [Google Scholar] [CrossRef]
  2. He, W.; Chow, T.T.; Ji, J.; Lu, J.; Pei, G. Chan Lok-shun Hybrid photovoltaic and thermal solar-collector designed for natural circulation of water. Appl. Energy 2006, 83, 199–210. [Google Scholar] [CrossRef]
  3. Akpınar, E.; Koçyigit, F. Experimental investigation of thermal performance of solar air heater having different obstacles on absorber plates. Int. Commun. Heat Mass Transf. 2010, 37, 416–421. [Google Scholar] [CrossRef]
  4. Tanda, G. Performance of solar air heater ducts with different types of ribs on the absorber plate. Energy 2011, 36, 6651–6660. [Google Scholar] [CrossRef]
  5. Herrando, C.N.; Markides, K.H. A UK-based assessment of hybrid PV and solar thermal system for domestic ehating and power: System performance. Appl. Energy 2014, 122, 288–309. [Google Scholar] [CrossRef] [Green Version]
  6. Tina, G.M.; Grasso, A.D.; Gagliano, A. Monitoring of solar cogenerative PVT power plants: Overview and a practical example. Sustain. Energy Technol. Assess. 2015, 10, 90–101. [Google Scholar] [CrossRef]
  7. Gagliano, A.; Tina, G.M.; Nocera, F.; Grasso, A.D.; Aneli, S. Description and performance analysis of a flexible photovoltaic/thermal (PV/T) solar system. Renew. Energy 2019, 137, 144–156. [Google Scholar] [CrossRef]
  8. Florschuetz, L. Extension of the Hottel-Whillier model to the analysis of combined photovoltaic/thermal flat plate collectors. Sol. Energy 1979, 22, 361–366. [Google Scholar] [CrossRef]
  9. Wang, N.; Zeng, S.; Zhou, M.; Wang, S. Numerical study of flat plate solar collector with novel heat, collecting components. Int. Commun. Heat Mass Transf. 2015, 69, 18–22. [Google Scholar] [CrossRef]
  10. Jin, D.; Zhang, M.; Wang, P.; Xu, S. Numerical investigation of heat transfer and fluid flow in a solar air, heater duct with multi V-shaped ribs on the absorber plate. Energy 2015, 89, 178–190. [Google Scholar] [CrossRef]
  11. Jin, D.; Zuo, J.; Quan, S.; Xu, S.; Gao, H. Thermo-hydraulic performance of solar air heater with staggered multiple V-shaped ribs on the absorber plate. Energy 2017, 127, 68–77. [Google Scholar] [CrossRef]
  12. Khelifa, A.; Touafek, K.; Ben Moussa, H.; Tabet, I.; Hocine, H.B.C.E.; Haloui, H. Analysis of a Hybrid Solar Collector Photovoltaic Thermal (PVT). Energy Procedia 2015, 74, 835–843. [Google Scholar] [CrossRef] [Green Version]
  13. Manjunath, M.; Karanth, K.V.; Sharma, N.Y. Numerical analysis of the influence of spherical turbulence generators on heat transfer enhancement of flat plate solar air heater. Energy 2017, 121, 616–630. [Google Scholar] [CrossRef]
  14. Gaur, A.; Ménézo, C.; Giroux--Julien, S. Numerical studies on thermal and electrical performance of a fully wetted absorber PVT collector with PCM as a storage medium. Renew. Energy 2017, 109, 168–187. [Google Scholar] [CrossRef]
  15. Ayadi, A.; Driss, Z.; Bouabidi, A.; Abid, M.S. Experimental and numerical study of the impact of the collector roof inclination on the performance of a solar chimney power plant. Energy Build. 2017, 139, 263–276. [Google Scholar] [CrossRef]
  16. Ayadi, A.; Nasraoui, H.; Bouabidi, A.; Driss, Z.; Bsisa, M.; Abid, M.S. Effect of the turbulence model on the simulation of the air flow in a solar chimney. Int. J. Therm. Sci. 2018, 130, 423–434. [Google Scholar] [CrossRef]
  17. International Organization for Standardization. International Standard ISO 9806 Solar Energy, Solar Thermal Collectors Test Methods; ISO: Geneva, Switzerland, 2013. [Google Scholar]
  18. Cengel, Y.A. Heat Transfer a Practical Approach, 2nd ed.; WCB/McGraw-Hill: New York, NY, USA, 2003; pp. 606–666. [Google Scholar]
  19. Duffie, J.A.; Bechman, W.A. Solar Enegineering of Thermal Processes, 4th ed.; Wiley-Interscience Publication: Hoboken, NJ, USA, 2013; pp. 138–172, 202–321. [Google Scholar]
  20. Aste, N.; Del Pero, C.; Leonforte, F.; Manfren, M. Performance monitoring and modeling of an uncovered photovoltaic-thermal (PVT) water collector. Sol. Energy 2016, 135, 551–568. [Google Scholar] [CrossRef]
  21. Swinbank, W.C. Long-wave radiation from clear skies. Q. J. R. Meteorol. Soc. 1963, 89, 339–348. [Google Scholar] [CrossRef]
  22. Mustafa, W.; Othman, M.Y.; Fudholi, A. Numerical investigation for performance study of photovoltaic thermal nanofluids system. Int. J. Appl. Eng. Res. 2017, 12, 14596–14602. [Google Scholar]
  23. Kumar, S.; Mullick, S. Wind heat transfer coefficient in solar collectors in outdoor conditions. Sol. Energy 2010, 84, 956–963. [Google Scholar] [CrossRef]
  24. Zhang, H.-F. Solar Thermal Principles and Computer Simulation; Northwestern Polytechnical University Press: Xi’an, China, 2004. [Google Scholar]
  25. Mcquiston, F.C.; Parker, J.D. Heating, Ventilating and Air Conditioning, 6th ed.; John Wiley & Sons, Inc.: Hoboken, NJ, USA, 2005; pp. 399–418. [Google Scholar]
  26. Bovand, M.; Rashidi, S.; Esfahani, J.A. Heat transfer enhancement and pressure drop penalty in porous solar heaters: Numerical simulations. Sol. Energy 2016, 123, 145–159. [Google Scholar] [CrossRef]
  27. Balaji, K.; Iniyan, S.; Muthusamyswami, V. Experimental investigation on heat transfer and pumping power of forced circulation flat plate solar collector using heat transfer enhancer in absorber tube. Appl. Therm. Eng. 2017, 112, 237–247. [Google Scholar] [CrossRef]
Figure 1. Photovoltaic-Thermal (PVT) performance test schematic diagram.
Energies 13 01990 g001
Figure 2. PVT air baffle baseline design information.
Energies 13 01990 g002
Figure 3. PVT air baffle mesh.
Energies 13 01990 g003
Figure 4. Baseline PVT air baffle CFD model valification. (a) Temperature contour; (b) Streamlines and (c) Velocity vectors.
Energies 13 01990 g004
Figure 5. Baffle length effect on (a) Outlet temperature; (b) Heat transfer and (c) Pressure drop.
Energies 13 01990 g005
Figure 6. Temperature contours of baffle lengths.
Energies 13 01990 g006
Figure 7. Streamlines of PVT depending on baffle length.
Energies 13 01990 g007
Figure 8. Effect of baffle slope and slope on (a) Outlet temperature; (b) Heat transfer and (c) Pressure drop.
Energies 13 01990 g008
Figure 9. Baffle slope and length effect on temperature contours.
Energies 13 01990 g009
Figure 10. Baffle slope and length effect on streamlines.
Energies 13 01990 g010
Table 1. PVT air material information.
Frame Material (Aluminum)Insulating Material (Polyethylen)
Kabs51 [W/m℃]
k202.4 [W/m-K]0.5 [W/m-K]
Thickness2 [mm]0.01 [m]
CP871 [J/kg-K]1880 [J/kg-K]
ρ2719 [kg/m3]975 [kg/m3]
Table 2. ISO 9806 standard sensor uncertainty.
-GTaTQflow
Uncertainty10 W/m20.5 K0.2 K2%
Table 3. Experiment data.
Test Condition (Outdoor)Test (Average Data)Test (Peak Data)
LocationDeajon, Korea
Data10 March 2016
G [W/m2]907.471077
Tin [℃]4.977.3
Tout [℃]15.4318.40
∆T [℃]10.4612.90
Qflow [m3/h]160160
η [%]35.9237.33
Table 4. Comparison of experiment and numerical results.
Heat Flux
G [W/m2]
Tin [℃]Tout [℃]∆T [℃]
Experimental907.474.9715.4310.46
Numerical907.474.9715.2410.27
Error [%]--1.231.25
Table 5. Baffle length sensitivity numerical results.
Baffle Length [mm]125150175200
Tout [°C]15.4115.5515.8416.32
∆T [°C]10.4410.5810.8711.35
Pdrop [Pa]1497.662021.713281.539214.91
Heat transfer [J/kg]10,776.8510,921.0911,215.9111,693.06
η [%]35.8536.3337.3338.98
Table 6. Baffle length sensitivity numerical results.
-Baffle Length [mm]Baffle Slope [°]
−30030
Tout [°C]12515.0815.4115.80
15015.2315.5515.99
∆T [°C]12510.1110.4410.83
15010.2610.5810.87
Pdrop [Pa]1251118.371497.661321.42
1501505.592021.711715.82
Heat transfer [J/kg]12510,444.1210,776.8511,167.8
15010,595.4110,921.0911,363.1
η [%]12534.7235.8537.19
15035.2336.3337.84
Table 7. Pressure drop and temperature difference ratio depending on length.
Baffle Length [mm]125150175200
Pdrop/∆T [Pa/°C]143.45191.09301.89811.89
Table 8. Pressure drop and temperature difference ratio depending on slope.
-Baffle Length [mm]Baffle Slope [°]
−30030
Pdrop/∆T [Pa/°C]125110.62143.45122.01
150146.74191.09157.85

