Article

Experimental Validation of a Low-Energy-Consumption Heating Model for Recirculating Aquaponic Systems

1
National Innovation Center for Digital Fishery, China Agricultural University, Beijing 100083, China
2
Beijing Engineering and Technology Research Center for the Internet of Things in Agriculture, China Agricultural University, Beijing 100083, China
3
College of Information and Electrical Engineering, China Agricultural University, Beijing 100083, China
4
Key Laboratory of Agricultural Information Acquisition Technology, Ministry of Agriculture, China Agricultural University, Beijing 100083, China
5
Department of Electronics, Nam Dinh University of Technology Education, Nam Dinh 07000, Vietnam
*
Author to whom correspondence should be addressed.
Energies 2020, 13(8), 1958; https://doi.org/10.3390/en13081958
Submission received: 9 March 2020 / Revised: 4 April 2020 / Accepted: 7 April 2020 / Published: 16 April 2020
(This article belongs to the Section B: Energy and Environment)

Abstract

:
Electrical energy is the highest energetic cost in recirculation aquaponic systems (RASs), especially for fish-tank water. Therefore, reducing energy consumption is one of the challenges in developing RAS models. In this study, eleven experimental setups, based on numerical models from an earlier investigator, were built to investigate. Among them, three additional cases (cases 9–11) investigated the transient discharging energy efficiency of thermal energy storage (TES). Cases 9–11 considered three temperature levels, namely, 65–75 °C, 71–81 °C, and 81–87 °C, with a mass flow rate of 0.166 kg/s. The results show that when heating 3.4 m3 of fish tank water from 24.5 °C to 28 °C, the average temperature error of the tank water was between 1.2% and 3.4%. The difference in the heat transfer rate was within ±4.2%. The error in the thermal efficiency was below 8.0%. The error range of the total required thermal energy was from 6.4% to 11.5%. Cases 9–11 used 5.6%, 6.4%, and 7.2% of the thermal energy of the TES tank, respectively. The electrical energy consumption was low compared to the thermal energy of the fish tank water received from the TES unit. Therefore, the proposed low-energy-consumption heating method can replace electric heaters.

Graphical Abstract

1. Introduction

Optimal recirculating aquaponic systems (RASs) have the potential to significantly reduce the use of water and land resources and increase environmental and economic feasibility for food production [1,2,3,4,5,6]. However, electrical energy is the highest energetic cost for food production of current RASs (especially heating), and the reduction of energy consumption is one of the main challenges for aquaponics [3,7]. Badiola et al. [8] studied energy resources in RASs. The results indicated that fossil fuel energy consumption ranged from 8.1 kWh to 81.48 kWh to produce 1.0 kg of fish. However, in the actual RAS of Delaide et al. [9], the production of 1 kg of vegetables and tilapia consumed 84.5 kWh and 96.2 kWh, respectively. Water heating consumed the most electricity; it accounted for 57% of the daily consumption for 0.76 m3 of fish tank water. The results from a report by Love et al. [10] also showed that the most significant uses of electricity were in-tank water heaters; an average of 56 kWh and 159 kWh of electricity was needed to produce 1 kg of crops and tilapia, respectively. The high energy requirement of RAS increases both operational costs and the potential impacts created by the use of fossil fuels. The use of fossil fuels is not only a problem related to the global warming that is happening due to emissions of carbon dioxide CO2 but also an environmental concern as it causes air pollution, acid precipitation, ozone depletion, forest destruction, emission of radioactive substances [11,12], and continuous depletion of fossil fuels worldwide [13]. With the current state of the world’s resources, energy is a major consideration for sustainable aquaculture practices [14] and using renewable energy sources (RES) in RAS should be prioritized to reduce electricity consumption and environmental impact [3]. Therefore, to solve this problem, a low-energy-consumption heating method for RAS was proposed by Le et al. [15]. In their study, they reported a novel heating method that uses a combination of helically coiled heat exchangers (HCHEs) and thermal energy storage (TES) units to replace the electric heater. The goal of the heating method was to heat the tank water from 24.5 °C to less than 30 °C. An average temperature level of 28 °C is suitable for optimal fish growth; therefore, this temperature level was chosen for the calculation and analysis of the heating model. A computational fluid dynamics (CFD) approach was adopted for transient analysis and inspection of the HCHE model considering eight cases (from case 1–8) with four temperature levels (55 °C, 60 °C, 70 °C, and 80 °C) and three mass flow rates (0.166 kg/s, 0.249 kg/s, and 0.332 kg/s). The results showed that the temperature distribution of the water in the fish tank, from 26.7 °C to 30.0 °C, was suitable for maintaining the health of warm-water fish and had high thermal efficiency ranges of 57.5–76.1%. However, the results obtained from the simulation model have not been verified experimentally. Moreover, TES applications overcome any conflicts between energy generation and use in terms of time, temperature, power, or location [16]. A variety of TES tanks have been extensively used in actual applications [17,18,19,20,21,22,23,24], but the integration of TES tanks in RASs is scarce. Therefore, an experimental setup for verifying the reliability of the developed numerical results was necessary.
Accordingly, the purpose of this study was to confirm the results of the numerical model published by Le et al. [15]. The validation of the analyzed numerical model was carried out using an experimental setup that was built similarly to theirs. In this study, eleven experimental setups were built to investigate. Among them, the experimental results from case 1–8 were the first to be compared to those of Le et al. [15], specifically the temperature fields of the liquid in the helically coiled tubes (HCTs) and fish tank, heat transfer rates, and thermal efficiency of the HCHE model. Three additional cases (from case 9–11) were studied further and compared to the analyzed numerical model to investigate the transient discharging energy efficiency of the TES tank. This study considered three temperature levels—namely, 65–75 °C, 71–81 °C, and 81–87 °C—with a mass flow rate of 0.166 kg/s. Before carrying out the numerical simulation for the three additional cases, the cases’ experimental modes were validated.
The remainder of this paper is organized as follows. In Section 2, we introduce the experimental setups for the heat exchanger model in the fish tank. This is followed by a description of the operating conditions, three additional cases, and the methodology used. The next section presents the experimental results and compares them with those of the available numerical results. Finally, the conclusions and directions for further research are summarized.

2. Numerical Modelling

Three additional cases (9–11) were studied further to investigate the transient discharging energy efficiency of the TES tank. Before performing the numerical simulation, the experimental modes were validated. To simulate cases 9–11, the simulation model, numerical solution method, boundary conditions, and mesh result were used, which was similar to a previous report [15].

2.1. Simulation Model

The 3D model and schematic of the HCT inside the fish tank are shown in Figure 1. The geometric dimensions of the HCT are listed in Table 1. In this model, the geometry of the tank and HCT were created in Solid Edge, and the mesh was created using the FLUENT 17 package of ANSYS ICEM CFD. The model volume was 3.4 m3 (0.75 m height × 2.4 m diameter; volume = 0.75 × 3.14 × (1.2)2 = 3.4 m3), and this configuration was similar to that of the actual fish tank in the RAS.
The test points were used to measure the temperature of the hot liquid at the inlet, outlet, and 1, 2, 3, and 4 turns of the HCT. There were 24 test points for the water temperature in the fish tank (P1–P24), and these test points were divided into three layers with heights of 100 mm, 350 mm, and 600 mm. Each layer had eight test points with a distance of 300 mm between them, as shown in Figure 2.

2.2. Grid Generation

The optimum mesh chosen for the analysis consisted of 8,107,644 cells and 4,092,668 nodes. Unstructured (block-structured) non-uniform grids were used to mesh the fluid volume and boundary layer. The grid was generated with tetrahedral and hexahedral cells. The structural details of the mesh in the HCT and fish tank models are shown in Figure 3.

2.3. Numerical Solution Method

The standard k−ε model was adopted to describe the turbulent flow, and the near-wall region was solved using standard wall functions. The pressure–velocity coupling was achieved by the SIMPLE algorithm. A second-order upwind scheme was adopted for the discretization of the momentum, turbulent kinetic energy, turbulent dissipation rate, and energy equations. The convergence criterion, based on the relative convergence criterion, was 10−6 for the energy equation and 10−4 for the other variables. The following values were assigned to the empirical constants for the turbulence model: C μ = 0.09, C 1 ε = 1.44, C 2 ε = 1.92, σ k = 1.0, and σ ε =1.3.

2.4. Boundary Conditions

The tube material was grade 304 stainless steel, whose thermal conductivity is 16.2 W/m·K, specific heat is 500 J/kg·K, and density is 8000 kg/m3. The liquids at the inlet of the HCT and tank were used as a mass flow inlet boundary condition. At the outlet, zero pressure conditions were considered. The water volume in the tank was 3.4 m3 with a recirculating water flow of 0.930 kg/s, and the temperature inlet was maintained at 24.5 °C.
To accurately model the temperature-dependent properties, the density (ρ), specific heat (Cp), thermal conductivity (k), and viscosity (μ) of the liquid were not assumed to be constant. They were solved with the liquid properties evaluated at the cell temperatures in the CFD code by the following polynomials [25]:
ρ(T) = −1.5629e − 5T3 + 0.011778T2 − 3.0726T + 1227.8
Cp(T) = 1.1105e − 5T3 − 0.0031078T2 − 1.478T + 4631.9
k(T) = 1.5362e − 8T3 − 2.261e−5T2 + 0.010879T − 1.0294
μ(T) = 2.1897e − 11T4 − 3.055e − 8T3 + 1.6028e − 5T2 − 0.0037524T + 0.33158
Three additional cases (9–11) were considered with three temperature levels (65–75 °C, 71–81 °C, and 81–87 °C), with a mass flow rate of 0.166 kg/s. The difference between the initial temperature and the final temperature of the hot liquid into the HCT changed significantly (over 6 °C) (Figure 4), which could have affected the thermal behavior and the numerical simulation results. Therefore, to solve the temperature inlet boundary conditions of the fluid into the HCT for the numerical model according to the experimental circumstances, the polynomial functions of Equations (5)–(7) of the temperature inlet was used through user-defined functions corresponding to cases 9–11:
Th_in (T) = (349.729438 + 24.785672 t0.5 + 0.043197t)/(1 + 0.066524t0.5 + 0.000172t)
Th_in (T) = (337.534952 + 35.687073t0.5 + 0.159733t)/(1 + 0.096203t0.5 + 0.000589t)
Th_in (T) = (324.407198 + 40.690624t0.5 + 0.490905t)/(1 + 0.110679t0.5 + 0.001599t)

3. Experimental Setup

3.1. Thermal Energy Storage Tank

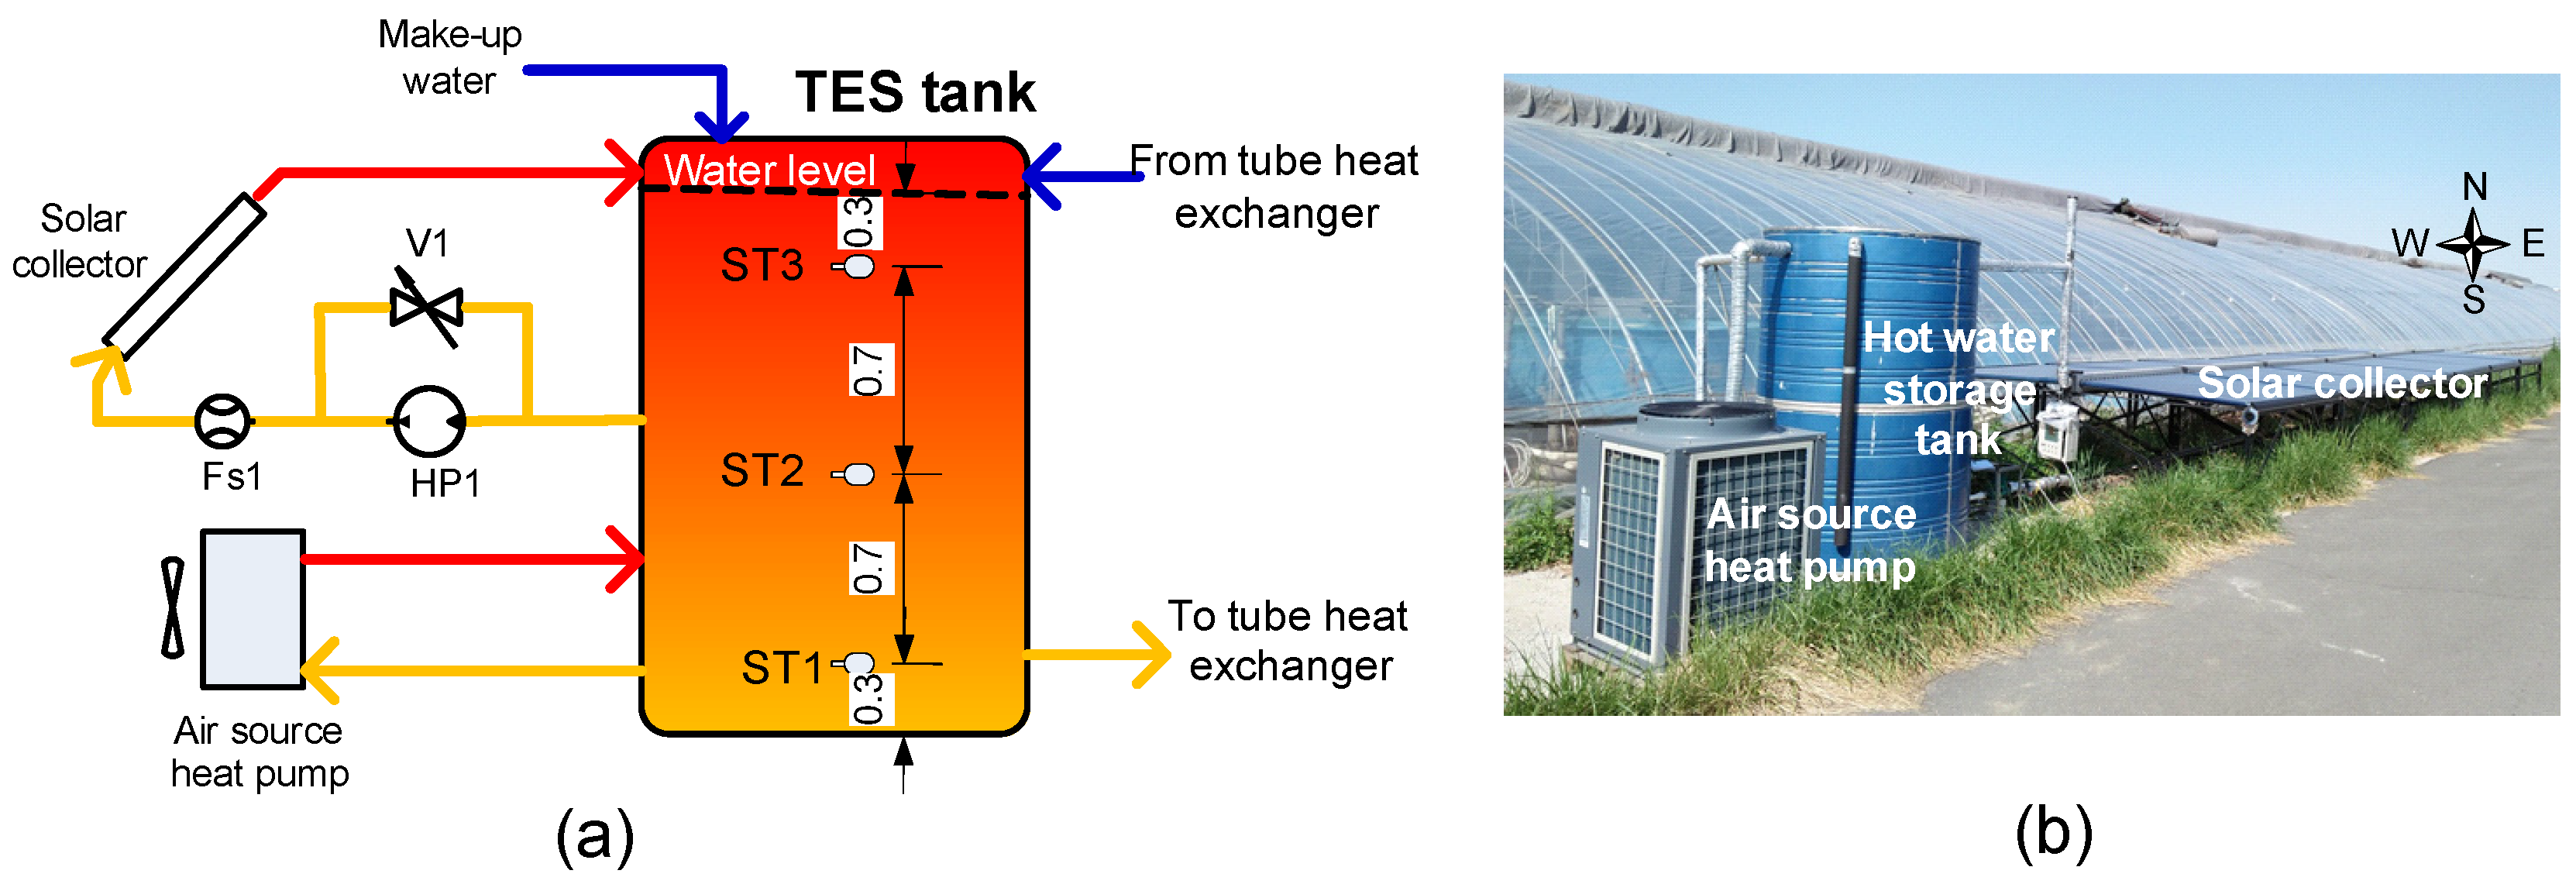
Experimental validation was carried out at the experimental farm of the China Agricultural University and EU INAPRO project, located in Shouguang City (latitude 36°51′ N, longitude 118°51′ E), Shandong Province, China. The TES tank was supplied by a combination of solar thermal and air source heat pumps (Figure 5). A centrifugal pump (HP1) was used to pump the recirculating hot water between the solar collectors and TES tank, and the mass flow rate was controlled by a flow valve (FV1) to set the desired temperature of the TES tank. A TES tank with a size of 2.4 m height × 1.5 m diameter was constructed using three layers. The inner layer was a grade 304 stainless steel plate with a thickness of 0.65 mm. The middle layer was 5-cm-thick glass wool insulation. The outer layer was a grade 202 stainless steel plate with a thickness of 0.5 mm. The TES tank had a water volume of 3.08 m3 (2.0 m height × 1.4 m diameter; volume = 2.0 × 3.14 × (0.7)2 = 3.08 m3). A flow sensor (FS1) was used to measure the mass flow rate of the recirculating hot water (Figure 5a).
Three temperature sensors (ST1–ST3) were fixed in the middle of the storage tank at heights of 0.3 m, 1.0 m, and 1.7 m to measure the average temperature of the hot water in the TES tank. The solar collector had 300 tubes, with each tube having a length of 1800 mm and a diameter of 58 mm. The total absorption area of the solar collectors was 43.2 m2 (Figure 5b).

3.2. Helically Coiled Heat Exchanger

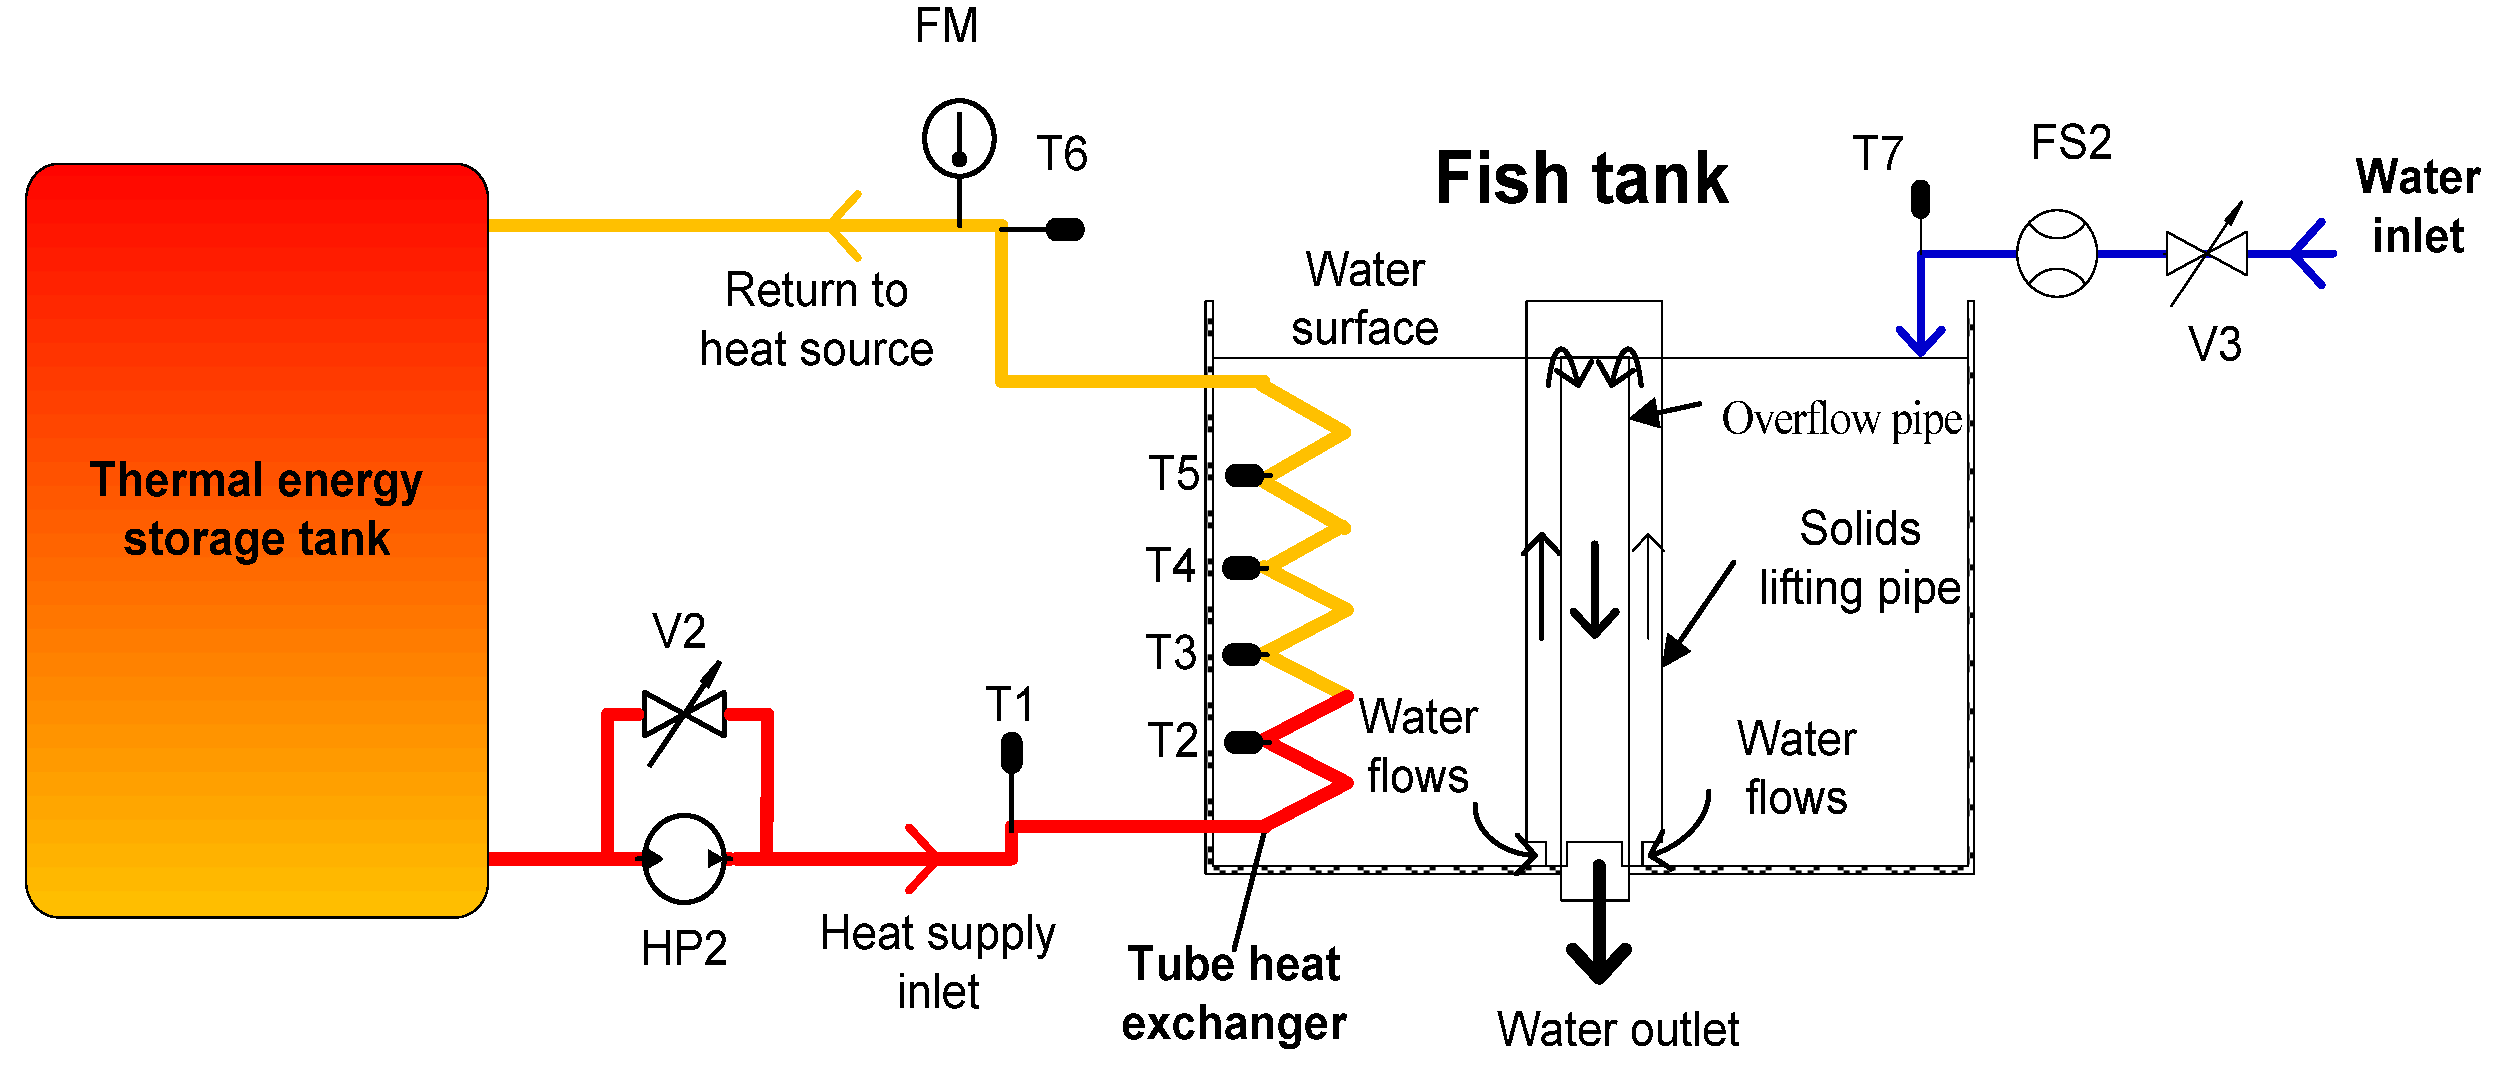
The HCT was connected to recirculating hot water in the TES tank by a polypropylene random copolymer pipe through a centrifugal pump (HP2). The experimental setups (the geometric dimensions and operational modes) were built similarly to the numerical model analyzed by Le et al. [15] to validate the results of the numerical model, as follows:
  • The geometric dimensions of the HCT and fish tank are similar to those of the simulation model, as shown in Figure 1b and listed in Table 1. The water level in the cylindrical tank was maintained at a depth of 0.75 m by the overflow pipe to maintain a water volume of 3.4 m3, with a recirculating water flow of approximately 0.930 kg/s. The nozzle supplying the water into the fish tank was positioned at a 45° angle above the water surface.
  • Six temperature sensors, T1–T6, were used to measure temperature for the hot liquid inlet, 1 turn, 2 turns, 3 turns, 4 turns, and the outlet of the HCT. The temperature sensors were inserted into the HCT through the probe. Temperature sensor T7 was used to measure temperature for the water inlet of the fish tank, and an additional sensor was used to measure the environmental temperature, as shown in Figure 6.
  • A total of 24 temperature sensors (P1–P24) were fixed at the same distances as the test points of the CFD model, and the measurement results were used to calculate the average water temperature in the fish tank, as shown in Figure 2 and Figure 7.
  • A flow meter (FM) and flow valve (FV2) were used to measure and control the liquid flow into the HCT. Similarly, a flow sensor (FS2) and flow valve (FV3) were used for the fish tank (Figure 3).
  • The operation modes for the experiment are listed in Table 2. Among them, the results of cases 1–8 were analyzed and compared to those of Le et al. [15]. Three additional cases 9–11 were studied further to investigate the transient discharging energy efficiency of the TES tank. The initial temperature for all the liquids of the HCHE was set to 24.5 ± 0.5 °C.

3.3. Instrumentation

In this test system, the instrumentation consisted of a temperature sensor, water flow meter, flow sensor, water pump, and data logger (Figure 8).
  • In the HCHE model, the experimental setup used 32 temperature sensors, including seven sensors to test the temperature of the points from T1 to T7 (Figure 2), 24 sensors to measure the temperature of the water in the fish tank (Figure 4), and one sensor to measure the environment temperature. A waterproof digital temperature sensor was used, and it allowed for multi-sensor support over the same 1-Wire bus [26]. The sensor has a resolution of 0.0625 °C (12 bits), operating temperature range of −55 to +125 °C, and ±0.5 °C accuracy from −10 °C to +85 °C.
  • A flow meter was used to measure the hot water flow rate of the HCT with a working temperature range of −20 °C to 100 °C, flow rate range of 1–50 L/min, accuracy of 0.5%, and working pressure ≤4.0 MPa. The flow meter was installed according to the manufacturer’s recommendations (horizontal).
  • Two water flow sensors (Hall effect sensors) were used to measure the mass flow rate of the water into the fish tank and solar collectors. The flow sensor has a range of 5–150 L/min, accuracy of ±3%, working pressure of ≤1.75 MPa, and working temperature range of −20 °C to 85 °C.
  • Two centrifugal pumps were used to pump the circulating liquid of the HCHE and the solar collectors. The pump model was a Wilo PH-101EH-200W from Shandong, China, and had an electric power of 200 W and a maximum flow rate of 130 L/min at a rated head of 8 m.
The measurements of the mass flow sensors and the temperature sensors were validated before the experimental measurements were obtained. The temperature sensors were calibrated with a ±0.2 °C accuracy from 0 °C to +90.0 °C. The resulting uncertainty of mass flow sensors was found to be ±5% with a mass flow rate of 0.930 kg/s at a temperature of 25 °C.

3.4. Experimental Procedure

The experiments of this study were conducted under indoor conditions, and the environmental temperature ranged between 25.0–32.0 °C. A large reservoir and submersible pump were used to provide flow to the fish tank. The water in the fish tank was not circulated. Additional water was continuously added to the reservoir; hence, the flow rate was not compromised.
To check the authenticity of the measurements from T1–T6 sensors, pump HP2 circulated water in the HTC under three mass flow rates (0.166 kg/s, 0.249 kg/s, and 0.332 kg/s) at a temperature of approximately 70 °C, while the fish tank did not contain water. The results showed that the maximum error of temperature measured by the sensors was approximately 1.0 °C.
The temperature of the inlet water into the HCT from case 1 to case 8 was constant (Table 3), so before turning on pump HP2, the water temperature of the TES tank was heated to the required value. Then, the temperature levels of the hot water in the TES tank were maintained by pump HP1 turned on in parallel with pump HP2, and the flow rates into the solar collector modules were adjusted by valve FV1 during the heat exchanger operation. In cases 9–11, pump HP1 was turned off during the heat exchanger operation so we could investigate the transient discharging energy efficiency of the TES tank. The objective of this study was to validate the results of the numerical model with an experimental process that was used to heat the 3.4 m3 water in the fish tank from 24.5 °C to 28 °C. The experiment stopped running when the average temperature of the water in the tank, as measured by the 24 temperature sensors, was over 30 °C. The final results were obtained when the average temperature of the tank water reached 28 °C.
Two separate runs at different times were carried out to evaluate the experimental data. All data was recorded using an Arduino Mega 2560 R3 data acquisition module with a micro SD socket for data storage and an LCD display for indication. The data recording interval was set to 30 s, and the results were used for analysis in this study.

4. Mathematical Formalism

The heat transfer rate ( Q he ) from the hot liquid in the HCT to the tank is calculated as follows:
Q h e ( t ) = 0 t h e m ˙ h C p ( T h i T h o ) d t t h e
where m ˙ h is the mass flow rate of the hot liquid, C p is the specific heat of the liquid, and T hi and T ho are the inlet and outlet liquid temperatures of the HCT, respectively. Further, t h e is the heat transfer duration.
The heat transfer rate per unit length ( U 0 ) was calculated based on the length L of the HCT, which is calculated as follows:
U 0 = Q he L
The basic equation for the usable heat transfer rate ( Q t ) delivered by the HCT to heat the volume of water in the tank from 24.5 °C to 28 °C is given by Le et al. [15]:
Q t = ρ V t C p Δ T t t he
where ρ is the density of the water, V t is the volume of water in the tank, and Δ T t is the change between the initial and final temperatures of water in the tank.
The thermal efficiency of the HCHE ( η h e ) is the ratio between the usable heat transfer rate of water in the tank and the heat transfer rate of the hot liquid in the HCT, and it can be calculated using the following equation:
η he = Q t Q he
The total thermal energy ( Q T E S ) is required for the heat transfer duration of the heat exchanger model, and it was calculated based on Q h e and t h e as follows:
Q T E S = Q h e t h e
The usable energy efficiency of the fish tank ( η usable ) is the ratio between the accumulated energy of the water in the tank ( Q u s a b l e ) and total thermal energy ( Q T E S ) as follows:
η usable = Q usable Q TES = Q t t h e Q T E S
The transient discharging energy efficiency ( η d i ) of the TES tank is used to evaluate the heat storage capacity of the TES tank, which is defined as the ratio of the Q T E S delivered from the HCHE to the initial thermal energy stored in the TES tank ( Q s t ) as follows:
η di ( t ) = Q TES Q st ( t = 0 )
Q st ( t = 0 ) = ρ V st C p T st _ in
where T s t _ i n and V s t are the initial average temperature and the volume of the hot water in the TES tank, respectively.
The electric energy consumption ( Q e ) of pump HP2 for the heat transfer duration of the HCHE model is as follows:
Q e ( t ) = 0 t he E 2 dt = E 2 t he
where E 2 is the electric power of pump HP2.

5. Results and Discussion

In this section, we describe the heat transfer process used to heat 3.4 m3 of fish tank water from 24.5 °C to 28 °C that was conducted for 11 cases, and the results that were calculated and analyzed. The temperature fields for the water in the HCT and the fish tank, the heat transfer rates, and thermal efficiency of the HCHE model in the present work were also compared to the numerical simulation results obtained by Le et al. [15].

5.1. Temperature Field for Water in the HCT

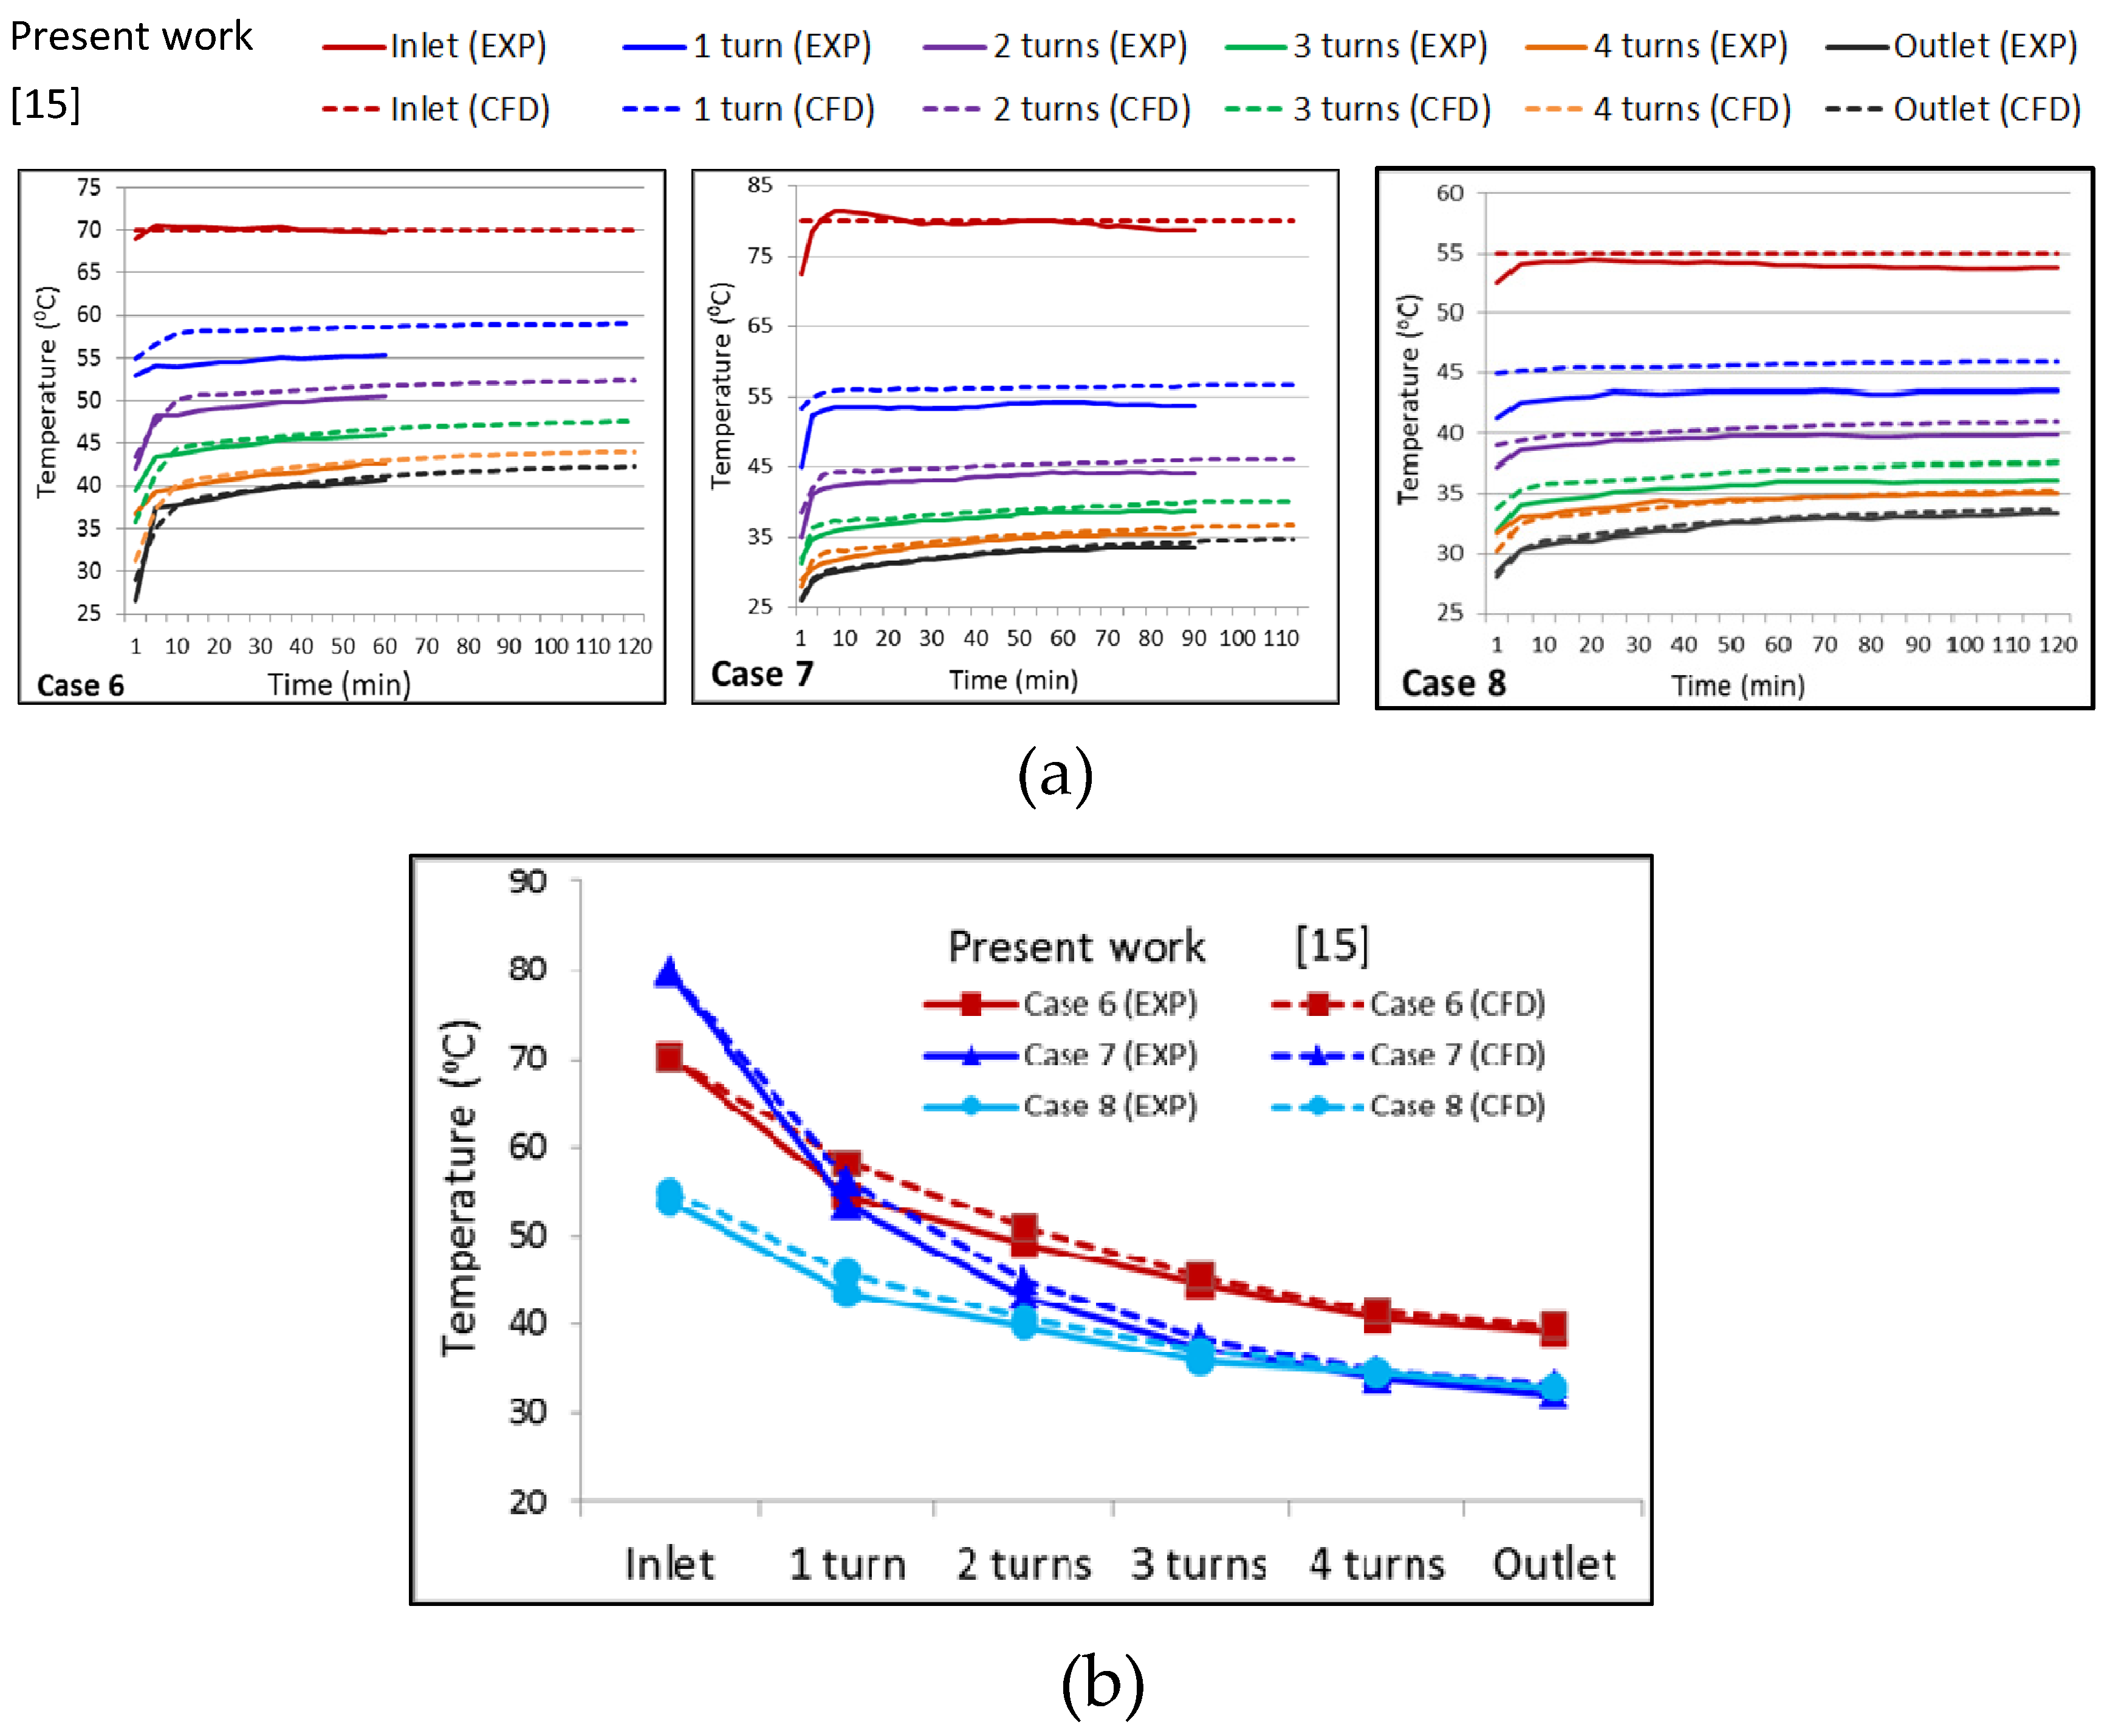
To compare the results of the present work and the numerical simulation results obtained by Le et al. [15] for hot liquid moves along the HCT, we chose cases 6, 7, and 8 to represent three temperature levels (70 °C, 80 °C, and 54 °C, respectively) and three mass flow rates (0.332 kg/s, 0.166 kg/s, and 0.249 kg/s, respectively), as shown in Figure 9. The results showed that the difference between the results in this study and the numerical simulation was the largest at the first turn of HTC (3.7 °C for case 6, 2.8 °C for case 7, and 2.3 °C for case 8); the difference gradually decreased in the next turn. These differences were attributed to the temperature sensors that were inserted into HCT via the probe. The surface of the temperature sensor’s probe was exposed to the cold liquid in the fish tank; therefore, the measured temperature result was lower than the actual value. Meanwhile, the test points in the CFD model were obtain at cross sections of the liquid along the HCT; therefore, the temperature of the cold liquid outside of the pipe did not affect the measurement results on the cross sections.
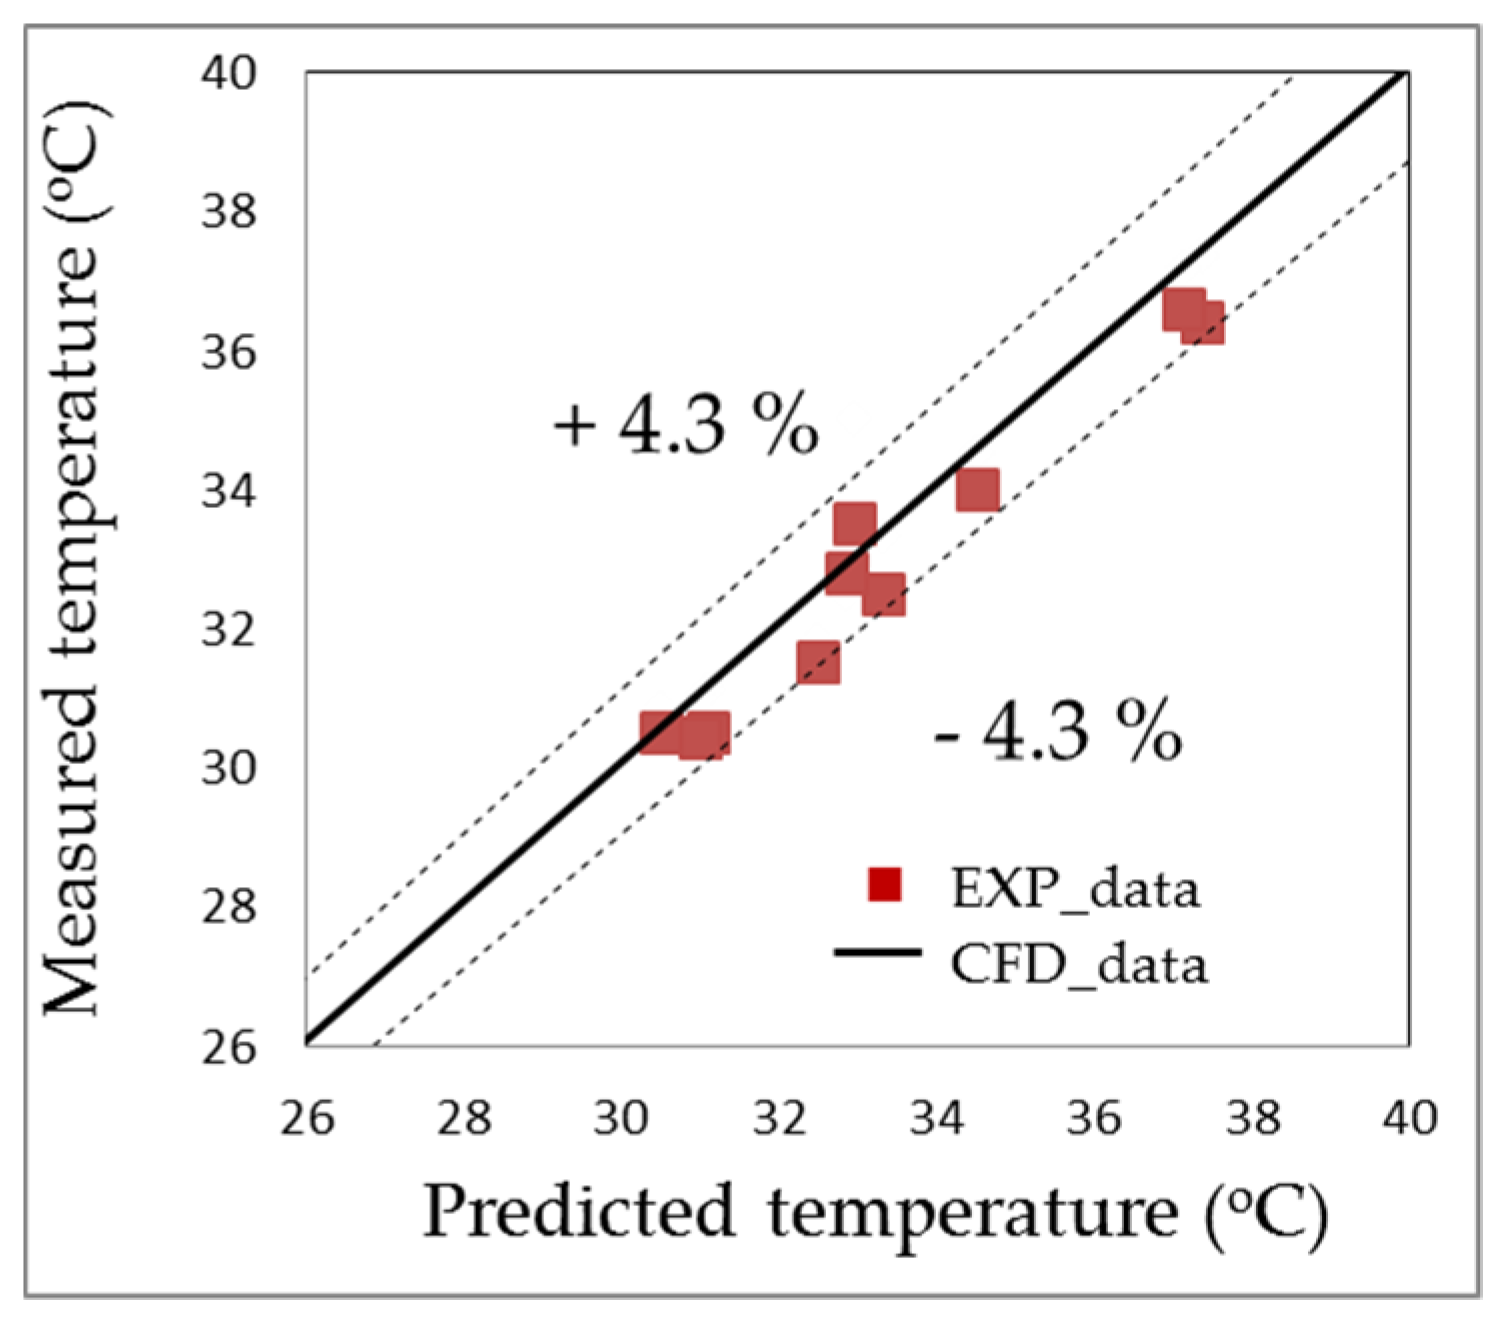
The comparison of the predictions and the measurements for the liquid temperature at the outlet of the HCT for all cases is shown in Figure 10. The simulation model provided an accurate prediction of the temperature at the outlet of the HCT. The deviations between the predictions and experimental results were within ±1.5 °C. The liquid temperature at the outlet of the HCT in the experiment was slightly lower because the hot liquid in the HCT lost more heat, and the heat exchanger process of the HCHE had a higher intensity than that in the simulation model. As observed in Figure 10, most of the data is within an error of ±4.3%.

5.2. Temperature Fields of Water in the Fish Tank

The average temperature of the water in the fish tank was measured at 24 points over time, as shown in Figure 11. It can be seen that the data obtained from the experiment agrees with the numerical simulation results. These curves were nonlinear functions for all cases and the deviations of each result from the corresponding curve were highly correlated. The detailed results of the temperature error range and time deviation of all cases are listed in Table 3.
The time to heat the water in the fish tank ( t h e ) from 24.5 °C to 28 °C was 23 min (case 6) to 62 min (case 1). The t h e value of case 6 was the shortest and the t h e of case 1 was the longest among all cases. The difference between the two results for the time it took to heat the fish tank water ranged from 3 min to 8 min for all cases. The difference between the average temperature errors of the water in the fish tank in the two results ranged from 1.3% to 3.6%. The experimental results showed that the heat transfer time was reduced by approximately half when changing the operating mode from case 8 (57 min) to case 5 (27 min). The results of the present work agreed with the results obtained by Le et al. [15] and Yang et al. [27]. In their papers, they reported that the charging time for the heat transfer fluid was also reduced by half when the inlet temperature of the heat transfer fluid increased from 55 °C to 70 °C, and the mass flow rate of the fluid remained constant.
As indicated in Table 3, the maximum error of the average water temperature of the 24 test points in the tank in case 1 was 2.3%, which was lower than that of cases 3–7, but the time difference in case 1 was the highest among all cases (time deviation was 8 min). This is attributed to the fact that the average water temperature in the tank rose to a near steady state at 28 °C (the CFD and experimental results showed that the average temperature increased only 1 °C over the next 60 min). As shown in Figure 10a, as the temperature increased to 28 °C, the slope of the temperature curve during the period near the steady state was small (almost horizontal). Therefore, the time difference between the CFD and experimental results was large. When the slope of the temperature curve was larger, the time deviation was smaller; this same relationship was observed in cases 5, 6, 9, and 10. The slope of the temperature curve between 24.5 °C and 29 °C was large and the time difference between the CFD and experimental results was approximately 3 min (about one-third shorter than the result of case 1).
In the simulation model, the fluid properties were estimated using Equations (1)–(4). As expressed in Equation (1), density is a function of temperature; density decreases with increasing temperature and this leads to a lower gravitational force. A lower gravitational forces leads to the warmer particles moving up and the colder particles with heavier weights replacing them. The temperature distribution of the water in the tank showed that the water temperature near the pipes was slightly higher than in the center regions of the tank, resulting in the formation of two temperature areas in the tank water: (1) the high-temperature water area near the tubes and (2) the low-temperature water area near the center drain of the tank (Figure 12a). However, the temperature measurement results showed that the fluid temperatures on longitudinal axis A1 (average temperature of points P1, P9, and P17) surrounding the tube in the simulation model were slightly higher than the experimental results. The temperatures on longitudinal axes A2 (average temperature of points P2, P10, and P18), A3 (average temperature of points P3, P11, and P19), and A4 (average temperature of points P4, P12, and P20) were lower for all of the cases. To describe this phenomenon in more detail, Figure 12b depicts the temperature variations at four different positions (from P9 to P12) in the tank. This analysis describes the typical cases, such as 6–8, but in the other cases, we observed that the heat exchange process was similar. The temperature results in Figure 12b show that the water temperature increased gradually with time. However, the simulation model behaved differently compared to the experimental results. In the simulation model, the difference between the predicted temperatures from points P9 and P10 was approximately 0.5 °C for case 6 and 0.3 °C for case 7, while the temperature measurement results of points P9 and P10 were almost the same for cases 6–8. The results in Figure 11 and Figure 12 demonstrated that the natural and forced convection of the fluid in the tank during the experiments was more intense in the simulation model. The difference between the temperatures of the liquid in the tank and surrounding area of the pipes and the tank center in the experiment was lower than the difference in the simulation model (0.2 °C in case 1 to 1.0 °C in case 6).

5.3. Heat Transfer Rate

The heat transfer rate ( Q he ) of the experimental results was plotted against the CFD results for all cases, as shown in Figure 13. The heat transfer rate in the simulation model was lower than the measured value. The experimental results showed that the Q he value of case 6 was the highest (43.12 kW) and case 1 was the lowest (20.54 kW). Cases 2, 3, and 5 were similar to cases 4, 7, and 9, with approximate Q he of 28 kW, 33 kW, and 36 kW, respectively. The results of the present work agreed with the CFD results reported by Le et al. [15]. The largest difference of Q he between the experimental and CFD results was 0.81 kW (approximately 4.2%) for case 4. In contrast, case 8 had the smallest difference of 0.24 kW (approximately 1.2%). The Q he results showed that a variation in temperature from the temperature test points along the HCT did not affect the overall HCHE heat transfer rate because the heat transfer rate was calculated based on the difference between the inlet and outlet temperatures of the HCT.
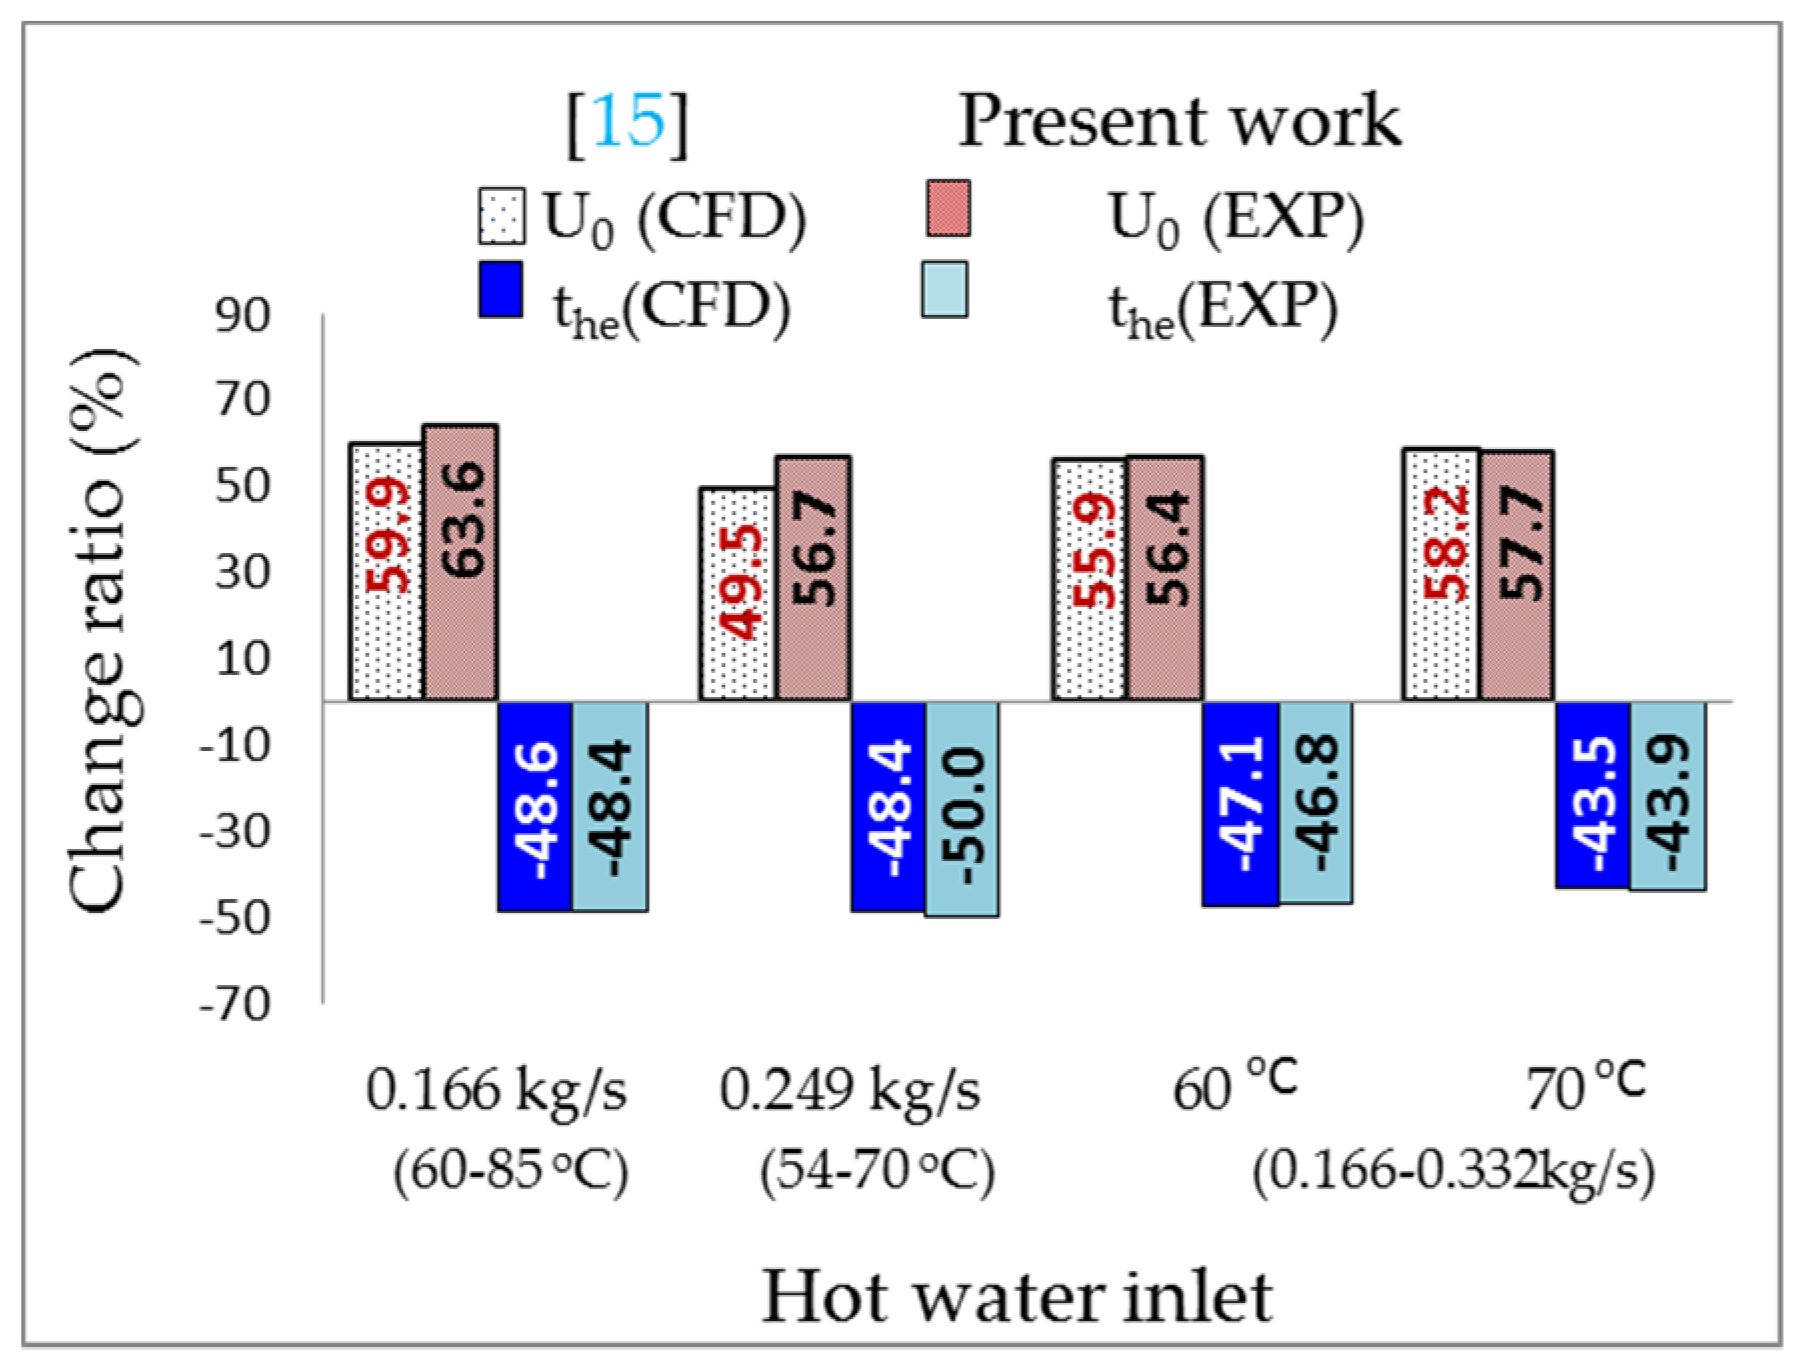
Figure 14 shows the change ratios for the values of heat transfer rate per unit length ( U 0 ) and t he between the CFD and experimental results when the inlet parameters of the HCHE were changed. The experimental results agreed with the numerical simulation results, and the difference between the two results ranged from 0.5% to 7.2% for U 0 and from 0.2% to 1.6% for t he .
A comparison between the experimental and simulation results showed that if the HCT inlet mass flow rate changed from 0.166 kg/s to 0.332 kg/s and the temperature was unchanged (60 °C or 70 °C), the difference in the change ratio for U 0 and t he values between the experimental and simulation results was not significant. However, for the experiment, when the flow rate was unchanged (0.166 kg/s or 0.249 kg/s), if the temperature changed from 60 °C to 85 °C or 54 °C to 70 °C, the U 0 value increased by 63.6% and 56.7%, respectively, which was 3.7% and 7.2% higher than that of the simulation model, respectively. Thus, these results showed that when the temperature inlet or flow rate increased, the heat transfer rate increased for both. However, as the temperature inlet increased, HCHE’s relative heat exchange advantage of the HCHE becomes higher as the flow rate increased. The higher inlet temperature led to a greater temperature difference between the pipe walls and the water in the tank, which contributed to a more intense heat conduction and heat exchange via natural convection and forced convection by water flow into the tank.

5.4. Energy Efficiency

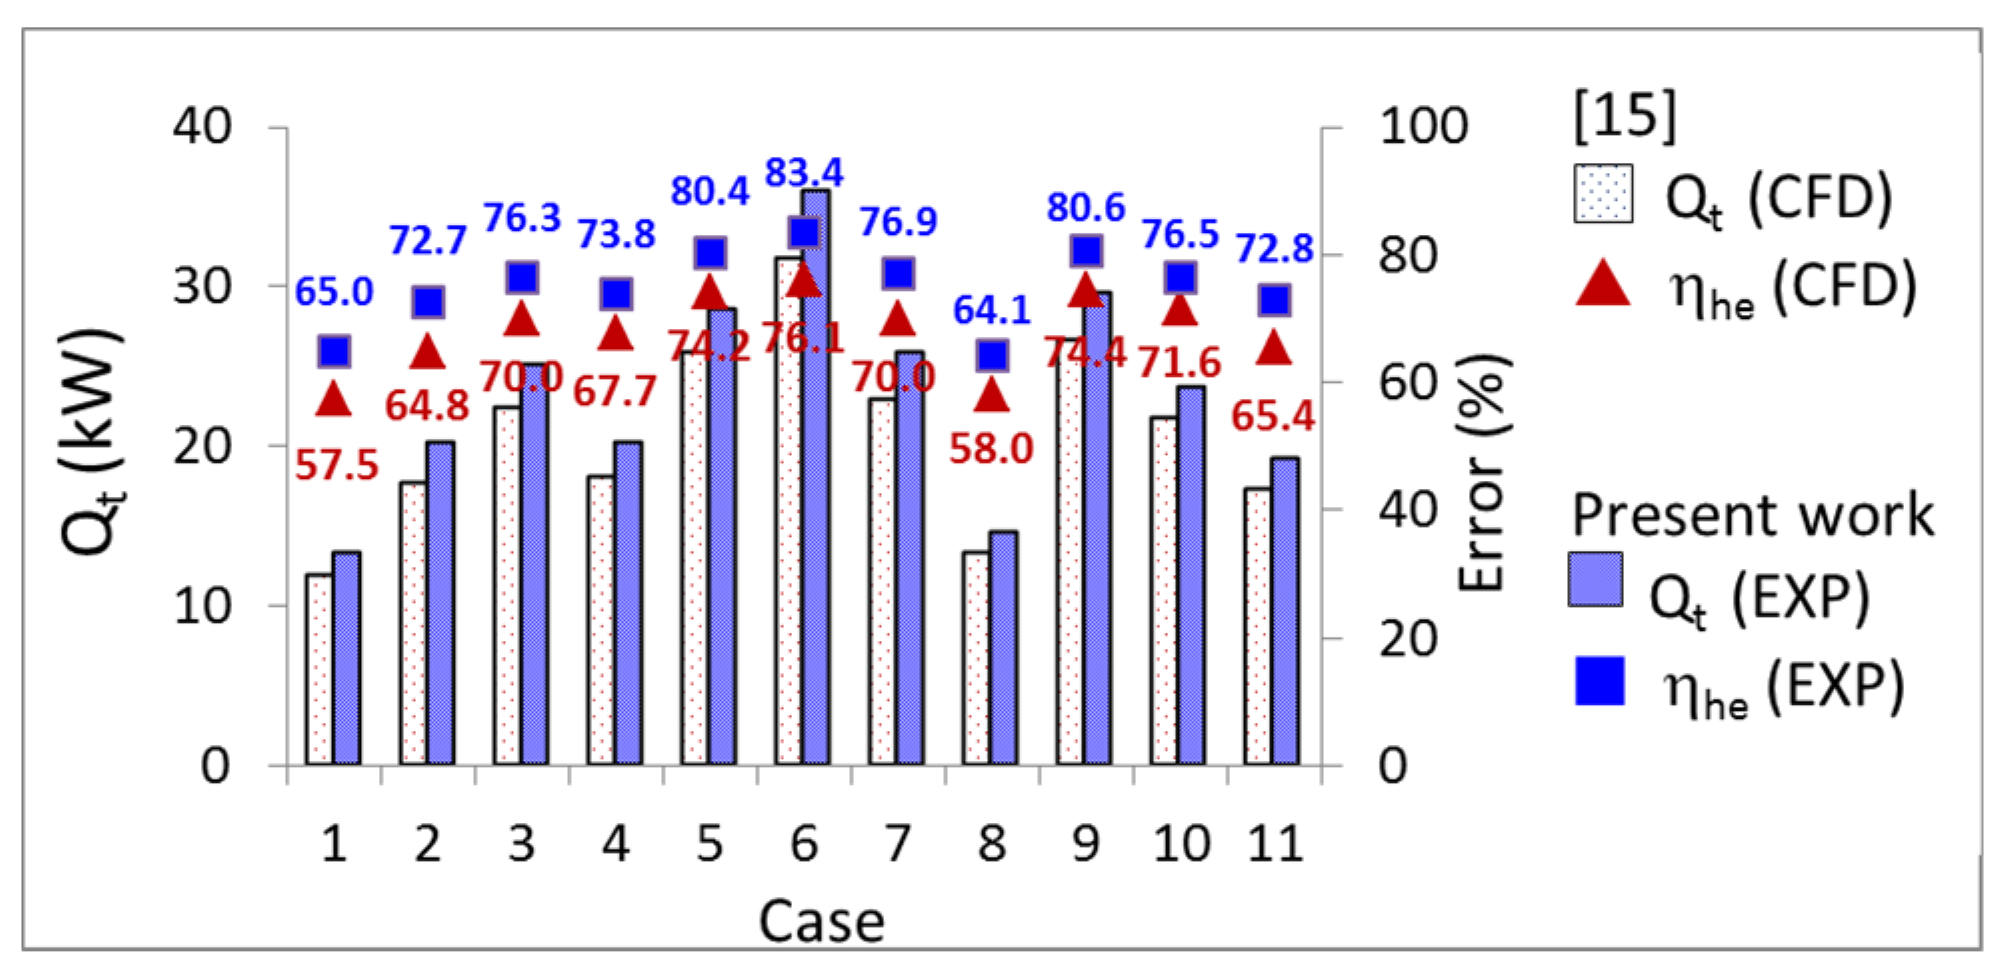
The usable heat transfer rate ( Q t ) of the fish tank and the thermal efficiency ( η h e ) of the HCHE model are shown in Figure 15.
In the CFD results, the Q t values ranged from 11.82 kW (case 1) to 31.82 kW (case 6), and the η h e values ranged from 57.7% to 76.1%. The Q t values in the experiment ranged from 13.33 to 35.97 kW, corresponding to the ηhe values obtained between 65.9% and 83.4%. The experimental results showed that if the HCT inlet temperature was unchanged (60 °C or 70 °C) and the mass flow rate was increased by 100% (from 0.166 kg/s to 0.332 kg/s), the Q t value increased by approximately 46.8% (from 13.34 kW to 25.07 kW) at 60.0 °C, and about 43.9% (from 20.18 kW to 35.97 kW) at 70 °C. In contrast, for a constant flow rate (0.166 kg/s or 0.249 kg/s), if the temperature changed from 60 °C to 85 °C and from 54 °C to 70 °C, the Q t value increased by approximately 54.8% and 49.1%, respectively. Overall, the η h e and Q t values during the experiment were higher than those of the simulation model. The difference in the η h e value between the two results was less than 8.0% and ranged from 8.1% to 11.4% for the Q t value.
The CFD and experimental results differed because the environmental temperature during the experimental period was about 26 °C to 32 °C, which was higher than the initial temperature of the water in the tank. The temperature difference affected the usable heat transfer rate of the water in the tank by affecting the heat exchange between the environmental temperature and wall surfaces and the water surface of the tank. In addition, the difference between the two results might have been due to the effect of the natural convection of the liquids in the HCHE during the experiment being stronger than in the simulation model. Convective heat exchange via the movement and mixture of the high-temperature liquid (near the pipes) and the low-temperature liquid (near the center drain of the tank) was higher (Figure 12a). Therefore, the water temperature near the center drain of the tank increased faster, resulting in a shorter time to heat the tank water to 28 °C during the experiment than in the simulation model (Table 3).
Figure 16a shows a comparison of the total thermal energy of the TES tank ( Q T E S ) that was supplied for heat exchange in the present study with that in the simulation model. The Q T E S values ranged from 65.21 MJ (case 6) to 86.31 MJ (case 1) for the numerical simulation results, and from 59.51 MJ (case 6) to 76.39 MJ (case 1) for the experimental results. The percentage of error between the two results was in the range of 6.4% to 11.5%, and the difference between the Q T E S values in the two results due to the time difference it took to heat the fish tank water ranged from 3 min to 8 min (Table 3).
When the 3.4 m3 of water in the fish tank was heated from 24.5 °C to 28 °C, 49.89 MJ of energy was accumulated in the fish tank water for all cases. However, the Q T E S supplied for the HCHE to heat the fish tank water was different for each case; this means that the usable energy efficiency decreased ( η u s a b l e ) as the discharging energy of the TES tank increased. The results in Figure 16b show that the Q T E S required for case 1 was the highest; it was 76.39 MJ, corresponding to a total heat loss of 26.55 MJ, and the value of η usable was 65.3%. Meanwhile, for case 6, the Q T E S value was the lowest (59.51 MJ), the total heat loss was 9.62 MJ, and the value of η u s a b l e was 83.8%. If the t he increased by 59.6% (from case 6 to case 1), the Q T E S value increased by 22.1%, and the total heat loss increased by 63.7%. Thus, the heat transfer time had a strong influence on the total thermal energy required to heat the fish tank water. For a longer heat transfer period, a greater energy input was required and more heat loss occurred. Most of the heat in the fish tank was transferred to the bulk water in the tank that was heated to flow out. A portion of the lost heat was recirculated back into the fish tank, so the circulating water temperature of the entire system increased after a period of operation. The remaining heat was emitted to the environment through mechanical filtration, biological filters, and the hydroponic channels of the RAS. The ratio of the two heat portions depended on two primary conditions: the size of the RAS (size and quantity of equipment, hydroponic area) and the difference between the circulating water temperature and the environment temperature. A larger system with a larger temperature difference lost more heat to the environment. In this work, a large reservoir was used to provide flow to the fish tank; the water in the fish tank was not circulated. The lost heat circulating back to the tank was not considered, so the heating time for the water of the tank to reach 28 °C will be shorter in real systems, and the total thermal energy Q T E S supplied for HCHE will be smaller than in the results of this work.
The water volume in the tank was 3.4 m3 with a recirculating water flow of approximately 1.0 kg/s, and the temperature inlet was maintained at 24.5 °C. The TES tank had a water volume of 3.08 m3. The initial thermal energy stored in the TES tank ( Q s t ) for cases 9–11 was 1092.93 MJ, 1020.54 MJ, and 947.89 MJ, respectively. The TES tank supplied the thermal energy for the HCT to heat 3.4 m3 of the fish tank water from 24.5 °C to 28 °C. The results showed that the transient discharging energy efficiency ( η d i ) of the TES tank was 5.6% for case 9. Case 10 used 6.4% of the thermal energy of the TES tank, and case 11 used 7.2% (Figure 17).
The energy accumulated in the fish tank was 49.89 MJ for all cases, while the electric energy consumption ( Q e ) of pump HP2 ranged from 276 kJ to 744 kJ for the heating exchange process of the HCHE model (Figure 18).
Thus, for the heat exchanger model using the HCT, electrical energy was not converted into thermal energy to heat the water in the fish tank. It was only used for the pump to transport the thermal energy of the hot liquid in the TES tank to the HCT placed inside the fish tank. Thus, the electrical energy consumption was quite small compared to the thermal energy of the water in the fish tank that was received from the TES unit. It is well known that electric heaters have an energy conversion efficiency close to 1 (100%) because they convert all the used electric energy into heat. Although the energy conversion efficiency of the solar water heating system (SWHS) was not calculated in the present study, previous studies have shown that compared to a conventional system (electricity or diesel), the electric energy saving ratio of the SWHS was very high. The mean value of the solar fraction in a SWHS ranges from 50% to 100% [20,28,29,30,31,32,33] and the electric energy consumption for the SWHS ranges from 0% to 50%. For case 8, the load side output of air source heat pump water heater system was 55 °C, and the average coefficient of performance was in the range of 2–4. Therefore, it has been proven that a heating method of using a HCHE inside a fish tank can replace electric heaters. It reduces not only the cost of products and the electricity consumption required to heat the aquaculture water in RAS, but also allows for sustainable food production in agricultural greenhouses.

6. Conclusions

In this study, experiments were set up similarly to an analyzed simulation model to verify and compare the simulation results for 11 cases. Temperature fields for all of the liquids of the HCT and the fish tank, as well as the heat transfer rates and the thermal efficiencies of the HCHE model in the present work, and those of the numerical simulation results reported by Le et al. [15] were presented. The following conclusions were drawn from this study:
  • The data obtained from the experiment agreed with the numerical simulation results. The time difference to heat the water in the fish tank ( t he ) from 24.5 °C to 28 °C between the two results was from 3 min to 8 min for all cases. The average temperature error of the water in the fish tank was within ±3.6%.
  • The error values of the heat transfer rate ( Q he ) and the heat transfer rate per unit length ( U 0 ) between the two results was within ±4.2%, and ranged from 0.5% to 7.2%, respectively. The thermal energy ( η h e ) was between 65.9% and 83.4% with an error range of less than 8.0%.
  • The Q T E S values ranged from 59.51 MJ (case 6) to 76.39 MJ (case 1), and the error values ranged from 6.4% to 11.5%. To heat 3.4 m3 of fish tank water from 24.5 °C to 28 °C, case 9 used 5.6% of the thermal energy of the TES tank, case 10 used 6.4%, and case 11 used 7.2%.
  • The proposed low-energy-consumption heating method can replace electric heaters, which will reduce electricity consumption when heating aquaculture water in RAS systems.
This study focused on presenting the experimental results of a heating model for the fish tank water in RASs from a previous study. However, the performance and energy efficiency of the system, such as the electric energy utilization efficiency, solar fraction, and thermal storage efficiency of TES tank, has not been studied and analyzed. Therefore, further research is needed to evaluate the results more comprehensively.

Author Contributions

Conceptualization, D.L.; methodology, A.T.L. and Y.W.; software, A.T.L.; validation, A.T.L.; formal analysis, A.T.L.; Investigation, L.W. and N.T.V.; writing—original draft, A.T.L.; writing—review and editing, A.T.L. and Y.W. visualization, L.W. and N.T.V.; Supervision, D.L. All authors have read and agreed to the published version of the manuscript.

Funding

This research received no external funding.

Acknowledgments

This research was financially supported by the International Technology Cooperation of China (2015DFA00090), the Key Laboratory of Agricultural Information Acquisition Technology, and the Fundamental Research Funds for the Central Universities in China (Grant No. 2018QC174). The authors also appreciate the constructive and valuable comments provided by reviewers.

Conflicts of Interest

The authors declare no conflict of interest.

Nomenclature

C p specific heat (J/kg K)
Dcoils diameter (m)
d i tube inner diameter (mm)
d o tube outer diameter (mm)
Eelectric power
m ˙ mass flow rate (kg/s)
Nnumber of turns (dimensionless)
Ptube pitch (m)
Q T E S total thermal energy (J)
Q e electrical energy consumption (J)
Q he heat transfer rate (W)
Q t usable heat transfer rate (W)
Q st thermal energy stored (J)
Q u s a b l e energy accumulated
Ttemperature (°C)
t h e heat transfer duration (s)
Vvolume (m3)
U 0 heat transfer rate per unit length (W/m)
Greek
ΔTtemperature difference (°C)
δcurvature ratio (dimensionless, di/D)
ρwater density (kg/m3 )
η h e thermal efficiency, dimensionless
η d i transient discharging energy efficiency, dimensionless
η u s a b l e usable energy efficiency, dimensionless
Subscripts
CFDcomputational fluid dynamics
FVflow valve
FSflow sensor
FMflow meter
Hheight (m)
HCHEhelically coiled heat exchanger
HCThelically coiled tubes
HPpump
hhot liquid
heheat exchanger
hihot in
hohot out
ininitial
Llength (m)
PPRCpolypropylene random copolymers pipe
RASrecirculating aquaponic system
RESrenewable energy source
ststored
TESthermal energy storage
ttank
Wwide (m)

References

  1. Quagrainie, K.K.; Flores, R.M.V.; Kim, H.-J.; McClain, V. Economic analysis of aquaponics and hydroponics production in the US Midwest. J. Appl. Aquac. 2018, 30, 1–14. [Google Scholar] [CrossRef]
  2. Maucieri, C.; Forchino, A.A.; Nicoletto, C.; Junge, R.; Pastres, R.; Sambo, P.; Borin, M. Life cycle assessment of a micro aquaponic system for educational purposes built using recovered material. J. Clean. Prod. 2018, 172, 3119–3127. [Google Scholar] [CrossRef]
  3. Forchino, A.A.; Lourguioui, H.; Brigolin, D.; Pastres, R. Aquaponics and sustainability: The comparison of two different aquaponic techniques using the Life Cycle Assessment (LCA). Aquac. Eng. 2017, 77, 80–88. [Google Scholar] [CrossRef]
  4. Fang, Y.; Hu, Z.; Zou, Y.; Fan, J.; Wang, Q.; Zhu, Z. Increasing economic and environmental benefits of media-based aquaponics through optimizing aeration pattern. J. Clean. Prod. 2017, 162, 1111–1117. [Google Scholar] [CrossRef]
  5. Al-Hafedh, Y.S.; Alam, A.; Beltagi, M.S. Food production and water conservation in a recirculating aquaponic system in Saudi Arabia at different ratios of fish feed to plants. J. World Aquacult. Soc. 2008, 39, 510–520. [Google Scholar] [CrossRef]
  6. Love, D.C.; Fry, J.P.; Li, X.; Hill, E.S.; Genello, L.; Semmens, K.; Thompson, R.E. Commercial aquaponics production and profitability: Findings from an international survey. Aquaculture 2015, 435, 67–74. [Google Scholar] [CrossRef] [Green Version]
  7. Rakocy, J.E. Ten Guidelines for Aquaponic Systems. Aquaculture 2007, 46, 14–17. [Google Scholar]
  8. Badiola, M.; Basurko, O.C.; Piedrahita, R.; Hundley, P.; Mendiola, D. Energy use in Recirculating Aquaculture Systems (RAS): A review. Aquac. Eng. 2018, 81, 57–70. [Google Scholar] [CrossRef]
  9. Delaide, B.; Delhaye, G.; Dermience, M.; Gott, J.; Soyeurt, H.; Jijakli, M.H. Plant and fish production performance, nutrient mass balances, energy and water use of the PAFF Box, a small-scale aquaponic system. Aquac. Eng. 2017, 78, 130–139. [Google Scholar] [CrossRef]
  10. Love, D.C.; Uhl, M.S.; Genello, L. Energy and water use of a small-scale raft aquaponics system in Baltimore, Maryland, United States. Aquac. Eng. 2015, 68, 19–27. [Google Scholar] [CrossRef] [Green Version]
  11. Omer, A.M. Energy, environment and sustainable development. Renew. Sust. Energ. Rev. 2008, 12, 2265–2300. [Google Scholar] [CrossRef]
  12. Shao, S.; Yang, L.; Gan, C.; Cao, J.; Geng, Y.; Guan, D. Using an extended LMDI model to explore techno-economic drivers of energy-related industrial CO2 emission changes: A case study for Shanghai (China). Renew. Sustain. Energy Rev. 2016, 55, 516–536. [Google Scholar] [CrossRef] [Green Version]
  13. Hassanien, R.H.E.; Li, M.; Dong Lin, W. Advanced applications of solar energy in agricultural greenhouses. Renew. Sustain. Energy Rev. 2016, 54, 989–1001. [Google Scholar] [CrossRef]
  14. d’Orbcastel, E.R.; Blancheton, J.-P.; Aubin, J. Towards environmentally sustainable aquaculture: Comparison between two trout farming systems using Life Cycle Assessment. Aquac. Eng. 2009, 40, 113–119. [Google Scholar] [CrossRef] [Green Version]
  15. Le, A.T.; Wang, Y.; Wang, L.; Ta, V.C.; Li, D. Numerical investigation on a low energy-consumption heating method for recirculating aquaponic systems. Comput. Electron. Agric. 2020, 169, 105210. [Google Scholar] [CrossRef]
  16. Navarro, L.; de Gracia, A.; Colclough, S.; Browne, M.; McCormack, S.J.; Griffiths, P.; Cabeza, L.F. Thermal energy storage in building integrated thermal systems: A review. Part 1. active storage systems. Renew. Energy 2016, 88, 526–547. [Google Scholar] [CrossRef] [Green Version]
  17. Lin, W.-M.; Chang, K.-C.; Liu, Y.-M.; Chung, K.-M. Field Surveys of Non-Residential Solar Water Heating Systems in Taiwan. Energies 2012, 5, 258–269. [Google Scholar] [CrossRef] [Green Version]
  18. Thygesen, R. An Analysis of Different Solar-Assisted Heating Systems and Their Effect on the Energy Performance of Multifamily Buildings-A Swedish Case. Energies 2017, 10, 88. [Google Scholar] [CrossRef] [Green Version]
  19. Hugo, A.; Zmeureanu, R. Residential Solar-Based Seasonal Thermal Storage Systems in Cold Climates: Building Envelope and Thermal Storage. Energies 2012, 5, 3972–3985. [Google Scholar] [CrossRef] [Green Version]
  20. Bernardo, L.R.; Davidsson, H.; Karlsson, B. Retrofitting Domestic Hot Water Heaters for Solar Water Heating Systems in Single-Family Houses in a Cold Climate: A Theoretical Analysis. Energies 2012, 5, 4110–4131. [Google Scholar] [CrossRef] [Green Version]
  21. Jonas, D.; Frey, G.; Theis, D. Simulation and performance analysis of combined parallel solar thermal and ground or air source heat pump systems. Sol. Energy 2017, 150, 500–511. [Google Scholar] [CrossRef]
  22. Parameshwaran, R.; Kalaiselvam, S.; Harikrishnan, S.; Elayaperumal, A. Sustainable thermal energy storage technologies for buildings: A review. Renew. Sustain. Energy Rev. 2012, 16, 2394–2433. [Google Scholar] [CrossRef]
  23. Najafian, A.; Haghighat, F.; Moreau, A. Integration of PCM in domestic hot water tanks: Optimization for shifting peak demand. Energy Build. 2015, 106, 59–64. [Google Scholar] [CrossRef] [Green Version]
  24. Yang, W.; Sun, L.; Chen, Y. Experimental investigations of the performance of a solar-ground source heat pump system operated in heating modes. Energy Build. 2015, 89, 97–111. [Google Scholar] [CrossRef]
  25. Jayakumar, J.S.; Mahajani, S.M.; Mandal, J.C.; Vijayan, P.K.; Bhoi, R. Experimental and CFD estimation of heat transfer in helically coiled heat exchangers. Chem. Eng. Res. Des. 2008, 86, 221–232. [Google Scholar] [CrossRef]
  26. Programmable Resolution1-Wire Digital Thermometer. Available online: www.datasheets.maximintegrated.com/en/ds/DS18B20.pdf (accessed on 10 April 2020).
  27. Yang, X.; Xiong, T.; Dong, J.L.; Li, W.X.; Wang, Y. Investigation of the Dynamic Melting Process in a Thermal Energy Storage Unit Using a Helical Coil Heat Exchanger. Energies 2017, 10, 1129. [Google Scholar] [CrossRef]
  28. Kalogirou, S. Thermal performance, economic and environmental life cycle analysis of thermosiphon solar water heaters. Sol. Energy 2009, 83, 39–48. [Google Scholar] [CrossRef]
  29. Atia, D.M.; Fahmy, F.H.; Ahmed, N.M.; Dorrah, H.T. Optimal sizing of a solar water heating system based on a genetic algorithm for an aquaculture system. Math. Comput. Model. 2012, 55, 1436–1449. [Google Scholar] [CrossRef]
  30. Allouhi, A.; Jamil, A.; Kousksou, T.; El Rhafiki, T.; Mourad, Y.; Zeraouli, Y. Solar domestic heating water systems in Morocco: An energy analysis. Energy Convers. Manag. 2015, 92, 105–113. [Google Scholar] [CrossRef]
  31. Gautam, A.; Chamoli, S.; Kumar, A.; Singh, S. A review on technical improvements, economic feasibility and world scenario of solar water heating system. Renew. Sustain. Energy Rev. 2017, 68, 541–562. [Google Scholar] [CrossRef]
  32. Saïf ed-Dîn, F.; Bouhal, T.; Gargab, F.; Jamil, A.; Kousksou, T.; Benbassou, A. Design and thermal performance optimization of a forced collective solar hot water production system in Morocco for energy saving in residential buildings. Sol. Energy 2018, 160, 260–274. [Google Scholar] [CrossRef]
  33. Valdiserri, P. Evaluation and control of thermal losses and solar fraction in a hot water solar system. Int. J. Low-Carbon Technol. 2018, 13, 260–265. [Google Scholar] [CrossRef]
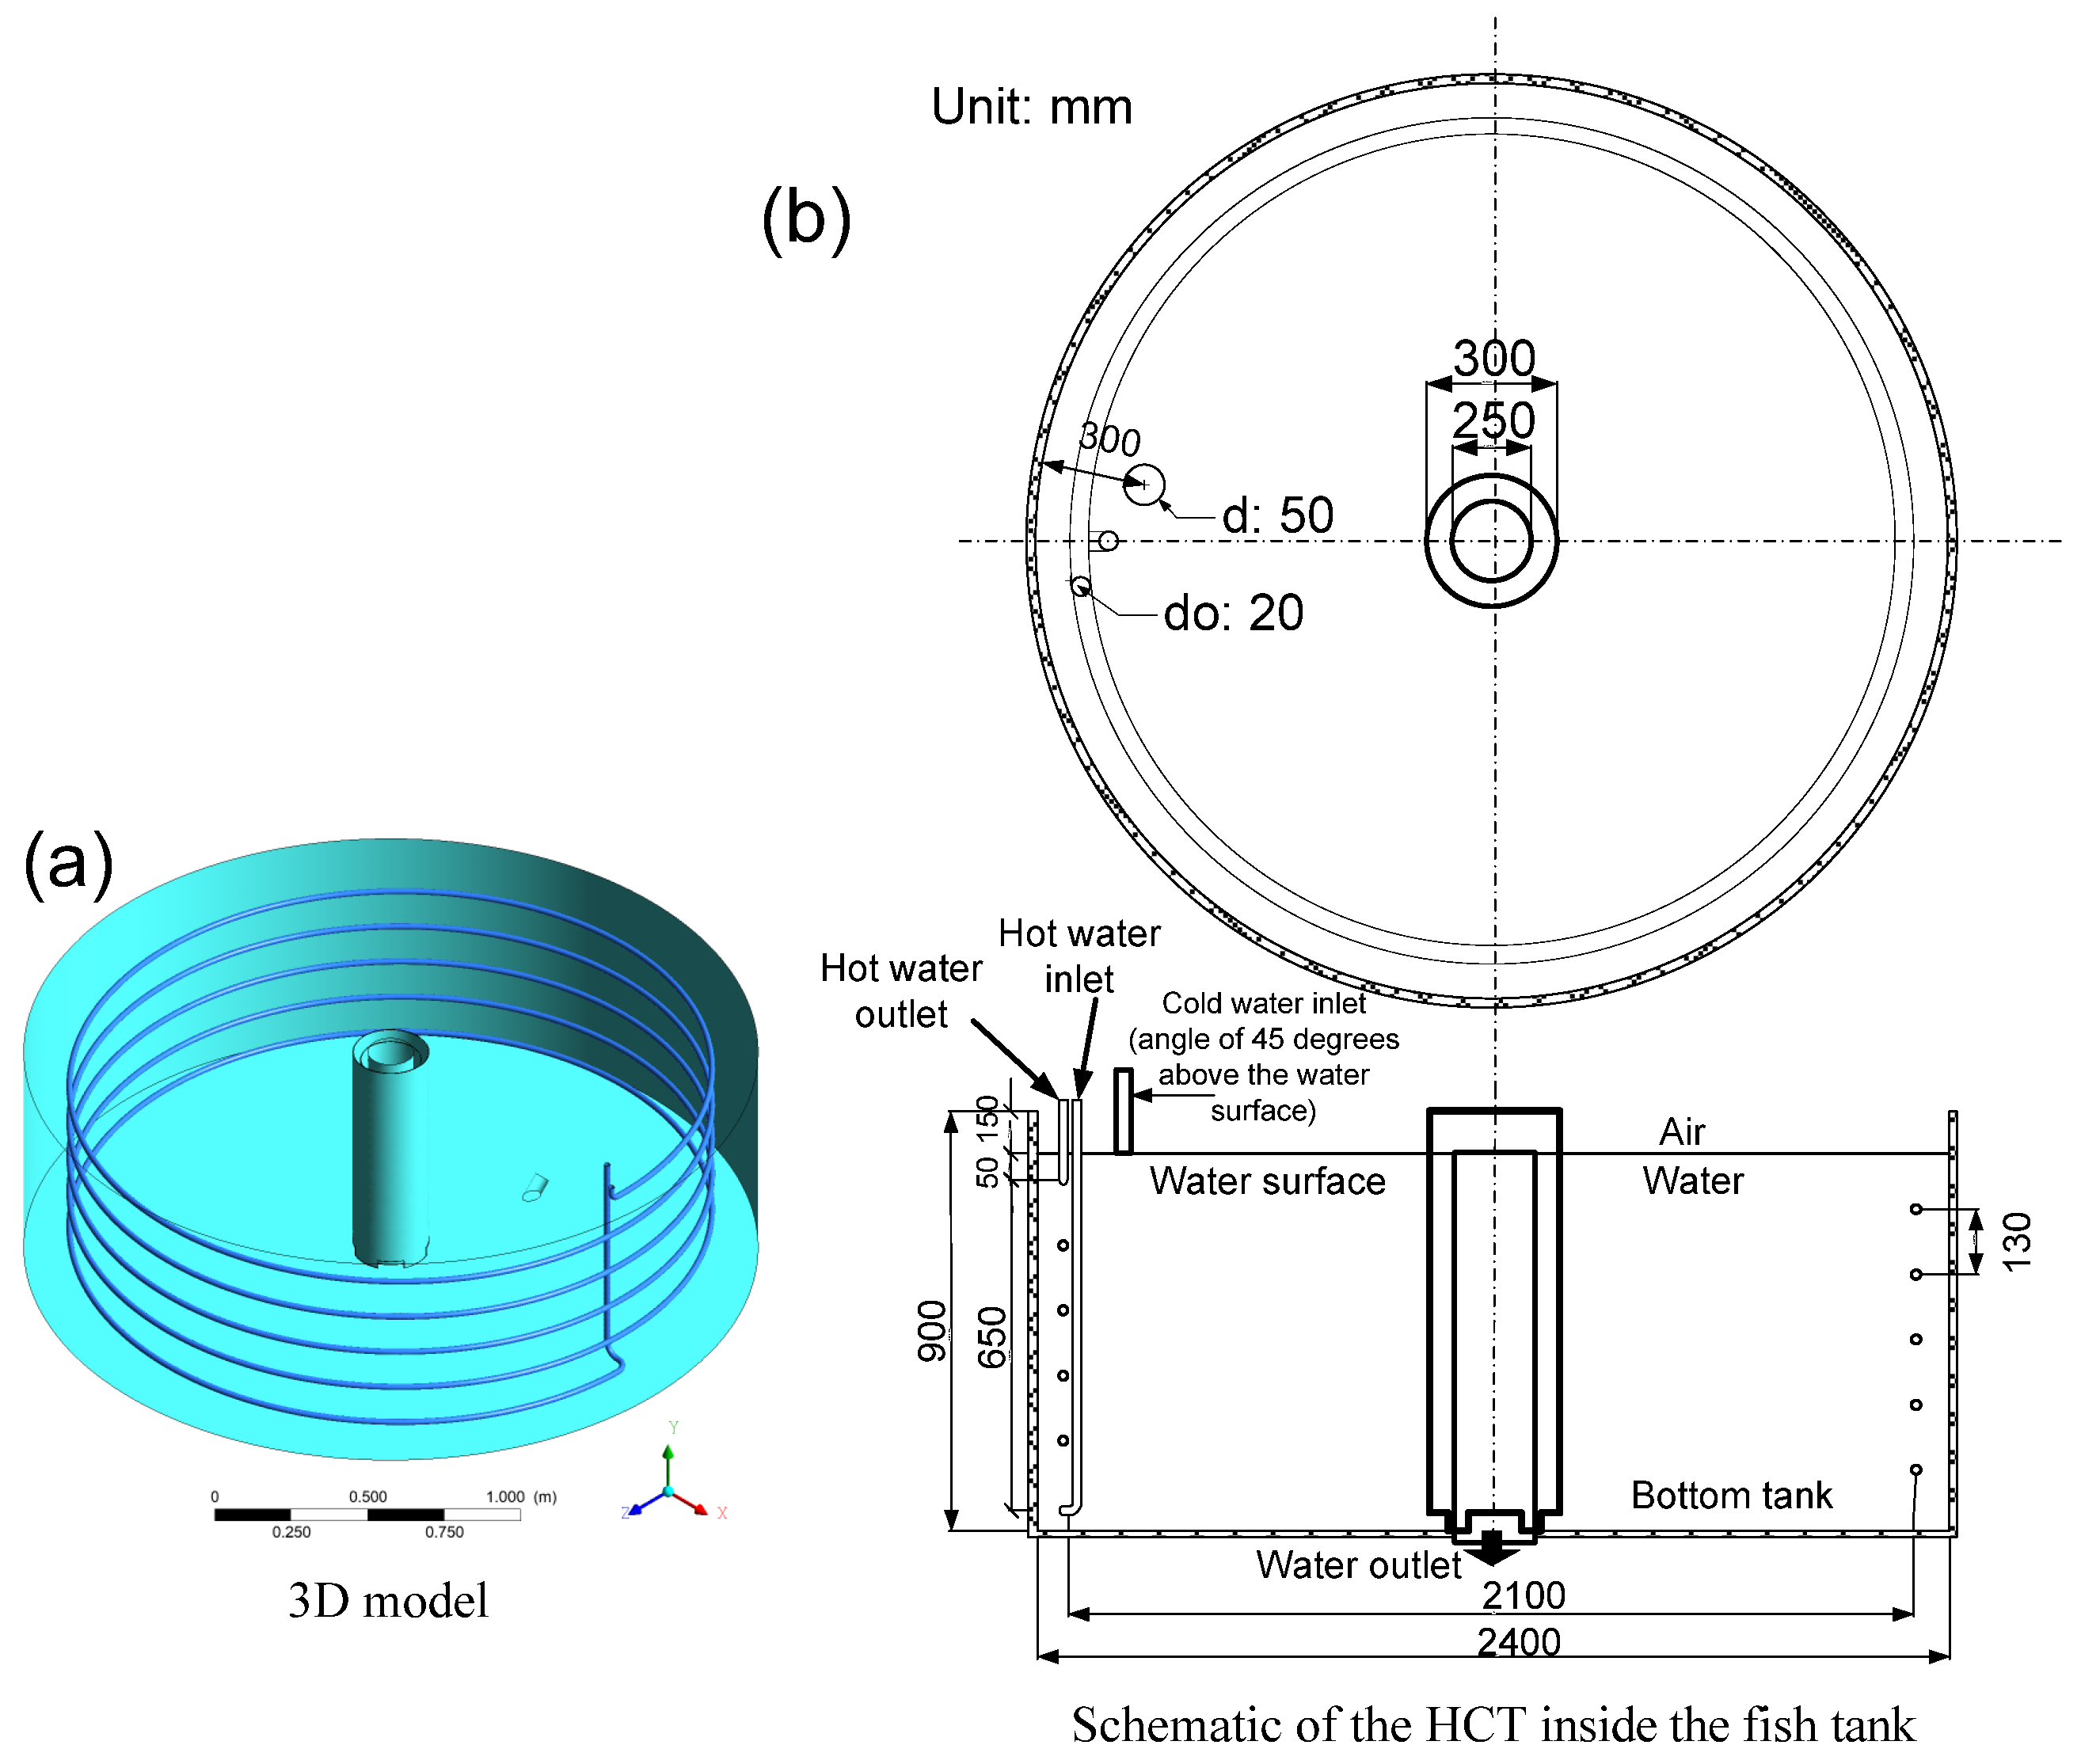
Figure 1. (a) Simulation model and (b) schematic of the helically coiled tube (HCT) inside the fish tank [15].
Energies 13 01958 g001
Figure 2. (a) Position of 24 test points on model 3D. (b) Diagram dimension of the 24 test points [15].
Energies 13 01958 g002
Figure 3. Cross section of the optimum grid for the analysis consisted of 8,107,644 cells and 4,092,668 nodes [15].
Energies 13 01958 g003
Figure 4. Operating condition of the hot water inlet for cases 9–11.
Energies 13 01958 g004
Figure 5. (a) Schematic of a thermal energy storage (TES) unit. (b) Photograph of the TES unit in Shouguang City.
Energies 13 01958 g005
Figure 6. Schematic of the heat exchanger between the fish tank and TES tank.
Energies 13 01958 g006
Figure 7. A photo of the experimental setup.
Energies 13 01958 g007
Figure 8. Instrumentation for the experimental setup.
Energies 13 01958 g008
Figure 9. Comparison between the experimental and CFD results of the hot liquid moving along the HCT from cases 6, 7, and 8. (a) Temperature variations during heat transfer. (b) Temperature at the selected points when the water in the fish tank was heated to 28 °C.
Energies 13 01958 g009
Figure 10. Measured temperature against the predicted temperature for all cases.
Energies 13 01958 g010
Figure 11. Comparison of the average temperature of the water in the tank in the experimental and simulation results. Mass flow rate inlet of the HCT: (a) 0.166 kg/s, (b) 0.244 kg/s, and (c) 0.332 kg/s.
Energies 13 01958 g011
Figure 12. Comparison of temperatures from the CFD and experimental results. (a) Temperature distribution of the water in the tank for cases 1–8. (b) Temperature measurement results of test points P9–12 during the heat transfer process for cases 6–8.
Energies 13 01958 g012
Figure 13. Heat transfer rate ( Q he ) of the experimental results against the CFD results for all cases.
Energies 13 01958 g013
Figure 14. Change ratios of the U 0 and t he values.
Energies 13 01958 g014
Figure 15. Comparison of Q t and η h e between CFD and experimental results for all cases.
Energies 13 01958 g015
Figure 16. (a) Comparison of Q T E S between the CFD and experimental results for all cases. (b) Evaluation of the usable energy efficiency of the tank water and the discharging energy of the TES tank.
Energies 13 01958 g016
Figure 17. Transient discharging energy efficiency of the TES tank.
Energies 13 01958 g017
Figure 18. Consumed electrical energy of pump HP2 for the heat exchanger process.
Energies 13 01958 g018
Table 1. Geometry dimension of the HCT [15].
ParameterValue
Coils diameter, D (m)2.1
Tube inner diameter, do (mm)20
Tube outer diameter, di (mm)19.4
Tube pitch, P (mm)130
Curvature ratio, δ (do/D)0.0095
Number of turns, N5
Tube length, L (m)34
Table 2. Operating conditions of hot water inlet for the heat exchanger.
CaseMass Flow Rate (Kg/s)Temperature (°C)HP1 Mode
Simulation Experiment (±2%)
10.1666060Turn on
20.249
30.332
40.1667070
50.249
60.332
70.1668080
80.2495554
90.16681–8781–87Turn off
1071–8171–81
1165–7565–75
Table 3. Maximum error of the average water temperature in the tank, time to heat the tank water in the computational fluid dynamics (CFD) model and experiment, and the time difference between the two results for all cases.
CaseMaximum Error of Temperature (%)Heat Transfer Time (min)Time Difference (min)
Simulation [15]Experiment (Present Work)
12.370628
22.547416
33.237334
43.146415
53.632293
63.426233
73.036324
82.462575
92.031283
103.038353
111.348435