Article

Asymmetric Information in Military Microgrid Confrontations—Evaluation Metric and Influence Analysis

1
College of Systems Engineering, National University of Defense Technology, Changsha 410073, China
2
China Academy of Launch Vehicle Technology, China Aerospace Science and Technology Corporation, Beijing 100076, China
3
Hunan Key Laboratory of Multi-Energy System Intelligent Interconnection Technology (HKL-MESI2T), National University of Defense Technology, Changsha 410073, China
*
Author to whom correspondence should be addressed.
Energies 2020, 13(8), 1954; https://doi.org/10.3390/en13081954
Submission received: 16 March 2020 / Revised: 4 April 2020 / Accepted: 8 April 2020 / Published: 15 April 2020
(This article belongs to the Section F: Electrical Engineering)

Abstract

:
Due to the wide integration of information technology in equipment and weapons, a stable and reliable power supply has become one of the pivotal factors in modern warfare to achieve victory. As a critical infrastructure to provide continuous energy supply during long-duration electrical outage, military microgrid always suffers fierce attacks from the enemy. In order to improve the defense effect, a lot of investigation has been made into resource allocation, Distributed Generator (DG) distribution, network reconfiguration, and so forth. Nevertheless, the information gap between defender and attacker has not been considered in the literature. Therefore, this paper is intended to highlight this information mismatch to appeal for community attention and evaluate its capability to improve defensive performance. Firstly, a novel assessment metric is proposed to identify the level of asymmetric information. Then, an Attacker-Defender (AD) model is developed to describe the zero-sum game between two opposite agents, which is subsequently tackled with dual theory and big-M method. Finally, three cases ranging from 6-bus to 57-bus are utilized for numerical experiments to analyze the influence of asymmetric information on military microgrid confrontation. Results on various levels of attack strength validated the effectiveness and significance of asymmetric information in eliminating the attack damage and improving the defensive performance.

1. Introduction

The military force of a country is founded primarily for protecting national territory and global interests from aggression and loss, but its task has gone far beyond that in recent years, including emergency rescue, humanitarian aid, public order maintenance, and so forth. Therefore, the intensity and scope of military operations keep increasing, resulting in the consumption of all sorts of fossil fuel skyrocketed to great heights [1]. It has been reported that the United States Department of Defense (DOD) is the largest single energy consumer in the country [2]. In order to deliver petroleum products to forward operation and stationary bases, soldiers need to risk their lives in midway due to unexpected explosions caused by the enemy. Furthermore, a considerable amount of fuel will be exhausted during the transportation trip. On the other hand, consisting of various energy sources and storage units that may work in a coordinated manner to support loads, a microgrid provides a lot of prominent benefits, for example, island ability, reliability, security, and utilization of Renewable Energy Sources (RES), and so forth. Of which the most crucial is providing continuous energy supply during long-duration electrical outage, which is of great significance in real warfare since the domestic electric grid is always the first to be hit as critical infrastructures. Therefore, driven by the motivation to improve security and efficiency, a lot of demonstration projects are implemented by DOD [3], including the Smart Power Infrastructure Demonstration for Energy Reliability and Security (SPIDERS) Joint Capability Technology Demonstration (JCTD) [4], Fort Sill Microgrid Demonstration [5], and Environmental Security and Technology Certification Program (ESTCP) [3]. Due to profound advantages of microgrid and the vast leading effects of US DOD, microgrid has been constructed in a lot of countries for military utilization in the last five years [1,6,7].
Generally, microgrid is immune to unforeseen cascading failures in central grid due to its island capability. Nevertheless, it is still vulnerable when faced with targeted attacks, for example, cyber and physical (CP) actions to cut the real-time balance between energy generation and consumption. Compared with domestic grid, microgrid has a smaller capacity and inertia, thus it is more sensitive to power imbalance. Therefore, microgrid security concern has been proposed and investigated in the community of academic, industry, and military.
In Reference [8], the CP attack was categorized into three types: physical attack, cyberattack, and human attack. The operation through or against people who are related to power system is termed as ‘human attack’, including bribery, threat, and social engineering, and so forth. Cyberattack launches action to disrupt the availability, integrity, and confidentiality of Supervisory Control and Data Acquisition (SCADA) system, of which the most popular ones are: denial of service/distributed denial of service (DoS/DDoS) attack [9], false data injection attack [10], load redistribution attack [11], traffic analysis, and cracking password, and so forth. Physical attack affects the system via invaliding component and equipment, such as tripping line [12], isolating bus, disconnecting generator, and damaging transformer, and so forth. For more details, the interested reader is referred to References [13,14]. In addition to CP attack, natural disasters, such as hurricane and flood, are popular factors to induce power outage [15]. A comprehensive review of the impacts of natural disasters on power system is generated in Reference [16].
Although cyberattack gained the most attention in the literature, physical attack is the most popular method in military microgrid confrontation between defenders and attackers due to the following two reasons: (1) The communication network of military microgrid is physically isolated with the Internet, thus cyberattack is very hard or almost impossible to implement; (2) Human attack is also very difficult since the spy is trained to gain more valuable information. Consequently, tripping a line with a bomb turns to be a direct and the most effective method, which is then regarded as the type of attack for consideration in this paper.
Concentrated on a fixed type of attack, there is a zero-sum game between two opposite agents: defender and attacker. A tri-level optimization model is proposed to identify the optimal allocation strategy of defending resources in Reference [17], where coordinated attacks including physical short-circuiting of transmission lines and intruding of communication network are considered. In Reference [18], malicious attack is alleviated via optimal Distributed Generator (DG) islanding and network topology reconfiguration, where a Defender-Attacker-Defender (DAD) model is developed and addressed by the Column and Constraint Generation (CCG) method [19]. Following on from the combination of DAD and CCG, the single wave of attack is extended to multi-period by Reference [20], where defensive transmission lines and DGs are respectively planned and allocated to mitigate the multi-period attack damage. In Reference [21], the role of Battery Energy Storage Systems (BESSs) in enhancing microgrid robustness in overcoming attacks is investigated, where four participants are included in a framework involving interactions between a robustness-oriented economic dispatch model and a bilevel Attacker-Defender (AD) model. In Reference [22], the problem of allocating fortification resources in power grid for the purpose of maximizing its immunity against malicious attack is investigated, resulting in a two-stage optimization model with the capability of generalizing several other network fortification problems and the corresponding exact solution algorithm.
Although sophisticated problems, models, and algorithms are reported in the above literature, there is an implicit assumption that the attacker is informed with full information of the target system, for example, the topology, generator capacity, load amount, branch distribution, and other component parameters, and so forth, which is impossible in most cases of real confrontation. Actually, there is an information gap between attacker and defender in military microgrid confrontation since deception strategies are ubiquitous in the battlefield. In order to highlight this information mismatch to appeal for community attention and evaluate its capability to improve defensive performance, the information possessed by defender and attacker is defined as symmetric and asymmetric information in this paper, and the impact of asymmetric information in military microgrid confrontation is comprehensively investigated.
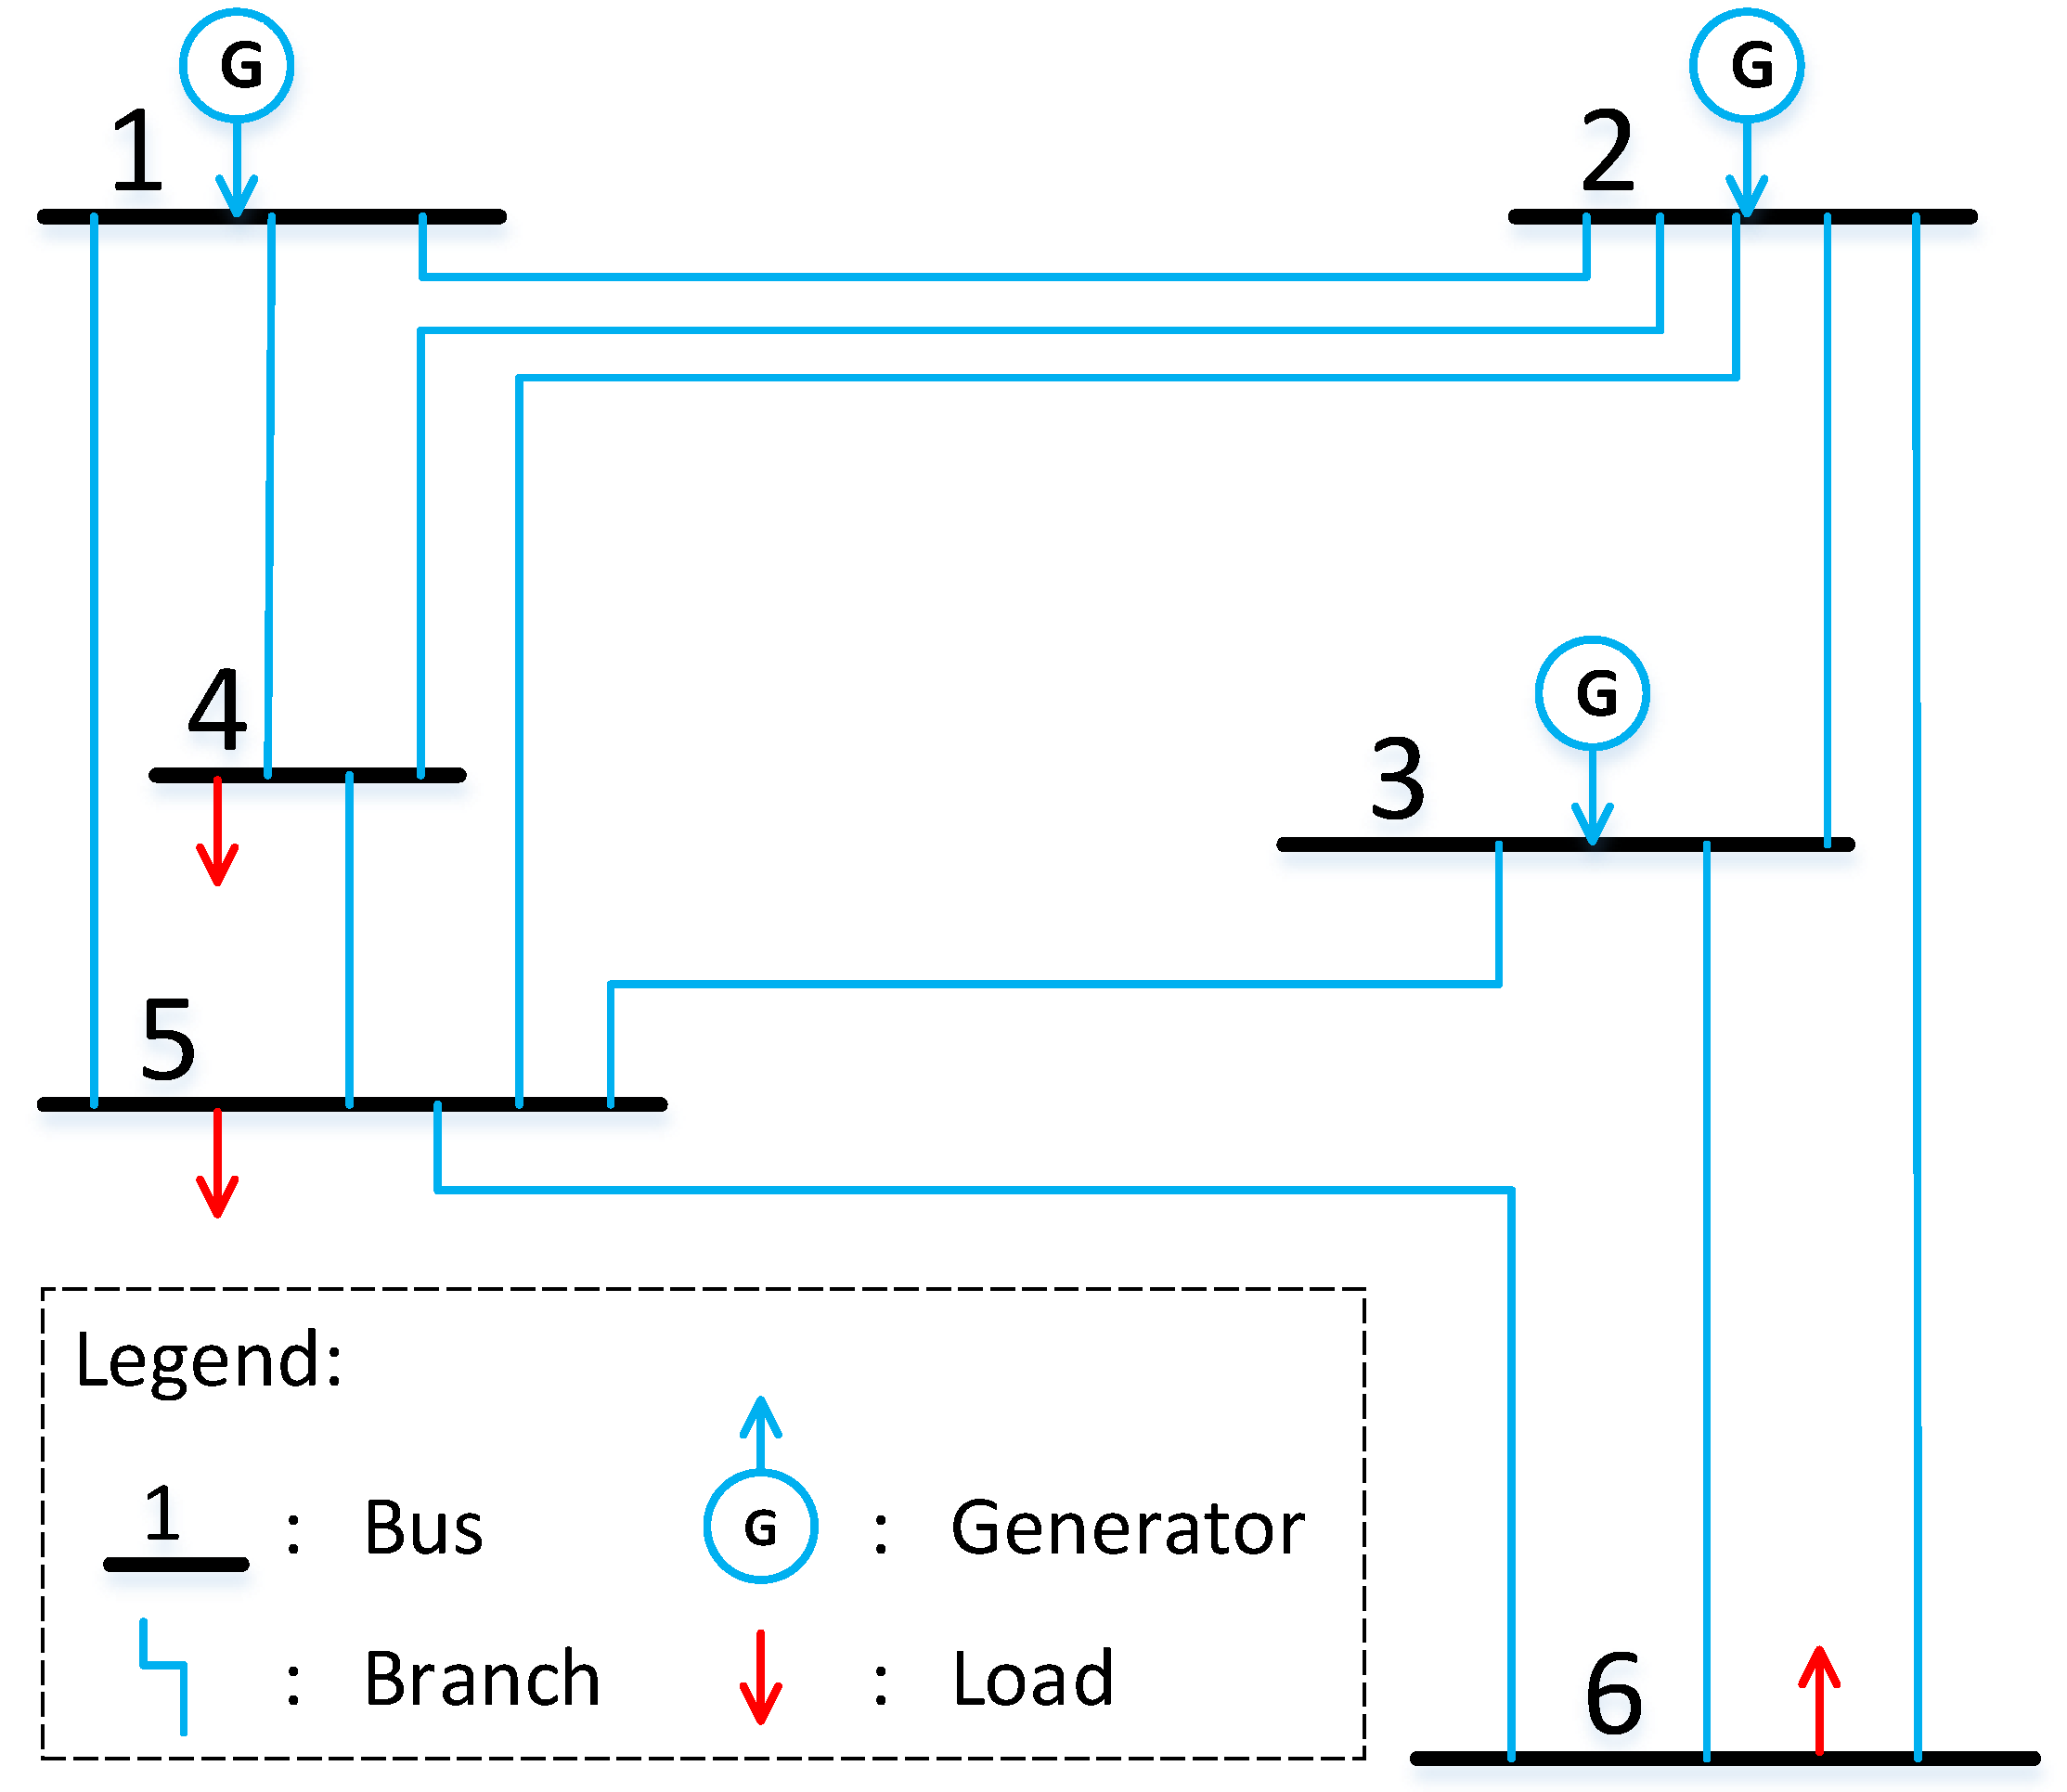
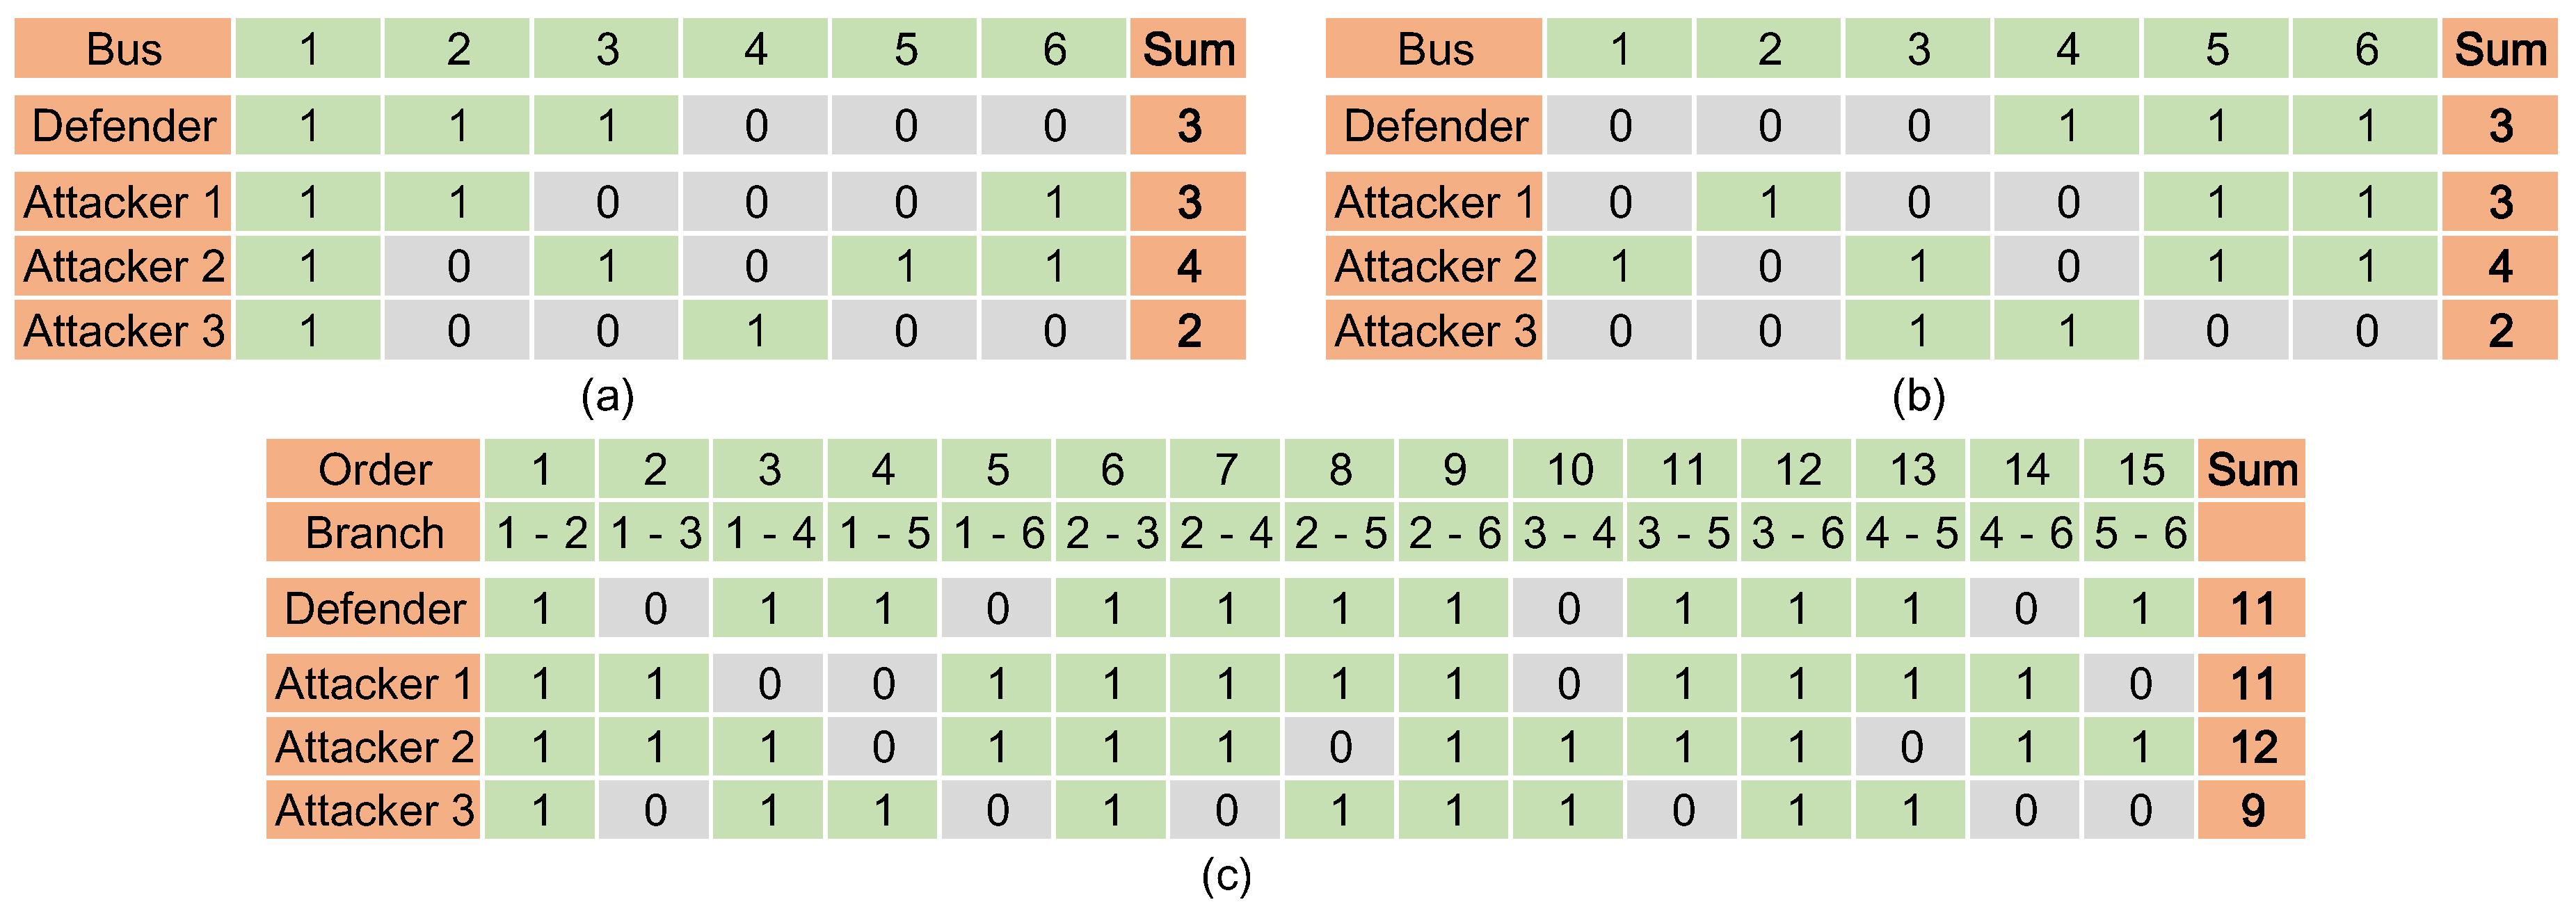
Since asymmetric information in military microgrid confrontation has not been numerically investigated before, an assessment metric should be defined, which consists the first contribution of this paper. The asymmetric and symmetric information are abstracted as binary vectors, then the distance between them is naturally determined as assessment metric. However, after testing on a 6-bus demo system, various traditional vector distance definitions, for example, Minkowski distance, Hamming distance, and Jaccard distance, and so forth, are not suitable for the case in this paper since they cannot identify full characteristic of information mismatch. Therefore, a novel definition of binary vector distance combining coverage rate and deviation rate is proposed in this paper as the assessment metric of asymmetric information.
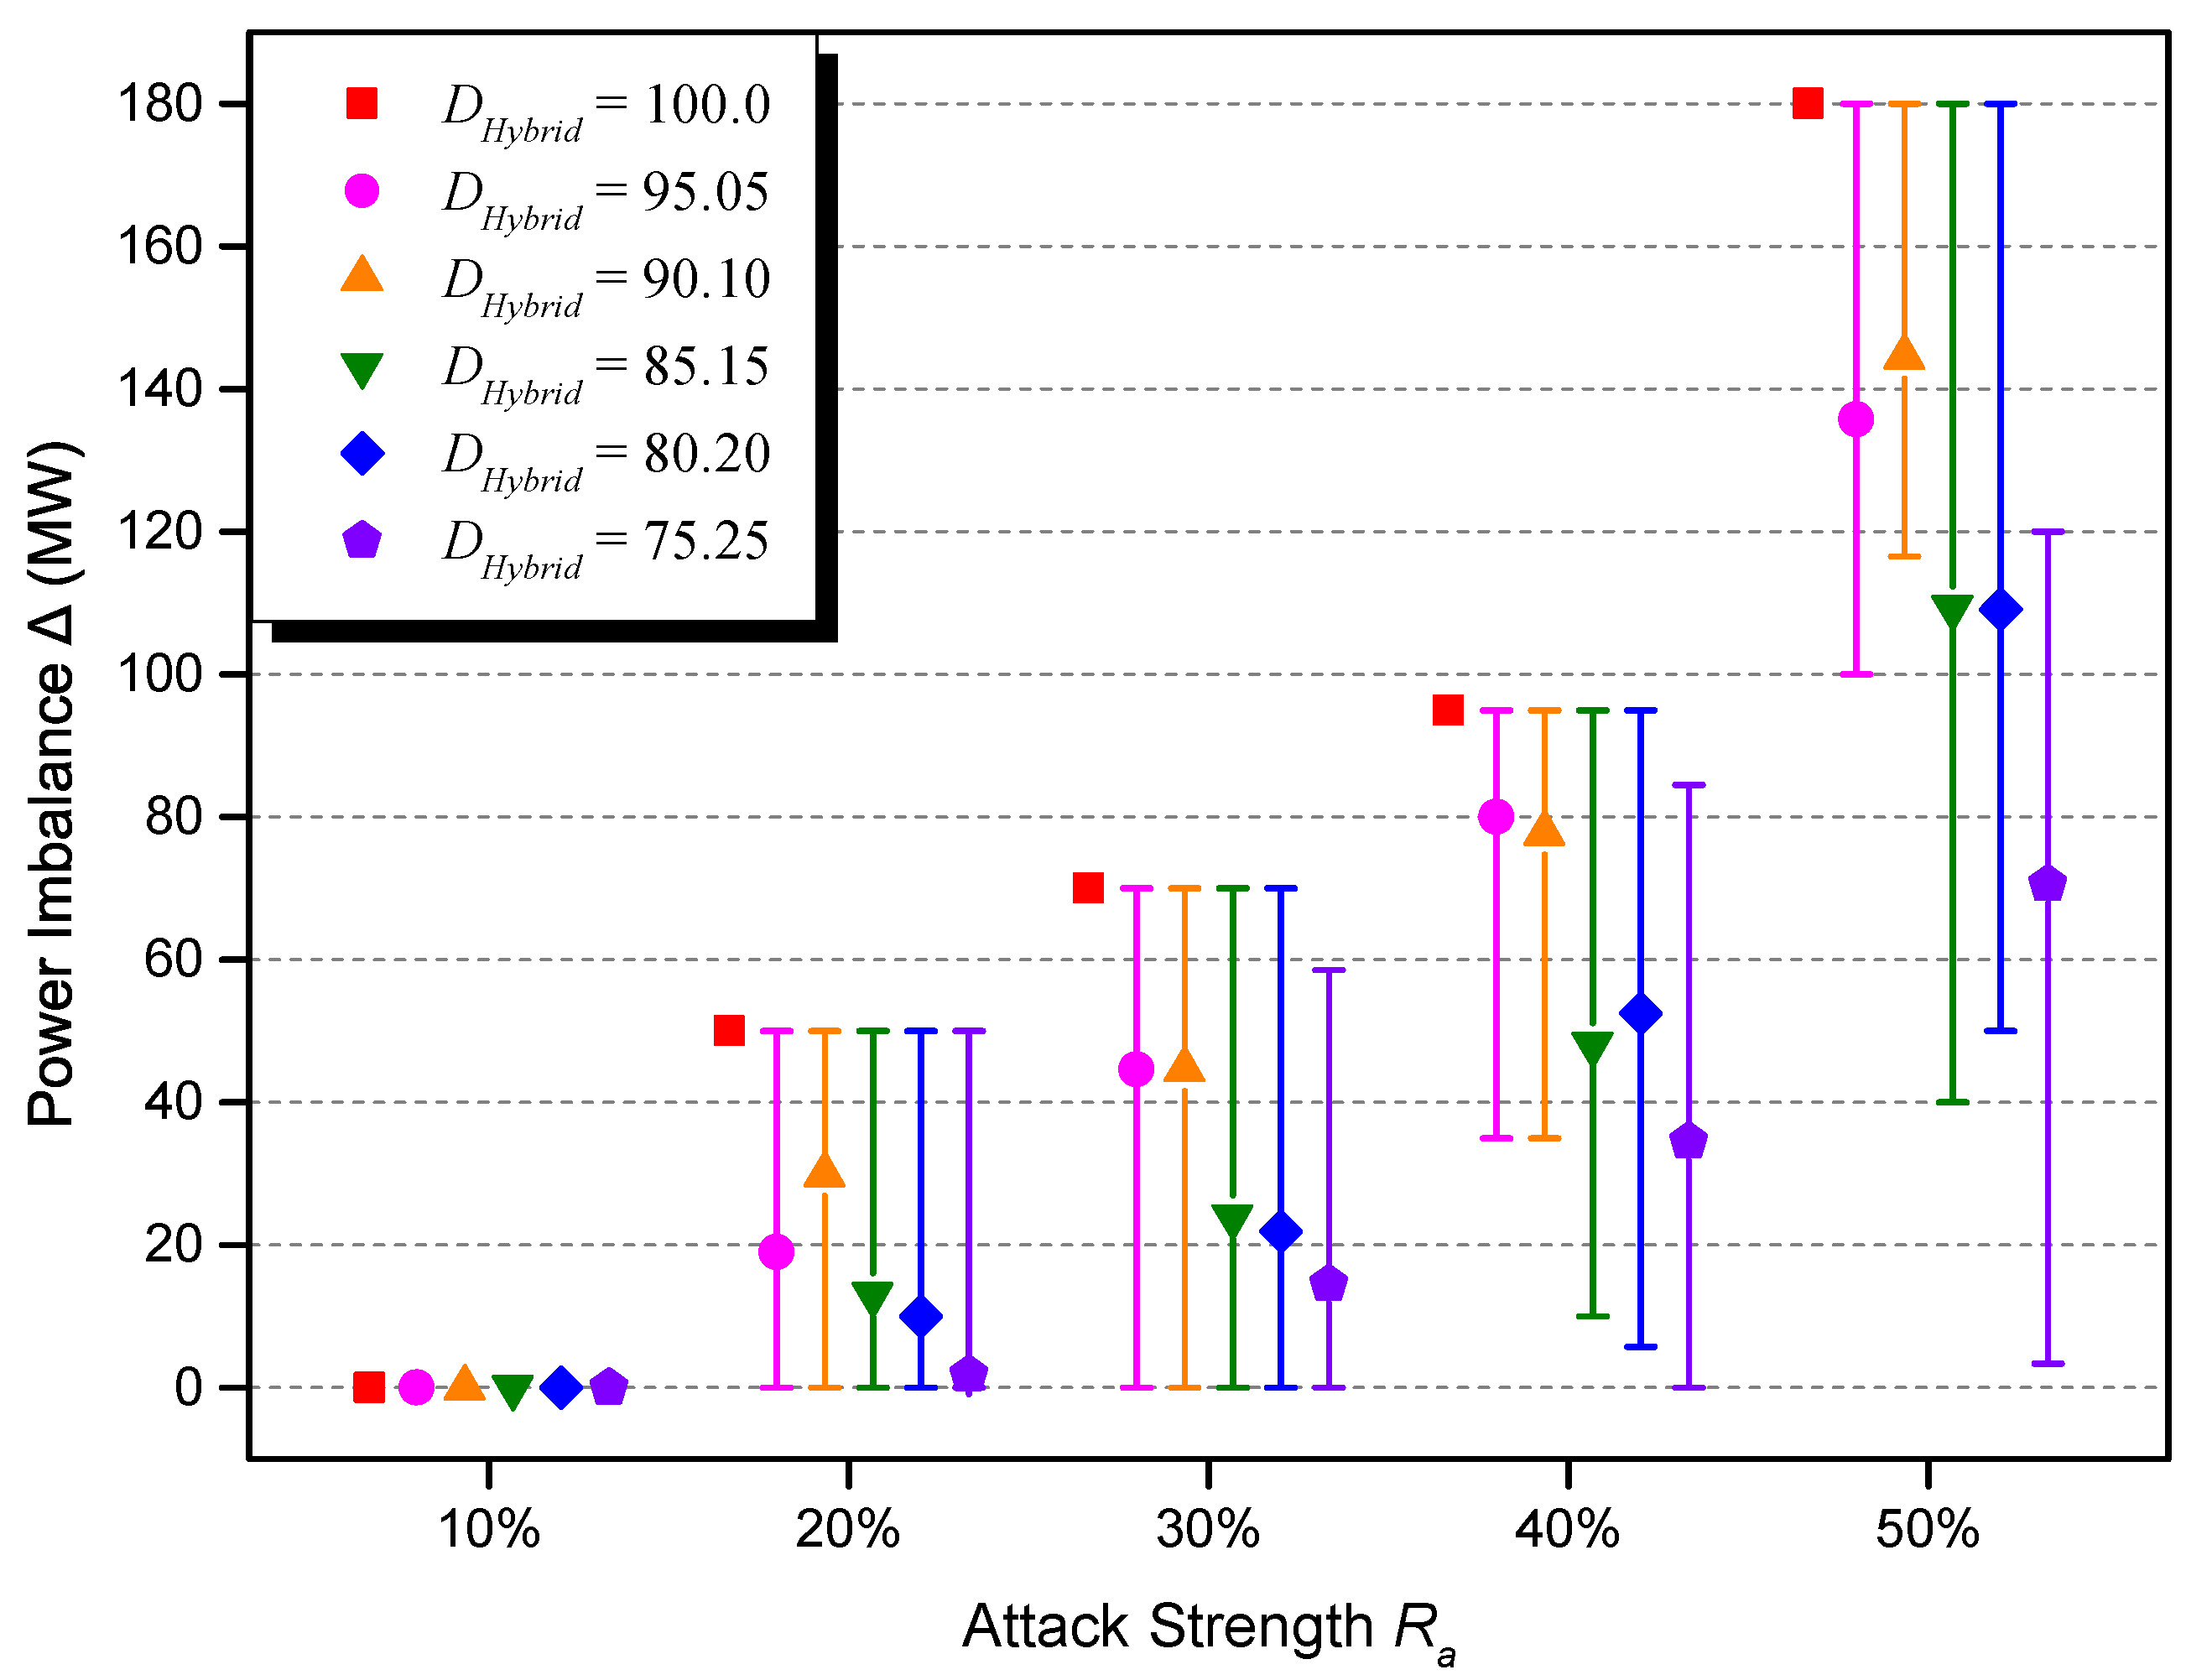
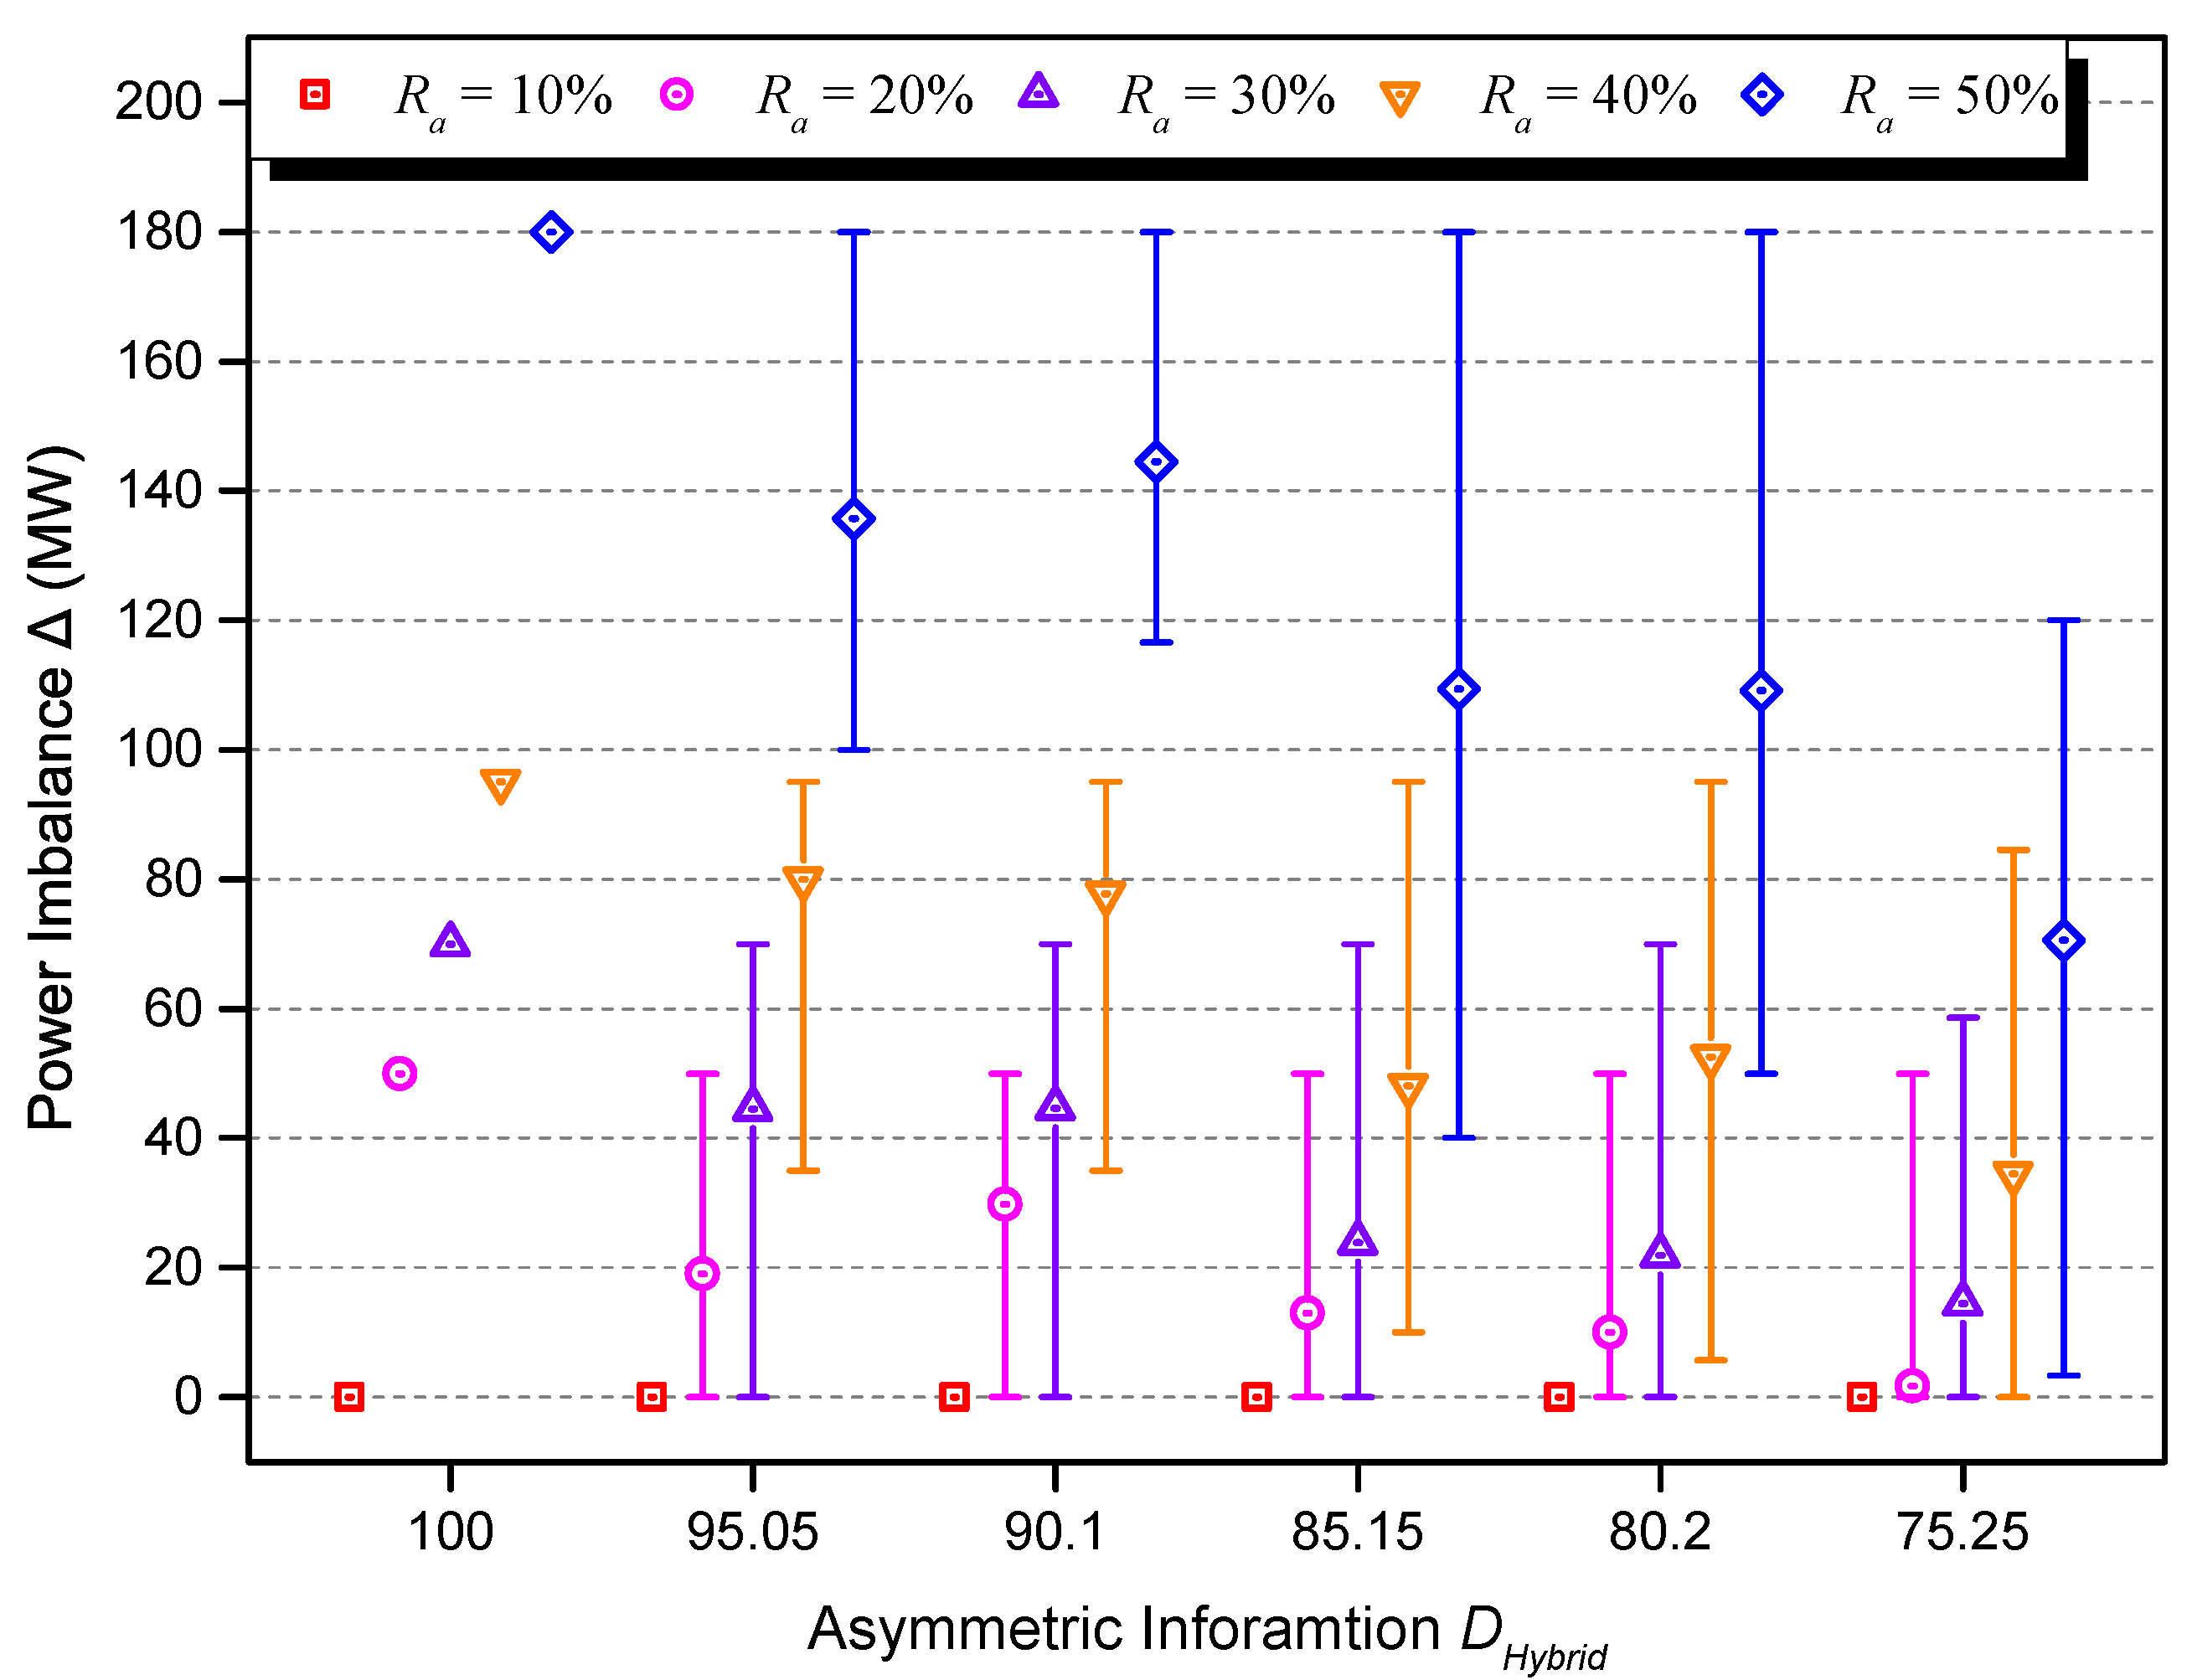
In order to analyze the influence of asymmetric information in military microgrid confrontation, the game between defender and attacker is formulated as an AD model. Based on dual theory and big-M method, the bilinear m a x m i n AD model is evolved into a single level Mixed Integer Linear Programming (MILP) problem and tackled with commercial solver Cplex. Set the symmetric information of 6-bus, 24-bus, and 57-bus systems as benchmark, the influence of asymmetric information is quantitatively analyzed based on a lot of numerical experiments, which is the second contribution of this paper. Based on simulation results on various levels of attack strength and asymmetric information across all three systems, the effectiveness and significance of asymmetric information in eliminating attack damage and improving defensive performance have been validated.
The rest of this paper is organized as follows. Section 2 reveals the information involved in military microgrid confrontation and proposes assessment metric on the basis of comparison and analyses. Based on the AD model of microgrid confrontation, solution methodology to analyze the influence of asymmetric information is provided in Section 3. Three cases including 6-bus, 24-bus, and 57-bus systems are employed for numerical experiment in Section 4, with results are presented and discussed. Section 5 concludes this paper.

2. Assessment Metric of Asymmetric Information

Microgrid confrontation is ubiquitous ranging from industry to military, where terrorists and enemies are typical attackers taking cyber and physical actions respectively. Based on years of training and practicing, attackers might be sophisticated and professional, but the attack decision and action cannot be made without comprehensive recognition of the target system. Therefore, the microgrid information/data is of great significance for attackers. In order to illustrate what information is involved in the microgrid confrontation, a military conflict scenario is introduced. However, due to the extensive utilization of defensive and deception strategies, there is an information gap between defender and attacker, which is very important in real confrontation and should not be omitted. Thus, how to quantitatively analyze the asymmetric information is investigated in this section.

2.1. Information Involved in the Microgrid Confrontation

In the era of information, IT equipments are playing fundamental roles in modern warfare. Generally, IT devices are powered by electricity, thus microgrid is widely built to provide reliable, continuous, and stable electricity. On the other hand, in order to grasp the initiative in a war, disabling all types of IT equipment is the most common and efficient strategy. Therefore, microgrid always suffers various types of attacks from the enemy. Correspondingly, defense operations will be taken by the defender.
In the confrontation of microgrid, a lot of information will be utilized by both sides to make rational decisions, including network topology, nodal feature, branch attribute, generator/load characteristic, and so forth. In order to facilitate the description, a 6-bus system retrieved in Reference [23] is employed as an example, whose topology is shown in Figure 1.
As shown in Figure 1, the system includes 6 buses, 11 branches, 3 generators, and 3 loads. In the smart grid era, distributed generators and battery storage systems will be placed as well to improve the robustness, for example, minimizing the unserved load. Although the sum number of components is revealed in Figure 1, a lot of physical quantity is still unknown, such as generator capacity, load level, branch power flow limit, and so forth. In reality, the accurate information of system topology is very hard to be squeezed by enemies, not to mention other detailed physical data. Therefore, the scope of this paper on asymmetric information analysis is restricted in topology level based on the following assumptions.
  • Assumption 1: The number of buses is recognized by enemies, that is, the number of nodes is exposed and fixed during the microgrid confrontation.
  • Assumption 2: The detailed physical quantity of each equipment is inaccessible by enemies, thus from the perspective of an attacker, each branch/generator/load is indifferent and the average data will be utilized.
Generally, the node is very difficult to conceal, thus Assumption 1 is proposed to provide a basic framework for this research. The accurate information of each component can only be achieved by physical measurement or document retrieval, but both methods are impractical for enemy to implement, thus Assumption 2 states that the detailed physical quantity is inaccessible. Although the exact data cannot be gained, estimation is much easier, therefore the average data is employed by enemy according to Assumption 2. It should be noted that both assumptions are proposed to facilitate the description and demonstration, and the methodology of asymmetric information analysis can still be established without these assumptions.

2.2. Assessment Metric

In terms of microgrid data, the defender has full access permission, thus the topology information obtained by him/her is accurate and utilized as the reference for asymmetry analysis. On the other hand, the attacker is trying to collect microgrid information via satellite observation, Unmanned Aerial Vehicle (UAV) detection, and espionage, and so forth. Since the successful implementation of each method depends on political, technical, meteorological, and geographical conditions, the accuracy of acquired data cannot be guaranteed. Figure 2 illustrates the asymmetric information on system topology between attackers and defenders. For each sub-figure, defender is regarded as the benchmark with respect to the total number (sum) and position (binary numbers: 1 represents there is a generator/load/branch, and 0 otherwise). It can be observed that attacker 1 has accurate information on the sum, but the distribution exists a minor deviation. Attacker 2 and 3 has a bigger and smaller estimation of system scales respectively, resulting in the inaccurate assessment of component number and location.
Based on Figure 2, it is obvious that the system topology information can be generated as binary row vectors, for example,  x = [ 1 1 1 0 0 0 ] and y = [ 1 1 0 0 0 1 ] for defender and attacker 1 in Figure 2a. Therefore, the asymmetric information between attacker and defender can be represented by the distance between vectors x and y .
Traditionally, vector differences can be measured by a lot of methods, of which the most popular one is Minkowski distance:
D M i n k o w s k i = j = 1 n x j y j p p ,
where n is the total number of elements in vector x ; p takes the value of 1 , 2 , 3 , , to identify various types of definition.
If p = 1 , the Minkowski distance evolves into city block distance:
D C i t y b l o c k = j = 1 n x j y j .
If p = 2 , the Minkowski distance emerges into Euclidean distance:
D E u c l i d e a n = ( x y ) ( x y ) T .
If p = , the Minkowski distance results into Chebychev distance:
D C h e b y c h e v = m a x x j y j j = 1 n .
In addition, other types of vector distance definitions are popular in the literature, such as Cosine distance (5), Hamming distance (6), and Jaccard distance (7).
D C o s i n e = 1 x y T x x T y y T ,
D H a m m i n g = # x j y j j = 1 n n ,
D J a c c a r d = # x j y j j = 1 n x j 0 j = 1 n y j 0 j = 1 n # x j 0 j = 1 n y j 0 j = 1 n ,
where # { } is an operator counting the number of elements in the set enclosed by braces.
All the above distance definitions are employed to identify the asymmetric information between attacker and defender in the 6-bus system, and results are summarized in Table 1.
It can be seen from Table 1 that D C h e b y c h e v is constant for all cases, thus nothing can be generated in terms of the sufficiency of information between different attackers. For generator and load information, D C i t y b l o c k , D E u c l i d e a n , and  D H a m m i n g cannot distinguish the difference between attacker 2 and 3. To sum up, D C o s i n e and D J a c c a r d gain better performance in this dataset. However, they are far away to be nominated as a candidate to evaluate binary vector distances in this research since the obtained single value might be resulted by two completely opposite scenarios. For example, if 
x = [ 1 1 1 1 1 1 1 1 1 1 0 0 0 0 0 ] , y 1 = [ 1 1 0 0 1 1 0 0 1 1 0 0 0 0 0 ] , y 2 = [ 1 1 1 1 1 1 1 1 1 0 1 1 1 1 1 ] ,
there has D J a c c a r d ( y 1 ) = 0.4 and D J a c c a r d ( y 2 ) = 0.4 ; however, y 1 and y 2 are totally different since the former attacker missed 4 real branches while the latter included 5 fake circuits.
To address the above concerns, a novel definition of vector distance (8) is proposed in this paper.
D H y b r i d = f # x j = 1 j = 1 n y j = 1 j = 1 n # x j = 1 j = 1 n × 100 + # x j = 0 j = 1 n y j = 1 j = 1 n # y j = 1 j = 1 n + ϵ = 100 · f ( A ) + B , ,
where f ( A ) is a function rounding A to 2 digits to the right of the decimal point, that is,  f ( A ) = r o u n d ( A , 2 ) in Matlab; ϵ is an arbitrary small positive number. Examples of f ( ) and ϵ can be given as f ( 0.9735 ) = 0.97 and ϵ = 0.001 . In order to give a full explanation of Equation (8), the following questions are proposed and answered:
  • What is A? The numerator of A is # x j = 1 j = 1 n y j = 1 j = 1 n , showing the number of real components confirmed by attacker. The denominator is the total number of elements in vector x . Therefore, A is defined as coverage rate from the viewpoint of defender, representing how much real information has been identified.
  • What is B? The numerator of B is # x j = 0 j = 1 n y j = 1 j = 1 n , representing the number of fake components (it is not exist in reality but incorrectly confirmed by attacker). The denominator is the total number of elements in vector y . Therefore, B is defined as deviation rate in respect to attacker, indicating how much fake information has been introduced.
  • Why is the function f ( ) employed? According to the mathematical formulation, the range of A is valued in [ 0 , 1 ] . In terms of precision concerns, 2 digits after decimal point is acceptable. The reason to utilize function f ( ) is cutting tail to avoid duplicates in the following addition operation 100 · f ( A ) + B .
  • Why is the term × 100 utilized? Combined with f ( ) , the reason to include × 100 is eliminating duplicate numbers. Due to the rounding operation, values f ( A ) are fixed into 101 discrete numbers 0.00 , 0.01 , 0.02 , , 0.98 , 0.99 , 1.00 . By multiplying 100, the term 100 · f ( A ) turns into an integer in [ 0 , 100 ] , while B is decimal, thus adding these two terms will deduce a unique number and the addition operation is reversible, which means given a number within the domain of D H y b r i d [ 0.00 , 101.00 ) , the values of A and B can be exactly derived. For example, if  D H y b r i d = 97.4323 , there have A = 0.97 and B = 0.4323 .
  • Why is the term + ϵ introduced? ϵ is included to restrict the range of B is [ 0 , 1 ) , that is, eliminating the number B = 1 . If B can arrive at 1, the duplication might arise in some special cases. For instance, D H y b r i d = 98.00 can be interpreted as [ A , B ] = [ 0.97 , 1.00 ] or [ A , B ] = [ 0.98 , 0.00 ] , resulting completely opposite conclusion for B. Therefore, by adding ϵ , B = 1.00 is evolved into 1 1 + ϵ < 1.00 , the value D H y b r i d = 98.00 can only be interpreted as [ A , B ] = [ 0.98 , 0.00 ] .
According to the vector distance definition (8), the value of D H y b r i d can be decoded into integer and decimal parts, representing coverage and deviation rate respectively. From the attacker’s point of view, one prefers a higher coverage rate and lower deviation rate, thus D H y b r i d = 100.00 is optimal, meaning accurate microgrid information is acquired. Based on coverage and deviation rates, the quality of D H y b r i d can be quickly identified. In order to facilitate quality identification, a fitness function is proposed in (9), and the corresponding variation tendency along with D H y b r i d changing is given in Figure 3.
V F i t n e s s = A B .
In Figure 3, there is a red baseline V F i t n e s s = 0 , indicating the coverage rate is equal to deviation rate, thus it can be regarded as an acceptance line. If  A < B , the quality of information is poor and the attack action may conduct on fake components; if A > B , the attacker may implement a threatening attack based on the obtained information.

3. Influence Analysis of Asymmetric Information on Microgrid Confrontation

It is known in Section 2 that the asymmetric information between attacker and defender can be measured by binary vector distance D H y b r i d . Nevertheless, the impact of D H y b r i d on microgrid confrontation is still waiting to be discovered. To fill this gap, a mathematical model of microgrid confrontation is developed in this section, where the attack strength is sensitive to the accuracy of acquired information. Therefore, by comparing the attack effectiveness derived from symmetric and asymmetric information, impacts can be identified and analyzed.

3.1. Confrontation with Symmetric Information

In a microgrid confrontation, the attacker is always trying to maximize the unserved power via various types of assault, and the defender utilizes Optimal Power Flow (OPF) tools to minimize the power imbalance. Different kinds of attacks can result in the invalidation of generator, load, and branch, and so forth. In this paper, the attack action to destroy circuits is investigated as a representative. On the other hand, OPF strategies to redispatch generator and branch power flow is employed by defenders. Therefore, the mathematical model of microgrid confrontation in accordance with References [24,25,26,27,28,29] is formulated as follows:
max z l Δ s u b j e c t t o :
z l = { 0 , 1 } ; l L
l L z l N
Δ = min p i , f l , S b + , S b , θ f r ( l ) , θ t o ( l ) b B S b + + S b s u b j e c t t o :
i I | b u ( i ) = b p i + l L | t o ( l ) = b f l l L | f r ( l ) = b f l S b + + S b = D b : ( β b ) ; b B
f l = ( 1 z l ) γ l ( θ f r ( l ) θ t o ( l ) ) : ( π l ) ; l L
F l f l F l : ( σ l , ϕ l ) ; l L
0 p i P i : ( μ i ) ; i I
S b + 0 , S b 0 ; b B . } .
where the definition of utilized indexes, sets, parameters, and decision variables are summarized in Table 2.
The objective function (10) to be maximized is the system power imbalance after attack. Constraint (11) restricts the decision variable to be binary. Due to limited resources and budget, constraint (12) states that the maximum number of actions can be implemented is N. Equation (13) defines the system power imbalance as the sum of nodal unserved power, which is the objective function of the OPF minimization subproblem as well. The nodal power balance equation is formulated as constraint (14) according to Kirchhoff’s Current Law (KCL). Equation (15) defines the DC power flow for each branch. Constraints (16), (17), and (18) give the lower and upper limit for branch power flow, generator output power, and nodal power surplus/deficit, respectively.
The optimization problem (10)–(18) is a two-level AD model: the upper-level (10)–(13) represents the attacker’s decision to maximize the system power imbalance; the lower-level (13)–(18) corresponds to the defender’s OPF reaction strategy. It should be noted that the lower-level problem is parameterized by the upper-level decision variables z l .
Although both objective function and constraint of optimization problem (10)–(18) are linear, the optimization problem (10)–(18) cannot be tackled by the majority of off-the-shelf solvers, for example, Cplex, Matlab, and Lingo, and so forth, due to its mixed-integer bilinear m a x - m i n property. Therefore, the dual theory is utilized in this paper to reformulate the lower-level minimize problem into a maximize one, facilitating the transformation from m a x - m i n to m a x - m a x . Since two two-level maximize problem can be easily merged into a single-level one, resulting in a MILP problem, which is suitable for commercial and open-source solvers. In addition to dual theory, the Karush–Kuhn–Tucker (KKT) condition can also be employed to perform the transformation as well.
According to dual theory, the single-level maximize equivalent problem is given as:
Δ = max z l , β b , π l , σ l , ϕ l , μ i b B D b β b l L F l σ l l L F l ϕ l i I P i μ i s u b j e c t t o :
z l = { 0 , 1 } ; l L
l L z l N
β b u ( i ) μ i 0 ; i I
β t o ( l ) β f r ( l ) + π l + σ l ϕ l = 0 ; l L
1 β b 1 ; b B
l L | t o ( l ) = b 1 z l γ l π l l L | f r ( l ) = b 1 z l γ l π l = 0 ; b B
σ l , ϕ l 0 ; l L
μ i 0 ; i I ,
where constraints (20)–(21) are identical with upper-level constraints (11)–(12), whereas (22)–(25) are dual constraints corresponding to primal variables p i , f l , S b + , S b , and  θ , respectively.
Although the optimization problem (19)–(27) is single-level, it is nonlinear due to the production term z l π l in constraint (25) between binary and continuous variables. For the sake of generating MILP, linearizion process should be implemented, that is, substituting (25) with the following constraints:
l L | t o ( l ) = b γ l π l γ l τ l l L | f r ( l ) = b γ l π l γ l τ l = 0 ; b B
M ( 1 z l ) τ l π l M ( 1 z l ) ; l L
M z l τ l M z l ; l L ,
where τ l is introduced to replace z l π l ; M is a big positive number; constraints (29)–(30) are included to guarantee the equivalence between τ l and z l π l , that is, achieving τ l = z l π l .
Finally, the mixed-integer bilinear m a x - m i n problem (10)–(18) is converted into a standard MILP as:
O b j e c t i v e : E q . ( 19 )
C o n s t r a i n t s : E q . ( 20 ) ( 24 ) , E q u a t i o n ( 26 ) ( 27 ) , E q u a t i o n ( 28 ) ( 30 ) .

3.2. Confrontation with Asymmetric Information

Take branch data into consideration, the asymmetric information means the attacker obtained dataset L is different from the reality, that is,  L L . In order to evaluate the impact of asymmetric information, the following two steps should be implemented:
  • Step 1: Calculate the MILP (31)–(32) with the input of L rather than L, then collect the optimal attack plan z ;
  • Step 2: Substitute the obtained z into (25), and calculate the MILP (19)–(27) after the elimination of constraints (20) and (21), then remark the final objective value as Δ .
In Step 1, the attacker generates an attack plan z due to asymmetric information L . In step 2, the attack plan z is validated with original network, where dataset L is utilized, to evaluate how much power imbalance can be caused to the real system. Therefore, the subtraction between Δ and Δ provides an ideal indicator to illustrate the impact of asymmetric information. Generally, Δ Δ is greater than 0, showing that less power imbalance is induced due to the mismatch between L and L. Therefore, the magnitude of Δ Δ has a positive correlation with the impact of asymmetric information.

4. Numerical Experiments

In order to identify the impacts of asymmetric information on microgrid confrontation, 3 systems retrieved from Matpower [23] are employed for numerical experiments in this section—case6ww, case24_ieee_rts, and case57. The simulation program is coded with Matlab 2019b, where Cplex 12.10.0 is called via YALMIP [30] for the solution of MILP. The execution hardware is a 64-bit Windows PC with 16.0 GB RAM and 2 Intel Core i7-7700HQ CPU running at 2.80 GHz.

4.1. Experiment Settings

As shown in Section 3.2, the asymmetric information L is utilized as input for impact analysis. However, in reality, it is almost impossible to achieve the explicit details of L . Actually, the difficulty is identical to the attacker who wants to obtain L. Fortunately, the quality of asymmetric information D H y b r i d is much easier to be gained, thus it is supposed to be available in the following experiments.
Therefore, in this experiment, the asymmetric information L is generated based on D H y b r i d . It can be seen from (8) that a variety of L may result into a single D H y b r i d value, thus giving a D H y b r i d can generate several L . In order to address this concern, the random sampling strategy is utilized as follows:
  • Step 1: Generate the pool of real and fake branches L r e a l and L f a k e . Obviously, real branch pool is the original circuit, that is,  L r e a l = L , whose cardinality is n L . On the other hand, any fake branch can be built between two nodes where there is no real branch, thus L f a k e = L f u l l L r e a l , where L f u l l is the full set of branch linking any two bus in a system, whose cardinality is C n 2 = n ( n 1 ) 2 .
  • Step 2: Get the coverage and deviation rates A and B based on the value of D H y b r i d and its definition Equation (8).
  • Step 3: Compute the number real and fake circuits n r e a l and n f a k e in the asymmetric information L . Based on Steps 1 and 2, there has
    n r e a l n L = A , n f a k e n r e a l + n f a k e = B .
    Thus the following result can be obtained
    n r e a l = A n L , n f a k e = A B 1 B n L .
    It should be noted that n r e a l and n f a k e might not be integers, thus a r o u n d ( ) process should be implemented, that is, let n r e a l = r o u n d ( n r e a l ) and n f a k e = r o u n d ( n f a k e ) .
  • Step 4: Randomly select a number of n r e a l and n f a k e branches from L r e a l and L f a k e , then L can be obtained by combining these two resulted subsets.
It should be pointed out that random numbers are introduced in Step 4, thus a single D H y b r i d value may result in a lot of L . In order to eliminate the influence of randomness, the above steps are implemented 50 times for each D H y b r i d , resulting in 50 sets of L . Taking these L as input for asymmetric information analysis illustrated in Section 3.2, the minimum, average, maximum value of Δ Δ will be reported.
Although the original and terminal nodes of each branch in L f a k e have been fixed in Step 1, other parameters are not identified, for example, susceptance γ l and power flow capacity F l . Since each fake line is not included in the original dataset, γ i j and F i j for all i j L f a k e are generated according to the following equations:
γ i j = a v e r a g e γ l , w h e r e l L | f r ( l ) = i t o ( l ) = i f r ( l ) = j t o ( l ) = j ,
F i j = a v e r a g e F l , w h e r e l L | f r ( l ) = i t o ( l ) = i f r ( l ) = j t o ( l ) = j .
Take the fake branch 1–6 shown in Figure 1 as an example, there has
γ 16 = γ 12 + γ 14 + γ 15 + γ 26 + γ 36 + γ 56 6 .
All the datasets utilized in this paper are fetched from Reference [23], but the power flow capacity F l for case57 is vacant, that is,  F l = 0 for all branches. In this experiment, we randomly generate F l for these missing values according to the following equation:
F l = 70 + r o u n d ( 10 a l ) ,
where a l [ 0 , 1 ] is a random number subject to standard uniform distribution. Combined with (38), the domain of F l is [ 70 , 80 ] , which is suitable for this system according to the explanation revealed in Reference [31]. For quick reference and reproductivity purposes, case57 data reported in the appendix of Reference [31] is utilized in this experiment.
If the impact of asymmetric information on microgrid confrontation is analyzed in single fixed circumstance, the conclusion might be biased. Thus a variety of scenarios are generated for simulation, including different levels of asymmetric information D H y b r i d and attack strength R a . In this experiment, D H y b r i d is sampled on 6 values: 100.0, 90.1, 80.2, 70.3, 60.4, and 50.5, with the V F i t n e s s corresponds to 1.0, 0.8, 0.6, 0.4, 0.2, and 0.0, respectively; R a takes 5 values: 10%, 20%, 30%, 40%, and 50%. For each R a , the result of N in (21) is obtained as N = R a n L , that is, the attack strength is capable to destroy a rate of R a branches compared with the total number of real circuits.
Based on the above settings, 30 sets of simulation results will be generated for each target system, and each set is obtained based on a statistic of 50 random simulations.

4.2. The 6-bus System

As shown in Figure 1, the 6-bus system consists of 6 buses, 11 branches, 3 generators, and 3 loads, thus n = 6 and n L = 11 . In terms of different values of D H y b r i d , the numbers of n r e a l and n f a k e can be calculated according to (34). Table 3 summarizes the result. Based on C n 2 = n ( n 1 ) 2 , L f u l l contains 15 circuits, therefore the cardinality of L f a k e is 4, which means n f a k e should be less than or equal to 4. However, n f a k e is 6 when D H y b r i d takes 50.5, indicating that D H y b r i d = 50.5 is not suitable for this system. Therefore, another set of D H y b r i d ranging from 100.0 to 70.25 is employed for case6ww, and the corresponding n r e a l and n f a k e are reported in Table 3 as well. In Table 3, ‘Sum’ is equal to the cardinality of asymmetric information L .
Based on the above Setting 2 and different values of R a , numerical experiments are implemented on case6ww and the result is collected in Table 4. D H y b r i d = 100.0 means the information obtained by attacker is symmetric, thus there is no variation for 50 random simulations, that is, the minimum, average, and maximum are always identical. Due to its symmetric information feature, its result on different attack strength is utilized as a denominator to calculate the damage percentage. It can be seen from Table 4 that the majority of damage percentage value is less than 100%, which means the resulted system power imbalance is smaller than symmetric information, that is, the effect of attack is weakened by the introduction of asymmetric information.
Although Table 4 concludes all experiment results, it is very difficult to draw significant conclusions due to its messy layout. In order to facilitate the observation, Figure 4 is given to rephrase the data reported in Table 4, where the box chart is introduced for presentation, with the lower bar, middle mark, and upper bar corresponding to the minimum, average, and maximum values, respectively. If the middle mark is closer to the lower/upper bar, the average suffers more effect from the minimum/maximum value. At first sight, it is obvious that the power imbalance is higher with the stronger attack strength. For each R a , D H y b r i d = 100.0 should be observed first since it represents the symmetric information, and the result provides a basis for the analysis of asymmetric information. Take R a = 10 % as an example, the system power imbalance is 0 for all D H y b r i d = 100.0 , indicating that the system can withstand a broken of 10% branches. If the damage caused by an attacker with accurate information is 0, then 0 power imbalance can be induced with asymmetric information, which is identical to Figure 4. If  R a goes higher to 20%, 50MW load cannot be served when D H y b r i d = 100.0 . It should be pointed out that, the minimum of Δ can reach 0 for all five D H y b r i d 100.0 cases, which means the attack has no effect on system loads at some scenarios out of 50 samples. On the other hand, a 50 MW power imbalance can also be caused by these attacks, showing the effect of asymmetric information may not be helpful. However, the average of Δ is reducing with the decreasing of D H y b r i d , thus benefits from the introduction of asymmetric information have been validated. Similar findings can be generated for R a equals 30%, 40%, and 50%. One interesting observation is that, if  D H y b r i d = 75.25 , the minimum damage can be as small as 0, and the maximum is always smaller than the case of D H y b r i d = 100.0 . Therefore, it can be concluded that asymmetric information with a level of D H y b r i d = 75.25 or lesser will always result in weaker damage than symmetric information.
In addition to Figure 4, Table 4 can be interpreted from another dimension as shown in Figure 5. It can be seen that the difference between R a = 10 % and R a = 50 % is getting smaller from D H y b r i d = 100.0 to D H y b r i d = 75.25 , indicating that the destruction effect gained form the increase of attack strength is diminished by asymmetric information. Therefore, if deception strategies are utilized by defender to increase the level of asymmetric information, the microgrid system can withstand stronger attack strength in confrontations.

4.3. The 24-bus System

The original data of case24-ieee-rts are downloaded from Reference [23], where several generators are connected into one node and there exist two or more circuits between two buses. In this experiment, these supplement generators and circuits are evolved into a single one with their capability accumulated, thus 24 buses, 34 branches, 10 generators, and 17 loads, are included in this system. Based on the default experiment settings given in Section 4.1, results are generated and reported in Table 5.
Generally, Table 5 shows a similar feature with Table 4. In order to further investigate the difference, damage percentage is employed for comparison as the level of system power imbalance is quite different. Therefore, Table 6 is obtained from the subtraction of Table 4 by Table 5. It can be seen that the majority of percentage difference value is greater or equal than 0%, indicating that better performance on the defense (less damage percentage) has been achieved by case24-ieee-rts.
Figure 6 illustrates the increase of power imbalance Δ across different level of attack strength R a . If  D H y b r i d = 100.0 , there is a flat tail on the trend line, that is,  Δ R a = 40 % = Δ R a = 50 % , meaning the attack limit has been reached. Therefore, it can be concluded that the system can be destroyed with R a = 40 % of attack strength under symmetric information. On the other hand, the attack limit is much larger than 40% for asymmetric information, which is validated by Figure 7, where additional experiments are carried out on R a = { 60 % , 70 % , 80 % , 90 % , 100 % } . It is shown in Figure 7 that, if symmetric information is obtained by attacker, the power imbalance can be reached under R a = 10 % is 387 MW, which cannot be arrived without R a = 50 % and 90% under asymmetric information circumstance D H y b r i d = 70.30 and 50.50, respectively. In addition, if asymmetric information D H y b r i d = { 90.1 , 80.2 , 70.3 , 60.4 , 50.5 } is involved, the system cannot be destroyed even it suffers an attack strength of R a = 100 % .

4.4. The 57-bus System

This grid consists of 57 buses, 78 branches, 7 generators, and 42 loads. Table 7 summarizes the simulation results. In each column, the power balance is decreasing as D H y b r i d decreases, validating the fact that system damage is partially eliminated by asymmetric information. Similar to the former two cases, Figure 8 is presented to give an intuitive vision. It can be seen that the attack limit is reached when R a = 20 % , which is much earlier than case24-ieee-rts, resulting in a long flat tail. In order to adjust the tail into similar figure with case6ww and case24-ieee-rts, the following two attempts are taken:
  • If the branch capacity is increased, the system might not be such easy to be destroyed. Thus, the first strategy is increasing the predefined range of F l from [ 70 , 80 ] to [ 100 , 110 ] by adding 30 MW to (38). However, only minor variations are obtained in comparison with Table 7 and Figure 8.
  • The second strategy is reducing the attack strength from R a = { 10 % , 20 % , 30 % , 40 % , 50 % } to R a = { 00 % , 5 % , 10 % , 15 % , 20 % } based on the assumption that the system attack limit cannot be easily revised. Result is illustrated in Figure 9, expressing a similar pattern with the former two cases.

4.5. Discussion

Observing Figure 6, Figure 8 and Figure 9, it can be seen that in each column with a fixed R a value, the system power imbalance is monotonically decreasing from D H y b r i d = 100.0 to D H y b r i d = 50.50 . Since the V F i t n e s s value corresponding to D H y b r i d = { 100.0 , 90.1 , 80.2 , 70.3 , 60.4 , 50.5 } is { 1.0 , 0.8 , 0.6 , 0.4 , 0.2 , 0.0 } , showing an monotonic decrease trend as well, it can be carefully deduced that under any given R a , the system suffers less damage if V F i t n e s s is smaller. However, Figure 4 is an exception with violations at R a = 20 % , R a = 40 % , and R a = 50 % . Take D H y b r i d = 95.05 and D H y b r i d = 90.10 at R a = 20 % as an example, there has Δ D H y b r i d = 95.05 < Δ D H y b r i d = 90.10 in Figure 4. Compared with D H y b r i d = 95.05 , the attacker with D H y b r i d = 90.10 asymmetric information has smaller coverage rate A and larger deviation rate B, thus the caused power imbalance should be less based on common sense and logical analysis. The reason for the irrational results in Figure 4 is statistical bias due to limited sample number. In order to validate the explanation, additional experiments with 200 samples are implemented. Finally, the violation is eliminated. Therefore, it can be concluded that the definitions of D H y b r i d and V F i t n e s s are generally reasonable for wide utilization on judgment, comparison, and decision-making, and so forth.

5. Conclusions

The asymmetric information in military microgrid confrontation is proposed and investigated in this paper. In order to facilitate the description, symmetric and asymmetric information is distinguished. Since the existing method is not suitable to evaluate the level of information mismatch, a novel asymmetric information assessment metric is proposed, where coverage and deviation rates are included. On the other hand, the military microgrid confrontation is formulated as an AD model, which is addressed via dual theory and big-M method. The resulted MILP is then solved by the on-the-shelf solver Cplex. With the consideration of various levels of attack strength, numerical experiments are implemented on three systems retrieved from Matpower ranging from 6-bus to 57-bus. Results indicate that asymmetric information is beneficial to alleviate attack damage and improve defensive performance. Although only branch-tripping is considered in this paper, we intend to claim that the definition of assessment metric and influence analysis methodology can be easily extended to other types of attacks where there is an information gap between defender and attacker.

Author Contributions

Investigation, P.J.; Methodology, P.J.; Supervision, T.Z.; Validation, S.H.; Writing—original draft, S.H.; Writing—review & editing, T.Z. All authors have read and agreed to the published version of the manuscript.

Funding

This work was supported by the Distinguished Natural Science Foundation of Hunan Province (No. 2017JJ1001) and the National Natural Science Foundation of China (Nos. 71901210, 61973310). This work was also supported by the China Postdoctoral Science Foundation (No. 2017M623381).

Conflicts of Interest

The authors declare no conflict of interest.

References

  1. Kashem, S.B.A.; De Souza, S.; Iqbal, A.; Ahmed, J. Microgrid in military applications. In Proceedings of the IEEE 12th International Conference on Compatibility, Power Electronics and Power Engineering (CPE-POWERENG), Doha, Qatar, 10–12 April 2018; pp. 1–5. [Google Scholar]
  2. Strakos, J.K.; Quintanilla, J.A.; Huscroft, J.R. Department of Defense energy policy and research: A framework to support strategy. Energy Policy 2016, 92, 83–91. [Google Scholar] [CrossRef] [Green Version]
  3. Van Broekhoven, S.; Judson, N.; Galvin, J.; Marqusee, J. Leading the Charge: Microgrids for Domestic Military Installations. IEEE Power Energy Mag. 2013, 11, 40–45. [Google Scholar] [CrossRef]
  4. Stamp, J. The SPIDERS project—Smart Power Infrastructure Demonstration for Energy Reliability and Security at US military facilities. In Proceedings of the IEEE PES Innovative Smart Grid Technologies (ISGT), Washington, DC, USA, 16–20 January 2012; p. 1. [Google Scholar]
  5. Johnson, M.D.; Ducey, R.A. Overview of U.S. Army microgrid efforts at fixed installations. In Proceedings of the IEEE Power & Energy Society General Meeting, Detroit, MI, USA, 24–29 July 2011; pp. 1–2. [Google Scholar]
  6. Podlesak, T.; Vitale, J.; Wilson, B.; Bohn, F.; Gonzalez, M.; Bosse, R.; Siegfried, S.; Lynch, J.; Barnhill, W. Auto-Tuning for Military Microgrids. In Proceedings of the IEEE Energy Conversion Congress and Exposition (ECCE), Baltimore, MD, USA, 29 September–3 October 2019; pp. 6270–6277. [Google Scholar]
  7. Masrur, M.A.; Skowronska, A.G.; Hancock, J.; Kolhoff, S.W.; McGrew, D.Z.; Vandiver, J.C.; Gatherer, J. Military-Based Vehicle-to-Grid and Vehicle-to-Vehicle Microgrid—System Architecture and Implementation. IEEE Trans. Transp. Electrif. 2018, 4, 157–171. [Google Scholar] [CrossRef]
  8. Xiang, Y.; Wang, L.; Liu, N. Coordinated attacks on electric power systems in a cyber-physical environment. Electr. Power Syst. Res. 2017, 149, 156–168. [Google Scholar] [CrossRef]
  9. Ali, S.; Li, Y. Learning Multilevel Auto-Encoders for DDoS Attack Detection in Smart Grid Network. IEEE Access 2019, 7, 108647–108659. [Google Scholar] [CrossRef]
  10. Liu, X.; Li, Z. False data attack models, impact analyses and defense strategies in the electricity grid. Electr. J. 2017, 30, 35–42. [Google Scholar] [CrossRef]
  11. Xiang, Y.; Wang, L. A game-theoretic study of load redistribution attack and defense in power systems. Electr. Power Syst. Res. 2017, 151, 12–25. [Google Scholar] [CrossRef]
  12. Zhu, Y.; Yan, J.; Tang, Y.; Sun, Y.L.; He, H. Joint Substation-Transmission Line Vulnerability Assessment Against the Smart Grid. IEEE Trans. Inf. Forensics Secur. 2015, 10, 1010–1024. [Google Scholar] [CrossRef]
  13. He, H.; Yan, J. Cyber-physical attacks and defences in the smart grid: A survey. IET Cyber-Phys. Syst. Theor. Appl. 2016, 1, 13–27. [Google Scholar] [CrossRef] [Green Version]
  14. Gunduz, M.Z.; Das, R. Cyber-security on smart grid: Threats and potential solutions. Comput. Netw. 2020, 169, 107094. [Google Scholar] [CrossRef]
  15. Lu, X.; Wang, J.; Guo, L. Using microgrids to enhance energy security and resilience. Electr. J. 2016, 29, 8–15. [Google Scholar] [CrossRef]
  16. Wang, Y.; Chen, C.; Wang, J.; Baldick, R. Research on Resilience of Power Systems Under Natural Disasters—A Review. IEEE Trans. Power Syst. 2016, 31, 1604–1613. [Google Scholar] [CrossRef]
  17. Lai, K.; Illindala, M.; Subramaniam, K. A tri-level optimization model to mitigate coordinated attacks on electric power systems in a cyber-physical environment. Appl. Energy 2019, 235, 204–218. [Google Scholar] [CrossRef]
  18. Lin, Y.; Bie, Z. Tri-level optimal hardening plan for a resilient distribution system considering reconfiguration and DG islanding. Appl. Energy 2018, 210, 1266–1279. [Google Scholar] [CrossRef]
  19. Zeng, B.; Zhao, L. Solving two-stage robust optimization problems using a column-and-constraint generation method. Oper. Res. Lett. 2013, 41, 457–461. [Google Scholar] [CrossRef]
  20. Lei, H.; Huang, S.; Liu, Y.; Zhang, T. Robust Optimization for Microgrid Defense Resource Planning and Allocation Against Multi-Period Attacks. IEEE Trans. Smart Grid 2019, 10, 5841–5850. [Google Scholar] [CrossRef]
  21. Lai, K.; Wang, Y.; Shi, D.; Illindala, M.S.; Jin, Y.; Wang, Z. Sizing battery storage for islanded microgrid systems to enhance robustness against attacks on energy sources. J. Mod. Power Syst. Clean Energy 2019, 7, 1177–1188. [Google Scholar] [CrossRef] [Green Version]
  22. Costa, A.; Georgiadis, D.; Ng, T.S.; Sim, M. An optimization model for power grid fortification to maximize attack immunity. Int. J. Electr. Power Energy Syst. 2018, 99, 594–602. [Google Scholar] [CrossRef]
  23. Zimmerman, R.D.; Murillo-Sanchez, C.E.; Thomas, R.J. MATPOWER: Steady-State Operations, Planning, and Analysis Tools for Power Systems Research and Education. IEEE Trans. Power Syst. 2011, 26, 12–19. [Google Scholar] [CrossRef] [Green Version]
  24. Haghighat, H.; Zeng, B. Bilevel Mixed Integer Transmission Expansion Planning. IEEE Trans. Power Syst. 2018, 33, 7309–7312. [Google Scholar] [CrossRef]
  25. Xiang, Y.; Wang, L. An Improved Defender–Attacker–Defender Model for Transmission Line Defense Considering Offensive Resource Uncertainties. IEEE Trans. Smart Grid 2019, 10, 2534–2546. [Google Scholar] [CrossRef]
  26. Davarikia, H.; Barati, M.; Al-Assad, M.; Chan, Y. A novel approach in strategic planning of power networks against physical attacks. Elect. Power Syst. Res. 2020, 180, 106140. [Google Scholar] [CrossRef] [Green Version]
  27. Wang, Z.; Perera, A. Robust optimization of power grid with distributed generation and improved reliability. Energy Procedia 2019, 159, 400–405. [Google Scholar] [CrossRef]
  28. Zeraati, M.; Aref, Z.; Latify, M.A. Vulnerability Analysis of Power Systems Under Physical Deliberate Attacks Considering Geographic-Cyber Interdependence of the Power System and Communication Network. IEEE Syst. J. 2018, 12, 3181–3190. [Google Scholar] [CrossRef]
  29. Davarikia, H.; Barati, M. A tri-level programming model for attack-resilient control of power grids. J. Mod. Power Syst. Clean Energy 2018, 6, 918–929. [Google Scholar] [CrossRef] [Green Version]
  30. Löfberg, J. YALMIP: A Toolbox for Modeling and Optimization in MATLAB. In Proceedings of the 2004 IEEE International Conference on Robotics and Automation (IEEE Cat. No.04CH37508), New Orleans, LA, USA, 2–4 September 2004; pp. 284–289. [Google Scholar]
  31. Jiang, P.; Huang, S.; Zhang, T. Optimal Deception Strategies in Power System Fortification against Deliberate Attacks. Energies 2019, 12, 342. [Google Scholar] [CrossRef] [Green Version]
Figure 1. Single line diagram of 6-bus sample system.
Energies 13 01954 g001
Figure 2. Illustration of asymmetric information on system topology between attackers and defenders: (a) The installation of generators; (b) The distribution of loads; (c) The existence of branches.
Energies 13 01954 g002
Figure 3. Fitness value evaluation of vector distance D H y b r i d .
Energies 13 01954 g003
Figure 4. The impact of asymmetric information on system power imbalance under different attack strength levels for case6ww.
Energies 13 01954 g004
Figure 5. The impact of attack strength on system power imbalance under different asymmetric information levels for case6ww.
Energies 13 01954 g005
Figure 6. The impact of asymmetric information on system power imbalance under different attack strength levels for case24-ieee-rts.
Energies 13 01954 g006
Figure 7. Influence of asymmetric information on system power imbalance for case24-ieee-rts.
Energies 13 01954 g007
Figure 8. The impact of asymmetric information on system power imbalance under different attack strength levels for case57.
Energies 13 01954 g008
Figure 9. The impact of asymmetric information on system power imbalance under different attack strength levels for case57.
Energies 13 01954 g009
Table 1. Vector distances measured by various methods.
DistanceGenerator InformationLoad InformationBranch Information
Atker. 1Atker. 2Atker. 3Atker. 1Atker. 2Atker. 3Atker. 1Atker. 2Atker. 3
D C i t y b l o c k 2.003.003.002.003.003.006.007.004.00
D E u c l i d e a n 1.411.731.731.411.731.732.452.652.00
D C h e b y c h e v 1.001.001.001.001.001.001.001.001.00
D C o s i n e 0.330.420.590.330.420.590.270.300.20
D H a m m i n g 0.330.500.500.330.500.500.400.470.27
D J a c c a r d 0.500.600.750.500.600.750.430.470.33
Table 2. Definition of indexes, sets, parameters, and decision variables.
SymbolDefinition
Δ System power imbalance.
z l Binary variable, if circuit l is attacked z l = 1 ; otherwise z l = 0 .
LSet of branch indexes.
NMaximum number of branches can be attacked.
p i Power output of generator i.
f l Power flow of line l.
S b + Power surplus at bus b.
S b Power deficit at bus b.
f r ( l ) Origin bus of line l.
t o ( l ) Destination bus of line l.
θ b Phase angle at bus b.
BSet of bus indexes.
ISet of generator indexes.
b u ( i ) The bus that generator i is connected with.
D b Demand at bus b.
γ l Suspectance of line l.
F l Power flow capacity of line l.
P i Capacity of generator i.
β , π , σ , ϕ , μ Dual variables corresponding to each constraints.
Table 3. Two settings of D H y b r i d for case6ww.
Setting 1Setting 2
D Hybrid V Fitness n real n fake Sum D Hybrid V Fitness n real n fake Sum
100.01.011011100.01.011011
90.100.81011195.050.910111
80.200.6921190.100.810111
70.300.4831185.150.79211
60.400.2741180.200.69211
50.500.06 6 1275.250.58311
Table 4. Numerical simulation results of case6ww.
D Hybrid , V Fitness Attack Strength = ( R a , N); Power Imbalance = ( Δ , Damage Percentage)
(10%, 1)(20%, 2)(30%, 3)(40%, 4)(50%, 6)
Δ Per. Δ Per. Δ Per. Δ Per. Δ Per.
(100.0, 1.0)Min.0.00\50.00100.0%70.00100.0%95.00100.0%180.00100.0%
Avg.0.00\50.00100.0%70.00100.0%95.00100.0%180.00100.0%
Max.0.00\50.00100.0%70.00100.0%95.00100.0%180.00100.0%
(95.05, 0.9)Min.0.00\0.000.0%0.000.0%35.0036.8%100.0055.6%
Avg.0.00\19.0238.0%44.5663.7%79.9784.2%135.7375.4%
Max.0.00\50.00100.0%70.00100.0%95.00100.0%180.00100.0%
(90.10, 0.8)Min.0.00\0.000.0%0.000.0%35.0036.8%116.5464.7%
Avg.0.00\29.8459.7%44.6363.8%77.7081.8%144.4680.3%
Max.0.00\50.00100.0%70.00100.0%95.00100.0%180.00100.0%
(85.15, 0.7)Min.0.00\0.000.0%0.000.0%10.0010.5%40.0022.2%
Avg.0.00\12.9826.0%23.9234.2%48.0850.6%109.3660.8%
Max.0.00\50.00100.0%70.00100.0%95.00100.0%180.00100.0%
(80.20, 0.6)Min.0.00\0.000.0%0.000.0%5.716.0%50.0027.8%
Avg.0.00\9.9619.9%21.8931.3%52.5255.3%109.1360.6%
Max.0.00\50.00100.0%70.00100.0%95.00100.0%180.00100.0%
(75.25, 0.5)Min.0.00\0.000.0%0.000.0%0.000.0%3.331.9%
Avg.0.00\1.773.5%14.4520.6%34.5236.3%70.5639.2%
Max.0.00\50.00100.0%58.5783.7%84.5389.0%120.0066.7%
Table 5. Numerical simulation results of case24-ieee-rts.
D Hybrid , V Fitness Attack Strength = ( R a , N); Power Imbalance = ( Δ , Damage Percentage)
(10%, 3)(20%, 7)(30%, 10)(40%, 14)(50%, 17)
Δ Per. Δ Per. Δ Per. Δ Per. Δ Per.
(100.0, 1.0)Min.387.0100.0%1373.0100.0%1468.0100.0%1607.0100.0%1607.0100.0%
Avg.387.0100.0%1373.0100.0%1468.0100.0%1607.0100.0%1607.0100.0%
Max.387.0100.0%1373.0100.0%1468.0100.0%1607.0100.0%1607.0100.0%
(90.1, 0.8)Min.0.00.0%106.07.7%110.07.5%445.027.7%456.028.4%
Avg.114.429.6%832.160.6%1033.970.4%1144.471.2%1248.277.7%
Max.387.0100.0%1373.0100.0%1468.0100.0%1607.0100.0%1607.0100.0%
(80.2, 0.6)Min.0.00.0%0.00.0%0.00.0%0.00.0%299.918.7%
Avg.59.315.3%305.122.2%534.836.4%666.141.4%923.457.5%
Max.309.079.8%973.070.9%1052.071.7%1428.088.9%1607.0100.0%
(70.3, 0.4)Min.0.00.0%0.00.0%0.00.0%0.00.0%0.00.0%
Avg.32.38.3%156.511.4%229.415.6%456.828.4%593.336.9%
Max.309.079.8%698.050.8%698.047.5%1428.088.9%1253.078.0%
(60.4, 0.2)Min.0.00.0%0.00.0%0.00.0%0.00.0%0.00.0%
Avg.10.42.7%55.14.0%113.57.7%226.414.1%431.226.8%
Max.309.079.8%473.034.5%873.059.5%977.060.8%1373.085.4%
(50.5, 0.0)Min.0.00.0%0.00.0%0.00.0%0.00.0%0.00.0%
Avg.3.30.9%39.52.9%80.65.5%97.86.1%184.011.5%
Max.165.042.6%309.022.5%564.038.4%698.043.4%623.038.8%
Table 6. Difference on the damage percentage between case6ww and case24-ieee-rts.
D Hybrid , V Fitness R a = 10% R a = 20% R a = 30% R a = 40% R a = 50%
(100.0, 1.0)Min.\0.00%0.00%0.00%0.00%
Avg.\0.00%0.00%0.00%0.00%
Max.\0.00%0.00%0.00%0.00%
(90.1, 0.8)Min.\−7.72%−7.49%9.15%27.18%
Avg.\−22.57%−6.76%12.97%−2.27%
Max.\0.00%0.00%0.00%0.00%
(80.2, 0.6)Min.\0.00%0.00%36.84%46.08%
Avg.\37.46%27.32%40.34%22.80%
Max.\29.13%28.34%11.14%0.00%
(70.3, 0.4)Min.\0.00%0.00%10.53%22.22%
Avg.\14.56%18.54%22.18%23.84%
Max.\49.16%52.45%11.14%22.03%
(60.4, 0.2)Min.\0.00%0.00%6.02%27.78%
Avg.\15.91%23.53%41.19%33.79%
Max.\65.55%40.53%39.20%14.56%
(50.5, 0.0)Min.\0.00%0.00%0.00%1.85%
Avg.\0.67%15.15%30.26%27.75%
Max.\77.49%45.25%45.55%27.90%
Table 7. Numerical simulation results of case57.
D Hybrid , V Fitness Attack Strength = ( R a , N); Power Imbalance = ( Δ , Damage Percentage)
(10%, 8)(20%, 16)(30%, 23)(40%, 31)(50%, 39)
Δ Per. Δ Per. Δ Per. Δ Per. Δ Per.
(100.0, 1.0)Min.403.8100.0%449.8100.0%449.8100.0%449.8100.0%449.8100.0%
Avg.403.8100.0%449.8100.0%449.8100.0%449.8100.0%449.8100.0%
Max.403.8100.0%449.8100.0%449.8100.0%449.8100.0%449.8100.0%
(90.1, 0.8)Min.140.434.8%226.850.4%230.851.3%259.857.8%255.856.9%
Avg.302.174.8%362.180.5%379.384.3%398.588.6%375.683.5%
Max.403.8100.0%449.8100.0%449.8100.0%449.8100.0%449.8100.0%
(80.2, 0.6)Min.117.529.1%159.635.5%214.847.8%177.139.4%219.748.8%
Avg.250.962.1%303.367.4%318.270.7%340.275.6%331.173.6%
Max.403.8100.0%424.894.4%449.8100.0%449.8100.0%449.8100.0%
(70.3, 0.4)Min.55.013.6%154.834.4%136.030.2%166.937.1%105.623.5%
Avg.183.045.3%257.757.3%275.761.3%268.459.7%274.861.1%
Max.303.675.2%416.892.7%417.092.7%416.892.7%416.892.7%
(60.4, 0.2)Min.42.210.5%79.017.6%109.824.4%120.326.7%60.513.5%
Avg.153.538.0%206.645.9%238.753.1%244.454.3%227.450.6%
Max.314.878.0%403.889.8%403.889.8%365.881.3%345.876.9%
(50.5, 0.0)Min.6.71.7%38.68.6%41.19.1%56.812.6%72.716.2%
Avg.96.623.9%155.634.6%186.941.6%187.941.8%188.341.9%
Max.229.856.9%293.865.3%329.073.1%403.889.8%360.880.2%

