1. Introduction
Global warming continues to progress and leads to serious problems and changes on Earth. In order to minimize the consequences of upcoming global catastrophes, a rapid reduction of the emitted greenhouse gases is mandatory. The largest producer of greenhouse gases, besides the industrial sector, is the transport sector, which is dominated by the combustion engine [
1]. A more ecological technology in the transport sector is the electric motor [
2], which either is powered directly by lithium-ion batteries [
3] currently or by fuel cells [
4].
The spread of lithium-ion batteries is taking place in more and more areas of the transport sector. In addition to the slowly growing market for electric vehicles, there is already a large market for e-bikes. In 2018, the share of electrically-powered bicycles in Germany rose to around 23.5% with a total turnover of all sold bicycles of 3.16 billion Euros [
5]. There are also sectors that can be classified as micromobility. Micromobility, whose associated vehicles cover the so-called “last mile”, is playing an increasingly important role and is currently significantly revolutionizing mobility in cities [
6]. The growth in this sector is leading to a rapidly growing demand for batteries with an energy of less than 1 kWh. However, while EV traction batteries have a lifespan of up to 10 years, small storage batteries usually are used only a few years. In order to maximize the CO
2 balance of the batteries, the longest possible useful life should be guaranteed, which is why further use after normal application should be considered. Studies on large EV batteries in second-life operation, for example as for home storage systems, have already been carried out. In [
7], Martinez et al. investigated cell-to-cell heterogeneity and its effect on battery performance and degradation in second life use. Of high interest as well is the use of aged batteries for buffering regenerative energy [
8,
9].
In order to be able to store this regenerative energy quickly with high power, e.g., in industrial processes, lithium-ion batteries, as well as lithium-ion capacitors are used in some applications. The temperature range in which the capacitors can be operated is larger than the temperature range of lithium-ion batteries, which means that they can be used more independently of the environment [
10]. Especially within high temperature industrial processes, this can be important. In contrast, the amount of energy that can be stored in the capacitors is not comparable with lithium-ion batteries.
Investigations with smaller batteries (<1 kWh) are however rare in the literature so far. These smaller batteries can be used in clusters under certain circumstances to set up smaller house storage systems as well. Subsequent recycling of the battery’s internal materials after second life further increases the CO
2 balance [
11]. In [
12], Li et al. developed an NMC cathode recycling method where more than 98% of the materials could be leached out. Only the combination of long use and recycling makes the permanent use of batteries feasible in the future.
Computed tomography has been used in the literature to investigate the failure of lithium-ion batteries. In their work, Finegan et al. [
13] described the application of high speed synchrotron X-ray computed tomography to track the evolution of internal structural damage and thermal behavior during a thermal runaway in lithium-ion batteries. Pfrang et al. [
14] used CT scans to gain important insights into the position of the cathode tab and its effects on deformations of the jelly roll. Furthermore, Waldmann et al. [
15] varied the load current to investigate its influence on internal deformations by using CT scans. These articles can be used to compare the results of this work and to address differences where necessary.
To take a closer look at a long battery life, a representative battery is aged with full cycles and measured beyond its usual End Of Life (EOL) of around 80% to 70% State Of Health (SOH). The gained data allows an evaluation of the second life use of such batteries. Furthermore, the investigations of this work serve to question the mentioned values of 80% and 70% SOH critically. Thus, to highlight upcoming safety issues, up to which SOH the use of a battery in second life is appropriate and safe is investigated.
2. Materials and Methods
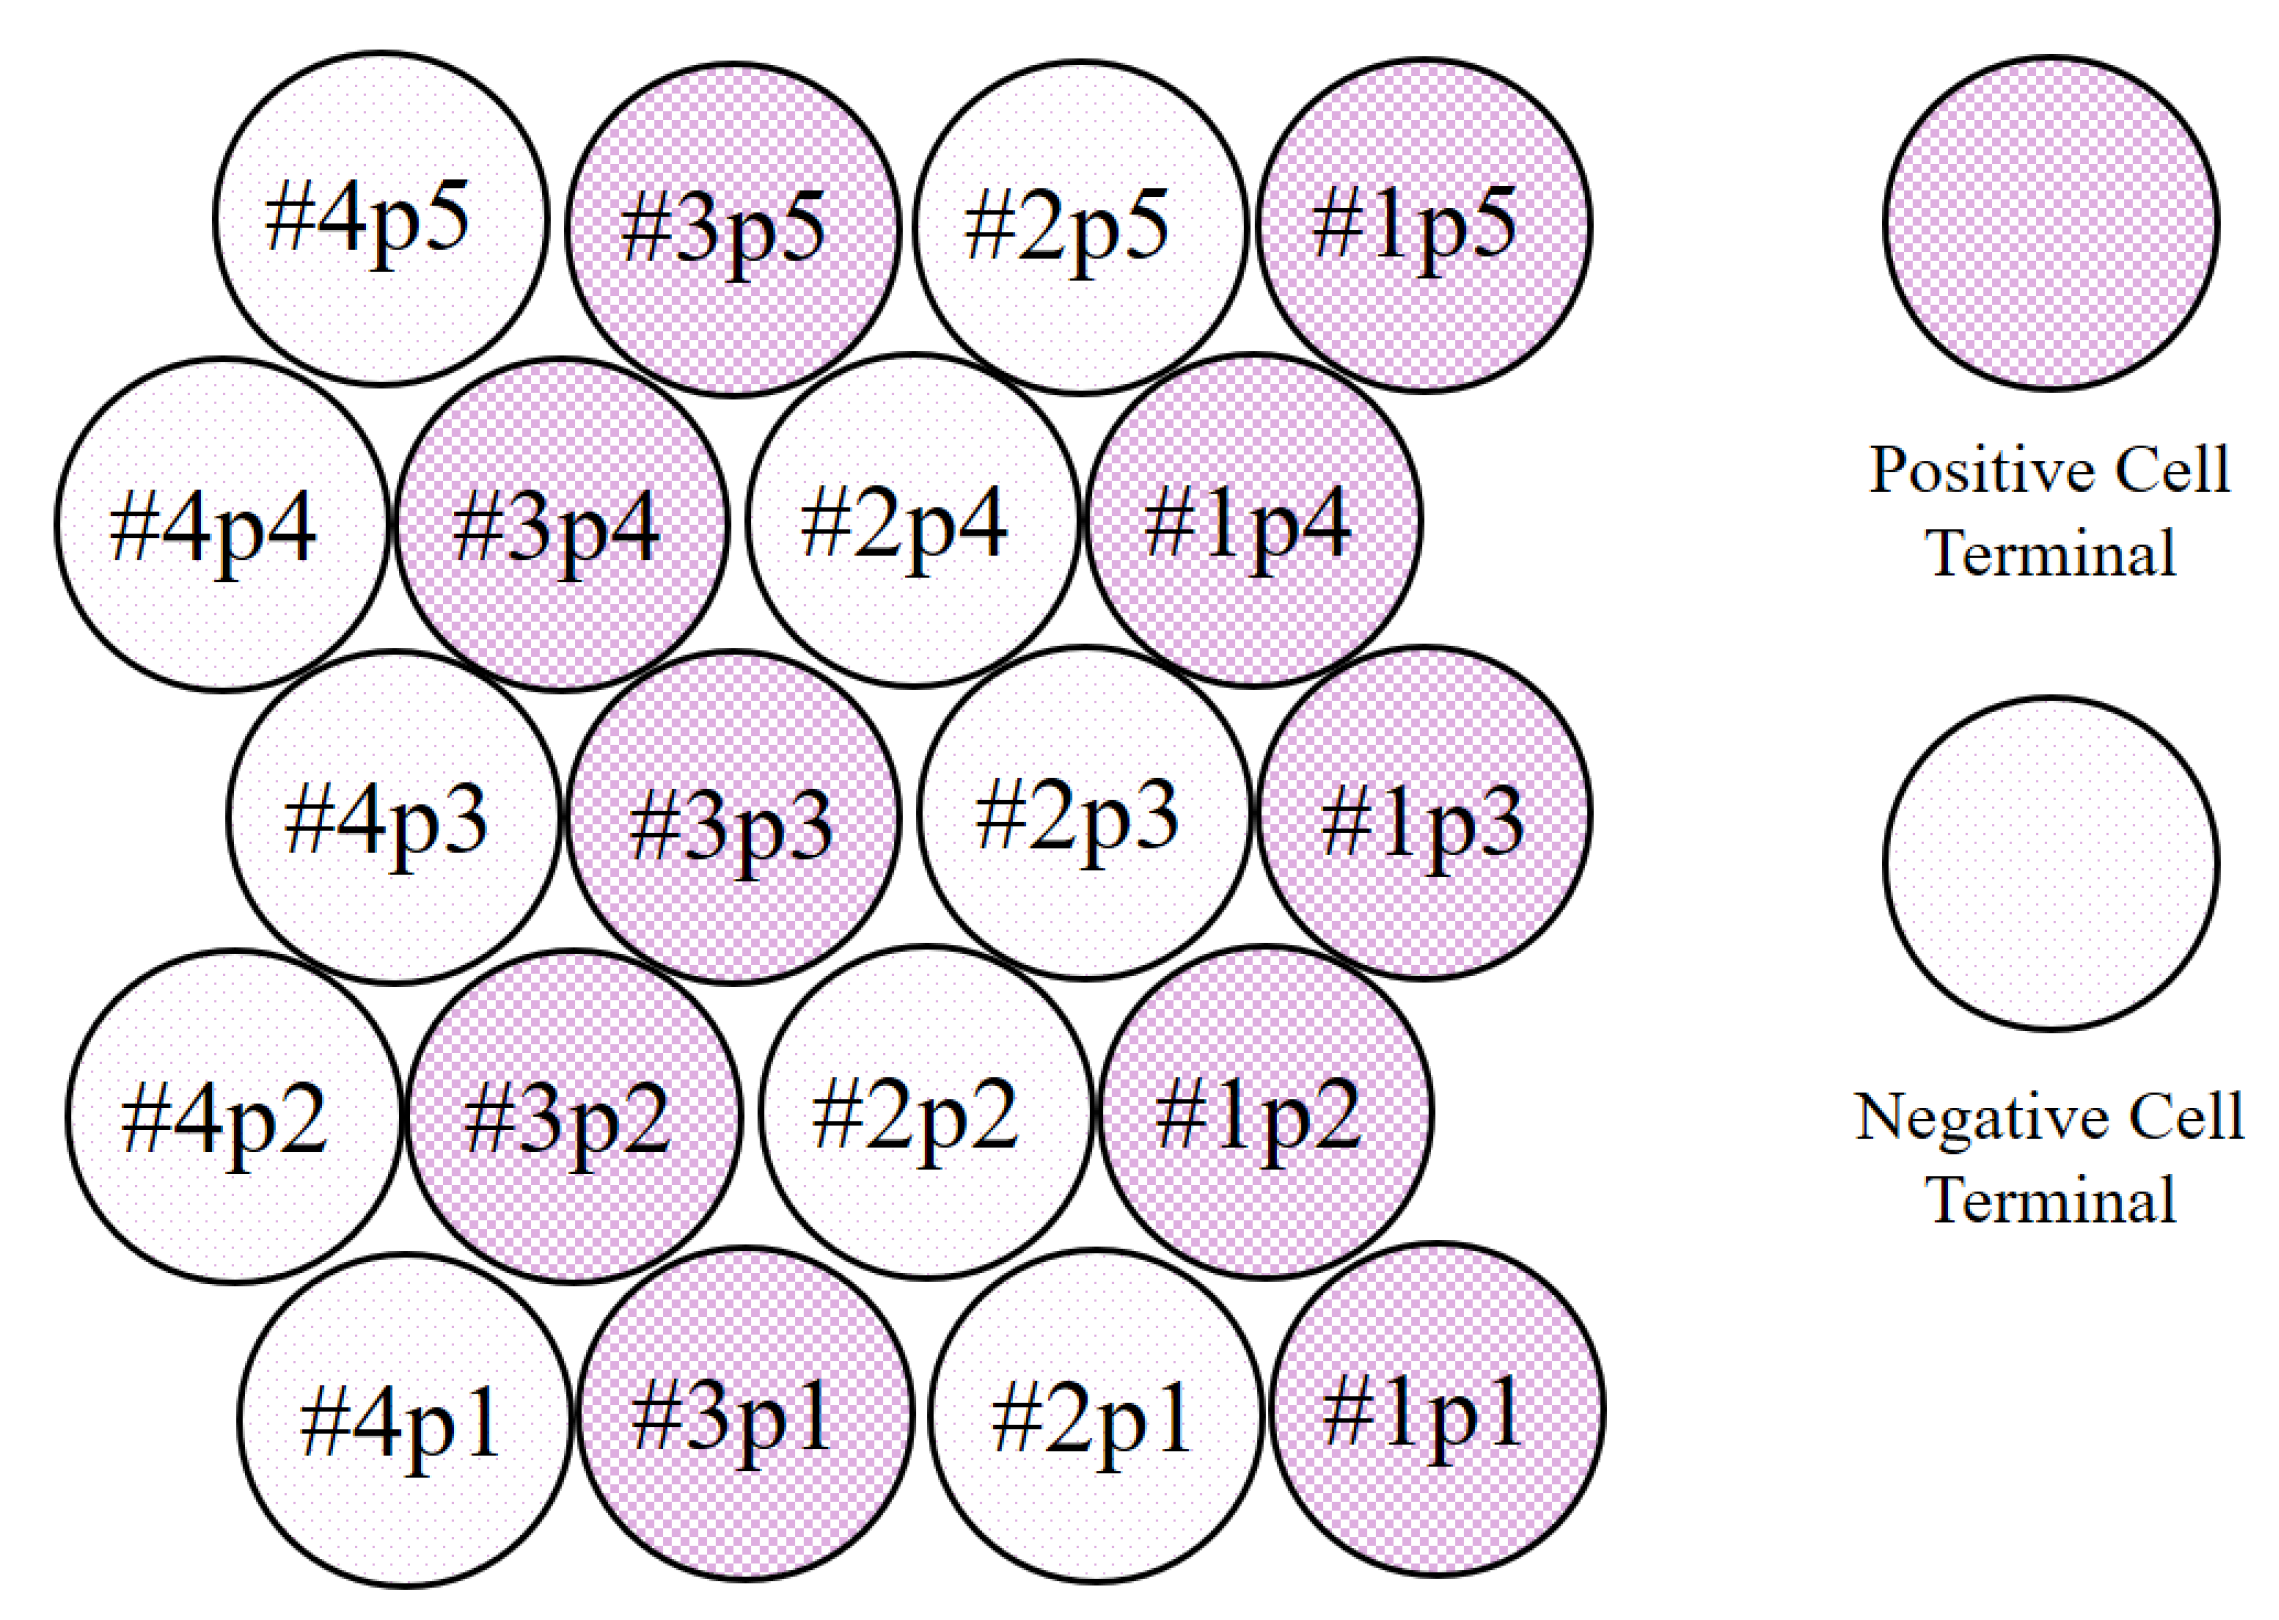
Twenty new Samsung ICR18650-26F cells were configured into a battery pack with a 4s5p (4 cells in series with 5 cells in parallel each) setup. These cells had a nominal capacity of 2.6 Ah and used a carbon anode and an Lithium-nickel-manganese-cobalt-oxide (NMC) cathode. The cell type could be assumed to be high energy. The resulting nominal battery pack capacity was therefore 13 Ah with a nominal voltage of 14.8 V. The battery was equipped with a passive Battery Management System (BMS) that operated during the constant voltage phase of the charging process. It discharged cells with a voltage greater than 4.175 V by switching one of its 33
balancing resistors in parallel with the battery cell. Balancing ended as soon as the voltage of the balanced cells dropped below 4.175 V. The configured battery with the associated cell numbering is shown in
Figure 1.
The experiment was divided into three parts. First, the whole battery was aged till failure by a constant load cycle. Afterwards, the battery was disassembled, and a single cell investigation was conducted to get a closer look at the cell-to-cell variation and other single cell phenomena. At the end, a post mortem analysis of healthy and defective cells was carried out and compared with the help of a CT scanner. All electrical measurements were conducted at a constant ambient temperature of 25 C in Memmert IPP55 temperature chambers. To increase the safety of the experiment, several safety measures were set up. Examples were the video surveillance of the test setup, an independent temperature measurement in the test chamber by a monitoring device, and the use of the so-called Battery Safety Device (BSD) from the company BaSyTec. The BSD monitored battery parameters independently of the operating software. Any of the above-mentioned safety equipment could interrupt the test if necessary.
2.1. Battery Pack Measurement
In the first part, the battery was aged with the help of a Low Power System (LPS) by BaSyTec GmbH. The accuracy of the used LPS in the chosen current range was ±2 mA. Voltage measurement had an accuracy of ±1.1 mV. The aging process took places as follows. The battery was charged with a constant value of 10 A (0.77 C) until the desired voltage of 16.7 V was reached. Then, the voltage was held constant until the current dropped down below 0.05 A (0.003 C) or one cell voltage was greater then 4.21 V. The small value of 0.003 C was chosen to allow the passive balancing system enough time for balancing. Subsequent discharge was also conducted with a constant current of 10 A (0.77 C) until the battery reached 12.0 V or a single cell voltage fell below 3.0 V. After each discharge cycle, the capacity of the battery pack was determined. In addition to the discharge capacity, Direct Current Internal Resistance (DCIR) at 100% State Of Charge (SOC) was calculated at the beginning of each discharge cycle. For this purpose, the voltage drop was evaluated 30 s after the discharge process started. This method allowed skipping an additional Reference Parameter Test (RPT). As a result, the testing time could be reduced, and the aging process showed no gaps or anomalies referred to the RPT. The test ran until an electrochemical fault occurred, which led to a fault of several single cells. From this point on, further aging was not possible.
2.2. Single Cell Measurement
In this part of the experiment, the battery was disassembled, and a single cell investigation took place. Therefore, all twenty cells were separated into functional and non-functional cells. Non-functional cells were more interesting for the CT scan investigations. All functional cells underwent an RPT to determine the electrical parameters such as discharge capacity and DCIR.
At first, the cell was charged with a constant current of 520 mA until the desired voltage of 4.2 V was reached. Then, the voltage was held constant until the current was lower than 130 mA (0.05 C). Subsequent discharge was also conducted with a constant current of 520 mA until the cell voltage dropped below 3.0 V. Afterwards, the cell was charged again with the above-mentioned values and limits for the following DCIR calculation. DCIR was calculated at seven different SOC levels (100%, 75%, 65%, 55%, 50%, 25%, 15%). At each level, the voltage drop of a current pulse with 13 A (1 C) was evaluated after 30 s. All tests were carried out with a Cell Test System (CTS) by BaSyTec GmbH. The accuracy of the used CTS in the chosen current range was ±1 mA. Voltage measurement had an accuracy of ±1 mV.
2.3. Post Mortem Computed Tomography
Besides the exploded cell #1p4, cells from its immediate vicinity were selected and subjected to a CT scan. During the scan, anomalies and triggered security mechanisms were detected in order to obtain more information about the failure process. The recordings were made with a Zeiss Metrotom 1500 and visualized with VGStudioMax 3.2 Software.
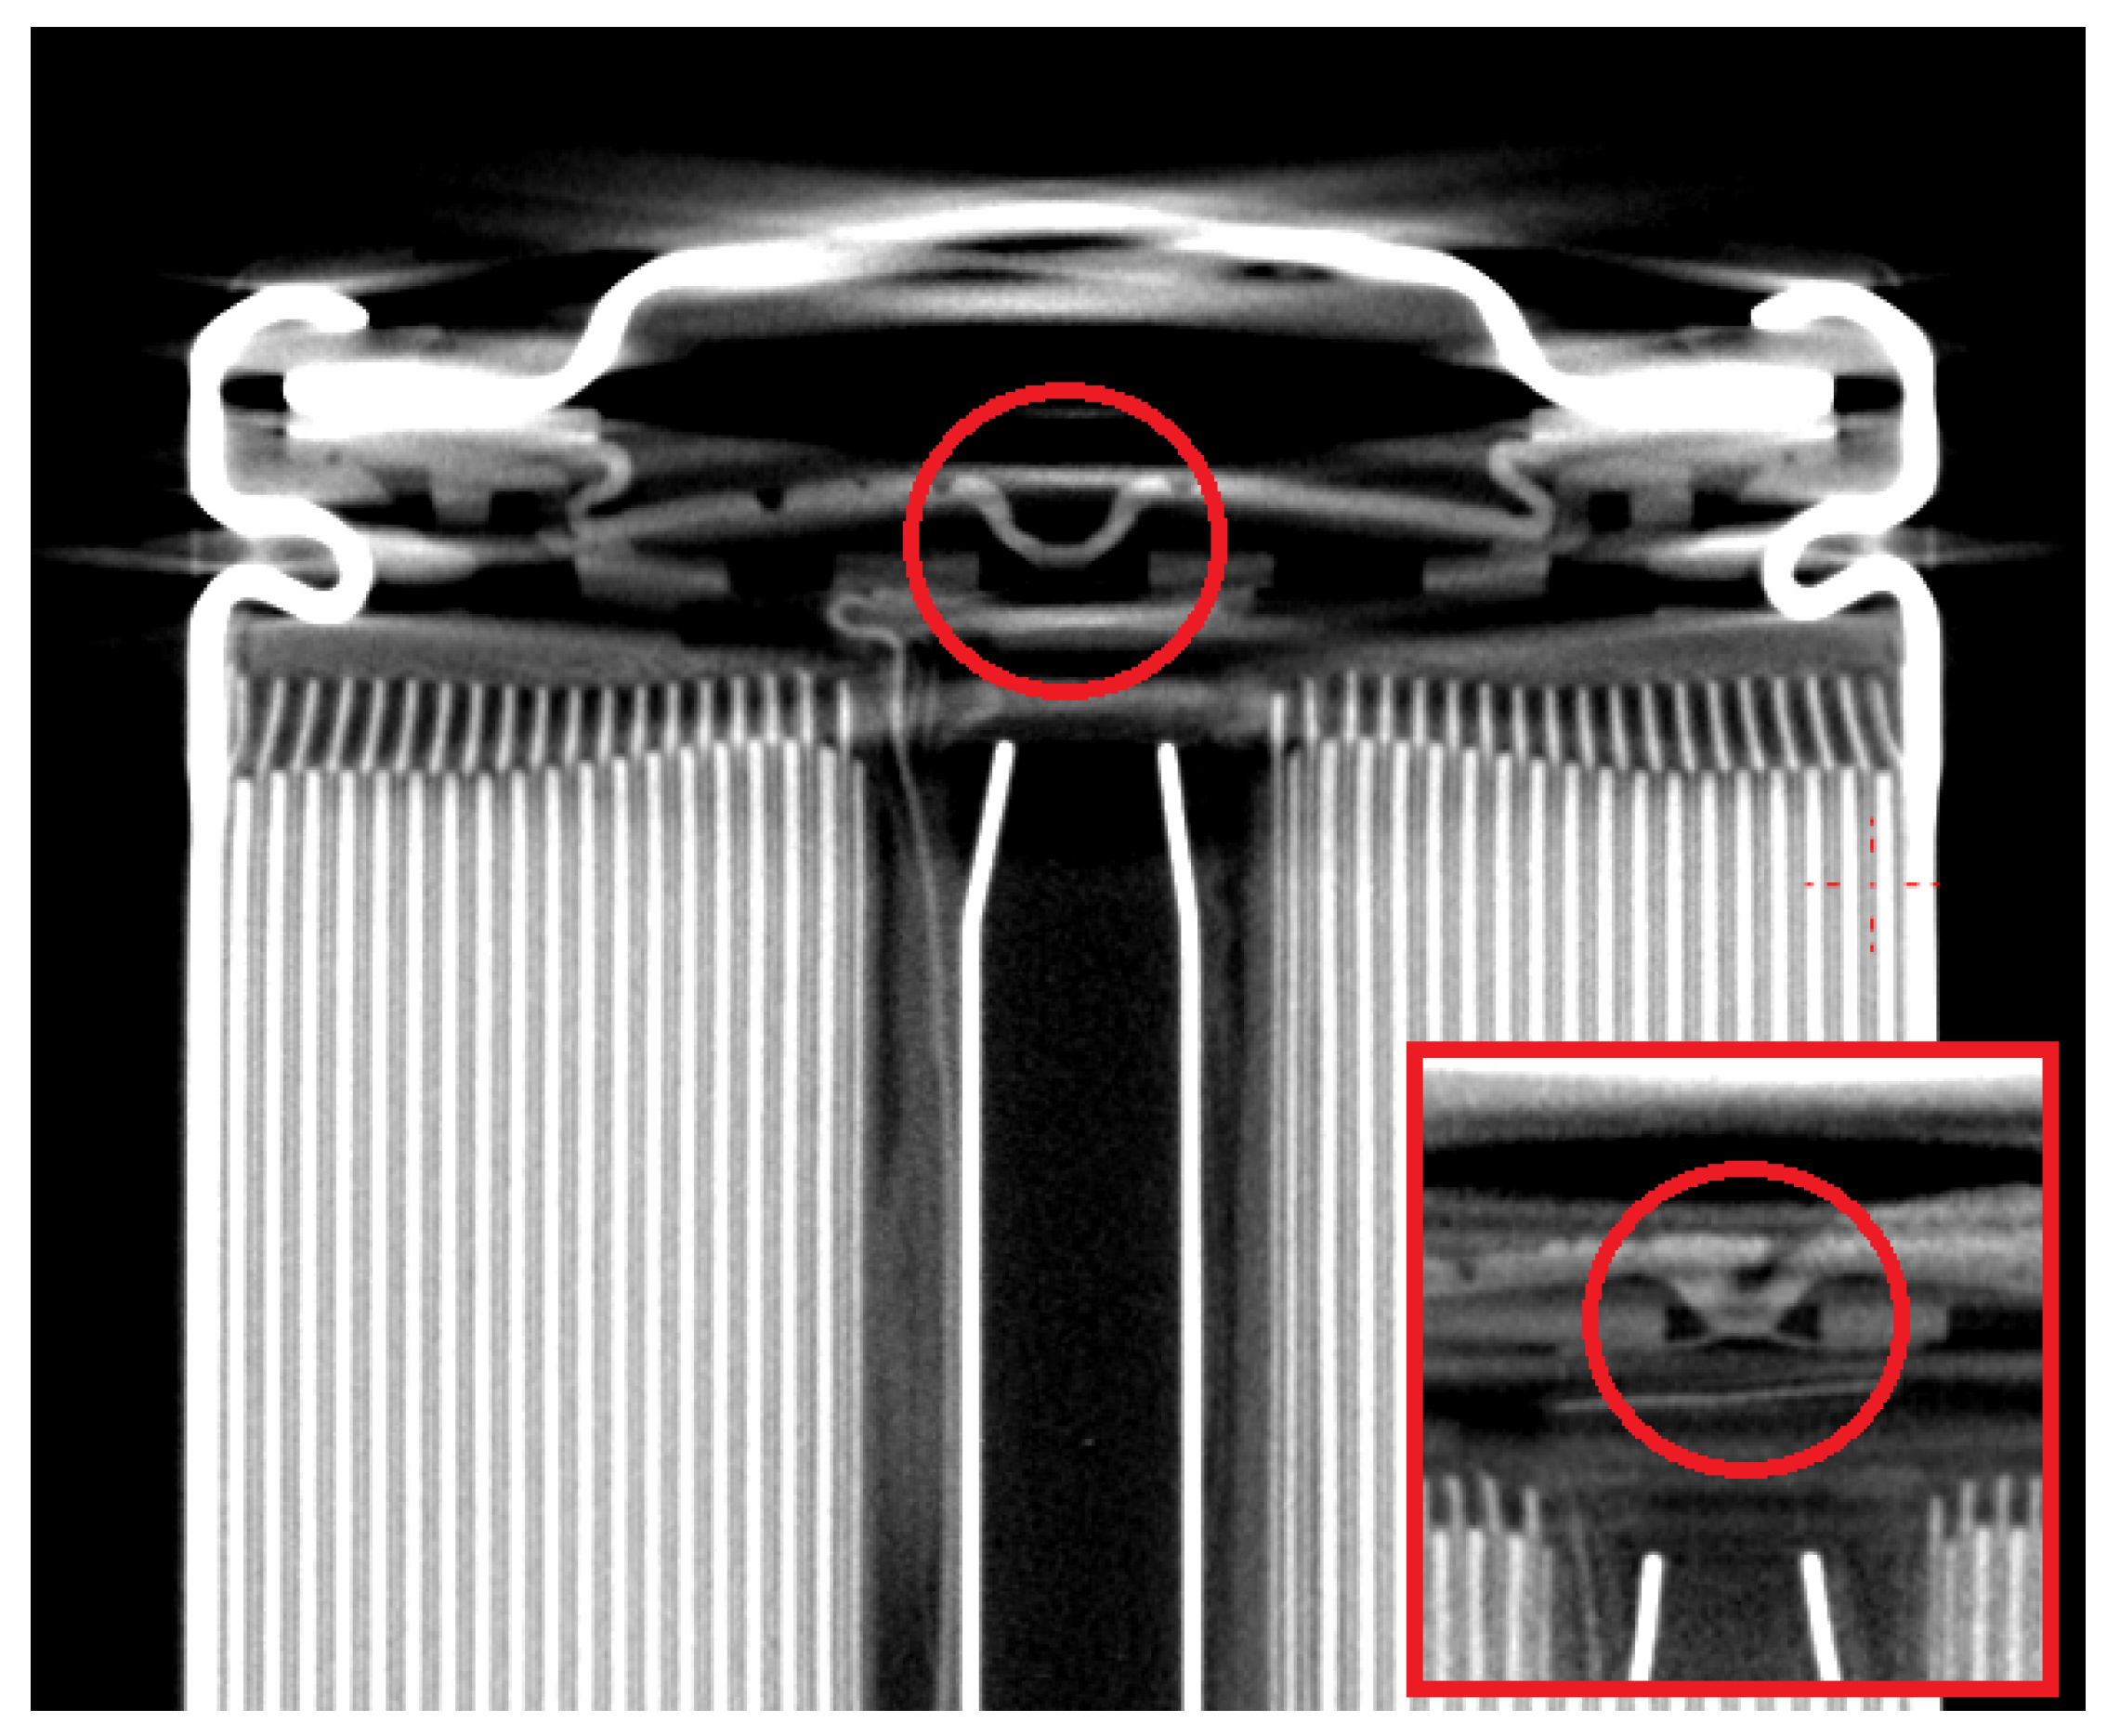
Three different types of cells were examined with the help of a CT scanner. Cells with a voltage of 0 V at the terminals (1p5, 2p3, 2p4, 2p5), the heavily aged, but still functional Cell 1p3, and the destroyed Cell 1p4 were investigated. Thus, all neighboring cells of the destroyed cell 1p4 were investigated. The used type of cell (SamsungICR 18650 26F) had three different safety features inside the positive terminal.
First, there was a Positive Temperature Coefficient (PTC) resistor between the positive terminal and the cathode. In the case of too high current and therefore rising temperature in the cell, the resistance value increased and limited the flowing current. In addition to the PTC, there was a Current Interrupt Device (CID). When the pressure in the cell increased, e.g., due to chemical reactions, the mechanism was triggered. Here, the connection between the positive terminal and cathode was permanently mechanically separated. The last feature was a safety valve. When the pressure was too high and the CID had no effect, the cell broke at a predetermined breaking point. This allowed the hot gas to escape in a controlled manner and prevented the explosion of the cell [
16].
3. Results
3.1. Battery Pack Measurement
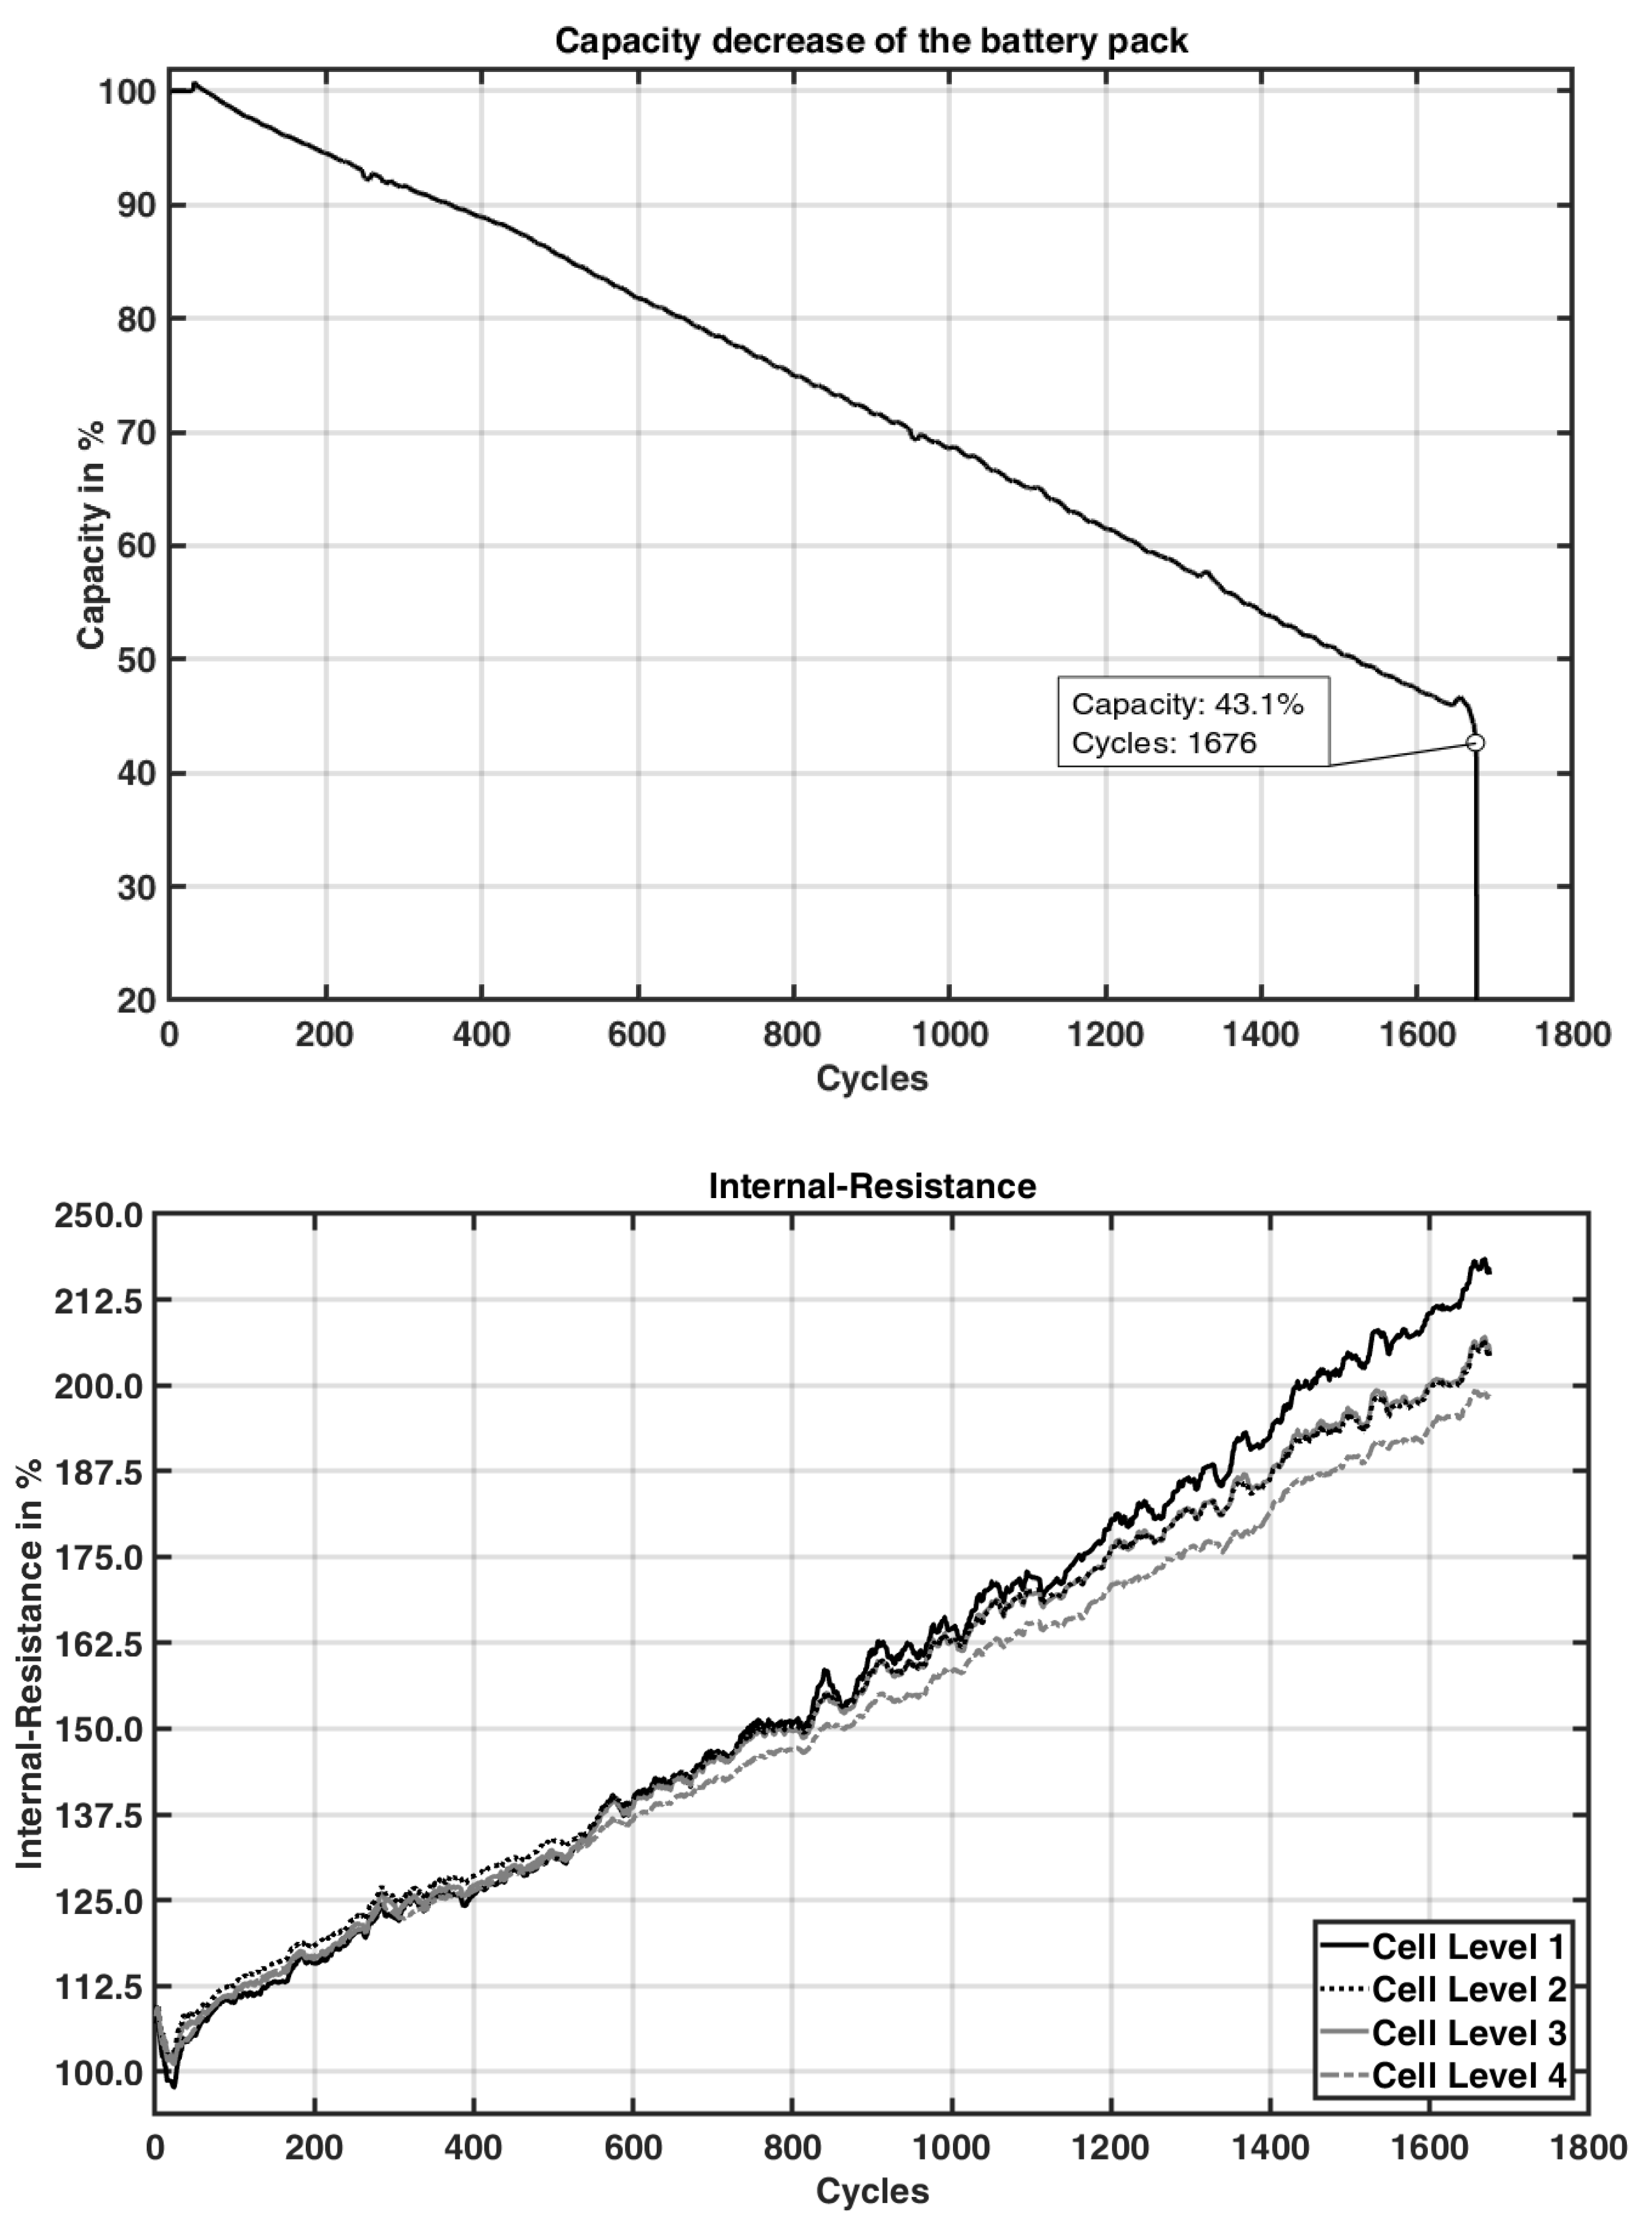
Figure 2 shows the development of the discharge capacity in percentage and DCIR in relative values over time. An internal resistance of 100% was thereby the starting value of 16 m
. An internal resistance of 200% meant that the resistance had doubled to 32 m
. The capacity value of 100% was calculated with help of the first five measured discharge capacities and resulted in an average capacity of 12.28 Ah. Due to calendar aging of the battery of 24 months, the capacity had already decreased by 0.72 Ah. The pack voltage during storage was 16.3 V. The voltage was evenly distributed on all cell levels.
The test was terminated by a thermal event after 1676 cycles and a capacity of 43.1% (5.287 Ah). Cell Level 1 showed a defective behavior. After the charging process, in the resting period, the voltage of the mentioned cell level fell slowly until the voltage finally dropped abruptly to 0 V. One cell in the affected level built up high pressure inside so that the safety valve was triggered. This thermal event was recorded by the independent temperature measurement of the test chamber in the form of a short and sudden rise in temperature.
Level 1 already turned out to have the lowest capacity in comparison to the other cell levels after the first 20 cycles. It triggered the end of the discharge process by reaching the minimum permissible cell voltage of 3.0 V first in every cycle. Similarly, Cell Level 1 first reached the final charge voltage of 4.21 V during the charging process. If one cell level within a battery pack was the first to reach both end of discharge voltage and end of charge voltage, its capacity was lower in relation to the other cell levels.
Apart from the mentioned voltage deviation, there were no other signs indicating an upcoming fault. Overall, the capacity degradation developed as expected. Two aging mechanisms could be identified. At first (until about 420 cycles), a slower degradation rate could be observed, which was referred to lithium loss. After 420 cycles, the degradation rate increased due to active material loss [
17]. Overall,
Figure 2 shows the aging behavior of the whole battery pack.
The value of internal resistance at the beginning of cyclic aging was approximately 17 m (relative value of 112.5%) for each cell level. This indicated a slightly increased starting value, which could be explained by calendar aging of 24 months. The average value of a single cell was thus 85 m. New cells of the same type had a typical value of about 50 m.
Although the voltage of Level 1 looked conspicuous, this was not reflected in the DCIR. Up to about 500 cycles, this level had even the lowest internal resistance. In the further progress of the test, however, this cell level developed the highest DCIR. After that, a clear dispersion between Level 1 and the other levels developed, which could be an indication of the imminent error.
3.2. Single Cell Measurement
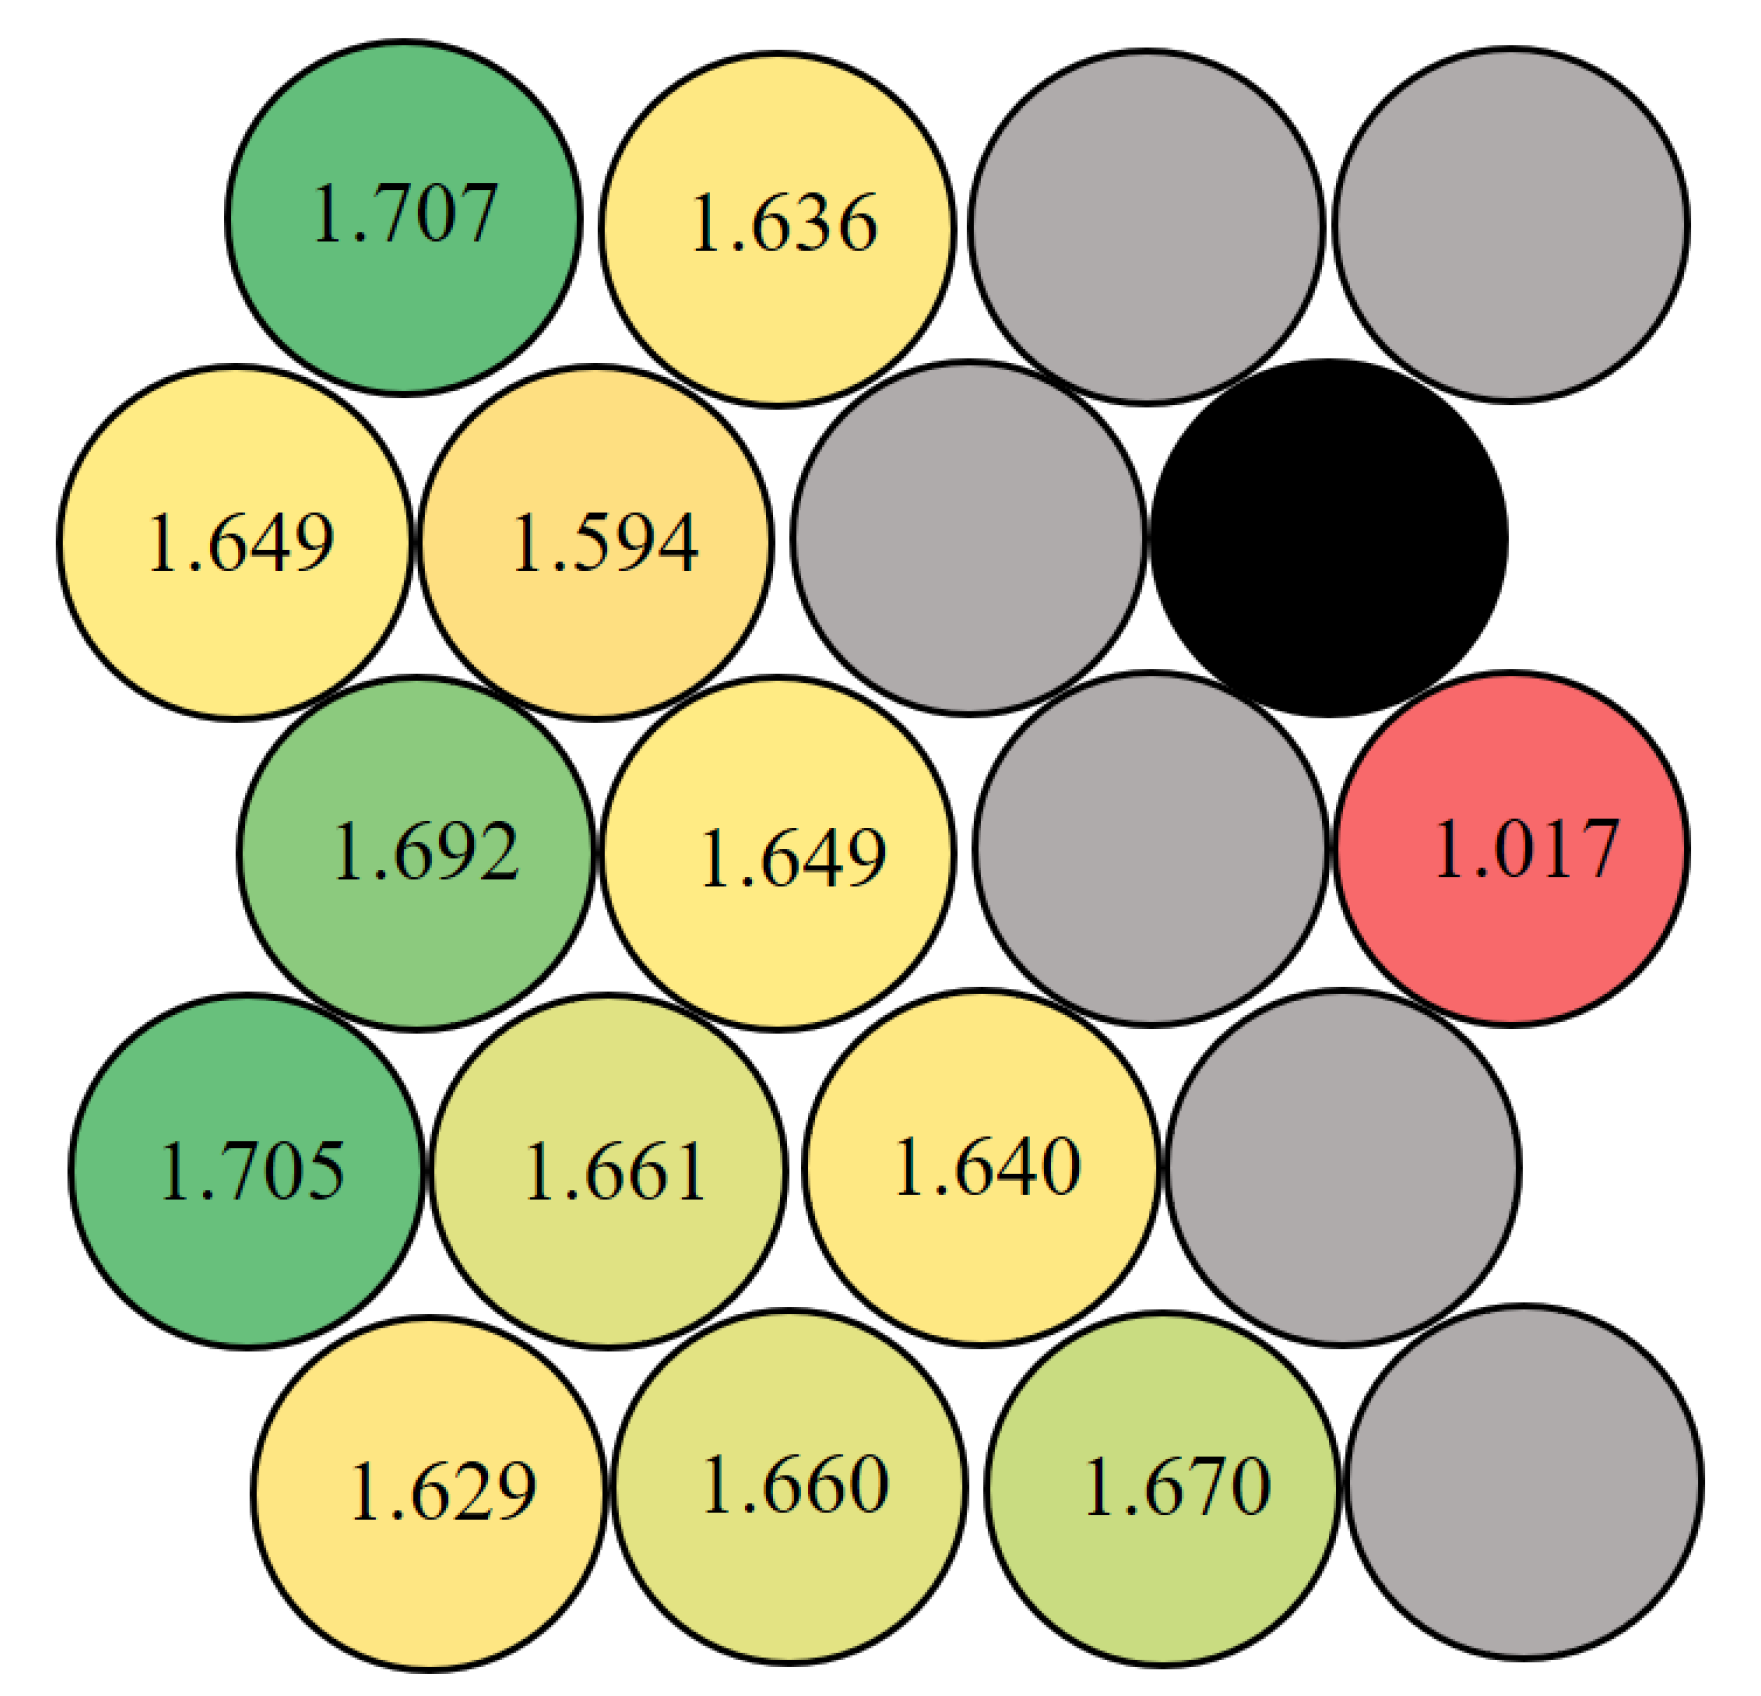
After disassembly, seven of 20 cells were not able to be measured. One of the seven cells was totally destroyed (1p4), whereas the remaining six cells had a measurable voltage of 0 V at the terminals.
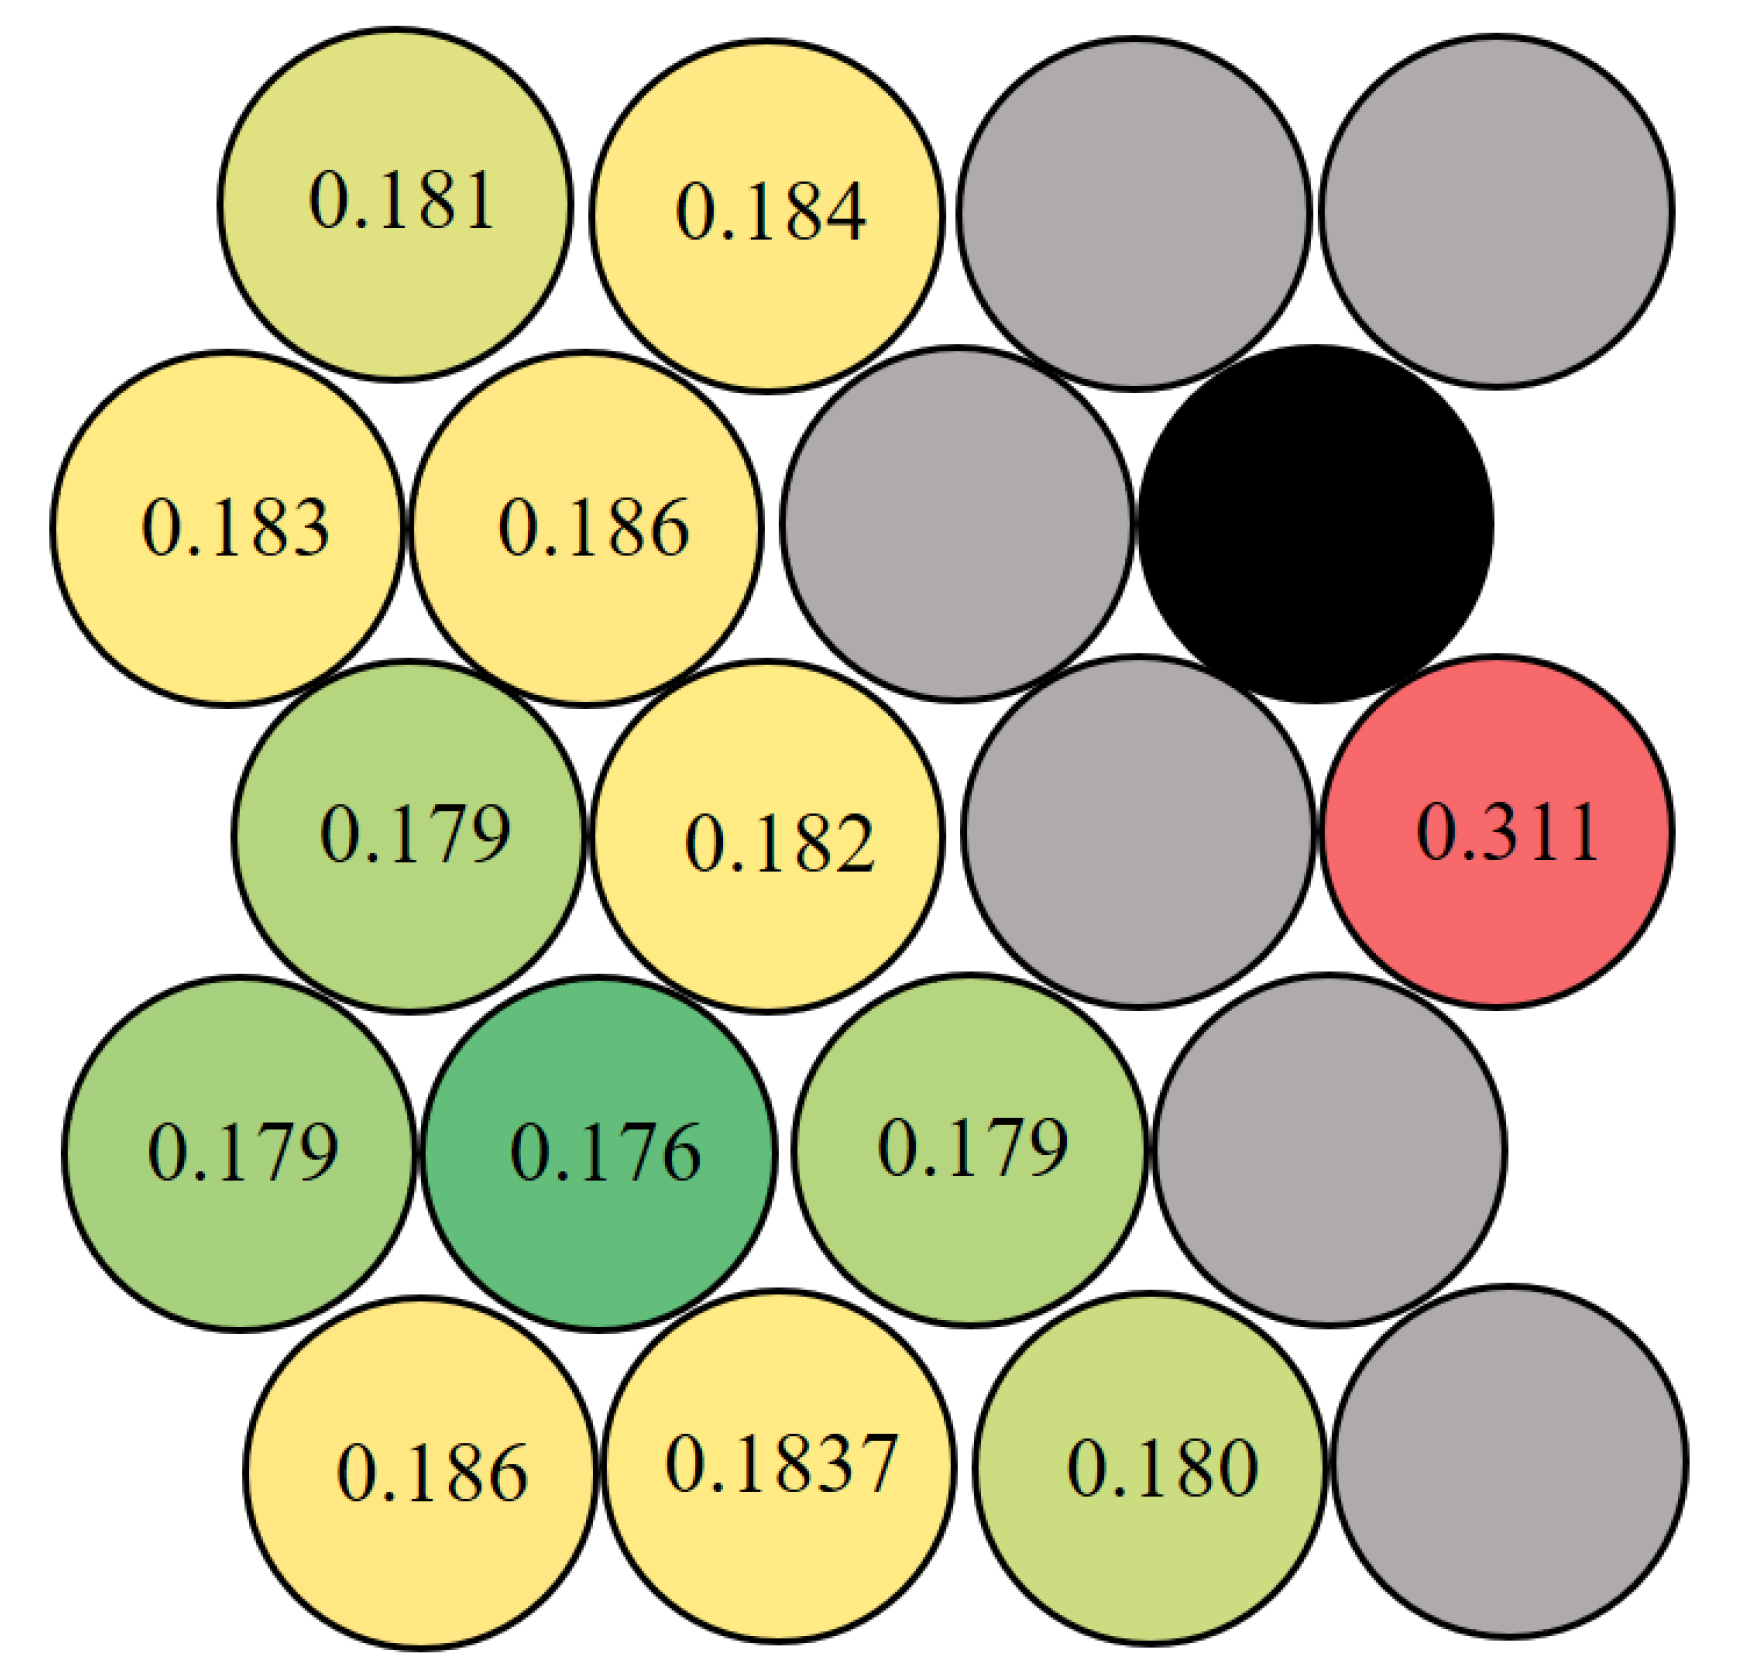
Figure 3 and
Figure 4 show an overview of the measured discharge capacity and DCIR with respect to the topology of the battery. In addition, each cell is marked with a color scheme. All grey cells had a measurable voltage of 0 V. The black cell could not be measured anymore, due to the triggered safety valve. All other cells are colored according to their capacity or their DCIR value. Red marks the worst cell, whereas dark green marks the best cell. The coloring makes it possible to recognize a trend in this case. In the left outer area is the level with the largest capacity (Level 4). This was due to the higher temperature inside the pack, which led to a stronger aging of the inner cells according to Waldmann et al. [
18]. However, this trend was not reflected in the DCIR values.
The only measurable cell from the immediate neighborhood of the destroyed cell had a significantly limited capacity and an enormously high internal resistance. The capacity was 38.5% below the average, and DCIR was even 70.8% above the average of the measurable cells. To express the cell-to-cell variation numerically, the variation coefficient could be used, defined by
, where
is the standard deviation and
the expected value. In this experiment, the cells (the cell 1p3 excluded) had a respective
. According to Oeser et al. [
19], a battery with an SOH of 78% has a respective
. The variation coefficient had a slightly higher, but nevertheless similar value to the related literature. The value was not unusually high, which could be associated with a comparable aging process in terms of cell-to-cell variation. In this case, the work of Oeser et al. was used as a short assessment to illustrate that the development of the cell-to-cell variation of this experiment was comparable to other experiments in the literature, although in this case, only one battery was tested.
3.3. Post Mortem Computed Tomography
The investigated cells had a height of 65 mm and a diameter of 18 mm each. In the center, a mandrel was inserted to increase the stability of the jelly roll. Anode and cathode tabs were connected at the end and at the beginning of the jelly roll near the mandrel. Various suppliers realize the connection of the cathode tab not in the beginning of the jelly roll, but in the middle.
The CT images revealed that all cells with 0 V at the terminals had a triggered CID (see
Figure 5). Since the CID could only be triggered by overpressure in the cell, a chemical reaction must have taken place, which was triggered by the neighboring, destroyed cell 1p4.
Cells at the same level could not have taken the damage of high currents resulting from one missing cell in the parallel setup, because during the thermal event, cells were in the relaxation phase, and no current was flowing. Probably the heat spread over the metal to the cells of the same and adjacent level, which led to the triggering of the CID of the remaining cells.
Cell 1p3, which was a direct neighbor, was surprisingly still functional. Its CT scan revealed that the CID had not been triggered yet, but it already had a larger bulge. The pressure inside the cell was not high enough to lead to a complete triggering. As well as the incipient curvature and the significantly worse electrical parameters, this cell was also significantly affected by the thermal event. When looking at the scan of the cell 1p3 more precisely, it became clear that the damage in the form of deformations inside the jelly roll was predominant. These deformations were mainly located at the beginning of the jelly roll near the mandrel (see
Figure 6). These deformations led to a slight propagation into the surrounding area. However, there were no deformations in the outer area of the jelly roll. The described mechanical changes could be observed over the whole length of the jelly roll.
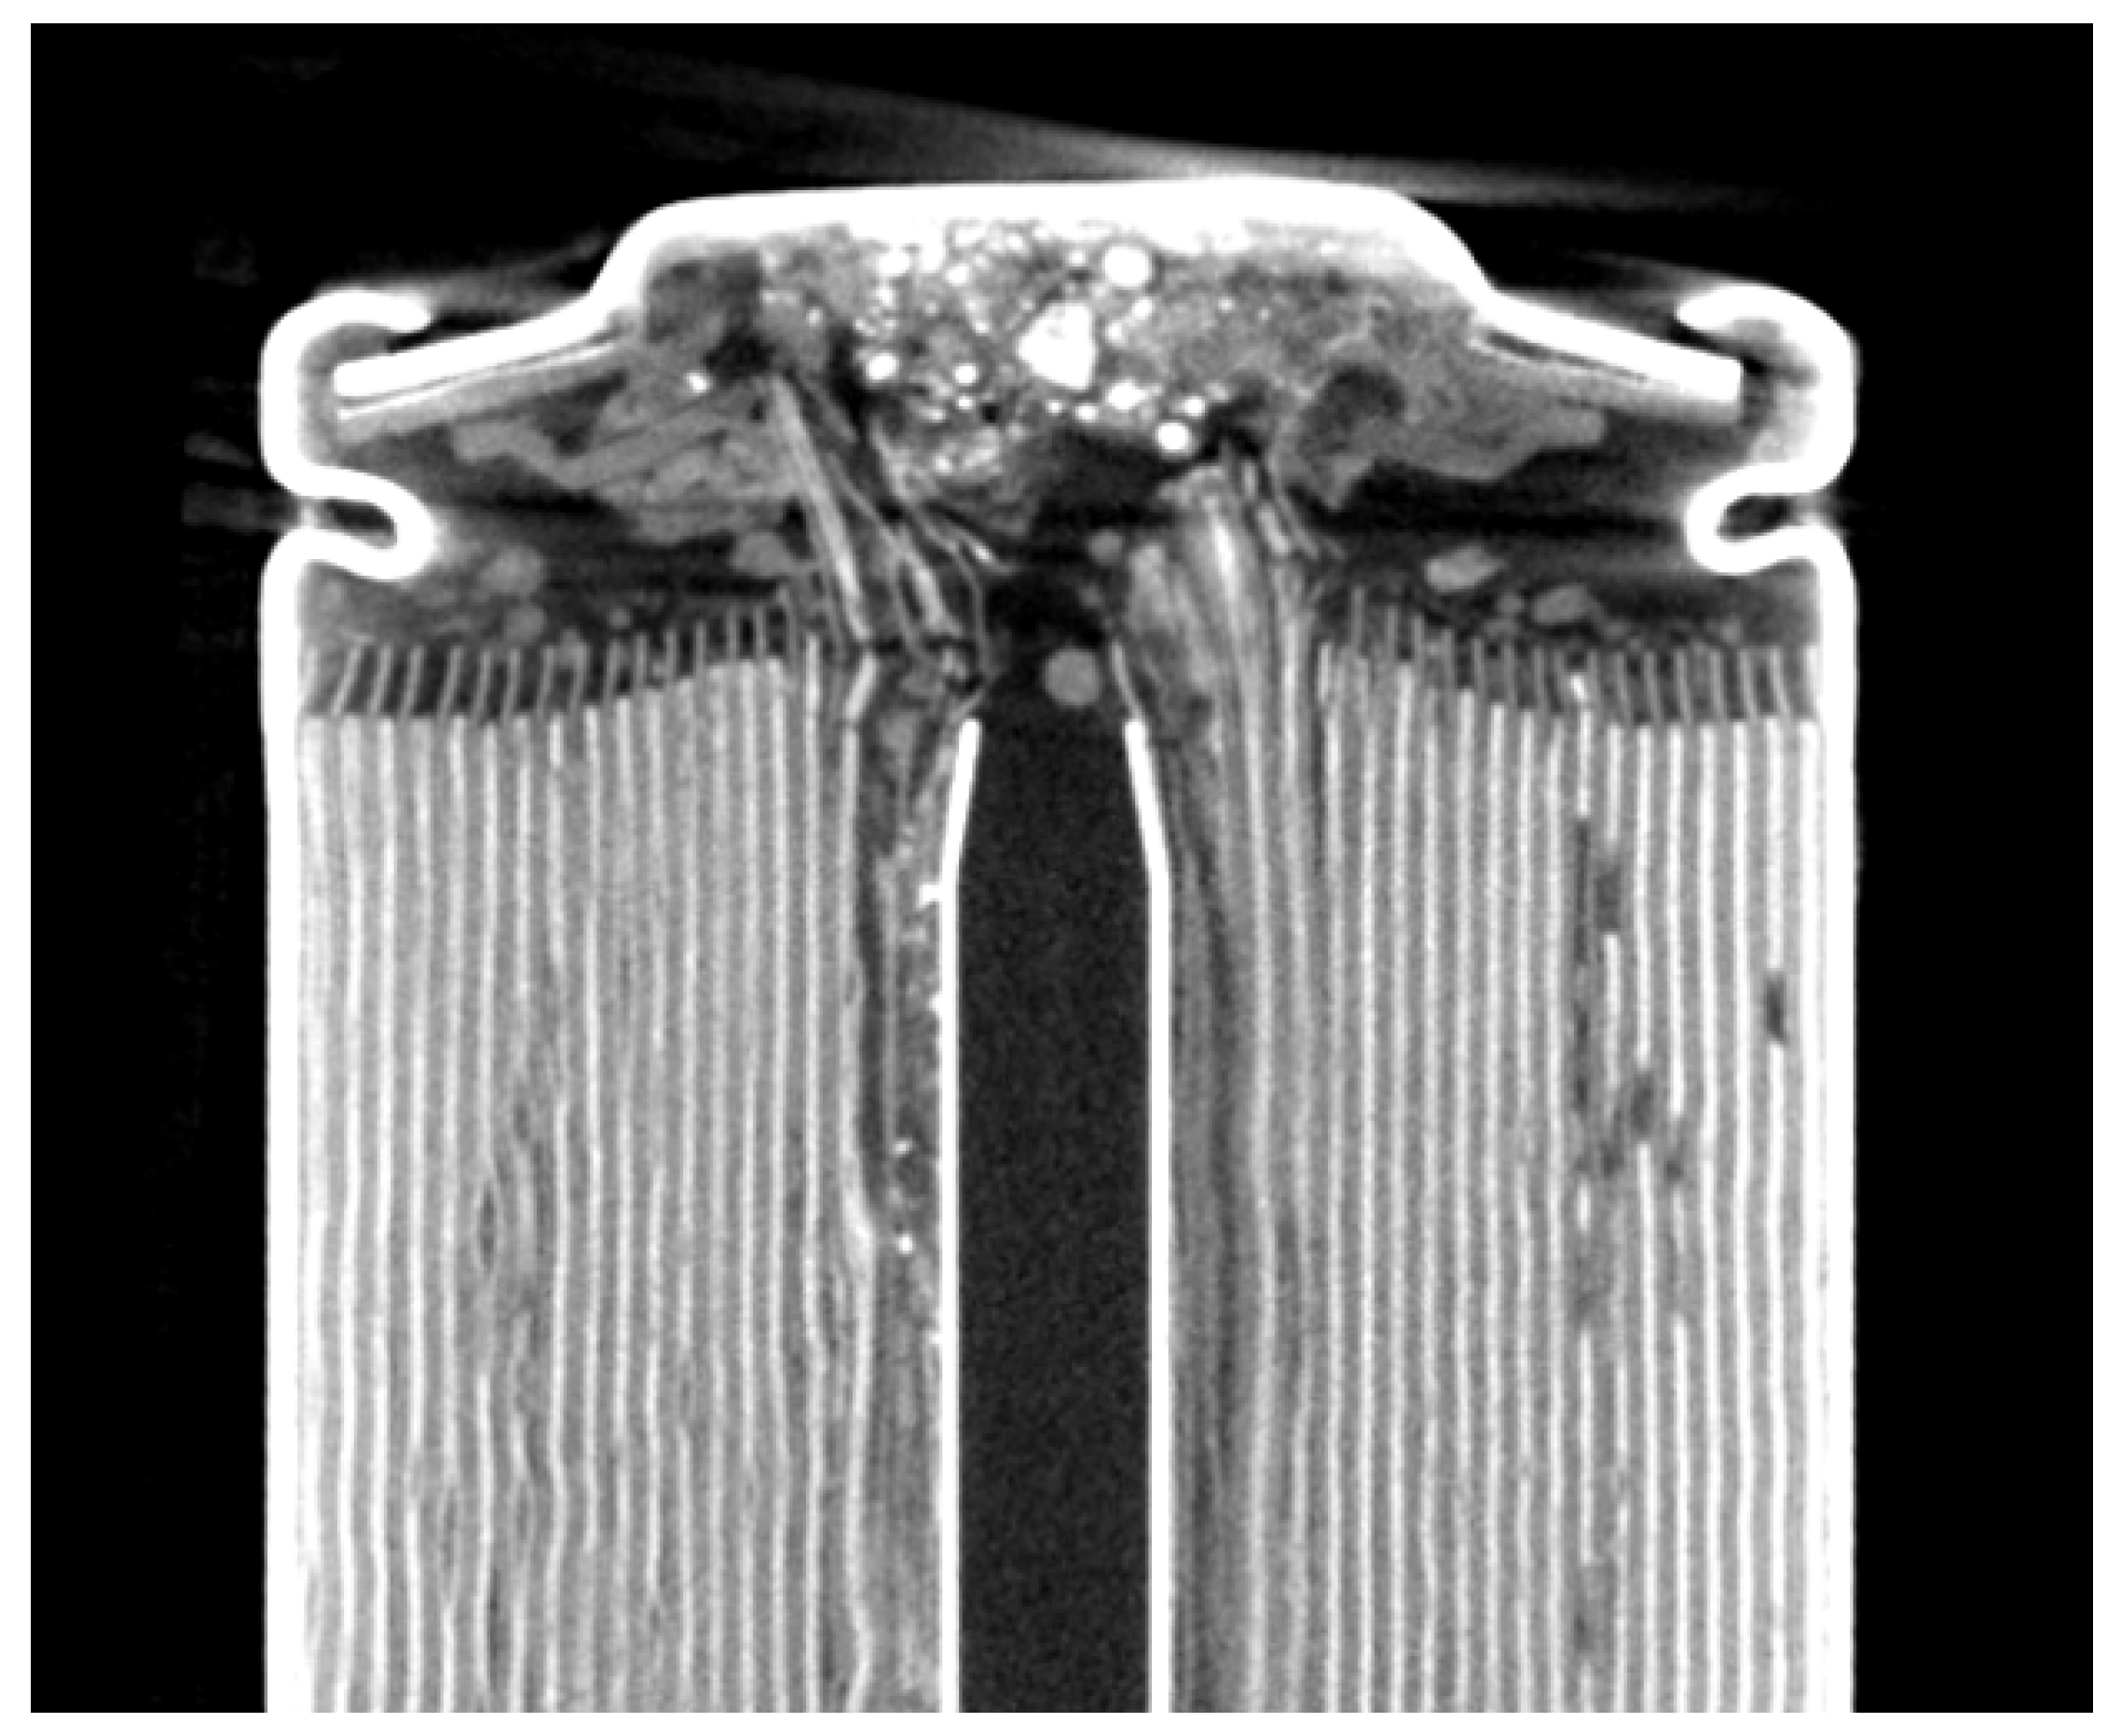
Figure 7 shows the defective cell (1p4). The jelly roll showed clear deformations caused by the thermal event. The connection point between the cathode and positive terminal was completely destroyed. The gas, which was under high pressure, dissolved parts of the material as it flowed out of the cell. Parts of the material were deposited directly under the positive terminal. Furthermore, the high pressure arched the positive terminal upwards.
The reason for the incident could be the current that was not adapted to the diminishing SOH. After significant loss of lithium and active material during the long test, lithium plating could lead to the growth of dendrites that could destroy the separator and short-circuit the cell, leading to a chain reaction.
4. Discussion
This experiment was conducted to investigate the ability of the second life use of smaller batteries below 1 kWh. The investigation focused on the reliability and the safety of such batteries in low SOH areas. For this, a battery with 192 Wh was aged till failure, and the electrical parameters were acquired. The common used criteria for End Of Life (EOL) of 80% and 70% were reached after 660 and 950 cycles. Since the decrease of only 10% SOH represented a gain of approximately 300 cycles and the safety in this area is still guaranteed by many suppliers, it could be recommended to use the battery up to at least 70% SOH. Overall, the capacity curve was very linear after about 420 cycles and showed no disproportionate performance loss, which was also confirmed by DCIR. The aging rate of the resistance of Level 1 of the battery changed after approximately 1000 cycles and thus deviated from the other levels. At this point, the efficiency of the battery decreased more strongly. However, the capacity still showed normal values that followed the trend.
Whether the disproportionate increase of the resistance was already an indication of the upcoming incident could not be confirmed with certainty.
With regard to the service life of the battery, the selected ambient temperature of 25
C is discussed. In reality, batteries are often operated in a wide temperature range between 0
C and 45
C. Waldmann et al. [
18] described temperature dependent aging mechanisms in lithium-ion batteries. According to this, the change in temperature is accompanied by a change of the aging mechanisms. At 0
C, especially lithium plating is the reason for the loss of cyclizable lithium, and thus the reason for the decrease in capacity. At 45
C, the growth of the solid-electrolyte-interphase (SEI)film is the main reason for the decrease in capacity. At temperatures in between, the aging mechanisms merge. Due to the complex interrelationships, it is not possible to make an exact statement about how the lifetime behaves at different temperatures. However, it can be assumed that at both 0
C and 45
C, the battery life will be significantly shorter. The ambient temperature of 25
C chosen in this paper represented an almost ideal operating temperature at which the highest lifetime could be expected.
The mentioned structural changes in the jelly roll have already been observed by other research teams. The formation of the deformation was dependent on various factors. In the investigations of Pfrang et al. [
14], the position of the cathode tab, which was connected in the middle of the jelly roll, played an important role. The deformation always took place in the direction of the cathode. The reason for this was the mechanical inhomogeneity created by the cathode tab. In this work, also, the deformations were located directly at the cathode tab. As there was no inhomogeneity within the jelly roll due to the placement at the beginning of the wrap, other reasons may be responsible for the deformation in our case. The position of the anode tab did not play a significant role as it was located at the outer area of the metal housing. In this work also, the anode tab did not seem to have any influence. Another important factor influencing the deformation of the jelly roll, which was examined by T. Waldmann et al. [
15], is the load current of the cell. While little to no deformation occurs at low cyclic current or during storage, a cyclic high current load has a strong influence. High loads cause thermo-mechanical stress that benefits deformation. In this experiment, the current for the cells used was chosen at 0.77 C. According to the data sheet, the cells can be discharged with 2 C and charged with 1 C. The recommended standard charge is 0.5 C. The cells therefore charged slightly faster than recommended by the manufacturer. After such a high number of cycles as in the experiment performed, deformations were therefore expected.
Due to the deformations, the compression of the active material increased in some areas. The authors concluded that at these areas of increased compression, active material was lost by detachment from the current collector or by destruction of the active material structure. These areas therefore posed an increased risk of lithium plating and dendrite formation, which could lead to cell destruction, like in the case of the cell 1p4.
Since there were no further indications that could elucidate a malfunction at an early stage, it is advisable to use such batteries only up to 70% SOH. Furthermore, it is not clear whether a reduction of the current at lower SOH, adapted to the aging conditions, would have delayed the failure of the test and still has to be investigated. There is also the possibility that an active balancing system could have prevented the failure through targeted energy redistribution. The advantages of such a system have already been demonstrated [
20].
5. Conclusions
This paper conducted an experiment in which a battery (192 Wh) was aged until the occurrence of a thermal event. A total of 1680 cycles were achieved until a single cell in the battery failed and led to a chain reaction. Thereby, neighboring cells were also damaged. Only the CT scan was able to provide information of the actual cell state, which indicated a harmful change in our experiment. In the evaluation of the common electrical parameters, no early detection features could be found, which indicated an imminent failure, whereby a cyclic aging below 70% SOH could not be recommended. Further use as second life was associated with a high risk, which could not be estimated. Due to the small amount of energy that smaller batteries carried with them, the additional use was significantly lower in relation to the underlying risk. A statement about the second life operation of batteries with a different design and cell type cannot be made based on the results obtained. The safety mechanisms of the used cells could prevent a fire in this experiment. Especially in applications with several cells in series and parallel connection, however, the fire risk increases significantly. In this case, the safety mechanisms of the used cells alone would not be sufficient.
Author Contributions
Data curation, A.Z., D.O., and T.H.; investigation, A.Z. and T.H.; methodology, A.Z. and D.O.; project administration, D.M.-M. and A.A.; software, T.H.; supervision, A.A.; validation, D.M.-M. and A.A.; visualization, A.Z.; writing, original draft, A.Z. and D.O.; writing, review and editing, A.Z., D.O., and T.H. All authors have read and agreed to the published version of the manuscript.
Acknowledgments
The authors would like to thank Preh GmbH for carrying out the CT scans and handing over the data obtained.
Conflicts of Interest
The authors declare no conflict of interest. The authors alone are responsible for the content and writing of this article.
References
- Chapman, L. Transport and climate change: A review. J. Trans. Geogr. 2007, 15, 354–367. [Google Scholar] [CrossRef]
- Hashemnia, N.; Asaei, B. Comparative study of using different electric motors in the electric vehicles. In Proceedings of the IEEE 2008 18th International Conference on Electrical Machines, Vilamoura, Portugal, 6–9 September 2008 2008; pp. 1–5. [Google Scholar]
- Lu, L.; Han, X.; Li, J.; Hua, J.; Ouyang, M. A review on the key issues for lithium-ion battery management in electric vehicles. J. Power Sources 2013, 226, 272–288. [Google Scholar] [CrossRef]
- Cano, Z.P.; Banham, D.; Ye, S.; Hintennach, A.; Lu, J.; Fowler, M.; Chen, Z. Batteries and fuel cells for emerging electric vehicle markets. Nat. Energy 2018, 3, 279. [Google Scholar] [CrossRef]
- Eisenberger, D. Zahlen–Daten–Fakten zum Deutschen Fahrradmarkt 2018. Pressemitteilung Zweirad- Industrie-Verband. 2019. Available online: https://www.velototal.de/2019/03/21/zahlen-daten-fakten-zum-deutschen-fahrradmarkt-2018/ (accessed on 3 February 2020).
- Clewlow, R.R. The Micro-Mobility Revolution: The Introduction and Adoption of Electric Scooters in the United States. In Proceedings of the Transportation Research Board 98th Annual Meeting, Washington, DC, USA, 13–17 January 2019. [Google Scholar]
- Martinez-Laserna, E.; Sarasketa-Zabala, E.; Stroe, D.I.; Swierczynski, M.; Warnecke, A.; Timmermans, J.M.; Goutam, S.; Rodriguez, P. Evaluation of lithium-ion battery second life performance and degradation. In Proceedings of the 2016 IEEE Energy Conversion Congress and Exposition (ECCE), Milwaukee, WI, USA, 18–22 September 2016; pp. 1–7. [Google Scholar]
- Saez-de-Ibarra, A.; Martinez-Laserna, E.; Stroe, D.; Swierczynski, M.; Rodriguez, P. Sizing Study of Second Life Li-ion Batteries for Enhancing Renewable Energy Grid Integration. IEEE Trans. Ind. Appl. 2016, 52, 4999–5008. [Google Scholar] [CrossRef]
- Koch-Ciobotaru, C.; Saez-de-Ibarra, A.; Martinez-Laserna, E.; Stroe, D.; Swierczynski, M.; Rodriguez, P. Second life battery energy storage system for enhancing renewable energy grid integration. In Proceedings of the IEEE Energy Conversion Congress and Exposition (ECCE), Montreal, QC, Canada, 20–24 September 2015; pp. 78–84. [Google Scholar] [CrossRef]
- Boltersdorf, J.; Delp, S.A.; Yan, J.; Cao, B.; Zheng, J.P.; Jow, T.R.; Read, J.A. Electrochemical performance of lithium-ion capacitors evaluated under high temperature and high voltage stress using redox stable electrolytes and additives. J. Power Sources 2018, 373, 20–30. [Google Scholar] [CrossRef]
- Georgi-Maschler, T.; Friedrich, B.; Weyhe, R.; Heegn, H.; Rutz, M. Development of a recycling process for Li-ion batteries. J. Power Sources 2012, 207, 173–182. [Google Scholar] [CrossRef]
- Li, L.; Bian, Y.; Zhang, X.; Xue, Q.; Fan, E.; Wu, F.; Chen, R. Economical recycling process for spent lithium-ion batteries and macro- and micro-scale mechanistic study. J. Power Sources 2018, 377, 70–79. [Google Scholar] [CrossRef]
- Finegan, D.P.; Scheel, M.; Robinson, J.B.; Tjaden, B.; Hunt, I.; Mason, T.J.; Millichamp, J.; Michiel, M.D.; Offer, G.J.; Hinds, G.; et al. In-operando high-speed tomography of lithium-ion batteries during thermal runaway. Nat. Commun. 2015, 6. [Google Scholar] [CrossRef] [PubMed]
- Pfrang, A.; Kersys, A.; Kriston, A.; Sauer, D.; Rahe, C.; Käbitz, S.; Figgemeier, E. Long-term cycling induced jelly roll deformation in commercial 18650 cells. J. Power Sources 2018, 392, 168–175. [Google Scholar] [CrossRef]
- Waldmann, T.; Gorse, S.; Samtleben, T.; Schneider, G.; Knoblauch, V.; Wohlfahrt-Mehrens, M. A mechanical aging mechanism in lithium-ion batteries. J. Electrochem. Soc. 2014, 161, A1742–A1747. [Google Scholar] [CrossRef]
- Balakrishnan, P.; Ramesh, R.; Kumar, T.P. Safety mechanisms in lithium-ion batteries. J. Power Sources 2006, 155, 401–414. [Google Scholar] [CrossRef]
- Dubarry, M.; Truchot, C.; Liaw, B.Y.; Gering, K.; Sazhin, S.; Jamison, D.; Michelbacher, C. Evaluation of commercial lithium-ion cells based on composite positive electrode for plug-in hybrid electric vehicle applications. Part II. Degradation mechanism under 2 C cycle aging. J. Power Sources 2011, 196, 10336–10343. [Google Scholar] [CrossRef]
- Waldmann, T.; Wilka, M.; Kasper, M.; Fleischhammer, M.; Wohlfahrt-Mehrens, M. Temperature dependent aging mechanisms in Lithium-ion batteries—A Post-Mortem study. J. Power Sources 2014, 262, 129–135. [Google Scholar] [CrossRef]
- Oeser, D.; Ziegler, A.; Ackva, A. Single cell analysis of lithium-ion e-bike batteries aged under various conditions. J. Power Sources 2018, 397, 25–31. [Google Scholar] [CrossRef]
- Ziegler, A.; Oeser, D.; Hein, T.; Ackva, A. Development and Application of an Active Balancing System for Lithium-Ion Cells. In Proceedings of the 2019 IEEE Vehicle Power and Propulsion Conference (VPPC), Hanoi, Vietnam, 14–17 October 2019. [Google Scholar] [CrossRef]
© 2020 by the authors. Licensee MDPI, Basel, Switzerland. This article is an open access article distributed under the terms and conditions of the Creative Commons Attribution (CC BY) license (http://creativecommons.org/licenses/by/4.0/).

 ,
, 


