Abstract
An accurate lithium-ion battery state of health (SOH) estimate is a key factor in guaranteeing the reliability of electronic equipment. This paper proposes a new method that is based on an indirect enhanced health indicator (HI) and uses support vector regression (SVR) to estimate SOH values. First, three original features that can describe the dynamic changes of the battery charging and discharging processes are extracted. Considering the coupling relationship between pairs of the original health indicators, we use the differential evolution (DE) algorithm to optimize their corresponding feature parameters and combine them to form an enhanced health indicator. Second, this paper modifies the kernel function of the SVR model to describe the trend of SOH as the number of cycles increases, with simultaneous hyperparameters optimization via DE algorithm. Third, the proposed model and other published methods are compared in terms of accuracy on the same NASA datasets. We also evaluated the generalization performance of the model in dynamic discharging experiments. The simulation results demonstrate that the proposed method can provide more accurate SOH estimation values.
1. Introduction
Lithium-ion batteries are widely applied in many fields, which range from automobiles to ships and even satellites due to their high energy density, long lifespan, and other excellent characteristics [1,2]. The safety and reliability of lithium-ion batteries have always been of concern in their applications. The main risks are follows. Improper application can cause the battery temperature to rise or the battery to catch fire or even explode. Overcharge and overdischarge can cause changes in the material properties of the battery that result in irreversible capacity loss, reduced performance, and shortened lifetime. As the charging and discharging processes proceed, the performance between single cells in the battery pack gradually becomes unbalanced, which will shorten the lifetime of the battery pack [3,4]. Battery failures can result in failure of the electronic equipment.
As a discipline that is designed to assess battery life and thus to ensure the proper functioning of electronic devices or electronic systems, battery prognostic and health management (PHM) has recently been widely applied due to the prominence it has demonstrated in terms of various performance indicators [5]. Considering the influences of the ambient temperature and the load conditions on battery performance, it is important to accurately assess the battery state of health (SOH), which, as a critical indicator of battery aging levels that is based on battery characterization parameters, can be used as a key indicator of the remaining useful life (RUL) of a battery and facilitates the accurate evaluation of the entire system [6]. Nevertheless, due to the complex electrochemical reaction that occurs inside the battery, the SOH is not directly available.
In the past few years, various SOH estimation methods have been proposed. First, experimental data, such as the voltage, current, and impedance, can be extracted from the battery cycle processes. In addition, lithium batteries may differ in terms of their discharge methods according to their applications. However, the charging processes tend to be consistent. Therefore, we can utilize the charging processes of lithium batteries and various algorithms or models to realize SOH estimation. Therefore, considering various algorithms and models, the SOH estimation methods for lithium batteries can be roughly classified into three categories: empirical or semi-empirical methods, methods that are based on electrochemical/physical models, and data-driven methods [7,8,9,10,11].
Various empirical or semi-empirical methods have been proposed: Zhong W et al. [12] used the Thevenin model with battery polarization to simulate internal changes in the battery, but their simple model has substantial limitations; in [13] the authors utilized a second-order equivalent circuit model (ECM) for estimation; in [14] a standard equivalent circuit model was used, and then a genetic algorithm was employed to obtain its internal resistance. While the empirical models are easy to implement, the accuracy of methods of this type is limited by the robustness of the circuit models. The long-term trend prediction of the autoregressive synthesis (ARI) model was used as the capacity observation true value for the prediction stage of the SRCKF (square root cubature Kalman filter) algorithm to model the nonlinear degradation process of a lithium battery in [10]. Electrochemical-based methods can accurately simulate the electrochemical reactions that occur inside the batteries, and researchers will use mathematical methods to simplify them. These methods mainly use electrochemical impedance spectroscopy during battery cycling to conduct SOH estimation [15,16]. These models can also lead to an increase in the computational costs while yielding accurate results. Therefore, they are not suitable for SOH estimation processes.
The data-driven methods rely mainly on the intrinsic analysis of historical data, where an in-depth understanding of the principles of electrochemistry is not required [17]. These models typically use the extracted or processed features as inputs and output a battery capacity degradation curve. In the data-driven methods, many methods that are based on adaptive state estimation have been utilized for SOH prediction processes, such as the Kalman filter (KF) algorithm [7,8]; in [9] the authors proposed an improved PF algorithm, which was used to map the capacity degradation to the SOH estimate, and proved the effectiveness of the method by using multiple testing results. However, these methods also have limitations: over time, particle degradation will occur. To improve the prediction accuracy of the model, it is necessary to modify the model and to process or enhance the experimental data. Among the data-driven methods, health indicators such as the capacity have been widely extracted and utilized for battery SOH or RUL prediction: Maitane et al. [18] designed a new differential voltage curve for SOH prediction; Wu et al. [19] employed a polynomial neural network (NN) which can be regarded as a black-box with parameters; the authors of [20] utilized the fusion part incremental capacity and Gaussian process regression (GPR) to estimate the SOH; in [21] the authors applied Dempster–Shafer theory and the Bayesian Monte Carlo method to develop a new method for SOH estimation; In [22] relevance vector machine (RVM) and particle filtering were used to describe nonlinear relationships in dataset. Zheng C et al. [23] used the long short-term memory network to estimate the SOH for electric vehicles.
However, most feature-based data-driven methods simply use signal processing methods to process single health indicators without considering the possible coupling relationships between the various health indicators. In addition, modification of the model affects the accuracy of the prediction. Moreover, most available optimization programs often fall into locally optimal solutions due to the prevailing difficulty of adjusting the hyperparameters in a data-driven method. Hence, a differential evolution (DE) algorithm is used here for parameter optimization and a hybrid model for SOH estimation is proposed that is based on the DE algorithm and an improved support vector regression (SVR) algorithm. The main contributions of this paper are as follows:
- (1)
- Dynamic health indicators are extracted from the charging curves. The SOH prediction accuracy is regarded as the fitness of the evolution algorithm. Differential evolution algorithms are used to obtain the weights of the health indicators, and health indicators and their weights are combined to form an enhanced health indicator for the estimation of battery SOH.
- (2)
- A DE algorithm is used to form an enhanced health indicator (HI) and hyperparameters in an improved SVR method. The article also analyzes the improvement in the prediction accuracy of the enhanced health indicator compared to the original health indicators.
The remainder of this article is organized as follows: Section 2 presents the background information; Section 3 extracts the health indicators from charging and discharging curves; Section 4 presents the hybrid model framework, the improved SVR method, and the SOH estimation process; Section 5 compares estimation performances of various methods; and the final section presents the conclusions of this study.
2. Related Works
Compared with neural network, the SVR is a more effective machine learning approach in which the decision function is highly simple to establish. The computational complexity of the iterative solution relies on the number of support vectors, rather than the dimension of the sample space, in contrast to other machine learning methods. Therefore, it avoids the “disaster of dimensionality” and enhances the robustness of the model. Hence, it is popular with researchers in this field. For example, in [24], a non-iterative estimation model and a multistep estimation model are proposed, which use the energy efficiency as a model input; Liao et al. [25] utilized the particle swarm optimization (PSO) algorithm to optimize the hyperparameters of SVR; Wei et al. [26] regarded the capacity as the state variable in a simulation of the battery aging mechanism and effectively utilized PF to predict the battery SOH; and in [27] the authors proposed a novel method for SOH estimation that integrates classification and regression attributes of the support vector.
2.1. Description of the SVR Model
Since SVR excels in describing the nonlinear relationship between inputs and outputs, it is perfectly suitable for SOH estimation [28,29]. Suppose we have a battery dataset, , where is a feature vector and is the target output. An SVR function is defined as:
where denotes the output values, is a nonlinear mapping function, and w and b are the parameters to be determined. The objective of the regression is to make the output of the model as close as possible to . After a series of formula transformations, the standard form of support vector regression is derived:
with the constraints:
where denotes a penalty parameter, denotes a soft margin that is specified by the user, denotes the training error below and denotes the training error above . Then the original SVR function becomes:
where and are Lagrange multipliers and is the Gaussian radial basis function kernel.
2.2. Description of the DE Algorithm
Differential evolution is a parallel optimization algorithm that relies on swarm intelligence, which guides the optimization search by mimicking the heuristic group intelligence that is generated by cooperation and competition among individuals in the biological group [30].
The process of the DE algorithm is as follows: first, M individuals are randomly generated, each of which consists of n features and is used as the 0th generation population. In the iterative process, the differential strategy is used to realize individual mutation. The common differential strategy is as follows:
where is the g + 1 generation of individuals who results from the new mutation, represent individuals in the randomly selected gth-generation population, and F is the mutation factor, which is between 0 and 1. Then, a number that is between 0 and 1 is randomly selected for the crossing operation:
where is a cross indicator. Next, the greedy algorithm is used to select individuals to enter the next generation:
where is a fitness function; in this paper, the fitness function is the mean square error of the SVR prediction results.
3. New Health Indicator for SOH Estimation
In this section, the internal electrochemical reaction of the lithium battery is analyzed so that effective and suitable health indicators can be selected for the accurate modeling of the degradation phenomenon of batteries, and the accessibility of the selected features in tests will be considered. Three datasets were obtained from the NASA database for research, based on which the following four subsections will focus on the introduction of SOH, experimental data analysis, feature extraction from the charging curves, and feature analysis that is based on grey correlation analysis (GCA).
3.1. Definition of SOH
SOH, which is an indicator that quantitatively describes the battery state of health, characterizes the ratio of a performance parameter to a nominal parameter after a period of use of the battery. However, no uniform definition has been proposed except for indicators and concepts that were established in [30] for describing it. In this paper, the ratio of the current capacity to the nominal capacity is used to represent SOH, as expressed in Equation (8).
where represents the SOH value at the ith cycle, represents the capacity at the ith cycle, and represents the initial capacity. As charging and discharging progress, the capacity curves show an overall degradation trend.
3.2. Experiment Data Analysis
To observe the declining trend of SOH under various conditions, it is critical to conduct cyclic charge-discharge experiments. The dataset was provided by the Prognostics Center of Excellence at NASA Ames [31]. The three 18,650 LIBs numbered 05, 06, and 07 were produced by Idaho National Laboratory. The rated capacity and voltage of each battery are 2.2 Ah and 3.7 V [32], respectively. Three batteries were run through three operations (charging, discharging, and measuring impedance) at 24 °C: first, the batteries were charged at a constant current of 1.5 A until the voltage reached 4.2 V. Then, they were charged at a constant voltage until the current dropped to 20 mA. Next, the batteries were discharged at a constant current of 2 A until the voltage reached the discharge cut-off voltage. The conditions are enumerated in the Table 1, and their discharge cut-off voltages are inconsistent. Figure 1 shows the capacity aging curves of these three batteries.

Table 1.
Experimental conditions of batteries 05, 06, and 07.
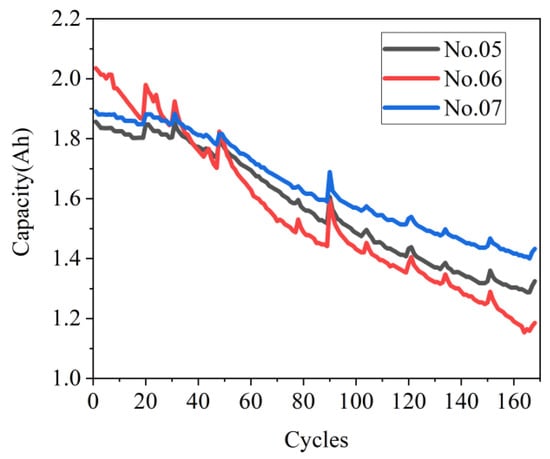
Figure 1.
Battery capacity degradation curves as functions of the number of cycles.
The byproduct may dissipate after the battery completes a charge-discharge cycle. Therefore, the capacity curves fluctuate in some cycles. Continuous switching between charging and discharging cycles may cause a momentary increase in battery capacity [33]. Hence, the battery capacity will increase in the next cycle compared with that in the previous cycle. This phenomenon is called capacity regeneration [34]. It will affect the precision and accuracy of SOH estimation [22]. To solve the problem and reduce the estimation error, we set one parameter of the kernel function to represent the capacity regeneration in Section 4.2.
3.3. Electrochemical Reaction Analysis and Features Extraction
Electrochemical reaction analysis shows that lithium ions, while charging, are forced by the external current to move from the cathode to the anode, thereby resulting in a negative concentration gradient in both electrodes, which increases in the direction of the current, peaks in the final stage of the constant current (CC) mode, and subsequently decreases to a minimum with a current drop at the constant voltage (CV) stage. As the battery ages, the charge quantity that is available on the cathode material will gradually decrease. Moreover, the growth of the solid electrolyte interface (SEI) layer will cause the internal resistance to continue to increase as the battery ages, thus, will reduce the duration of the CC charge mode. This analysis also shows that when discharging, lithium ions naturally move, in reverse, from the anode to the cathode to generate current, and the reduction of the voltage platform is mainly affected by ohmic resistance and polarization resistance. Therefore, battery aging leads to the increase of the polarization phenomenon and the decrease of the discharge time of the battery, where a relationship can be identified between the discharge time and the number of cycles.
Consider battery No. 06 as an example. Due to the inconsistency of the discharging modes under practical operating conditions, we focused on extracting features from the charging curves that reflect the battery degradation. In a later subsection of this article, the higher effectiveness of this approach compared to using the numbers of cycles as model inputs is discussed. According to Figure 2, during the charging phase, the time that the battery spends in CC mode decreases as the number of cycles increase, and the curve becomes steep.
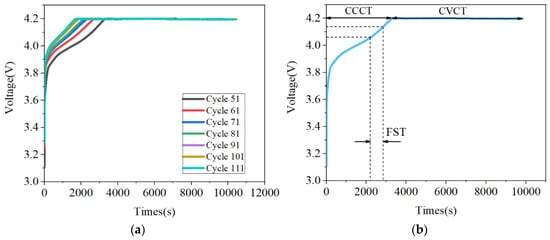
Figure 2.
(a) Charging curves at various cycles. (b) A graphical representation of features of charging curves.
According to the above analysis, the internal electrochemical reactions of a lithium battery are closely associated with the battery charging mode. Therefore, to improve the accuracy of SOH estimation, three features (the constant current charging time (CCCT), the constant voltage charging time (CVCT), and the time duration of the fixed segment (FST) that reflect these dynamic changes are extracted as follows:
- (1)
- CCCT: This is the time duration of the CC mode, namely, the amount of time for which the battery is polarized. According to the charging curves of batteries, the CCCT decreases as the cycle life increases.
- (2)
- CVCT: CV mode plays a role in eliminating polarization during the battery charging process. According to Figure 3b, the jitter of the CVCT curve of battery 06 is severe. According to the experimental results, its root means square error (RMSE) is indeed larger than those of the other two batteries, but it is smaller than those of the other compared methods.
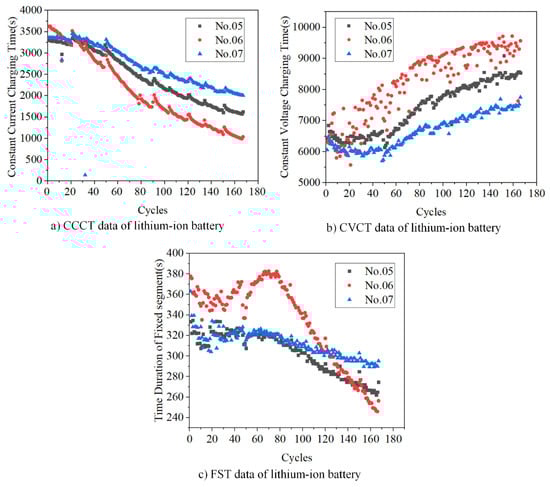 Figure 3. Changes of the selected features with the number of cycles.
 - (3)
- FST: This is the time that it takes for a battery to experience a fixed voltage interval during charging process. We focus on the constant current charging process. According to the experimental results, if only the slope of a point on the curve is considered and used as the input of the model, the obtained results will be affected by various factors (current fluctuations, ambient temperature, testing errors, etc.). The selection of this point such that high accuracy of the model is realized will be difficult. In the constant current charging process, the energy that was charged into the battery is proportional to FST. Previous research indicated that FST showed a downward trend as the battery was ageing.
Graphical representations of the selected features over many battery cycles are shown in Figure 3.
3.4. Feature Analysis Based on GCA and Proposal of the Enhanced Health Indicator
To evaluate the performance of the extracted health indicators, it is necessary to determine the correlations between the original health indicators and the battery SOH. Therefore, this paper used the grey correlation analysis (GCA) method [35] to assess the relational grades. The detailed procedure of the GCA algorithm is as follows:
For a specified dataset, first, set the reference sequence as . Then, determine comparative sequences , where i represents the sequence number and . In this case, denotes the SOH sequence, and represents the extracted features sequence. Then, calculate the relational coefficients:
where denotes the identification coefficient. To make the final result accord with people’s habits, namely, to make the length of distribution interval of not less than 0.5, should be between 0 and 1. In this paper, we chose = 0.5. After that, we calculated the relational grades .
According to the above GCA calculation, as presented in Table 2, a high relational grade is observed among the three features, whereas strong inconsistency of the relational grades is observed between the characteristics of the same battery and SOH. By comparison, as presented in Table 2, the degree of correlation between the cycle numbers and SOH is the lowest among these features. It is inferred that more accurate SOH estimation results will be obtained if the extracted features are used as model inputs.
Table 2.
Grey correlational grades between features and battery state of health (SOH).
In addition, we calculated the relational grades between each two of the three features, which we used to describe the coupling relationships of the three features.
According to Table 3, relational grade between any two features exceeds 0.6, and most of them exceed 0.7, thereby indicating that there are indeed coupling relationships of the three features. Therefore, to take advantage of this trait, the new concept of an enhanced health indicator is proposed, as expressed in Equation (10).
where a, b, and c are the corresponding features parameters, which will be optimized together with the parameters of the kernel function. Subscript N indicates that the variable is normalized. The CVCT curve exhibits an upward trend. To increase the accuracy, we subtract 1 from the normalized CVCT so that the processed feature curve shows a similar downward trend to the other feature curves. In several references [34,35,36], HIs were used directly to estimate SOH. Tests are conducted in Section 5 on which the estimated values that were obtained using original HIs and the enhanced HI are compared in terms of accuracy.
Table 3.
Relational grades between features.
4. Proposed SOH Estimation Algorithm
This part discusses the proposed SOH estimation algorithm. The framework of the algorithm is described in Section 1, the adjustments to the proposed model are presented in Section 2, and the procedure of SOH estimation method is introduced in Section 3. Since the hyperparameters of the model and the features coefficients are difficult to determine, a hybrid differential evolution support vector regression algorithm (DE-SVR) is proposed for obtaining accurate SOH estimation results.
4.1. Framework of the Proposed Method
First, the sequence is represented as a time series. In [37] and [11], the number of cycles is taken as input. As discussed previously, the relational grade between the number of cycles and battery SOH is lower than that between the features that are selected in this paper and the battery SOH. The enhanced HI is selected as the model input, namely, the input can be expressed as . The input sequence will be input into the trained model, and an error analysis will be conducted on the estimation results to evaluate the accuracy and robustness of the method.
4.2. Adjustments to the SVR Model
The actual SOH curve reflects the capacity regeneration phenomenon that occurs during battery cycling. To make the SOH prediction curve as close as possible to the actual curve, we must minimize the difference between the predicted output and the actual output. The kernel function largely determines the characteristics of the output curve. It is necessary to reasonably modify the form of the Gaussian kernel function to adapt to the volatility of the SOH curve. Therefore, this section aims at modifying the kernel function of the SVR, which is presented as Equation (11). The first term in the equation is used to represent the overall degradation trend of the battery SOH. The second term is used to simulate small fluctuations.
where g1 and g2 are the parameters that must be optimized.
4.3. SOH Estimation Procedure
The SOH prediction procedure is illustrated in Figure 4: first, multiple individuals are generated by a DE algorithm and each contains seven parameters, four of which are hyperparameters and three are feature coefficients. As described in the background section, mutations and other operations are performed on the individuals. Second, in calculating the individual fitness, we regard the estimation error as the fitness of the individual: once the experimental data have been collected, they will be divided into three parts for training, validation, and testing. Using this generation of individuals, we can build the enhanced HI according to Section 3.4 and input it into the model for training. Then, the validation set is used to improve the accuracy, and its error is regarded as the fitness of the individual. Third, after the iteration is terminated, we use the trained model and the evaluate set to test the generalization performance and robustness of the model. In this paper, the root mean square error (RMSE), as expressed in Equation (12), is used as the evaluation criterion.
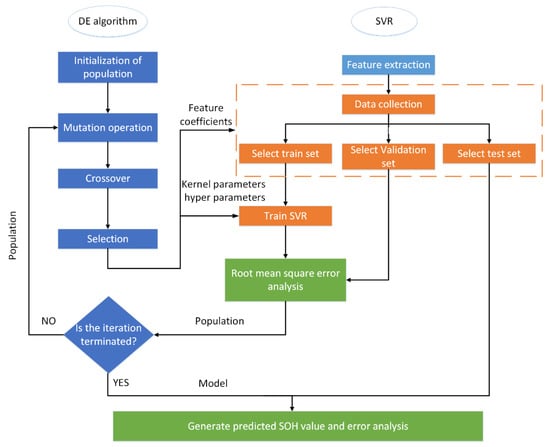
Figure 4.
The SOH estimation procedure.
The population was initialized by selecting NP = 20, F = 0.6, and CR = 0.8. Repeat the calculation of the fitness until the algorithm terminates (maximum number of iterations = 500). The optimal individual that is obtained at this time is used to define the optimal parameters of the model.
5. Simulation Analysis
The RMSE (see Equation (12)) and mean absolute percentage error (MAPE) (see Equation (13)) were used in this paper for error analysis. On this basis, the estimation results of SOH will be displayed and analyzed in this section, with batteries 05, 06, and 07 considered as examples.
5.1. SOH Estimation Results
First, to ensure satisfactory prediction accuracy, we chose the first 90 cycles as the training set, the 91st–120th cycles as the verification set, and the remaining cycles as the test set. Figure 5 presents the SOH estimation values and the estimation errors for batteries No. 05, 06, and 07; Figure 5a,c,e correspond to battery SOH prediction processes for the three tested batteries.
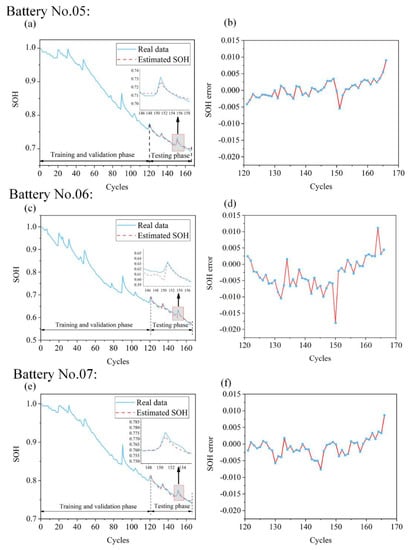
Figure 5.
SOH estimation results and errors. (a,b) Battery 05; (c,d) Battery 06; (e,f) Battery 07.
According to Figure 5a,c,e, even in the presence of battery capacity regeneration (the enlarged area in the figure), an accurate SOH estimate can still be obtained via the proposed method. In light of the relatively consistent trend between the prediction curves and the actual curves, it can be proved that the improved model realizes satisfactory performance in fitting the battery capacity degradation curves. Although the initial capacities of these three batteries differ, the initial SOH values are 100%. According to Figure 5b,d,f, all the errors are less than 0.02, which prove the high accuracy of the proposed model for battery SOH estimation. Finally, Table 4 presents the RMSEs and MAPEs of SOH prediction values of the dataset in the testing phase for four tests.
Table 4.
Root means square errors (RMSEs) and mean absolute percentage errors (MAPEs) of the SOH estimation errors for batteries 05, 06, and 07.
5.2. Increased Accuracy with the Enhanced Health Indicator
As discussed in Section 3.4, we used battery No.06 as an example to demonstrate the advantages of using enhanced HI. We utilized the same improved hybrid model for testing, with the only difference being that the inputs to the model were the three original features and the enhanced health indicator. Figure 6a presents the SOH estimation process with the original HIs used as model inputs. It is observed that the obtained curve in terms of the fitting trend, is not as accurate as that obtained via the proposed method. By contrast, higher accuracy is observed when the enhanced HI used, according to the SOH estimation errors that are plotted in Figure 6b when two HIs are used as model inputs. Therefore, the use of enhanced HI can yield more accurate SOH estimated values.
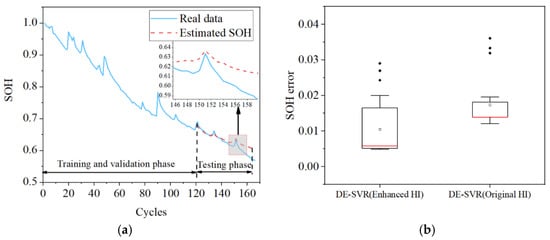
Figure 6.
SOH estimation errors using two types of health indicators (His). (a) SOH estimation; (b) SOH estimation errors.
5.3. Comparison with Other Models
We now compare the proposed method with other methods. For example, in [36] the authors proposed an algorithm that is based on PSO and SVR for estimating battery SOH, in which the battery capacity is selected as the feature and the data of NASA are used as well. Therefore, in this section, algorithms that are based on PSO and SVR are used in experiments to reproduce the prediction process. Each method is tested 50 times on each of the three batteries, and a box diagram is obtained as shown in Figure 7, according to which the method in [36] is outperformed by the method that is proposed in this paper in terms of accuracy, even though the difficulty of accurately measuring the battery capacity during the test is not considered. For battery No. 06, both methods have unsatisfactory robustness. This can be attributed to a feature of battery No. 06, namely, the TD feature of the battery fluctuates violently in the first 60 cycles. Additionally, the method that is proposed in this paper exhibits fewer overfitting phenomena, and the robustness of DE-SVR is higher than that of PSO-SVR.
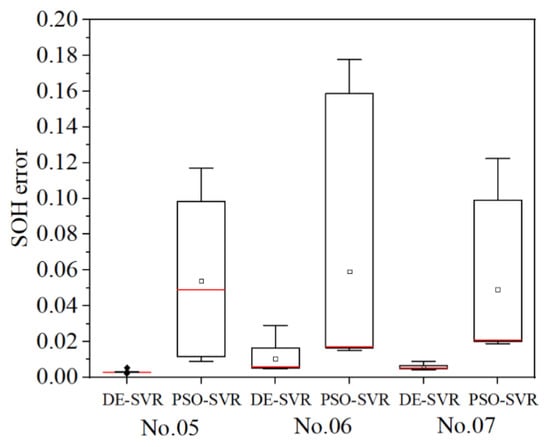
Figure 7.
SOH estimation errors of two methods.
We compared the prediction accuracy of the proposed model, in terms of RMSE and MAPE, with those of nine other published models (see Table 5). These methods all used the same NASA data set. All these methods are based on Gaussian process regression and modify the covariance function to estimate SOH. Table 5 presents the estimation performances for lithium-ion battery No. 06 of 10 methods.
Table 5.
Estimation performances of 10 methods for battery No. 06.
According to Table 5, the RMSEs of batteries No. 05, 06, and 07 that were obtained using the DE-SVR model are lower than those using other published methods. For example, the smallest estimation MAPE and RMSE of the published methods on battery No. 05 are 0.76% and 0.0068, while those of the proposed method are 0.23% and 0.0024. The smallest MAPE and RMSE of the DE-SVR model are only 0.13% and 0.0024, respectively.
5.4. Model Validation under Dynamic Working Conditions
The NASA data set is built on the premise of a constant current discharging process. This condition may be difficult to satisfy in practical application scenarios. Therefore, this paper used an 18650 lithium-ion battery that is labeled as NCR18650PF and manufactured by Panasonic. The battery has a rated capacity of 2.7 Ah. The nominal voltage is 3.6 V, and the highest and lowest cut-off voltages are 4.2 and 2.5 V, respectively. Figure 8a shows the equipment that was used for the battery test experiments. It includes a Kikusui PWX1500MH power supply, and a PLZ-4WH programmable electronic load for controlling the discharging current, a Yokogawa paperless recorder for data monitoring and storage, and a thermal chamber. Figure 8b shows the dynamic discharging current sequence. The current ranges from 0.75 to 2.25A and each time segment is 5 min. In addition, the sequence is randomized in order to simulate the actual working conditions. It is worth mentioning that we adopted NASA dynamic operating conditions [38], to ensure that the battery can perform the complete discharging process each time before it reaches the end of life (EOL).
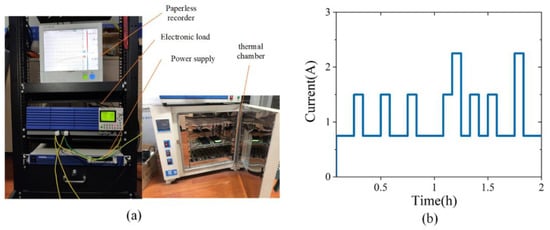
Figure 8.
(a) Battery test equipment; (b) the dynamic discharging process.
The charging process is as follows: the battery conducts constant current charging with a current of 2 A until the voltage reaches 4.2 V. Then, it conducts constant voltage charging until the charging current drops below 20 mA. The complete discharging process is as follows: the battery is discharged at the set current sequence. If the cut-off voltage has not been reached when the current sequence is completely performed, the battery will continue to be discharged at 0.75 A until the cut-off voltage is reached.
After experiments and calculations, Figure 9 shows the SOH estimation results that were obtained under dynamic discharging conditions. First, compared with the estimation error during constant current discharging, the error that is obtained via dynamic current discharging is larger, but it is still less than 4%. Therefore, the estimation results that are obtained in this case are still highly reliable; hence, the model that is proposed in this paper exhibits satisfactory generalization performance on various data sets. This phenomenon may occur because the quality of the data set is poor due to errors that are caused by the wire, which causes the jitter of the curve to be more severe, and the prediction results to be not as accurate as those shown in Figure 5.
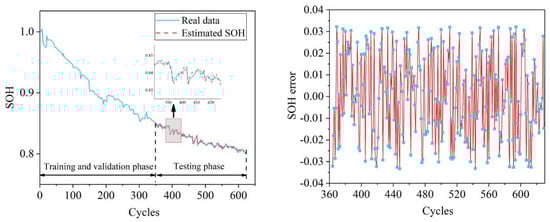
Figure 9.
SOH estimation results and errors.
6. Conclusions
This paper proposes an improved SVR algorithm for estimating SOH and its highlights mainly include the following: (1) it extracts features that reflect dynamic changes during battery charging processes, which, in combination, serve as inputs for SOH estimation; (2) it uses the GCA method to analyze the correlations of these features with the battery capacity and proposes the enhanced HI for improving the accuracy of the model; (3) it uses the DE method to optimize the hyperparameters of the improved SVR and the parameters of the enhanced HI; (4) the model that it presents has been validated on NASA’s battery data; (5) the SOH estimation results demonstrate low error and strong robustness in cyclic aging tests and accordingly, demonstrate that DE-SVR that is based on the enhanced HI realizes higher accuracy than that based on the original HIs. For other models, such as Gaussian regression models and the particle method, the proposed method can realize higher estimation precision; and (6) to evaluate the generalization performance of the model on other datasets, the SOH estimation results under dynamic current discharge conditions are also calculated in this paper. According to the above, the proposed hybrid model can accurately estimate battery SOH values. We will continue to optimize the model to lower its computational cost.
Author Contributions
Conceptualization, Z.L.; Methodology, J.Z.; Software, H.W.; Validation, C.Y. All authors have read and agreed to the published version of the manuscript.
Funding
This work was supported by the Natural Science Fund of Anhui Province (Grant number: 1808085MF200).
Acknowledgments
The authors would like to extend their sincere thanks to the NASA Ames Laboratory for providing open data
Conflicts of Interest
The authors declare no conflict of interest.
Abbreviations
| SOH | Battery State of Health |
| HIs | Health Indicators |
| SVR | Support Vector Regression |
| SOC | Battery State of Charge |
| RUL | Battery Remaining Useful Life |
| LIB | Lithium-Ion Battery |
| CC | Battery Constant Current Charging Mode |
| CV | Battery Constant Voltage Charging Mode |
| FST | Time Duration of a Fixed Segment |
| GPR | Gaussian Process Regression |
| LGPFR | Linear Gaussian Process Functional Regression |
| QGPFR | Quadratic Polynomial Gaussian Process Functional Regression |
| CLGPRF | Combination Linear Gaussian Process Functional Regression |
| CQGPRF | Combination Quadratic Polynomial Gaussian Process Functional Regression |
| SMK-GPR | Spectral Mixture Kernel Gaussian Process Regression |
| MGPR | Multiscale Gaussian Process Regression |
| RTPF | Real Time Particle Filter |
| EOL | End of Life |
References
- Zhang, X.; Wang, Y.J.; Yang, D.; Chen, Z.H. An on-line estimation of battery pack parameters and state-of-charge using dual filters based on pack model. Energy 2016, 115, 219–229. [Google Scholar] [CrossRef]
- Cheng, Y.J.; Lu, C.; Li, T.Y.; Tao, L.F. Residual lifetime prediction for lithium-ion battery based on functional principal component analysis and bayesian approach. Energy 2015, 90, 1983–1993. [Google Scholar] [CrossRef]
- Rezvanizaniani, S.M.; Liu, Z.C.; Chen, Y.; Lee, J. Review and recent advances in battery health monitoring and prognostics technologies for electric vehicle (ev) safety and mobility. J. Power Sources 2014, 256, 110–124. [Google Scholar] [CrossRef]
- Zhou, Y.P.; Huang, M.H. Lithium-ion batteries remaining useful life prediction based on a mixture of empirical mode decomposition and arima model. Microelectron. Reliab. 2016, 65, 265–273. [Google Scholar] [CrossRef]
- Wang, Y.J.; Zhang, C.B.; Chen, Z.H. A method for joint estimation of state-of-charge and available energy of lifepo4 batteries. Appl. Energy 2014, 135, 81–87. [Google Scholar] [CrossRef]
- Wu, J.; Zhang, C.B.; Chen, Z.H. An online method for lithium-ion battery remaining useful life estimation using importance sampling and neural networks. Appl. Energy 2016, 173, 134–140. [Google Scholar] [CrossRef]
- Hu, C.; Youn, B.D.; Chung, J. A multiscale framework with extended kalman filter for lithium-ion battery soc and capacity estimation. Appl. Energy 2012, 92, 694–704. [Google Scholar] [CrossRef]
- Andre, D.; Appel, C.; Soczka, T.; Sauer, D.U. Advanced mathematical methods of soc and soh estimation for lithium-ion batteries. J. Power Sources 2013, 224, 20–27. [Google Scholar] [CrossRef]
- Hu, C.; Jain, G.; Tamirisa, P.; Gorka, T. Method for estimating capacity and predicting remaining useful life of lithium-ion battery. In Proceedings of the 2014 International Conference on Prognostics and Health Management, Cheney, WA, USA, 22–25 June 2014. [Google Scholar]
- Xian, W.M.; Long, B.; Li, M.; Wang, H.J. Prognostics of lithium-ion batteries based on the verhulst model, particle swarm optimization and particle filter. IEEE Trans. Instrum. Meas. 2013, 63, 2–17. [Google Scholar] [CrossRef]
- Wei, Z.B.; Tseng, K.J.; Wai, N.; Lim, T.M.; Kazacos, M.S. Adaptive estimation of state of charge and capacity with online identified battery model for vanadium redox flow battery. J. Power Sources 2016, 332, 389–398. [Google Scholar] [CrossRef]
- Wei, Z.B.; Zhao, J.Y.; Ji, D.X.; Tseng, K.J. A multi-timescale estimator for battery state of charge and capacity dual estimation based on an online identified model. Appl. Energy 2017, 204, 1264–1274. [Google Scholar] [CrossRef]
- Kim, I.S. A technique for estimating the state of health of lithium batteries through a dual-sliding-mode observer. IEEE Trans. Power Electron. 2009, 25, 1013–1022. [Google Scholar]
- Chen, Z.; Mi, C.C.; Fu, Y.H.; Xu, J.; Gong, X.Z. Online battery state of health estimation based on genetic algorithm for electric and hybrid vehicle applications. J. Power Sources 2013, 240, 184–192. [Google Scholar] [CrossRef]
- Li, J.; Adewuyi, K.; Lotfi, N.; Landers, R.G.; Park, J.H. A single particle model with chemical/mechanical degradation physics for lithium ion battery state of health (soh) estimation. Appl. Energy 2018, 212, 1178–1190. [Google Scholar] [CrossRef]
- Galeotti, M.; Cina, L.; Giammanco, C.; Cordiner, S.; Carlo, A.D. Performance analysis and soh (state of health) evaluation of lithium polymer batteries through electrochemical impedance spectroscopy. Energy 2015, 89, 678–686. [Google Scholar] [CrossRef]
- Torai, S.; Nakagomi, M.; Yoshitake, S.; Yamaguchi, S.; Oyama, N. State-of-health estimation of lifepo4/graphite batteries based on a model using differential capacity. J. Power Sources 2016, 306, 62–69. [Google Scholar] [CrossRef]
- Berecibar, M.; Garmendia, M.; Gandiaga, I.; Crego, J.; Villarreal, I. State of health estimation algorithm of lifepo4 battery packs based on differential voltage curves for battery management system application. Energy 2016, 103, 784–796. [Google Scholar] [CrossRef]
- Wu, J.; Wang, Y.J.; Zhang, X.; Chen, Z.H. A novel state of health estimation method of li-ion battery using group method of data handling. J. Power Sources 2016, 327, 457–464. [Google Scholar] [CrossRef]
- Li, X.Y.; Wang, Z.P.; Zhang, L.; Zou, C.F.; Dorrell, D.D. State-of-health estimation for li-ion batteries by combing the incremental capacity analysis method with grey relational analysis. J. Power Sources 2019, 410, 106–114. [Google Scholar] [CrossRef]
- He, W.; Williard, N.; Osterman, M.; Pecht, M. Prognostics of lithium-ion batteries based on dempster shafer theory and the bayesian monte carlo method. J. Power Sources 2011, 196, 10314–10321. [Google Scholar] [CrossRef]
- Saha, B.; Goebel, K.; Poll, S.; Christophersen, S. Prognostics methods for battery health monitoring using a bayesian framework. IEEE Trans. Instrum. Meas. 2008, 58, 291–296. [Google Scholar] [CrossRef]
- Chen, Z.; Song, X.Y.; Xiao, R.X.; Shen, J.W.; Xia, X.L. State of health estimation for lithium-ion battery based on long short term memory networks. In Proceedings of the International Conference on Energy, Ecology and Environment, Swinburne Univ Technol, Melbourne, Australia, 21–25 November 2018. [Google Scholar]
- Wang, S.; Zhao, L.L.; Su, X.H.; Ma, P.J. Prognostics of lithium-ion batteries based on battery performance analysis and flexible support vector regression. Energies 2014, 7, 6492–6508. [Google Scholar] [CrossRef]
- Liao, R.J.; Zheng, H.B.; Grzybowski, S.; Yang, L.J. Particle swarm optimization-least squares support vector regression based forecasting model on dissolved gases in oil-filled power transformers. Electr. Power Syst. Res. 2011, 81, 2074–2080. [Google Scholar] [CrossRef]
- Wei, J.W.; Dong, G.Z.; Chen, Z.H. Remaining useful life prediction and state of health diagnosis for lithium-ion batteries using particle filter and support vector regression. IEEE Trans. Ind. Electron. 2017, 65, 5634–5643. [Google Scholar] [CrossRef]
- Patil, M.A.; Tagade, P.; Hariharan, K.S.; Kolake, S.M.; Song, T.; Yeo, T.J.; Doo, S. A novel multistage support vector machine based approach for Lithium ion battery remaining useful life estimation. Appl. Energy 2015, 159, 285–297. [Google Scholar] [CrossRef]
- Yang, D.; Wang, Y.J.; Pan, R.; Chen, R.Y.; Chen, Z.H. State-of-health estimation for the lithium-ion battery based on support vector regression. Appl. Energy 2018, 227, 273–283. [Google Scholar] [CrossRef]
- Vapnik, V. The Nature of Statistical Learning Theory, 2nd ed.; Springer Science & Business Media: Berlin, Germany, 2013. [Google Scholar]
- Price, K.; Storn, R.M.; Lampinen, J.A. Differential Evolution: A Practical Approach to Global Optimization, 1st ed.; Springer Science & Business Media: Berlin, Germany, 2006. [Google Scholar]
- Goebel, K.; Saha, B.; Saxena, A. Prognostics in battery health management. IEEE Trans. Instrum. Meas. 2008, 11, 33–40. [Google Scholar] [CrossRef]
- Li, X.Y.; Wang, Z.P.; Yan, J.Y. Prognostic health condition for lithium battery using the partial incremental capacity and Gaussian process regression. J. Power Sources 2019, 421, 56–67. [Google Scholar] [CrossRef]
- Orchard, M.; Tang, L.; Saha, B. Risk-sensitive particle-filtering-based prognosis framework for estimation of remaining useful life in energy storage devices. Stud. Inform. Control 2010, 19, 209–218. [Google Scholar] [CrossRef]
- Qin, T.C.; Zeng, S.K.; Guo, J.B.; Skaf, Z. A rest time-based prognostic framework for state of health estimation of lithium-ion batteries with regeneration phenomena. Energies 2016, 9, 896. [Google Scholar] [CrossRef]
- Tosun, N. Determination of optimum parameters for multi-performance characteristics in drilling by using grey relational analysis. Int. J. Adv. Manuf. Technol. 2006, 2528, 450–455. [Google Scholar] [CrossRef]
- Qin, T.C.; Zeng, S.K.; Guo, J.B. Robust prognostics for state of health estimation of lithium-ion batteries based on an improved PSO - SVR model. Microelectron. Reliab. 2015, 55, 1280–1284. [Google Scholar] [CrossRef]
- Weng, C.H.; Cui, Y.J.; Sun, J.; Peng, H. On-board state of health monitoring of lithium-ion batteries using incremental capacity analysis with support vector regression. J. Power Sources 2013, 235, 36–44. [Google Scholar] [CrossRef]
- Bole, B.; Kulkarni, C.S.; Daigle, M. Adaptation of an electrochemistry-based li-ion battery model to account for deterioration observed under randomized use. In Proceedings of the Annual Conference of The Prognostics and Health Management Society 2014, Fort Worth, TX, USA, 29 September–2 October 2014; Moffett Field Inc.: Santa Clara County, CA, USA, 2014. [Google Scholar]
© 2020 by the authors. Licensee MDPI, Basel, Switzerland. This article is an open access article distributed under the terms and conditions of the Creative Commons Attribution (CC BY) license (http://creativecommons.org/licenses/by/4.0/).