Abstract
This paper presents the results of a research project aimed at evaluating the unconventional natural gas potential of the autochthonous Miocene sediments in the Polish part of the Carpathian Foredeep. The primary objective of the study was to re-evaluate the biogenic gas generation system within Miocene sediments, paying special attention to unconventional gas resources accumulated in tight mudstone formations. The four-dimensional (4D) petroleum system modeling method (PetroMod software) was used to reconstruct the basin geometry and three-dimensional (3D) evolution through a geological timescale, in particular the progress of gas generation, migration, and accumulation processes, as well as their consequences for gas exploration and development. Special attention was paid to the dynamics of gas generation processes and the advancement of sediment compaction and their time dependence, as well as to the progress and outcomes of gas migration and accumulation processes. The results indicate significant potential for unconventional gas accumulations in mudstone reservoirs. However, part of the biogenic gas resources occurs in a dispersed form. Analysis of the dynamics of biogenic gas generation and accumulation conducted on a basin scale and within particular sedimentary complexes and depth intervals allowed an indication of the premises regarding the most favorable zones for mudstone–claystone reservoir exploration.
1. Introduction
Natural gas plays an important role in the Polish energy sector. The natural gas resources in Poland amount to 1823.1 × 109 cubic meters. However, annual consumption in Poland is about 15.5 billion cubic meters of high-methane natural gas, which means that in 2017, production from domestic gas fields covered only about 12% of gas demand in the country [1]. A few years ago, exploration for unconventional gas resources started in Poland, indicating new opportunities to increase the share of domestic gas fields in the national energy balance. Shale gas refers to natural gas occurring in organic rich shale reservoirs in free and absorbed states. Shale gas wells generally have no natural production capacity but can obtain industrial production with some technical measures under certain economic conditions [2]. The development of unconventional gas resources is increasingly influencing regional and global gas markets [3,4,5,6,7,8].
One of the interesting areas for shale gas exploration is the Carpathian Foredeep, which belongs to the major petroleum provinces in Poland. It accumulates mostly methane-dominant gas, which has been extracted for decades [9,10]. Dry gas accumulations occur in the form of multiple gas-bearing intervals (in some fields more than 20 gas intervals), predominantly in the Badenian and Sarmatian clastic formations along the whole profile of Miocene succession, but oil and gas reservoirs were also discovered in the Miocene basement, i.e., in Mesozoic and Paleozoic reservoirs. In total, 145 conventional hydrocarbon fields of total primary resources exceeding 200 bln m3 [9,11] were discovered in that area, accumulating mostly gas and/or condensate. The first discovery was made in 1946, but the major fields were discovered in 1956–1970 and 1980–1990 [10]. In the Carpathian Foredeep, a specific petroleum system developed within the Miocene formations (Badenian and Sarmatian), related to biogenic, methane-dominant gas generated from the dispersed humic organic matter under the shallow burial conditions [11,12,13]. The favorable reservoir rocks are sandstones, but a new exploration approach is currently being applied, which is oriented toward producing gas from mudstone-dominant heterolithic reservoirs. The mudstone-dominant heterolithic formations accumulate free gas in micropores and nanopores of laminae enriched in silicates. Their porosity is typically in the range of 8%–12%, with low, unconventional permeability that is a fraction of a millidarcy. Moreover, these formations also accumulate the gas adsorbed by insoluble organic matter and clay minerals [14,15,16].
The research projects completed up to now in the Carpathian Foredeep [17] have demonstrated the significant hydrocarbon biogenic generation potential of Miocene sediments, as well as the possible existence of gas accumulation outside the structural traps built of sandstone reservoir horizons. These conclusions became even more important when essential progress was made in the development of unconventional reservoirs (mudstones, shales, and/or tight sandstones). This paper provides, for the first time, full 3D modeling of hydrocarbon generation, migration, and accumulation processes (3D pressure, 3D temperature) based on comprehensive geological, petrophysical, and geochemical data from the large (over 4000 km2) portion of the Carpathian Foredeep. Such advanced modeling enabled the authors to quantitatively evaluate the hydrocarbon generation and accumulation potential of Miocene mudstone–claystone formations in the part of the foredeep adjacent to the Carpathian Overthrust.
2. Miocene Carpathian Foredeep Basin: Geological Background
The Carpathian Foredeep, the largest foredeep basin in Europe, developed during the Early/Middle Miocene as a peripheral, flexural foreland basin extending along the front of the advancing Carpathian Orogen. Its length in just the Polish part is about 350 km and its width reaches up about 100 km (Figure 1). Three periods of intense foreland subsidence were distinguished: The Early Miocene, the Early Badenian, and the Late Badenian–Sarmatian. The Carpathian Foredeep basin is subdivided into two parts: Inner and outer [18].
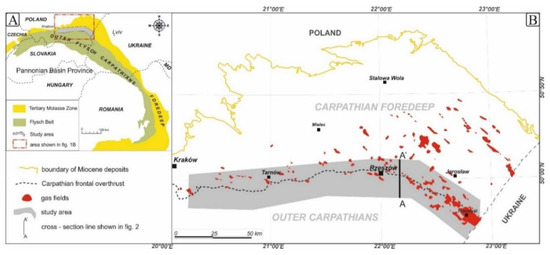
Figure 1.
(A) General outline map of Carpathian Foredeeep (after [22], modified), with (B) location of gas fields in the study area (after [23], modified).
The Inner Foredeep comprises two components: The autochthonous element, recently buried under the Carpathian flysch nappes, and the allochthonous element, extending along the front of the flysch. The foredeep is filled with both Lower and Middle Miocene sediments, up to 1500-m thick. These sediments were laid down in various, mostly terrestrial Early Miocene depositional environments, and in the Middle Miocene, mostly marine environments. The southern part of the Inner Foredeep hosts the oldest Neogene (Eggenburgian to Lower Badenian inclusive) strata deposited onto the mountain foreland during the earliest marine transgression. In Poland, these sediments are known as allochthonous members of the Stebnik Unit and were detached from the basement, folded, and thrust together with flysch formations over the autochthonous Miocene strata. The age of autochthonous Miocene sediments is dated at the Karpatian or even the Eggenburgian–Ottnangian until the Late Sarmatian–Early Pannonian [19,20]. The oldest sediments occurred in the inner zone, but with the migration of the basin axis to the north, the overlapping deposition of consecutively younger Miocene strata took place in the basin [21].
The Outer Foredeep, partly included in the Carpathian Orogen structures, is filled with Middle Miocene marine sediments of thickness vary from several hundreds of meters in the northern, marginal part up to about 3500 m in the southeastern part. Three segments were distinguished in the Outer Foredeep: (i) The SW-NE-trending western segment, 30–40 km wide; (ii) the latitudinal central segment, whose width is reduced to 5–20 km in the vicinity of Kraków; and (iii) the NW-SE-trending eastern segment, up to 100-km wide. The foredeep basement is the epi-Variscan platform and its Permian–Mesozoic cover. The consolidated basement comprises Proterozoic crystalline rocks accompanied by Proterozoic/Lower Paleozoic sediments. The depth to the top surface of the platform basement varies from several hundred meters to 3500 m [20].
In most of the study area, the autochthonous Miocene complex is overthrust by the Carpathian flysch nappes. Generally, it is accepted that the autochthonous Miocene comprises shallow-marine molasse, although the pre-Miocene morphology of the Paleozoic–Mesozoic basement was very diverse and the depths of paleovalleys might have reached even 1000 m [24]. Such differences in elevation of the basement surface influenced the deposition of Miocene strata, as they determined the facial diversity of sediments.
In the Polish part of the Carpathian Foredeep, sedimentary succession comprises Lower Badenian Sub-evaporite Series, Middle Badenian Evaporite Series, and Upper Badenian Supra-evaporite Series. In the Sarmatian sediments, several depositional environments were identified, all hosting gas accumulations (mostly biogenic and minor thermogenic in the most deeply buried sediments). From the bottom, these are: (i) Turbidites of submarine fans; (ii) deltaic sediments; and (iii) shallow-marine, estuarine, sand-bar, and lagoonal sediments [25,26,27]. These facies include one of the most important reservoir rocks in the whole Carpathian Foredeep, the turbiditic sandstones of submarine fans and the distal turbiditic sandstone–mudstone–claystone heteroliths of basin plains. Heteroliths of basin plains occur in the lowermost part of the Sarmatian succession, just above the evaporites. These are extremely fine-bedded claystones–mudstones. Turbidites of radial submarine fans are widely distributed over the eastern part of the Carpathian Foredeep, but to the north and up the sequence, these sediments are replaced by deltaic facies. The most typical features of submarine fans reservoirs are thin, but regular bedding and the common appearance of upward-fining layers show significant lithological contrast (sandstones grading into mudstones and even to claystones). Some turbidites hosting the thickest sandstone and conglomerate layers were deposited in the zones of migrating channels of the upper submarine fans. These are lensoidal layers, from several to a dozen meters (or even more) thick, showing random but generally coarse grain size. Finer-grained sediments developed as typical turbidites were laid down in the interchannel zones and the middle fan area [28].
For modeling purposes, the autochthonous Miocene sequence was divided into several major genetic complexes (Figure 2) that can be traced along the front of the Carpathians. The distinguished units comprise the following:
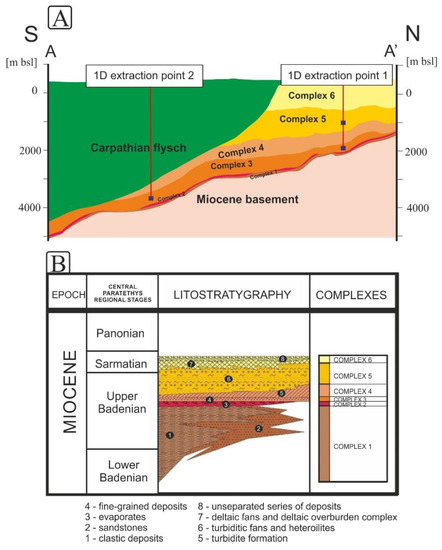
Figure 2.
(A) Schematic cross-section of study area depicting division of autochthonous Miocene sequence into several major genetic units (location of cross-section line is shown in Figure 1); extraction points with highlighted intervals within Complex 3 and Complex 5 indicate approximate locations for which detailed analysis of the dynamics of generation processes was accomplished (Section 4.2). (B) Stratigraphic and lithofacial scheme for Carpathian Foredeep [20].
- Complex 1: Lower Badenian, composed of clastic, mostly clayey, local (in the paleo valleys) sandy deposits.
- Complex 2: Lower Badenian evaporates.
- Complex 3: Upper Badenian fine-grained deposits and the lowest part of the Machów Formation, which are dominated by mudstones and shales with minor inclusions of sandstones.
- Complex 4: Upper Badenian turbiditic formation and lower part of Machów Formation, mostly composed of heterolithic fined-grained deposits with local occurrence of rather thin beds of sandstones.
- Complex 5: Upper Badenian turbidite formation II and middle part of Machów Formation, composed of turbiditic fans and heteroliths. The complex is much more sandy than Complex 4.
- Complex 6: Upper Badenian–Sarmatian deltaic fans and deltaic overburden complex and upper part of Machów Formation, containing a high grade of medium- to coarse-grained deposits.
3. Model of Miocene Biogenic Gas Generation System: Methodological Approach
The gas generation, expulsion, migration, and accumulation processes were analyzed using the methodology of dynamic (4D) modeling of petroleum systems supported by PetroMod software (Schlumberger). In this case, 4D modeling refers to three-dimensional (3D) reproduction of basin geometry and rock formations properties evolution through geological timescale (the fourth dimension is geological time). This also applies to fully spatial treatment of pressure and temperature fields evolution through time by simulation algorithms, and consequently provides 3D distributions of a number of petroleum system parameters for desired number of time-steps.
This methodology has been in development since the 1970s. It aims to construct comprehensive, dynamic models of sedimentary basins to illustrate the progress, mutual relationships, and results of many geological processes that have occurred in the study area, with reference to the geologic time scale. These include: (i) Structural evolution of the basin, (ii) compaction processes, (iii) changes of thermal conditions, (iv) kinetic reactions, and (v) hydrocarbon generation, expulsion, migration, retention, accumulation, and dispersion [29,30,31,32]. However, in the last years, the modeling methods of petroleum systems, initially mainly supporting the exploration of conventional reservoirs, have also been adapted to analyze unconventional accumulations in shale formations and basins hosting microbial (biogenic) gas [33,34,35].
This paper presents the results of dynamic basin modeling of the Miocene system generating biogenic gas. The numerical analysis was intended to (i) investigate the dynamics of generation, expulsion, and migration of biogenic gas, referring to structural, lithological, petrophysical, geochemical, thermal, and other factors; and (ii) identify the conditions that facilitate gas accumulation in unconventional reservoirs in mudstone–claystone formations. The identification of crucial elements of the model of the Miocene biogenic system was based on up-to-date results of geological, structural, petrophysical, and geochemical studies [36,37,38,39,40,41] and supported by publications dealing with the theory of biogenic reactions [33,34,42,43,44].
3.1. Miocene Biogenic Gas System
Both stable isotope and molecular composition analyses of the gas accumulated in Miocene formations of the Carpathian Foredeep have been ongoing for decades. Analyses of samples collected from some tens of gas fields and various reservoir horizons and depth intervals have indicated a high C1/(C2 + C3) ratio, with values almost always exceeding 100, and low ∂13C(CH4) values of methane, mostly falling in the range from −62‰ to −70‰ (Figure 3). These parameters point to the biogenic origin of methane [11,12,13,45,46,47].
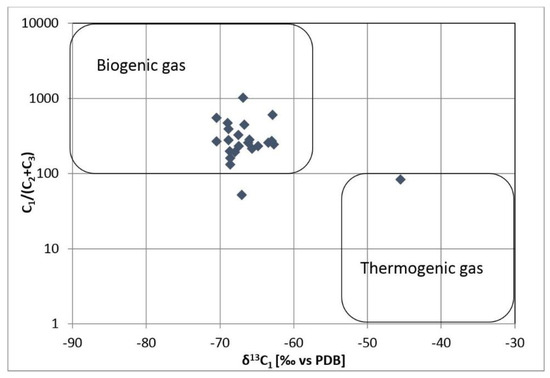
Figure 3.
Genetic classification of gases sampled in Miocene formations of Carpathian Foredeep on a Bernard diagram (after [48], modified).
The gas source rocks are mudstones and claystones intercalated with sandstones. These rocks constitute the main infilling of the Miocene basin, but the basin stratigraphy also includes the Upper Badenian (MB2) evaporite–clayey succession, which is quantitatively marginal but very important for correlations [19,20,46,49]. Generally, organic matter occurs in the whole Miocene succession, but the highest total organic carbon (TOC) content has been observed in claystones and slightly lower content has been observed in mudstones. However, some amounts of organic matter are also present in silty–clayey sandstones.
Generally, the studied hydrocarbon source rocks reveal a low content of dispersed organic matter (about 0.65 wt.%, on average, rarely over 1 wt.%), represented by Type III kerogen with an admixture of Type II kerogen [50]. The degree of thermal transformation is diverse: Rocks at shallow depths are thermally immature, whereas those located at depths beneath 2500 m, particularly under the Carpathian Overthrust, reveal thermal maturity on the vitrinite reflectance scale (Ro) from 0.4 to 0.65, which correspond to Tmax values from 410 °C to 435 °C. The hydrogen index values usually fall in the range of HI = 50–200 mg HC/g TOC, but sporadically reach up to 400 mg HC/g TOC (Figure 4) [11,17,45].
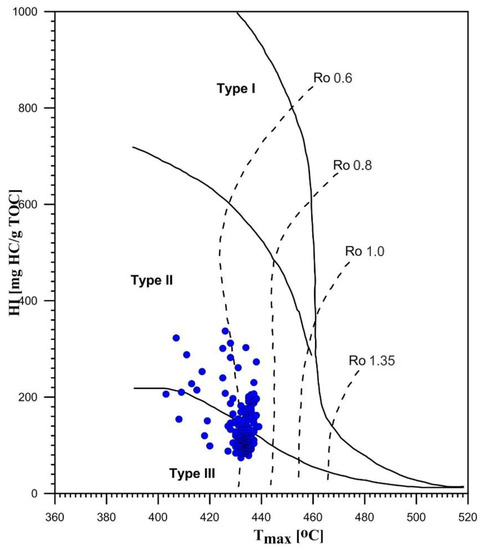
Figure 4.
Characterization of organic matter from studied part of Miocene sedimentary basin based on Rock-Eval hydrogen index (HI) versus Tmax temperature diagram; maturity paths as described by the authors of [51].
The TOC was present in whole Miocene profile, which was up to 3000-m thick in our AOI. Therefore, the temperature of each particular layer varied in the geological timescale (and still varies)—from several degrees Celsius after deposition up to 125 °C when a layer was buried at 3000 m and deeper. In some intervals of the Miocene profile, appropriate conditions for biogenic generation were present, while for intervals buried deeper, it could already be too hot for bacterial activity, but thermogenic reaction could have started. The mechanism of microbial gas generation has already been described in a number of papers, e.g., [34,42,43]. According to those authors, the organic matter dispersed in buried sediments was subjected to transformations: The less resistant molecules (e.g., nucleic acids and proteins) were quickly decomposed by bacteria, whereas the more resistant compounds were transformed under both pressure and temperature into protokerogen and then kerogen, the latter resistant to bacterial activity [34]. The remaining organic matter, known as the “labile” fraction, was subjected to hydrolysis and may provide nourishment for methanogenic bacteria, which produce biomethane. The relative ratio of hydrolysable (HOC) to total (TOC) organic matter has been variously quoted in the literature as 30% [52], 30–40% [53], and 40% [34]. The optimum temperature of biogenic gas generation also varies in available publications from about 40 °C [34,46] to about 50 °C [54]. The upper limit is defined by pasteurization temperature, which is about 75 °C [44,55]. Taking into account the above criteria, the kinetic model of biogenic gas generation was developed (Figure 5A), in which the rate of methane generation is described as a temperature function. The generation process was initiated at about 10 °C, its peak appeared at about 40 °C, and it ceased at about 70 °C. The estimated HI value of source organic matter used in the biogenic gas generation kinetic model was 60 mg HC/g TOC.
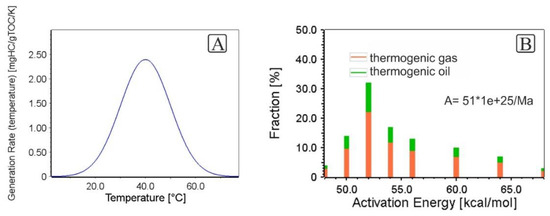
Figure 5.
Kinetic models of (A) biogenic and (B) thermogenic gas generation processes used in numerical model of Miocene sedimentary basin.
The efficiency of biogenic gas generation is decisively controlled by HOC content, temperature, deposition rate, and sediment burial rate. These factors determine the time limit of the generation ”window” of the microbial gas. A too-low sediment deposition rate results in a longer residence time of organic matter in the near-surface zone, which facilitates its oxidation and reduction of HOC content. On the contrary, a too-high deposition rate quickly pushes the methanogens toward the pasteurization zone, thus reducing the duration of bacteria metabolism, which, in turn, limits the quantity of generated biomethane [34,52].
Considering these controls, simulating biogenic gas generation with the tools used for modeling petroleum systems required not only a definition of the kinetics of microbial reactions, but also a reconstruction of dynamics of both the structural and thermal evolution of the sedimentary basin. Moreover, the results of earlier research [11,17,50] demonstrated that the deepest-buried Miocene sediments attained a hydrocarbon generation regime controlled by katagenetic processes. The kinetic model of thermogenic gas generation was developed based on the results of an experimental research project run in previous years at the Oil and Gas Institute, National Research Institute in Kraków (Figure 5B) [17].
3.2. Spatial Distribution of Lithological Variability and Organic Matter Content
The close relationship between the amount of organic matter available in the sedimentary basin and the quantity of generated gas (both biogenic and thermogenic) inspired the authors to resolve the following problems: (i) The most credible spatial reconstruction of lithological variability of the Miocene complex, and (ii) the distribution of present-day and, ultimately, initial contents of organic matter in the studied lithologies. Both the lithological and lithofacial variability strongly influenced the evolution of reservoir properties, as well as the permeability of rocks encountered in the basin. These factors, in turn, determined the heat flow and migration of reservoir fluids (gas, oil, and water).
This research was aimed at improving the recognition and spatial distribution of lithofacies varieties, as well as the petrophysical and geochemical parameters of Miocene sediments in the basin, paying special attention to full characterization of mudstone–claystone stratigraphic intervals. Therefore, the results of laboratory petrophysical and geochemical analyses (XRD, RE, MICP) were applied as calibration data for reinterpretation of well logs from 59 wells used as benchmarks. The results of integration and interpretation of data from a total of 223 wells were subjected to geological modeling. The regional 3D distribution of clay content in the Miocene sediments was reconstructed using stochastic algorithms. Based on this distribution, three main lithotypes of Miocene sediments were defined: Claystones, mudstones, and sandstones. In the dynamic basin model, variable lithological characterizations were ascribed to these lithotypes, expressed by different compaction rates, porosity/permeability relations, thermal parameters, organic matter contents, and other factors (Figure 6).
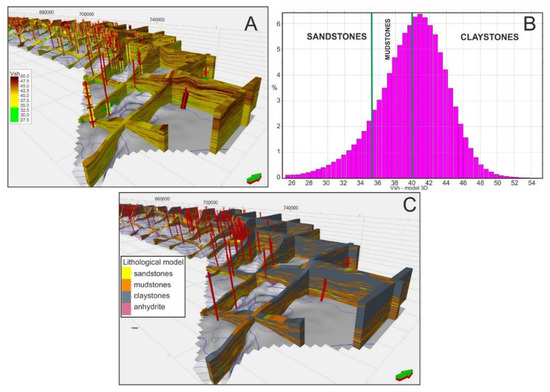
Figure 6.
Three-dimensional model of clay content converted to lithofacies 3D distribution implemented in petroleum system model: (A) 3D model of clay volume; (B) histogram of clay content values divided into three lithological categories: Sandstones, mudstones, and claystones; (C) 3D distribution of lithological types applied in petroleum system simulations.
The clay content parameter is indirectly linked to another important presumption of gas generation simulations: The determination of total organic carbon (TOC) content. In the Miocene basin, organic matter generally occurs in the full lithostratigraphic sequence, i.e., in high-clayey rocks (claystones), in mudstones, and, in some amounts, in clayey sandstones. Simultaneously, a quite distinct dependence was observed between clay and TOC content in the sediments. This dependence was used for construction of a 3D distribution model of TOC values. Then, the present-day TOC contents were transformed into the initial ones, i.e., those existing in sediments prior to conversion of organic matter into hydrocarbons. The results of Rock Eval analysis were processed using the correlation diagrams as described by the authors of [51], taking into consideration the HI–Tmax and HI–OI ratios. The increasing consumption trend of primary hydrocarbon potential, together with the increasing burial depth of Miocene sediments, were applied to transform present-day TOC contents into the initial values (Figure 7).
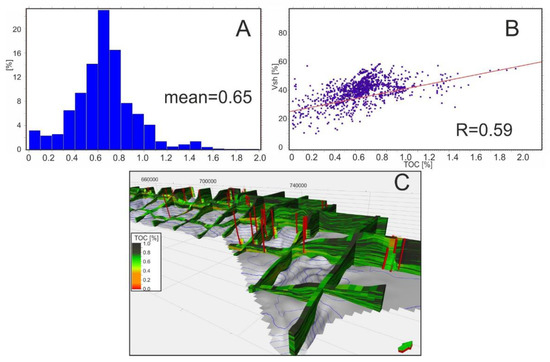
Figure 7.
Results of total organic carbon (TOC) modeling: (A) Present-day TOC values based on laboratory measurements in 59 wells; (B) volume of shale (Vsh) vs. TOC correlation (borehole data); (C) resulting model of initial TOC values transformed from present-day TOC distribution.
3.3. Paleothermal Model of Study Area
Apart from the structural, petrophysical, geochemical, and biochemical components of the model of the biogenic gas system discussed above, another important element necessary for credible simulation of processes taking place within the sedimentary basin is the paleothermal model. Therefore, the authors reconstructed the trend of paleotemperature changes within the Miocene basin, which determined the time and dynamics of hydrocarbon generation processes [56,57]. The evolution of paleotemperature within the sedimentary basin is controlled by the changes of basal heat flow (HF) density and the sediment–water–interface temperature (SWIT) during the time of basin initiation and evolution [58]. Present-day bottom-hole temperatures of the boreholes located in the study area (max. temperature recorded at a depth of 3700 m equals 130 °C) were applied to estimate current values of basal heat flow (54–73 mW/m2) and adjusted for adequate transformation ratios of organic matter (R0 and Tmax measurements). In general, the method used to define the variability of basal heat flow (spatially and over geological time) was the following: The HF value variation trend was determined for every borehole and every time step of the model, then the values were interpolated between wells so that, in the 3D petroleum systems models, the HF values were defined with a set of maps, whose number corresponded to the number of time steps considered in the models. Considering the young age of the Miocene basin, an assumption has been accepted that the density of basal heat flow (HF) insignificantly changes over time (+/–5 mW/m2, necessary to obtain satisfactory model calibration) but was more variable in particular parts of the basin. The HF values were estimated during the calibration procedure of the model. The SWIT was calculated with the algorithm available in PetroMod software by superposition of paleobathymetric data and average annual temperatures resulting from the paleoclimatic model as described by the authors of [59]. The SWIT values obtained as a result of this procedure varied from 20 °C 16 million years ago to 8 °C at present. The thermal model was calibrated with the measurements of contemporary temperatures in the wells and the degree of thermal maturity of organic matter.
3.4. Integration and Calibration of Basin Model Components
The integration of the structural, thermal, and geochemical components of the model was accomplished in the process of recurrent simulation of the biogenic gas generation system and model optimization until satisfactory consistency of the computed model and the calibration data was achieved. Simulations were run for the entire 3D model. For calibration purposes, 1D profiles of particular parameters were extracted along the wellbores for comparison with the calibration data (Figure 8). The following aspects of the biogenic gas system were considered: (i) Structural evolution of sedimentary basin; (ii) lithofacies distribution; (iii) depositional conditions; (iv) pressure regime along the basin history; (v) petrophysical properties of rock formations, both initial and recent, and their evolution; (vii) compaction and maturation progress (porosity, permeability, TOC); and (viii) paleothermal model scenario and its convergence with the present-day temperature 3D distribution. Modeling of the evolution of the Miocene biogenic gas generation system was carried out as full 3D simulations of pressure, temperature, and migration of reservoir fluids, applying the combined calculation algorithm for migration processes: Darcy flow/invasion percolation, available in PetroMod software (Schlumberger). When satisfactory consistency of the simulation model and calibration data was achieved, the analysis and interpretation of processes operating within the Miocene sedimentary basin were performed, paying special attention to gas generation, expulsion, migration, and accumulation within the Miocene autochthonous molasse sediments.
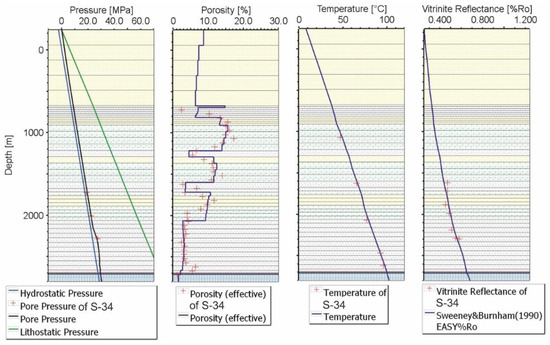
Figure 8.
Exemplary results of Miocene sedimentary basin model calibration with well data of (from left to right) pore pressure, porosity, temperature, and vitrinite reflectance. Red crosses represent calibration data in borehole profile, while continuous curves represent the model responses.
4. Dynamic Modeling of Biogenic Gas System: Results and Discussion
The analysis of evolution and mutual relationships between geotectonic, depositional, diagenetic, geochemical, and microbial processes reconstructed within the dynamic model enabled the authors to make some observations, which improved the understanding of hydrocarbon generation and migration processes in the Miocene basin. It was found that, despite the generally uniform development of the whole Miocene basin, subtle differences were evident in its particular fragments, in both the progress and the effects of gas generation, migration, and accumulation, depending on the position of prospective gas-bearing formations in the stratigraphic column, their depth, and their location in relation to the front of the overthrust Carpathian Orogen. Both the diagnosis and evaluation of these differences seem to be crucial for credible evaluation of the possible occurrence of commercial unconventional gas accumulations.
4.1. Progress of Petroleum Processes on a Basin Scale
The results of modeling revealed close connections between the dynamics of petroleum processes and structural–tectonic evolution, and deposition of sediments in the Miocene basin. Diverse deposition rates of sediments and subsidence rates of basin floor in various parts of the basin controlled by the load from the overthrusting Carpathian Orogen decisively influenced the residence time of source rocks under thermal conditions favorable for gas generation. These processes, supplemented by the geothermal gradient, defined the time and the depth boundaries of the generation ”window” of biogenic and thermogenic gases. The role of the structural evolution of the basin, including the overthrusting of the Outer Carpathians, is reflected in the shape of the curve, which represents the cumulative amounts of hydrocarbons generated in the basin (Figure 9). In the period of 11–7 Ma ago, the increment of generated hydrocarbons resulted from high deposition and subsidence rates of sediments, enabling large amounts of clastic material to enter the generation ”window” of microbial gas. About 7 Ma ago, the dynamics of generation potential changed due to a lower supply of sediments combined with their progressing burial caused by the overthrusting Carpathian flysch nappes. The latter process gradually affected still larger portions of the studied foredeep and increased the mass of sediments entering the microbial gas generation ”window” at shallower depths and the thermogenic gas ”window” at greater depths.
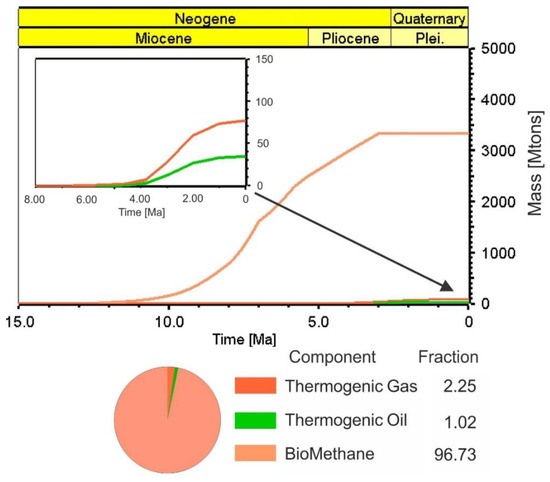
Figure 9.
Progress of biogenic and thermogenic hydrocarbon generation processes in the history of the analyzed part of Miocene basin (diagram) and the share of particular generation products (pie chart). Color code: Orange: Biomethane; Red: Thermogenic gas; Green: Condensate/light oil.
It should be emphasized that in most of the study area, Miocene sediments were buried at shallow depths. Thus, they could not attain sufficient temperatures to generate thermogenic hydrocarbons. Therefore, biogenic gas predominated as a product of the generation process, providing nearly 97 vol.% of hydrocarbons in that basin (Figure 9). These results are fully consistent with the results of laboratory measurements of gases sampled from reservoirs at depth intervals varying from ca. 300–3000 m [11,12,13,45,46,47], indicating a high C1/(C2 + C3) ratio with values almost always exceeding 100, and low ∂13C(CH4) values of methane, mostly falling into the range from −62‰ to −70‰. The biomethane generation process reconstructed in the model was initiated at a temperature range from 10 °C to 70 °C. In that particular basin, the temperatures corresponded to shallow burial depths, from 100 m to 300 m, depending on the geothermal gradient. The lower limit of the microbial generation zone was attained at burial depths from about 2000 m to 2500 m and at about 70 °C. However, the optimum microbial generation temperature, at which both the amount of organic matter available for microbial processes and the rate of gas generation were the highest, was about 40 °C. In the parts of the basin where Miocene sediments attained higher temperatures, biomethane generation was inhibited due to the pasteurization process. In accordance with the kinetic model of thermal cracking of kerogen from Miocene sediments of the Carpathian Foredeep, the katagenetic processes started at about 80–90 °C, i.e., immediately after the inhibition of microbial generation. Based on data from the literature, the presumption that about 30% of organic matter is available for biogenic reactions [53] enables the authors to suggest that large amounts of TOC still occur in Miocene strata and can be converted into hydrocarbons by thermocatalytic processes. Moreover, in the zones where the present-day temperatures of Miocene sediments exceed 90 °C (and even reach 140 °C in the deepest-buried portions of Miocene succession), thermogenic hydrocarbons may have been generated even recently because the hydrocarbon potential of these strata has not yet been consumed. For deepest-buried Miocene sediments, the degree of thermal transformation of kerogen was about 30%. The timing of the process is also important, as microbial gas generation commenced very quickly, at shallow depths, and in poorly consolidated rocks. However, at the final stage of basin development (and recently), the conditions suitable for thermogenic hydrocarbon generation were attained in the zones of deepest burial (i.e., beneath the Carpathian Overthrust), where mostly the gas, but also small amounts of oil/condensate, were produced. The thermogenic processes proceeding in strongly consolidated sedimentary formations significantly affected both the migration and dispersion rates of thermogenic gas, which, in turn, improved the possibility of thermogenic hydrocarbon retention in the Miocene basin. The hydrocarbon resources generated in the Miocene basin and calculated with the method of petroleum system simulation were considerable. From the total quantity of these hydrocarbons, about 60% was expelled (Figure 10), whereas the remaining amount still saturated the source mudstone and claystone formations (from which about 45% is contained in mudstones). Considering the comparable amounts of hydrocarbons accumulated in Miocene facies and the lower volume of mudstones (about 30%) than claystone (about 40%) in Miocene succession, it can be suggested that unit saturation of mudstone facies with methane was higher than that of claystone due to its more favorable petrophysical parameters. Hence, the Miocene mudstones are proposed as a preferable exploration target for unconventional gas accumulation. The gas expulsion started shortly after the initiation of the hydrocarbon generation process. The quickly increasing saturation of source rocks up to the expulsion threshold was facilitated by high deposition and burial rates, which quickly moved the sediments down to the depths, where optimum temperatures for microbial gas generation prevailed. During the basin evolution, when sediments were buried at greater depths, the volume of hydrocarbons generated and accumulated within the source rocks was proportional to the volume of expelled ones (Figure 10). This generation–expulsion balance was disturbed about 3 Ma ago, i.e., after Miocene sediments attained maximum burial depth. Since that time, the decreased amount of accumulated gas within the Miocene sediments has been evident due to both uplift and erosion of the study area, which reduced the pore pressure and led to the dispersion of hydrocarbons, although the hydrocarbon generation process is still active (but less intensive).
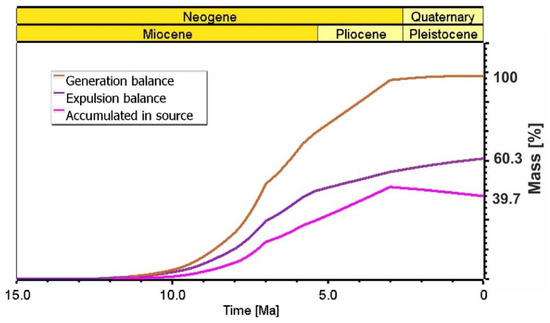
Figure 10.
Dynamics of gas generation, expulsion, and accumulation processes within the source rocks of the analyzed part of Miocene basin, and proportion between generated, expelled, and accumulated masses of hydrocarbons.
Only a small part of expelled and migrated hydrocarbons accumulated in sandstone formations as conventional reservoirs. The hydrocarbon resources estimated in conventional accumulations presented in Figure 11 constituted less than 10% of hydrocarbons accumulated in the whole profile of the studied part of the Miocene basin. The gas resources modeled in conventional sandstone reservoirs slightly exceeded those already proven in discovered fields. Considering that the majority of structures in the study area have already been explored with drilling, the credibility of the above prognosis, as well as (indirectly) the credibility of the developed model, can be positively evaluated. Though conventional reservoirs were not the focus of this research, they can serve as an additional stage of model calibration.
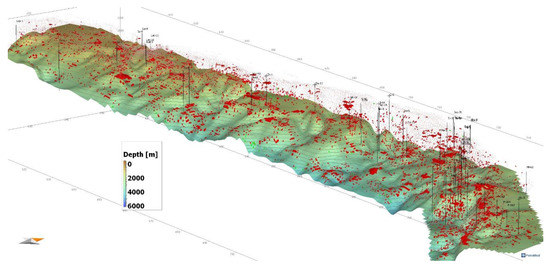
Figure 11.
Illustrative distribution of conventional gas accumulations in sandstone horizons of the study area as predicted by the model (red spots represent modeled gas accumulations with resources corresponding to reserves of proved gas fields and approximately representing their distribution across the study area).
4.2. Progress of Hydrocarbon Generation Processes in Particular Zones and Depth Intervals of Miocene Basin
Gas generation in the Miocene basin was mainly an effect of bacterial processes, which were initiated after the sediments attained shallow burial depths. In the zones of deeper burial of Miocene strata, i.e., beneath the overthrust Carpathian Orogen, biogenic gas generation also dominated. However, when this process was inhibited after Miocene sediments entered the higher thermal regime (i.e., about 3 Ma ago), the thermogenic process was initiated, lasting up to now. Dynamic modeling of petroleum systems with 3D models enabled us to reconstruct the progress of processes at any locality in the basin represented by grid cells of the simulation model. The following analysis was carried out to assess the gas generation process at three selected localities in the basin, differing in their position related to the front of the over thrust Carpathian Orogen and the depth of hydrocarbon accumulations (marked at Figure 2):
- The northern part of the basin, at the foreland of the Carpathian Overthrust front, in deltaic facies (Complex 5) recently buried at about 1100-m depth.
- The northern part of the basin, at the foreland of the Carpathian Overthrust front, in fine-grained facies (Complex 3) recently buried at about 2000-m depth.
- The southeastern part of the basin, beneath the overthrust Carpathian Orogen, in fine-grained facies (Complex 3) recently buried at about 3700-m depth.
Microbial gas generation in the Complex 5 formation (Figure 12, orange curve), which was recently buried at about 1100-m depth at the front of the Carpathian Overthrust, was initiated at about 10–20 °C (red curve) and about 300-m burial depth (black curve). The intensity of generation (green curve) increased with rising temperature up to a peak at 40 °C. Then, the intensity decreased until complete inhibition, when the temperature stabilized at about 65 °C and the hydrocarbon potential of source organic matter available for this temperature range was consumed. Further burial resulted from subsidence of the foreland of overthrust Carpathian Orogen, which commenced about 3.8 Ma ago, causing the temperature to rise above the previous maximum, which reactivated microbial gas generation. The process continued, although with low intensity, until the temperature reached 80 °C at about 2000-m burial depth, which took place at about 2 Ma ago. Later on, both uplift and erosion of the Carpathian Orogen resulted in decreased burial temperature, which precluded the initiation of thermogenic hydrocarbon generation.
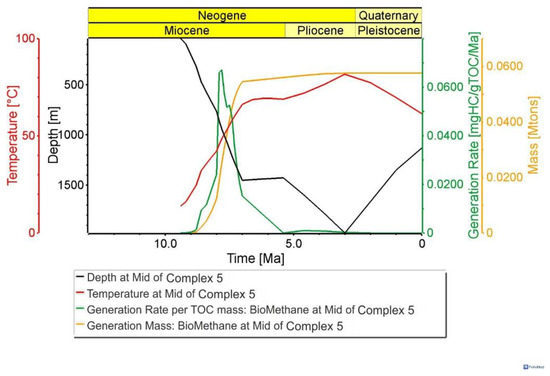
Figure 12.
Progress of biomethane generation process in shallow-buried (1100-m depth) Miocene deltaic facies (Complex 5) at the front of the Carpathian Overthrust. Values of generation rate shown in Figure 12, Figure 13 and Figure 14 reflect the mass of produced hydrocarbons and refer to the area of 700-m × 700-m calculation block of the model, and to 100-m thickness of sediments.
Some differences were observed in the progress of gas generation processes in Complex 3 sediments presently buried at about 2000-m depth at the front of the Carpathian Overthrust (Figure 13, color code as in Figure 12). Their sedimentation started about 3 Ma earlier, hence their burial and the resultant temperature rise initiating the gas generation also commenced earlier. More precisely, these sediments entered the microbial gas generation phase as early as over 11.5 Ma ago and consumed their overall hydrocarbon generation potential about 7.5 Ma ago. Moreover, when the Complex 5 sediments reached greater burial depths and microbial gas generation was reactivated (Figure 12), the Complex 3 sediments reached burial depths suitable for thermogenic gas production, although the efficiency of this process (Figure 13, dashed green curve) was rather insignificant due to relatively low temperature (about 100 °C). Low efficiency of the thermogenic process resulted in a small share of such generated gas in the total amount of gas generated (displayed by dashed versus solid orange curves), which was only about 5%.
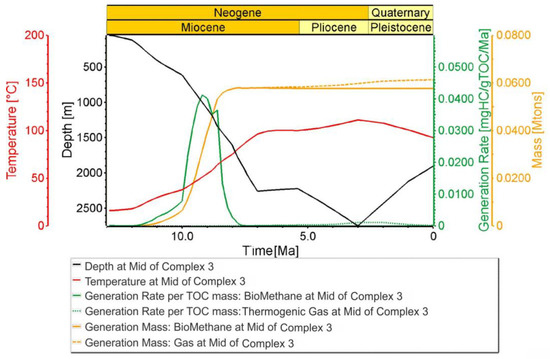
Figure 13.
Progress of gas generation processes in Miocene Complex 3 facies recently buried at about 2000-m depth at the front of the Carpathian Overthrust.
Diverse evolution of the Miocene basin in particular zones controlled not only the hydrocarbon generation processes and the quantities of produced petroleum, but also the share of thermogenic hydrocarbons in their overall production. For comparison, Figure 14 illustrates the progress of hydrocarbon generation in the southeastern part of the Miocene basin, within the Complex 3 sediments presently buried beneath the Carpathian Orogen, at about 3700-m depth. In that part of the basin, two episodes of biogenic gas generation were identified. The first was active between about 12 Ma and 9.5 Ma ago due to the burial of Complex 3 facies down to about 1200-m depth caused by deposition of younger sediments and resultant temperature rise to about 50 °C. The second episode was an effect of basin subsidence under the load of overthrusting Carpathian Orogen between about 7 Ma and 3.8 Ma ago. Two pulses of biogenic generation resulted from kinetic model of biogenic reaction that we applied. The unit of generation rate was mgHC/gTOC/°K. Thus, for each interval for the temperature range of the biogenic reaction (10–70 °C), only part of the organic matter could be transformed into methane. As a result, after temperature stabilization at some level (or temperature decrease), the biogenic reaction ceased, which was the case between 9.5–7 Ma. It could be reactivated only after the temperature increased above previous maximum, which happened as the consequence of further sediments burial and temperature increasing above 50 °C, which occurred from 7 Ma to 3.8 Ma. This subsidence buried the Complex 3 sediments down to almost 3000-m depth, which resulted in a temperature rise to 90 °C. Hence, the Complex 3 facies completely consumed its microbial generation potential. Further burial caused a temperature rise and the initiation of thermogenic processes, which continued even recently, but their highest efficiency took place about 2 Ma ago, when the temperature increased to about 140 °C. In the zones where Miocene sediments were subjected to such a thermal regime, the share of thermogenic gas may constitute over 30% of total gas generated in the Miocene basin.
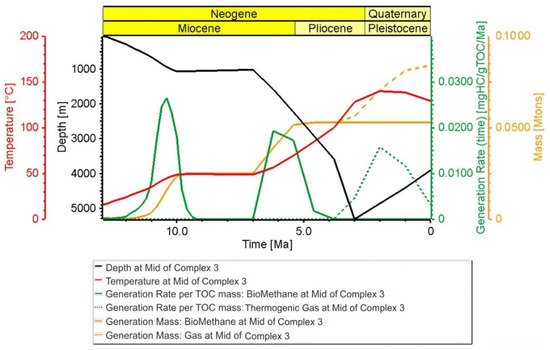
Figure 14.
Progress of gas generation processes in Miocene Complex 3 facies recently buried at about 3700-m depth beneath the Carpathian Orogen.
It can be observed that for location analyzed at Figure 14 temperature reaches the maximum value at 2 Ma while the time of maximum burial was at 3 Ma. The heat flow history could be considered as the reason of poor correlation between temperature and burial depth. However, in our opinion, its impact was not decisive in this case, as we assumed insignificant changes of HF in time (+/−5 mW/m2). On the other hand, the increase of Miocene sediments burial between 7–3 Ma resulted from the advancement of overthrusting Carpathian orogeny of the significant thickness exceeding 4000 m. Thus, the progress of Miocene sediments burial was very fast, and as a result, the temperature increase could not keep pace with the quickly advancing burial depth. Consequently, there was a shift of the time of maximum temperature in relation to time of maximum burial. In other words, it resulted from the inability of rock mass to cumulate a significant amount of thermal energy in a short period of time. We came to this conclusion by comparison with other locations where Miocene sediments were subjected to minor burial resulting from overthrusting and location in a foreland. For the first of the above, we also observed a slight shift in time of temperature maximum in relation to time of maximum burial. In a foreland, this phenomenon is not present.
The comparison of gas generation history in various zones and depth intervals of the Miocene basin enables the authors to conclude that at the front of the Carpathian Overthrust, the generation processes were mostly similar in sediments that are presently buried at about 1000 m and 2000 m depths. The differences are seen in both the time of initiation and the duration of generation processes, which in turn were controlled by the time of deposition and the time of burial to particular depths. Moreover, the cumulative quantities of generated gas were similar, as well. At burial depths about 2000 m (which corresponds to ca. 2500 m of maximum depth in basin history), the initiation of thermogenic processes was observed, but it did not distinctly affect the overall amount of generated hydrocarbons. However, at a recent burial depth of about 3700 m, i.e., beneath the Carpathian Orogen, where sediments were buried to maximum depths beneath 5000 m, the gas generation process is different. Under such conditions, the total amount of generated gases is about 50% higher due to a significant contribution of the thermogenic component, but the biogenic component is comparable with that produced within the shallow-buried Miocene formations.
4.3. Analysis of Hydrocarbon Accumulation Opportunities in Mudstone–Claystone Formations from Particular Zones and Depth Intervals of the Miocene Basin
Apart from the reconstruction of hydrocarbon generation processes, the results of simulating petroleum systems also provide, to some extent, an opportunity to analyze hydrocarbon accumulation processes in particular zones and depth intervals of the modeled sedimentary basin. The credibility of these prognoses is lower than that of the generation processes and strongly depends on the quality of the structural–lithological model and its calibration. The model described in this paper was based on a significant amount of well logs and laboratory analyses of well-derived samples. The calibration of the model with porosity and pore pressure parameters was satisfactory (Figure 8), which gave rise to the evaluation of selected localities of mudstone intervals within the modeled area, varying in both depth of occurrence and position in relation to the Carpathian Orogen.
The analysis was carried out for various present-day depths of Miocene formations within the studied fragment of the Miocene basin: (i) 1000-m depth, sediments located at the foreland of the Carpathian Overthrust front (Figure 15), and (ii) beneath 3000-m depth, sediments located under the overthrust Carpathian Orogen (Figure 16). In both depth intervals, significant differences in total petroleum mass (TPM) of accumulated gas were observed. For the 1000-m interval, two groups of zones were identified within the same formation: (i) Those in which the quantity of accumulated hydrocarbons constituted about 10% of the gas generated within the given grid cell of 3D model (Figure 15A), and (ii) those in which the quantity of accumulated gas exceeded the gas generation (Figure 15B). The initial porosity and its decrease with the progress of compaction processes was assumed through predefined compaction models, which were different for various rock types. Selection and modification of appropriate model was achieved in iterative calibration process until modeled petrophysical properties consistent with measured values (core data or interpreted with geophysical well logs) were achieved for present day. Generation and/or accumulation yield could be expressed in mass or volume units. In this case, 0.85 kg/m3 density of gas (in surface conditions) was used for mass/volume conversion. The exact value of density depends on gas composition, which, in this model, was mostly methane.
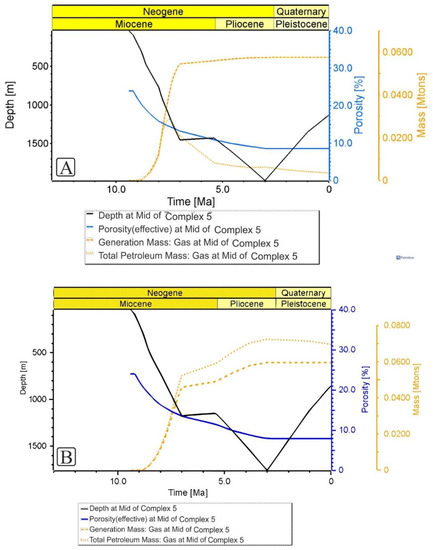
Figure 15.
Comparison of diverse gas accumulation conditions (marked as total petroleum mass curve) in Miocene mudstones within Complex 5 located at the foreland of the Carpathian Orogen front, at about 1000-m burial depth: (A) Location within Complex 5 with unfavorable accumulation conditions; (B) location within Complex 5 with favorable accumulation conditions. Values of generated and accumulated hydrocarbons refer to the area of 700-m × 700-m calculation block of the model and 100-m thickness of sediments.
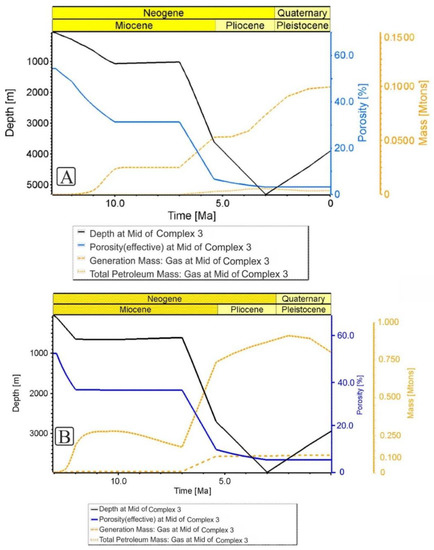
Figure 16.
Comparison of diverse gas accumulation conditions (marked as total petroleum mass curve) in Miocene mudstones within Complex 3 located beneath the Carpathian Orogen, at burial depths about 3000–4000 m: (A) Location within Complex 3 with unfavorable accumulation conditions; (B) location within Complex 3 with favorable accumulation conditions. Values of generated and accumulated hydrocarbons refer to the area of 700-m × 700-m calculation block of the model and 100-m thickness of sediments.
A diversity of accumulated gas quantities was also observed for greater burial depths of Miocene Complex 3 sediments located beneath the Carpathian Orogen (Figure 16), where these values ranged from about 5% (Figure 16A) to about eight-times (Figure 16B) the gas generation amount.
The modeling results indicate the possible migration of gas not only from the source rocks (claystones, clayey mudstones), in which the generation processes were active into the sandier facies, but also within and into the mudstones, which are recent petroleum exploration targets. It was revealed by differences in accumulation quantities sometimes exceeding the generated ones, as observed in some zones. Simultaneously, in all zones of the Miocene basin used for comparison, the results point to the progressive reduction in the amounts of accumulated hydrocarbons, which implies their general dispersion within the basin. These conclusions are concordant with the natural gas seeps observed at the surface [35,38]. Moreover, the contemporary gas migration process (and dispersion) is demonstrated by the comparative analysis of gas generation, expulsion, and accumulation within particular sedimentary formations (next section).
4.4. Progress of Gas Generation and Accumulation in Selected Sedimentary Formations
The relationships of hydrocarbon generation and accumulation processes in each sedimentary formation are distinguished in the model differ in accordance with their position in the lithostratigraphic column and resultant consequences. Below, the progress and effects of these processes are compared in the deepest (Complex 3) and shallowest (Complex 6) formations of the Supra-evaporate Series (diagrams represent the full volume of analyzed intervals).
The oldest member of the Supra-evaporite Series, the Complex 3 formation, was deposited first. Hence, it entered the hydrocarbon generation ”window” first and was subjected to the highest temperatures and pressures. Thus, its compaction was the highest as well, and most of it entered the thermogenic phase of the hydrocarbon generation process. Consequently, the Complex 3 sediments simultaneously attained high unit effectiveness of hydrocarbon generation and the highest degree of compaction and pore space reduction. The decreasing volume of pore space forced the vast majority of generated hydrocarbons outside of Complex 3. Therefore, the ratio of accumulated and generated hydrocarbons was the lowest in these sediments. Despite this relationship, the Complex 3 formation was the only one in which the amount of accumulated hydrocarbons was only slightly reduced over the geological time scale (Figure 17). This is an effect of thermogenic hydrocarbon generation taking place recently and up to the present day, which replaced already expelled and migrated gas. The generation process was possible because part of the Complex 3 sediments was still buried at depths beneath 3000 m, where temperatures from 100 °C to 150 °C drove thermogenic hydrocarbon generation. This conclusion was confirmed by the composition of accumulated hydrocarbons, in which the thermogenic component was larger than in the composition of generated hydrocarbons because previously generated and more mobile biogas were replaced by later-generated and less mobile thermogenic hydrocarbons (Figure 17, pie charts). The higher mobility of biogenic component resulted from gas composition (biogas consist of methane while thermogenic generation product also contained heavier hydrocarbons in its composition), as well as the rock properties of the depth intervals at which the generation processes (biogenic and thermogenic) proceeded.
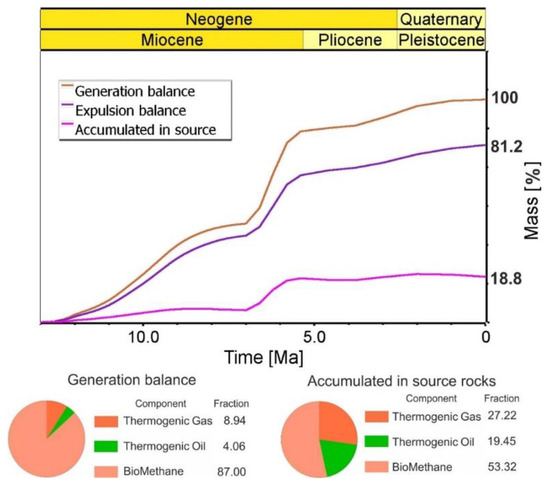
Figure 17.
Progress of hydrocarbon generation, expulsion, and accumulation within fine-grained (Complex 3) complex (plot) and proportion between generated, expelled, and accumulated masses of hydrocarbons; below: Composition pie charts of generated (left) and accumulated (right) components evidencing the increasing share of thermogenic fraction in accumulations within mudstones–claystones.
Each sedimentary complex overlying the Complex 3 deposits reveals a different relationship between the generated and accumulated hydrocarbons. Moving up the sequence, the accumulated to generated ratio increases as a result of both hydrocarbon migration from deeper parts of the basin and the lower advancement of generation processes in its shallower parts. A similar increasing trend was observed for the share of biogenic gas in the total generation amount, whereas proportions between the generated and accumulated gas quantities became comparable (Figure 18).
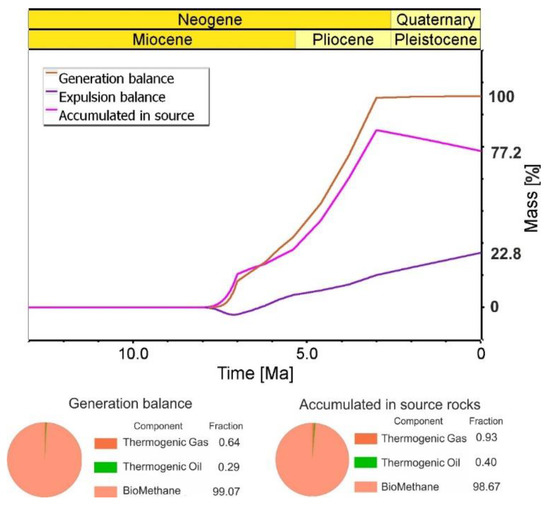
Figure 18.
Progress of hydrocarbon generation, expulsion, and accumulation within overburden of deltaic sediments (Complex 6) (plot) and proportion between generated, expelled, and accumulated masses of hydrocarbons; below: Composition pie charts of generated (left) and accumulated (right) components evidencing similar proportions between biogenic and thermogenic gases generated and accumulated within mudstones–claystones.
An analysis of petroleum processes that took place within the Complex 3 sedimentary complex demonstrates that soon after its deposition, the expulsion was negative, and the amount of accumulated hydrocarbons exceeded the quantity of gas generated. This ostensible paradox results from the fact that in the initial generation phase, prior to the sediments attaining a sufficient temperature to generate microbial hydrocarbon, a vertical hydrocarbon flux took place from deep-seated parts of the basin where hydrocarbon saturation reached the expulsion threshold. Thus, the expulsion, calculated as the balance of hydrocarbons flowing into and out of the sediments, was negative, whereas the amount of hydrocarbons accumulated at a given stage of basin evolution was higher than the amount of gas generated in these strata. Moreover, the relationships between generation, expulsion, and accumulation were different in Complex 3 and Complex 6, which indicates that conditions were favorable for hydrocarbon migration from deeper to shallower stratigraphic horizons. Additionally, the decreased gas accumulation level observed since about 3 Ma ago in the shallowest part of the Miocene succession points to progressing dispersion of the gas accumulated in the Miocene basin.
5. Conclusions
The Miocene basin of the Carpathian Foredeep, with numerous proven multiple interval gas fields accumulated in sandstone reservoirs, also reveals the promising potential of unconventional gas accumulations in mudstone–claystone formations, which were not regarded as attractive exploration targets until recently. The biogenic provenance of the gas implies specific conditions in which the generation process proceeded. It applies to sediment temperature affecting the generation rate, which, in turn, is a function of burial depth in the basin history. The onset of biogenic generation and its initial phase took place in a temperature range of 10–30 °C at depths of 100–300 m, while the main phase of biomethane generation occurred at depths of 900–1200 m in a temperature range of 30–50 °C. Therefore, the biogenic gas generation process, at least its initial phase, was accompanied by a low level of sediment diagenesis, which translates into essentially favorable conditions for gas migration and dispersion. The results show that the generation processes were mostly similar in sediments that are presently buried at about 1000-m and 2000-m depths. Moreover, the cumulative quantities of generated gas were similar as well. At burial depths of about 2000 m (which corresponds to ca. 2500 m of maximum depth in basin history), the initiation of thermogenic processes was observed, but it did not distinctly affect the overall amount of generated hydrocarbons. The differences are seen in both the time of initiation and the duration of generation processes, which in turn were controlled by the time of deposition and the time of burial to particular depths. However, at a present-day burial depth of about 3700 m, i.e., beneath the Carpathian Orogen, where sediments were buried to maximum depths beneath 5000 m, the gas generation process was different. Under such conditions, the total amount of generated gases was about 50% higher due to a significant contribution of the thermogenic component, but the biogenic component was comparable with that produced within the shallow-buried Miocene formations.
The results of the modeling study demonstrate that significant amounts of gas were generated in the basin. From the total quantity of hydrocarbons generated, about 60% was expelled, whereas the remaining amount was accumulated in the source mudstone and claystone facies (from which about 45% was contained in mudstones). Considering the comparable amounts of hydrocarbons accumulated in both the Miocene facies and the lower volume of mudstones (about 30%) compared to claystone (about 40%) in Miocene succession, it follows that the gas content of mudstone facies is higher. This is because in conventional sandstone reservoirs, the gas occurs partly in a dispersed form with more favorable petrophysical parameters, and indicates the mudstone intervals as preferable exploration targets for unconventional gas accumulation in the Miocene basin. According to the modeling results, gas accumulated in mudstone and claystone facies constituted more than 90% of total gas, while the conventional sandstone reservoirs contained less than 10% of total hydrocarbons accumulated in the studied part of the Miocene basin. Although quantities of gas accumulated in unconventional reservoirs significantly prevailed, other locations revealed high methane content. Such characteristics have been observed for varying depth conditions. Generally, two types of gas accumulation conditions were identified within the same intervals for mudstone facies: (i) Those in which the quantity of accumulated gas constituted only a small percentage of the generated gas amounts, and (ii) those in which the quantity of accumulated gas exceeded the gas generation by several times. Significant differences in present-day gas accumulation in mudstone facies and gas content values exceeding their generation yield suggest not only that the gas migration proceeded into and within the rocks with the most favorable permeability values (i.e., sandstones), but that it was also possible in mudstones. This implies that favorable zones for gas exploration in mudstone reservoirs are those located in structures elevated in relation to the neighborhood because such structures might have been supplied with the gas generated in the large surrounding areas. Moreover, the quality of sealing of such structures with the claystone complexes could be an additional factor favorable for preserving gas accumulation. The sealing properties of intervals overlying mudstone reservoirs seem to be relevant considering the observed decrease in the overall level of gas accumulation in the Miocene succession since about 3 Ma ago, which points to progressing dispersion of gas accumulated in the basin. This conclusion is concordant with the natural gas seeps observed at the surface. The reduction in the amounts of accumulated hydrocarbons was observed for all sedimentary complexes, and it was especially evident for the uppermost complex in which the rate of gas accumulation decrease was the largest. Consequently, each sedimentary complex reveals a different relationship between the generated and accumulated hydrocarbons. Moving up the sequence, the accumulated gas to generated gas ratio increased as a result of both hydrocarbon migration from deeper parts of the basin and the lower advancement of generation processes in its shallower parts.
In the southernmost part of the analyzed basin fragment, where Miocene sediments are covered by overthrust nappes of the Outer Carpathians and rest at burial depths of about 3000–4000 m, the hydrocarbon expulsion and migration processes are balanced by recent thermogenic generation. The Complex 3 sediments in that part of the basin simultaneously attained high unit effectiveness of hydrocarbon generation (biogenic and thermogenic) and the highest degree of compaction and pore space reduction. The decreasing volume of pore space forced the vast majority of generated hydrocarbons outside of Complex 3. Therefore, the ratio of accumulated and generated hydrocarbons was the lowest in these sediments. Despite this relationship, Complex 3 was the only one in which the amount of accumulated hydrocarbons was only slightly reduced over the geological time scale. This is an effect of thermogenic hydrocarbon generation taking place recently and up to the present day, which replaced already expelled and migrated gas.
Therefore, from the point of view of gas accumulation preservation, this zone of the basin seems to impose lower geological risk, but simultaneously brings some negative factors: (i) The limited pore space capacity, which affects the resources of potential accumulations, and (ii) the reduced permeability values of reservoir rocks, which may require more advanced and costly completion and reservoir development techniques.
Author Contributions
Conceptualization, K.S. and T.S.; methodology, K.S. and T.S.; software, K.S. and B.P.; validation, A.S., B.P., and G.M.; formal analysis, A.S.; investigation, T.S.; resources, A.S. and B.P.; data curation, G.M.; writing—Original draft preparation, K.S, and T.S.; writing—Review and editing, G.M. and A.S.; visualization, K.S., A.S., and G.M.; supervision, K.S. and A.S.; project administration, A.S.; funding acquisition, A.S., G.M., and B.P. All authors have read and agreed to the published version of the manuscript.
Funding
This research was funded by the National Centre for Research and Development as the Blue Gas II grant (BG2/ShaleFore/14). The paper was prepared under AGH-UST statutory research grant No. 16.16.140.315/05.
Acknowledgments
The authors would like to thank the Polish Oil and Gas Company (PGNiG S.A.) for providing data that helped in writing this paper.
Conflicts of Interest
The authors declare no conflict of interest.
References
- Berent-Kowalska, G.; Peryt, S.; Dziedzina, K.; Jurgaś, A.; Roman, W.; Kacprowska, J.; Gilecki, R.; Parciński, G.; Boczek-Gizińska, R.; Szymańska, M.; et al. Energy Statistics in 2017 and 2018; Ministry of Energy, Energy Department: Warsaw, Poland, 2019; p. 83. [Google Scholar]
- Wang, H.; Ma, F.; Tong, X.; Liu, Z.; Zhang, X.; Wu, Z.; Li, D.; Wang, B.; Xie, Y.; Yang, L. Assessment of global unconventional oil and gas resources. Pet. Explor. Dev. 2016, 43, 925–940. [Google Scholar] [CrossRef]
- McGlade, C.; Speirs, J.; Sorrell, S. Unconventional gas—A review of regional and global resource estimates. Energy 2013, 55, 571–584. [Google Scholar] [CrossRef]
- Nguyen-Le, V.; Shin, H.; Little, E. Development of Shale Gas Prediction Models for Long-Term Production and Economics Based on Early Production Data in Barnett Reservoir. Energies 2020, 13, 424. [Google Scholar] [CrossRef]
- Ye, Y.; Tang, S.; Xi, Z. Brittleness Evaluation in Shale Gas Reservoirs and Its Influence on Fracability. Energies 2020, 13, 388. [Google Scholar] [CrossRef]
- Zou, C. Unconventional Petroleum Geology; Elsevier Inc.: Philadelphia, PA, USA, 2013; pp. 1–373. [Google Scholar]
- Soeder, D.J. The successful development of gas and oil resources from shales in North America. J. Pet. Sci. Eng. 2018, 163, 399–420. [Google Scholar] [CrossRef]
- Wang, S. Shale gas exploitation: Status, problems and prospect. Nat. Gas Ind. B 2018, 5, 60–74. [Google Scholar] [CrossRef]
- Karnkowski, P. Miocene deposits of the Carpathian Foredeep (according to results of oil and gas prospecting). Geol. Q. 1993, 38, 377–394. [Google Scholar]
- Karnkowski, P. Oil and Gas Fields in the Carpathians and Carphatian Foredeep; Towarzystwo Geosynoptyków “Geos” AGH: Krakow, Poland, 1993. [Google Scholar]
- Kotarba, M.J.; Więcław, D.; Kosakowski, P.; Kowalski, A. Hydrocarbon potential of source rocks and origin of natural gases accumulated in Miocene strata of the Carpathian Foredeep in Rzeszów area. Geol. Rev. 2005, 53, 67–76. [Google Scholar]
- Kotarba, M.J. Bacterial gases in Polish part of the Carpathian Foredeep and the Flysch Carpathians: Isotopic and geological approach. In Bacterial Gas; Vially, R., Ed.; Editions Technip: Paris, France, 1992; pp. 33–146. [Google Scholar]
- Kotarba, M.J. Origin of natural gases in the autochthonous Miocene strata of the Polish Carpathian Foredeep. Ann. Soc. Geol. Pol. 2011, 81, 409–424. [Google Scholar]
- Poprawa, P.; Papiernik, B.; Krzywiec, P.; Machowski, G.; Maksym, A. Exploration potential of the Polish petroleum provinces. Wiadomości Naft. I Gazow. 2018, 12, 4–12. [Google Scholar]
- Katz, B.J. Microbial Processes and Natural Gas Accumulations. Open Geol. J. 2011, 5, 75–83. [Google Scholar] [CrossRef]
- Wei, X.; Qin, J.; Shuai, Y.; Liu, K.; Luo, Y.; Shi, Y.; Zhang, S. Methane production pathway in biogas reservoirs via molecular biological technique. Pet. Explor. Dev. 2012, 39, 539–546. [Google Scholar] [CrossRef]
- Matyasik, I.; Słoczyński, T.; Madej, K. Generation potential of the Miocene sediments in the Eastern part of Carpathian Foredeep. Pr. Nauk. Inig 2008, 150, 449–454. [Google Scholar]
- Peryt, T.M.; Peryt, D. Carpathian Foredeep Basin (Miocene, Poland and Ukraine): Significance of Evaporite Deposition. Search and Discovery Article #10852 (2016). In Proceedings of the AAPG Annual Convention and Exhibition, Calgary, AB, Canada, 19–22 June 2016. [Google Scholar]
- Dziadzio, P.; Maksym, A.; Olszewska, B. Miocene deposition in the eastern part of the Carpathian Foredeep in Poland. Geol. Rev. 2006, 54, 413–420, (In Polish with English abstract). [Google Scholar]
- Oszczypko, N. Development of the Polish sector of the Carpathian Foredeep. Geol. Rev. 2006, 54, 396–403. [Google Scholar]
- Oszczypko, N.; Krzywiec, P.; Popadyuk, I.; Peryt, T.M. Carpathian Foredeep Basin (Poland and Ukraine): Its sedimentary, structural, and geodynamic evolution. In The Carpathians and their Foreland: Geology and Hydrocarbon Resources; Golonka, J., Picha, F.J., Eds.; The American Association of Petroleum Geologists: Tulsa, OK, USA, 2006; pp. 293–350, Memoir 84. [Google Scholar]
- Picha, F.J. Exploring for hydrocarbons under thrust belts a challenging new frontier in the Carpathians and elsewhere. Aapg Bull. 1996, 89, 1547–1564. [Google Scholar]
- Bońda, R.; Siekiera, R.; Szuflicki, M. Map of Concessions for Hydrocarbon Exploration and Production, and Non-Reservoir Storage of Substances in the Subsurface and Storage of Wastes in the Subsurface as of 31-12-2019; Polish Geological Institute—National Research Institute: Warsaw, Poland, 2020. [Google Scholar]
- Karnkowski, P.H.; Ozimkowski, W. Structural evolution of the pre-miocene basement in the Carpathian Foredeep (Kraków–Przemyśl region, SE Poland). Geol. Rev. 2001, 49, 431–436. [Google Scholar]
- Myśliwiec, M. Exploration for gas accumulations in the Miocene deposits of the Carpathian Foredeep using Direct Hydrocarbon Indicators (southern Poland). Geol. Rev. 2004, 52, 299–306. [Google Scholar]
- Myśliwiec, M. The Miocene reservoir rocks of the Carpathian Foredeep. Geol. Rev. 2004, 52, 581–592. [Google Scholar]
- Myśliwiec, M. Traps for gas accumulations and the resulting zonation of the gas fields in the Miocene strata of the eastern part of the Carpathian Foredeep (SE Poland). Geol. Rev. 2004, 52, 657–664. [Google Scholar]
- Maksym, A.; Dziadzio, P.; Liszka, B.; Staryszak, G. Environment of sedimentation of autochthonous Miocene deposits in the Carpathian marginal zone and the geological–reservoir interpretation in the Husów-Albigowa-Krasne area. Naft. Gaz 1997, 9, 407–414. [Google Scholar]
- Tissot, B.P.; Welte, D.H. Petroleum Formation and Occurrence, 2nd ed.; Verlag GmbH: Berlin/Heidelberg, Germany, 1984; p. 679. [Google Scholar]
- Ungerer, P.; Burrus, J.; Doligez, B.; Chenet, P.Y.; Bessis, F. Basin evaluation by integrated two-dimensional modeling of heat transfer, fluid flow, hydrocarbon generation, and migration. Aapg Bull. 1990, 4, 309–335. [Google Scholar]
- Welte, D.H.; Horsfield, B.; Baker, D.R. Petroleum and Basin Evolution; Springer-Verlag: Berlin/Heidelberg, Germany, 1997. [Google Scholar]
- Allen, P.A.; Allen, J.R. Basin Analysis. Principles and Applications, 2nd ed.; Blackwell Publishing: Oxford, UK, 2005; p. 545. [Google Scholar]
- Wygrala, B.; Rottke, W.; Kornpihl, D.; Neumaier, M.; Al-Balushi, A.; Marlow, L. Assessment of Controlling Factors in Mixed Biogenic and Thermogenic Petroleum Systems. A Case Study from the Levantine Basin. Search and Discovery Article #10636, 2014. In Proceedings of the AAPG Annual Convention and Exhibition, Houston, TX, USA, 6–9 April 2014. [Google Scholar]
- Schneider, F.; Dubille, M.; Montadert, L. Modeling of microbial gas generation: Application to the eastern Mediterranean “Biogenic Play”. Geol. Acta 2016, 14, 403–417. [Google Scholar]
- Sowiżdżał, K.; Słoczyński, T.; Stadtműller, M.; Kaczmarczyk, W. Lower Palaeozoic petroleum systems of the Baltic Basin in northern Poland: A 3D basin modeling study of selected areas (onshore and offshore). Interpretation 2018, 6, SH117–SH132. [Google Scholar] [CrossRef]
- Machowski, G.; Pstrucha, A.; Krzyżak, A.T. Petrophysical characterization of the pore space in gas-bearing Miocene rocks from the Siedleczka area (the Carpathian Foredeep, Poland). In Proceedings of the 17th International Multidisciplinary Scientific GeoConference SGEM 2017, Science and Technologies in Geology, Exploration and Mining, Albena, Bulgaria, 29 June–5 July 2017; Volume 17, pp. 789–796. [Google Scholar] [CrossRef]
- Marzec, P.; Sechman, H.; Kasperska, M.; Cichostępski, K.; Guzy, P.; Pietsch, K.; Porębski, S.J. Interpretation of a gas chimney in the Polish Carpathian Foredeep based on integrated seismic and geochemical data. Basin Res. 2018, 30, 210–227. [Google Scholar] [CrossRef]
- Papiernik, B.; Krzysztofik, M.; Machowski, G.; Cierzniak, M. 3D modelling, as a tool of spatial representation of Miocene clastic reservoir of natural gas. Case study: Husów-Nienadowa area, the Carpathian Foredeep, Poland. In Proceedings of the 16th International Multidisciplinary Scientific GeoConference SGEM 2016, Science and Technologies in Geology, Exploration and Mining, Vienna, Austria, 2–5 November 2016; Volume IV, pp. 11–18, book 1. [Google Scholar] [CrossRef]
- Papiernik, B.; Krzysztofik, M.; Słyś, M.; Górecki, W.; Michna, M.; Machowski, G.; Pietrusiak, M.; Poprawa, P.; Sowiżdżał, A.; Staryszak, G. The New Opportunity of Gas Exploration From Tight Mudstone and Shale Dominated Sequences in Miocene, Carpathian Foredeep, Poland. In Proceedings of the AAPG Annual Convention & Exhibition, Houston, TX, USA, 2–5 April 2017. [Google Scholar]
- Pstrucha, A.; Machowski, G. Petrophysical properties of the Miocene rocks from the deep part the Carpathian Foredeep Basin (South-East Poland). In Proceedings of the 16th International Multidisciplinary Scientific GeoConference SGEM 2016, Science and Technologies in Geology, Exploration and Mining, Vienna, Austria, 2–5 November; Volume IV, pp. 159–166, book 1. [CrossRef]
- Sechman, H.; Góra, A.; Twaróg, A.; Guzy, P.; Górska-Mruk, E.; Górecki, W. Near-Surface Geochemical Anomalies Integrated with Seismic and Well Data over the Contact of the Outer Carpathians and the Carpathian Foredeep (SE Poland). Geofluids 2018, 2018, 7014324. [Google Scholar] [CrossRef]
- Rice, D.D.; Claypool, G. Generation, accumulation, and resource potential of biogenic gas. Aapg Bull. 1981, 65, 5–25. [Google Scholar]
- Cokar, M.; Kallos, M.S.; Huang, H.; Larter, S.R.; Gates, I.D. Biogenic Gas Generation from Shallow Organic-Matter-Rich Shales. In Proceedings of the Canadian Unconventional Resources and International Petroleum Conference, Calgary, AB, Canada, 19–21 October 2010. [Google Scholar]
- Zhang, Y.G.; Chen, H.J. Concepts on the generation and accumulation of biogenic gas. J. Pet. Geol. 1985, 8, 405–422. [Google Scholar]
- Kotarba, M.J.; Szafran, S.; Espitalie, J. A study of organic mater and natural gas of the Miocene sediments in the Polisch part of Carpathian Foredeep. Chem. Geol. 1987, 64, 197–207. [Google Scholar] [CrossRef]
- Kotarba, M.J.; Peryt, T.; Koltun, Y. Microbial gas system and prospectives of hydrocarbon exploration in Miocene strata of the Polish and Ukrainian Carpathian Foredeep. Ann. Soc. Geol. Pol. 2011, 81, 523–548. [Google Scholar]
- Matyasik, I.; Słoczyński, T. Calculation of the kerogen activation energy distribution used for modelling of unconventional petroleum systems. Pr. Nauk. Inig 2012, 182, 661–666. [Google Scholar]
- Bernard, B.B.; Brooks, J.M.; Sackett, W.M. Light hydrocarbons in recent Texas continental shelf and slope sediments. J. Geophys. Res. 1978, 83, 4053–4061. [Google Scholar] [CrossRef]
- Myśliwiec, M.; Borys, Z.; Bosak, B.; Liszka, B.; Madej, K.; Maksym, A.; Oleszkiewicz, K.; Pietrusiak, M.; Plezia, B.; Staryszak, G.; et al. Hydrocarbon Resources of the Polish Carpathian Foredeep: Reservoirs, Traps, and Selected Hydrocarbon Fields. In The Carpathians and their Foreland: Geology and Hydrocarbon Resources; Golonka, J., Picha, F.J., Eds.; The American Association of Petroleum Geologists: Tulsa, OK, USA, 2006; pp. 351–393, Memoir 84. [Google Scholar]
- Matyasik, I.; Myśliwiec, M.; Leśniak, G.; Such, P. Relationship between Hydrocarbon Generation and Reservoir Development in the Carpathian Foreland (Poland). In Thrust Belts and Foreland Basins: From Fold Kinematics to Hydrocarbon Systems; Lacombe, O., Lave, J., Roure, F., Eds.; Springer-Verlag: Berlin, Germany, 2007; pp. 413–427. [Google Scholar]
- Espitalie, J.; Deroo, G.; Marquis, F. La pyrolyse Rock Eval et ses aplications. Rev. De L’institut Fr. Du Pet. 1985, 40, 755–784. [Google Scholar]
- Clayton, C.J. Source volumetrics of biogenic gas generation. In Bacterial Gas; Vially, R., Ed.; Editions Technip: Paris, France, 1992; pp. 191–204. [Google Scholar]
- Burdige, D. Preservation of organic matter in marine sediments: Controls, mechanisms and imbalance in sediments organic carbon budgets? Chem. Rev. 2007, 107, 467–485. [Google Scholar] [CrossRef]
- Clayton, J.L. Geochemistry of coal bed gas—A review. Int. J. Coal Geol. 1998, 35, 159–173. [Google Scholar] [CrossRef]
- Claypool, G.E.; Kaplan, I.R. The origin and distribution of methane in marine sediments. In Natural Gases in Marine Sediments; Kaplan, I.R., Ed.; Plenum Press: New York, NY, USA, 1974; pp. 98–139. [Google Scholar]
- Deming, D.; Chapman, D.S. Thermal histories and hydrocarbon generation: Example from Utah-Wyoming thrust belt. Aapg Bull. 1989, 73, 1455–1471. [Google Scholar]
- Grassmann, S.; Cramer, B.; Delisle, G. Geological history and petroleum system of the Mittelplate oil field, Northern Germany. Int. J. Earth Sci. 2005, 94, 979–989. [Google Scholar] [CrossRef]
- Parsons, J.G. An analysis of the variation of ocean floor bathymetry and heat flow with age. J. Geophys. Res. 1977, 82, 803–827. [Google Scholar] [CrossRef]
- Wygrala, B. Integrated study of an oil field in the southern Po Basin, Northern Italy. Ph.D. Thesis, University of Cologne, Cologne, Germany, 1989. [Google Scholar]


© 2020 by the authors. Licensee MDPI, Basel, Switzerland. This article is an open access article distributed under the terms and conditions of the Creative Commons Attribution (CC BY) license (http://creativecommons.org/licenses/by/4.0/).