1. Introduction
The reduction of power transmission losses resulting from the flow of electricity through conductive elements in the transmission and distribution system is a problem of significant importance. Cable lines is a particular case, in which apart from losses in the conductor, additional losses related to the current flowing through metallic cable screens or cable sheaths are observed [
1,
2]. In metallic cable screens, losses associated with the current flow and occurrence of eddy currents can be distinguished. According to the literature [
3], eddy currents constitute a small percentage of the total losses, and do not depend on the arrangement of the cable screen connection—therefore, the main purpose of limiting losses methods is associated with minimizing the flow of induced current in the cable screen.
In order to increase the efficiency of electricity transmission via cable lines, these losses can be reduced by using methods based on changing the configuration of the cable connection method or grounding configuration of the cable screens. Among the methods using grounding configuration changes, the most commonly described by literature are single point bonding [
4,
5], cross-bonding [
4,
6] and cross-bonding with cable transposition [
4,
7]. The application of these methods has a positive effect related to the reduction of transmission losses, although it may be associated with the occurrence of undesirable phenomena. In power system fault states, such as ground faults or phase-to-phase faults, a return current is induced in the cable screen, the flow of which generates a transient voltage [
8,
9].
In the literature, research on overvoltages connected with a change of cable screen grounding configuration in high voltage (HV) cable lines can most often be found [
4,
10,
11,
12]. The results of these tests confirm that changes positively affecting the reduction of transmission losses, especially in cases of transient states, can have a significant impact on the overvoltage developing. The occurrence of this phenomenon may lead to breaking the continuity of cable screen insulation, and thus cause damage to the cable line. Despite the lack of a standardized way of connecting the cable screen, surge arresters are recommended in such cases [
13]. However, cases of such grounding configuration changes in medium voltage (MV) cable lines are still being investigated, which means that it is not possible to properly select a surge arrester and overvoltage protection for MV cable lines.
Methods mostly used to reduce transmission losses in HV cable screens transferred to the ground of the MV network may be connected with the occurrence of an electric shock, overvoltage hazard or obstructing the operation of such networks as difficulties in detecting cable line damage [
14]. The primary reason for this is the differences in the construction of HV and MV networks, among other differences in neutral point grounding. HV networks are solidly grounded neutral systems, while MV networks’ neutral point is grounded unsolidly through resistors or chokes, or is insulated [
15].
In the paper below, methods that grant reductions in cable screen losses of up to 50% will be presented. The methods developed by the authors of the article [
16] allow changing the configuration of cable screen grounding of one or two of three phase lines consisting of a single conductors cable, while maintaining the operational capabilities of the cable line and reducing the risk of electric shock. The first part of the work presents the results of the simulation of the phenomena, which are the result of a single-phase ground fault in the overhead line connected to a cable line, while analysing overvoltage generated within the cable screen of the cable. The second part contains the results of field tests constituting verification for simulation tests. The last part of the paper comprises a discussion of differences in simulation and field research results, as well as conclusions from the obtained outcomes.
2. Materials and Methods
According to the article [
16], there is no risk of significant overvoltage occurrences during interference-free operation, although in fault states, overvoltages can reach levels of up to several kilovolts (kV). The research tools used in this paper to verify the cited thesis are simulation studies and field studies. Due to the possibility of comparing these two methods, the study was carried out using an appropriate, corresponding fragment of the real network, a simulation model and a calculation program that allows the analysis of such a model. In the case of the presented problem, the DIgSILENT Power Factory (DIgSILENT GmbH, Gomaringen, Germany) tool was chosen. The first step was to create a model of a medium voltage network.
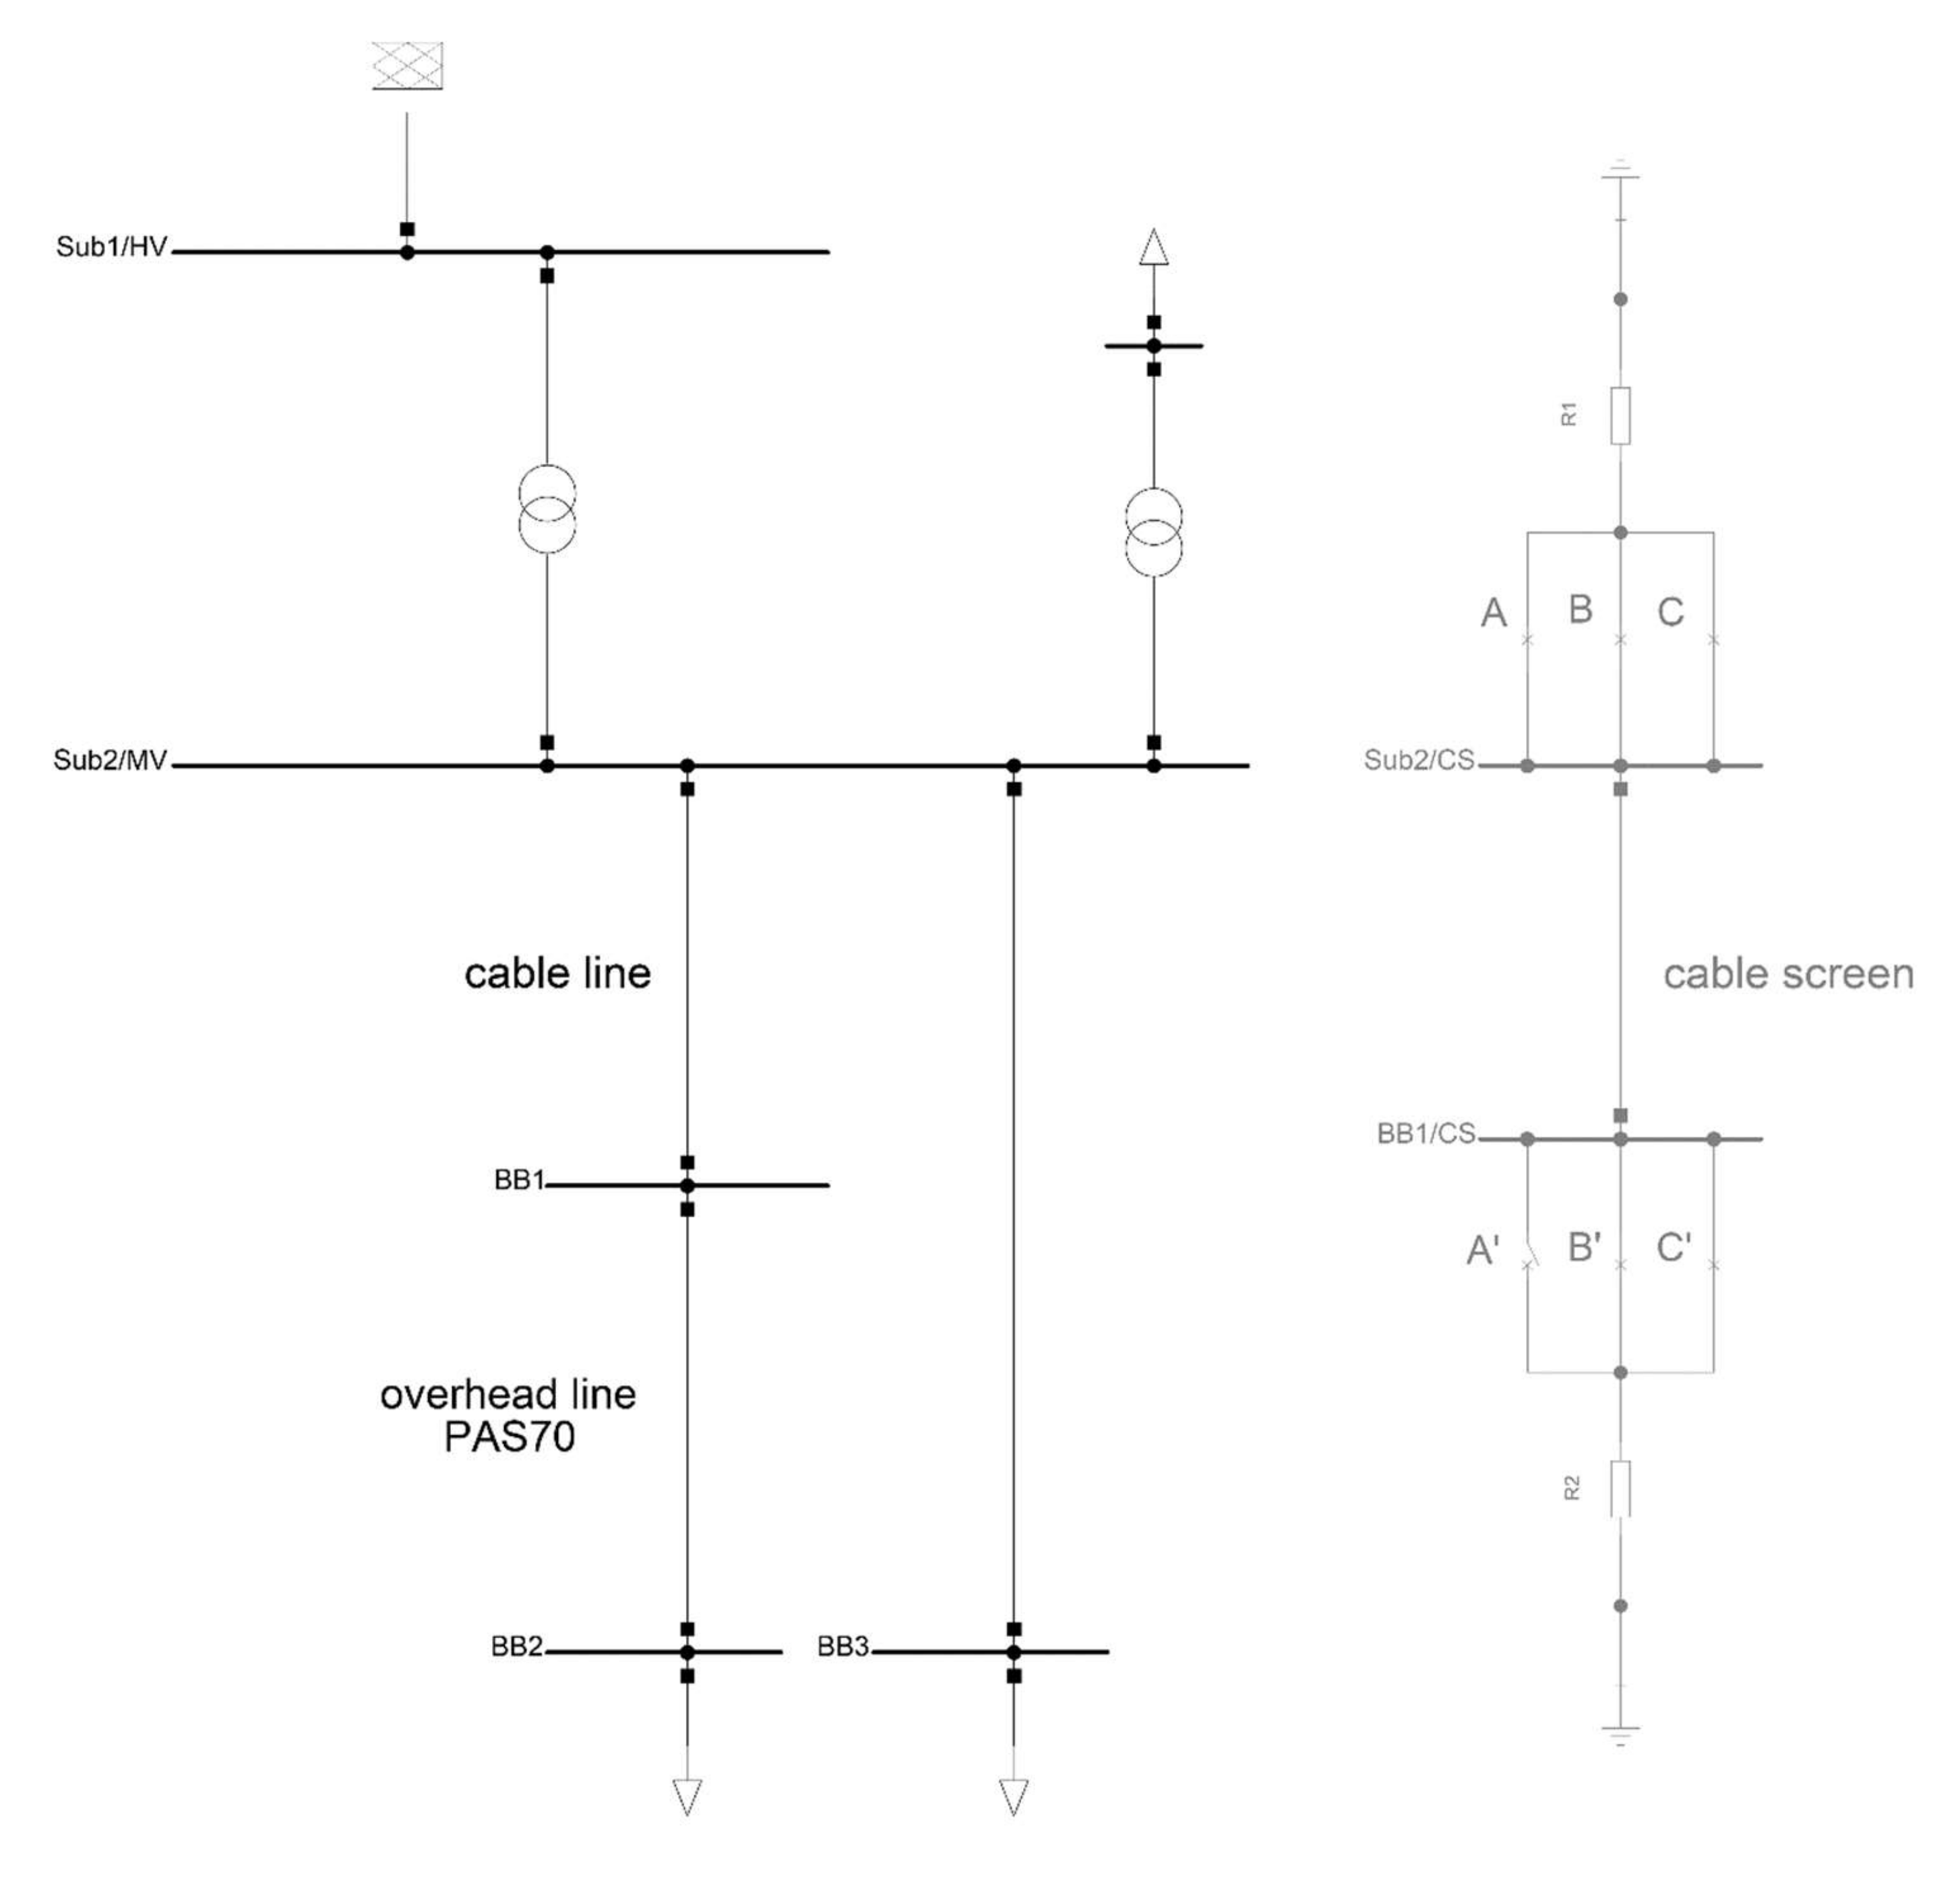
The network diagram shows a fragment of one of the sections of the dual-section station with two bays, where one is a mixed cable and overhead line mixed bay, and the other allows adjusting the transformer load and comprises an overhead line and load. The network modelled in the program is a resonant grounded neutral system [
17]. Parameters of the components of the network diagram shown in
Figure 1 are presented in
Table 1. The parameter values were selected according to the actual state of the network, based on catalogue cards [
18,
19,
20].
A special case for the analyses of overvoltage phenomena in grounded cable screens is a cable line connected to an overhead line. The probability of damage to the cable line insulation in connection with the occurrence of the ground fault overvoltage depends not only on its peak value, but also increases with the frequency of fault appearance in such a line. Due to the construction of the overhead line and more frequent interference on such a line, it is in cable-overhead lines that the probability of cable damage is higher [
21].
The diagram presented below (
Figure 1) was created in the Power Factory program, and consists of the elements listed in
Table 1. All the elements contained in this network are three-phase equipment, and operate on an AC current. According to program standards, the cable screen is represented as a separate object, thanks to which grounding operations are possible.
Simulations on a created network were held using the Simulation EMT tool [
22]. This allows the performing of simulations using instantaneous values for electromagnetic transient states. For purposes of this research, a disturbed parameter model was chosen. Further steps involved choosing network representation, which in this case was an unbalanced three-phase, and the sequence of events in simulation.
In connection with the subject of the papers, fault states for three scenarios presented in
Table 2 were modeled. In all scenarios, ground faults in phase A were simulated, although the configuration of ungrounded cable screen phases was changed according to the type of research.
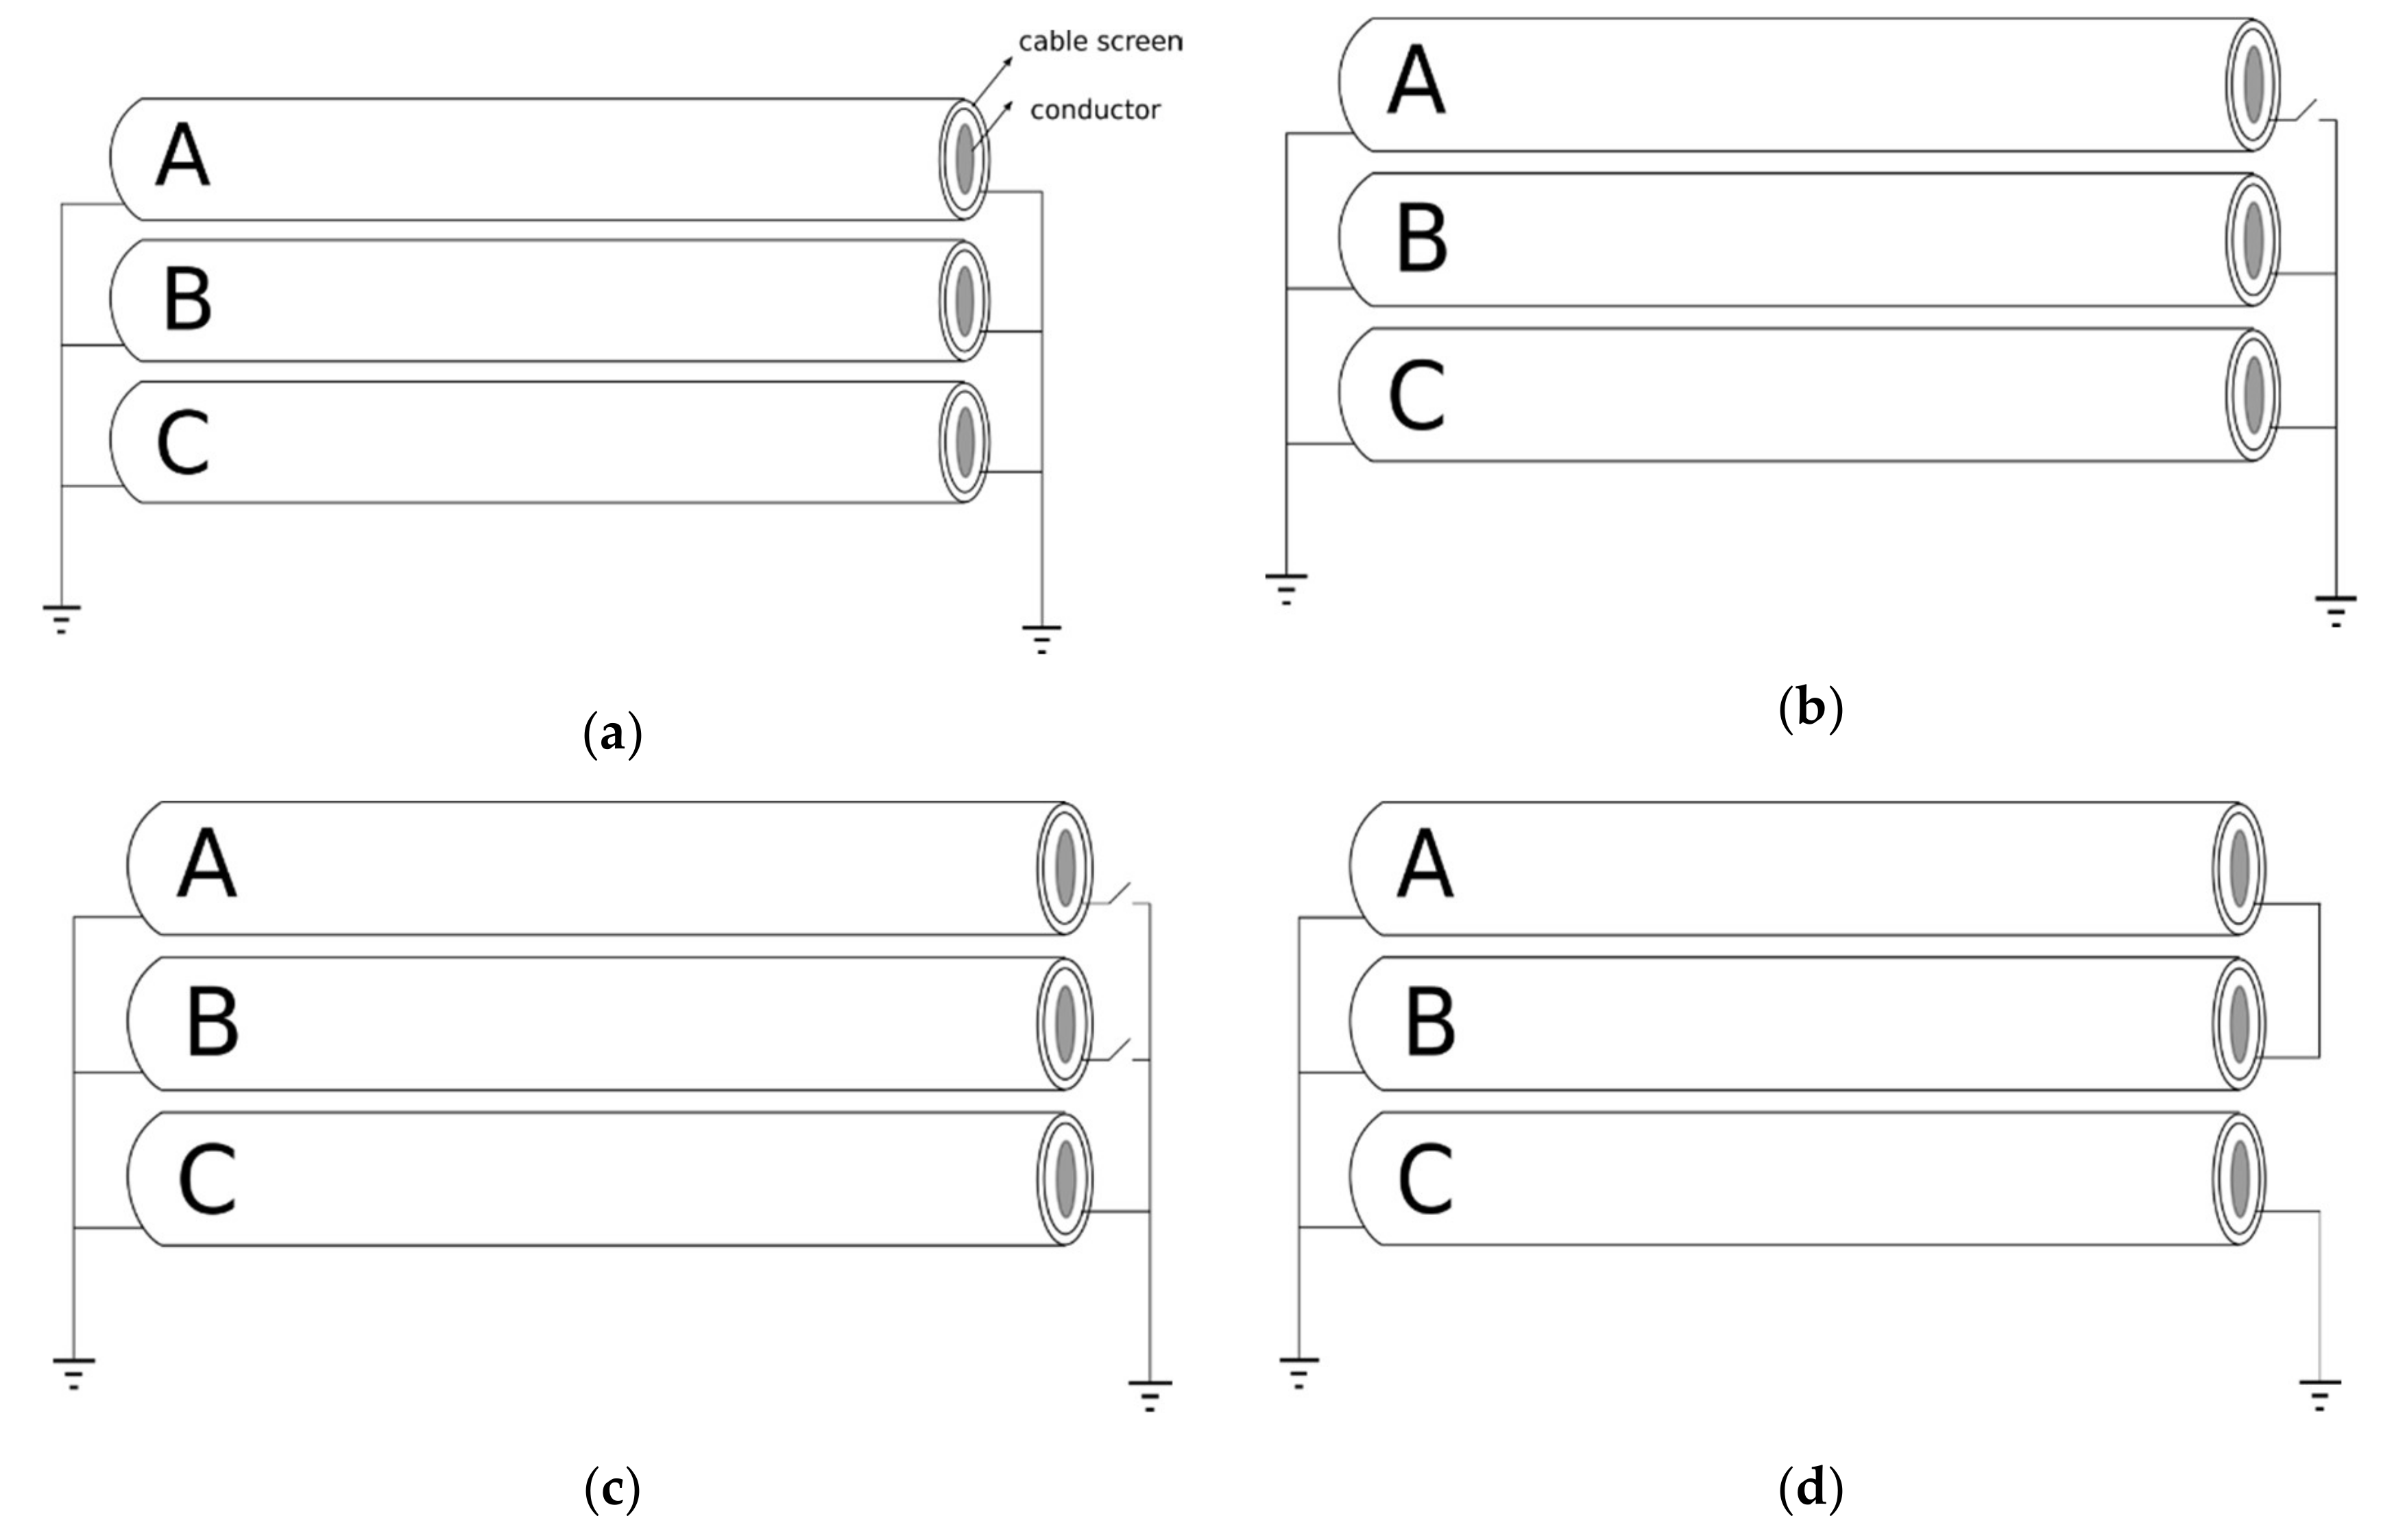
In
Figure 2, the three-phase single conductor cable line is shown. Representations of the simulation’s scenarios are presented in
Figure 3. In the following cases, conductors are connected to the three-phase overhead line through termination placed on a medium voltage (MV) concrete pole. In every scenario, cable screens of all phases are grounded in the station through the grounding resistance
R1 = 0.5 Ω, while on the side where changes are made, the grounding resistance of the concrete pole was
R2 = 7.4 Ω. It should be noted that during simulation and field tests, the grounding of the cable line screens on the station side remains unchanged, and only the configuration of cable screens groundings on the side of the cable line connection with the overhead line was changing.
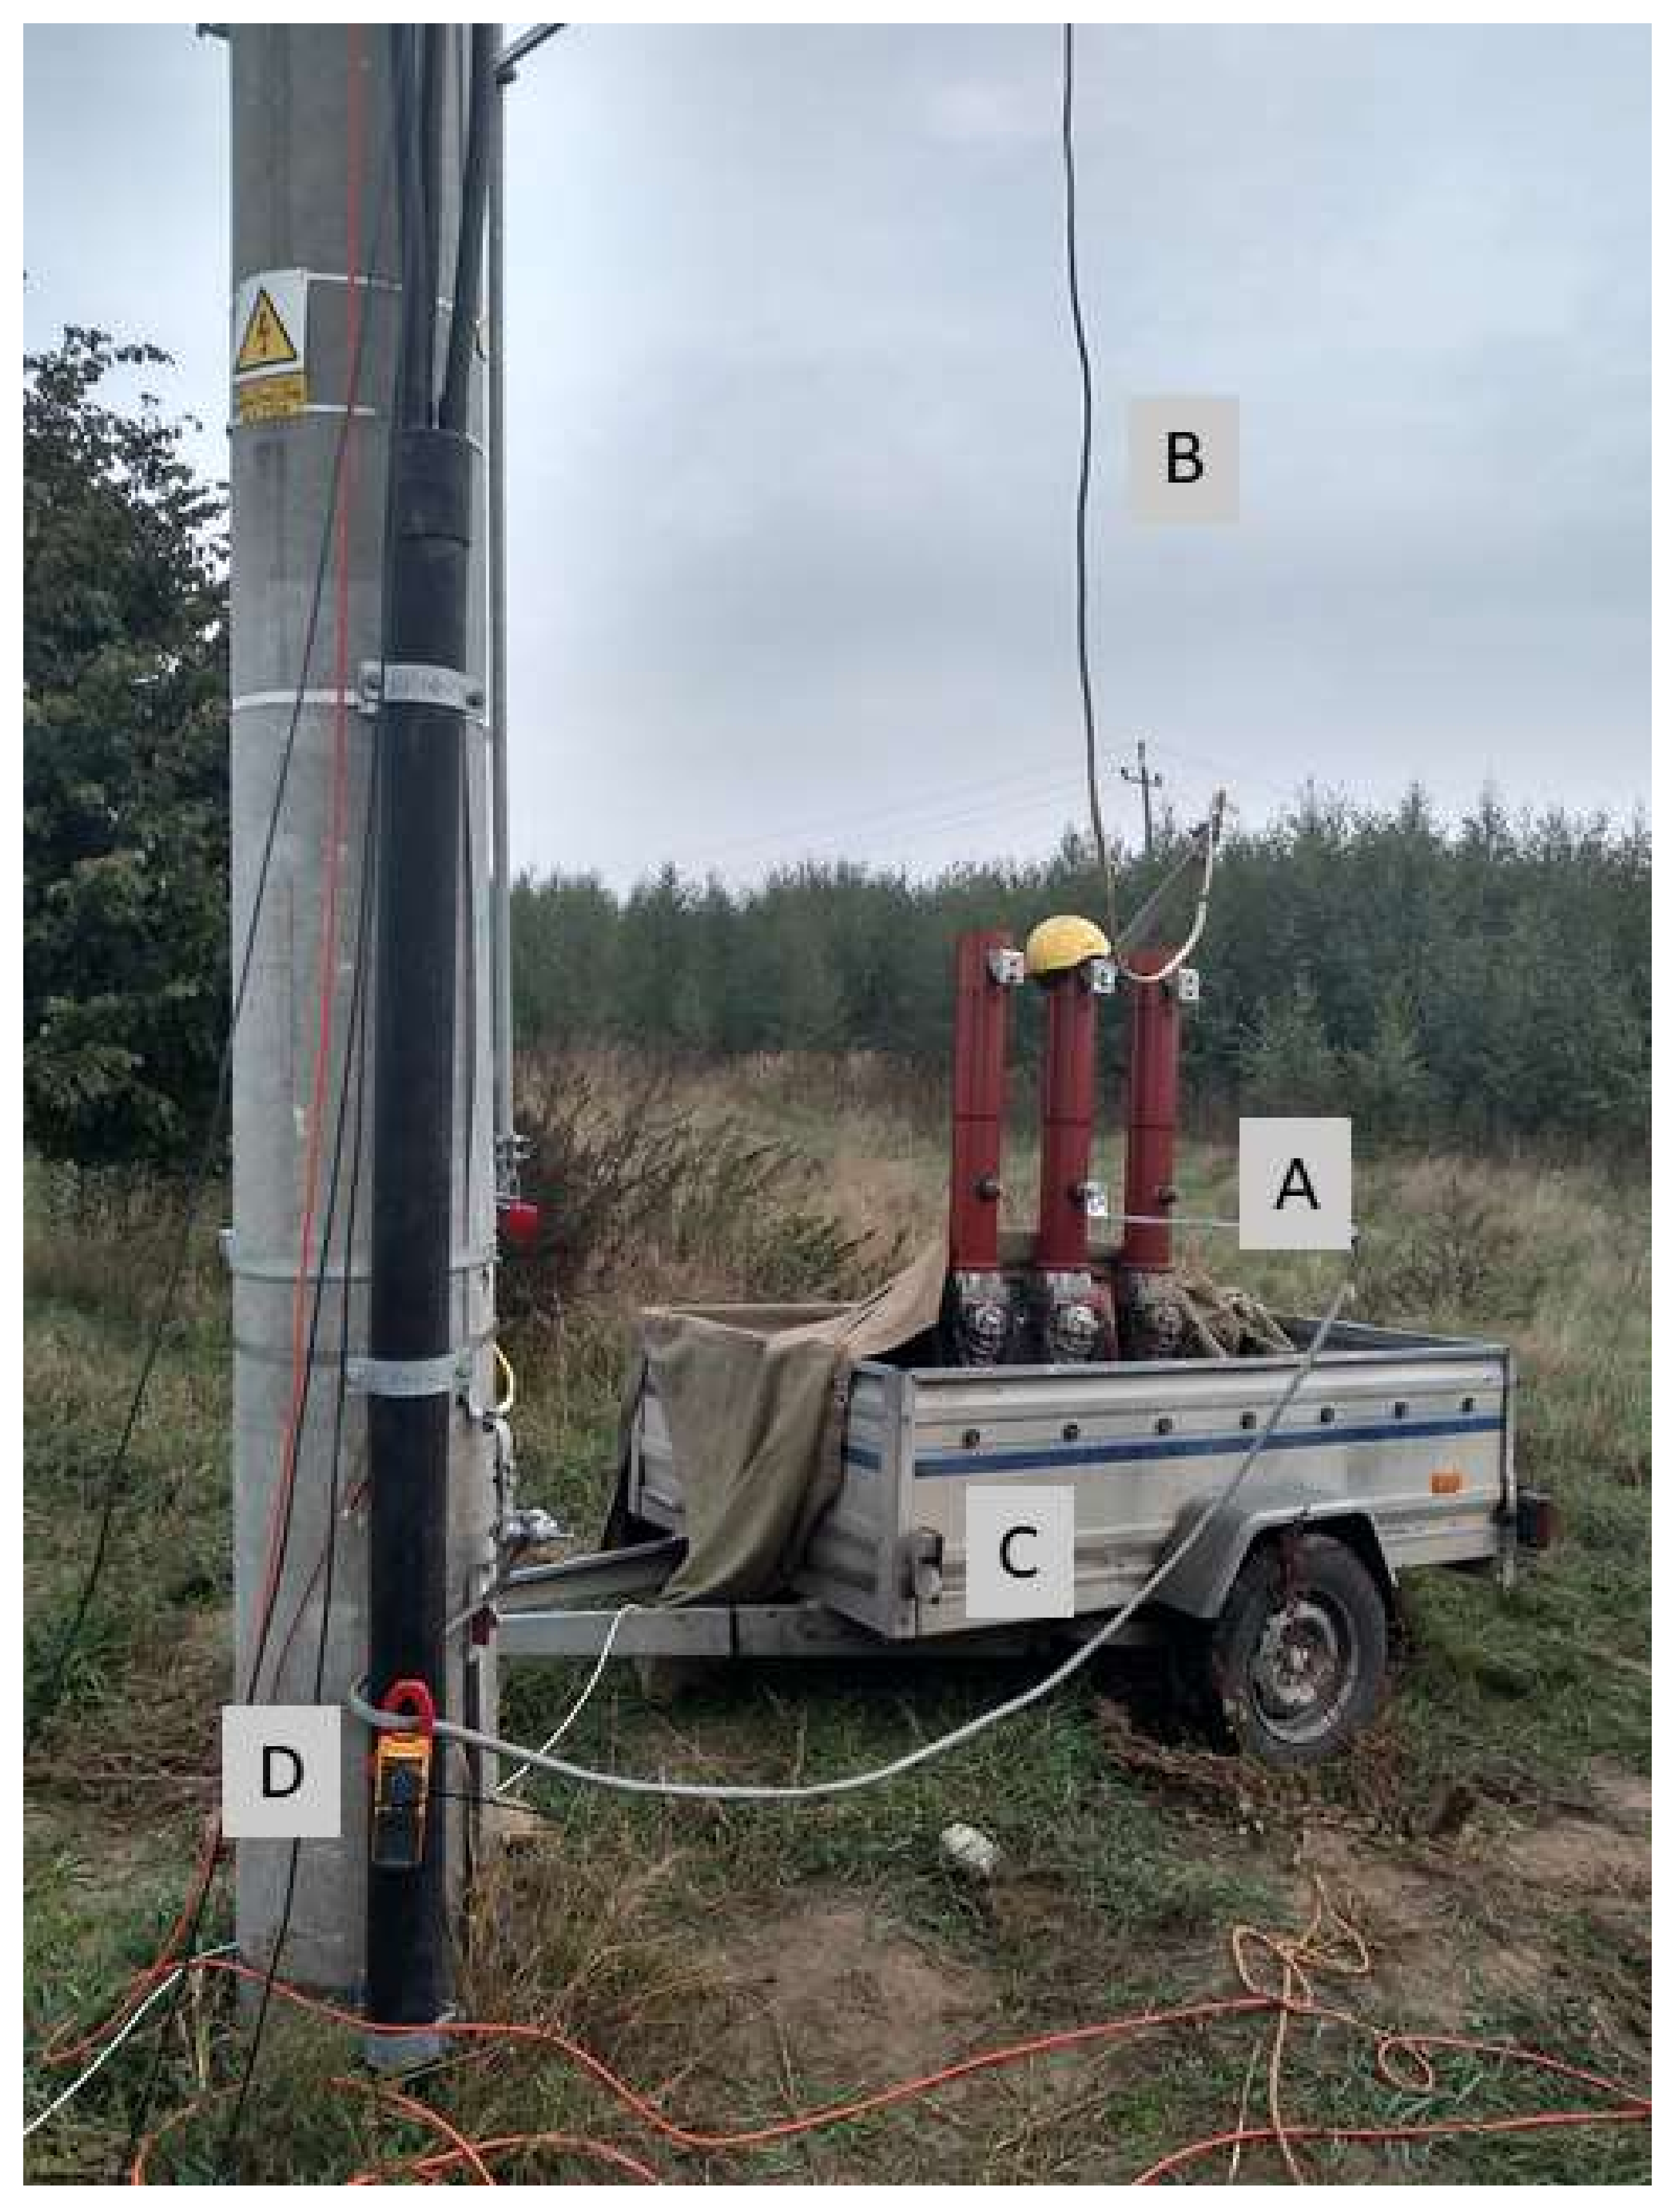
To compare simulation results with actual network states, with the consent and in cooperation with the operator of distribution network, field tests were carried out in a fragment of the real network that corresponds to the fragment modelled in the Power Factory program. The measuring stand was organized in the vicinity of a concrete pole, on which cable termination is installed and where the cable line connects with the insulated overhead line. Measuring devices such as registrators and resistive voltage dividers were installed on the prepared platform on the pole, in order to record voltages in cable screens.
The fault test stand (
Figure 2) was located by line pole, and was composed of the following elements:
Remotely controlled circuit breaker
Connection of one circuit breaker pole to MV line phase conductor
Connection of second circuit breaker pole to pole earthing
Ground current measuring system
Field tests such as the connection configuration shown in
Table 2 were carried out, much like the computer simulation. The main measuring system used in this research was composed of three one-phase pure resistive voltage dividers connected with cable screens at the place of their exit from termination. The other ends of the dividers were connected to the oscilloscope. These dividers were constructed specifically for the needs of tests. Their transmission was selected in a safe and precise manner, so that it is possible to register voltage waveforms generated in cable screens at transient states. The measurement was carried out using a high-quality MDO 3104 digital oscilloscope from Tektronix (Tektronix, Inc., 14200 S.K. Karl Braun Drive, Beaverton, Oregon, 97077, U.S.A.), whose sampling frequency is 5 GS/s [
23]. The mass of the measuring system was connected to the pole earthing.
3. Results
In this section, simulation tests’ results and field studies are presented. Both research methods are described and compared to show the accuracy of simulation tests that were held.
3.1. Simulation Results
Basic tests regarding the place of occurrence and ground fault overvoltages were carried out for the NA2XS(F)2Y standard cable, section 150/25, and at the length of 37 m. These simulations were aimed at verifying the correctness of the thesis concerning the medium voltage ground fault overvoltage which is dangerous for the operation of the network in a system with cable lines. Therefore, the first study was to determinate what order of magnitude can be expected during the reconfiguration of cable screens grounding.
All of the simulation tests presented in the paper were performed for the given network (
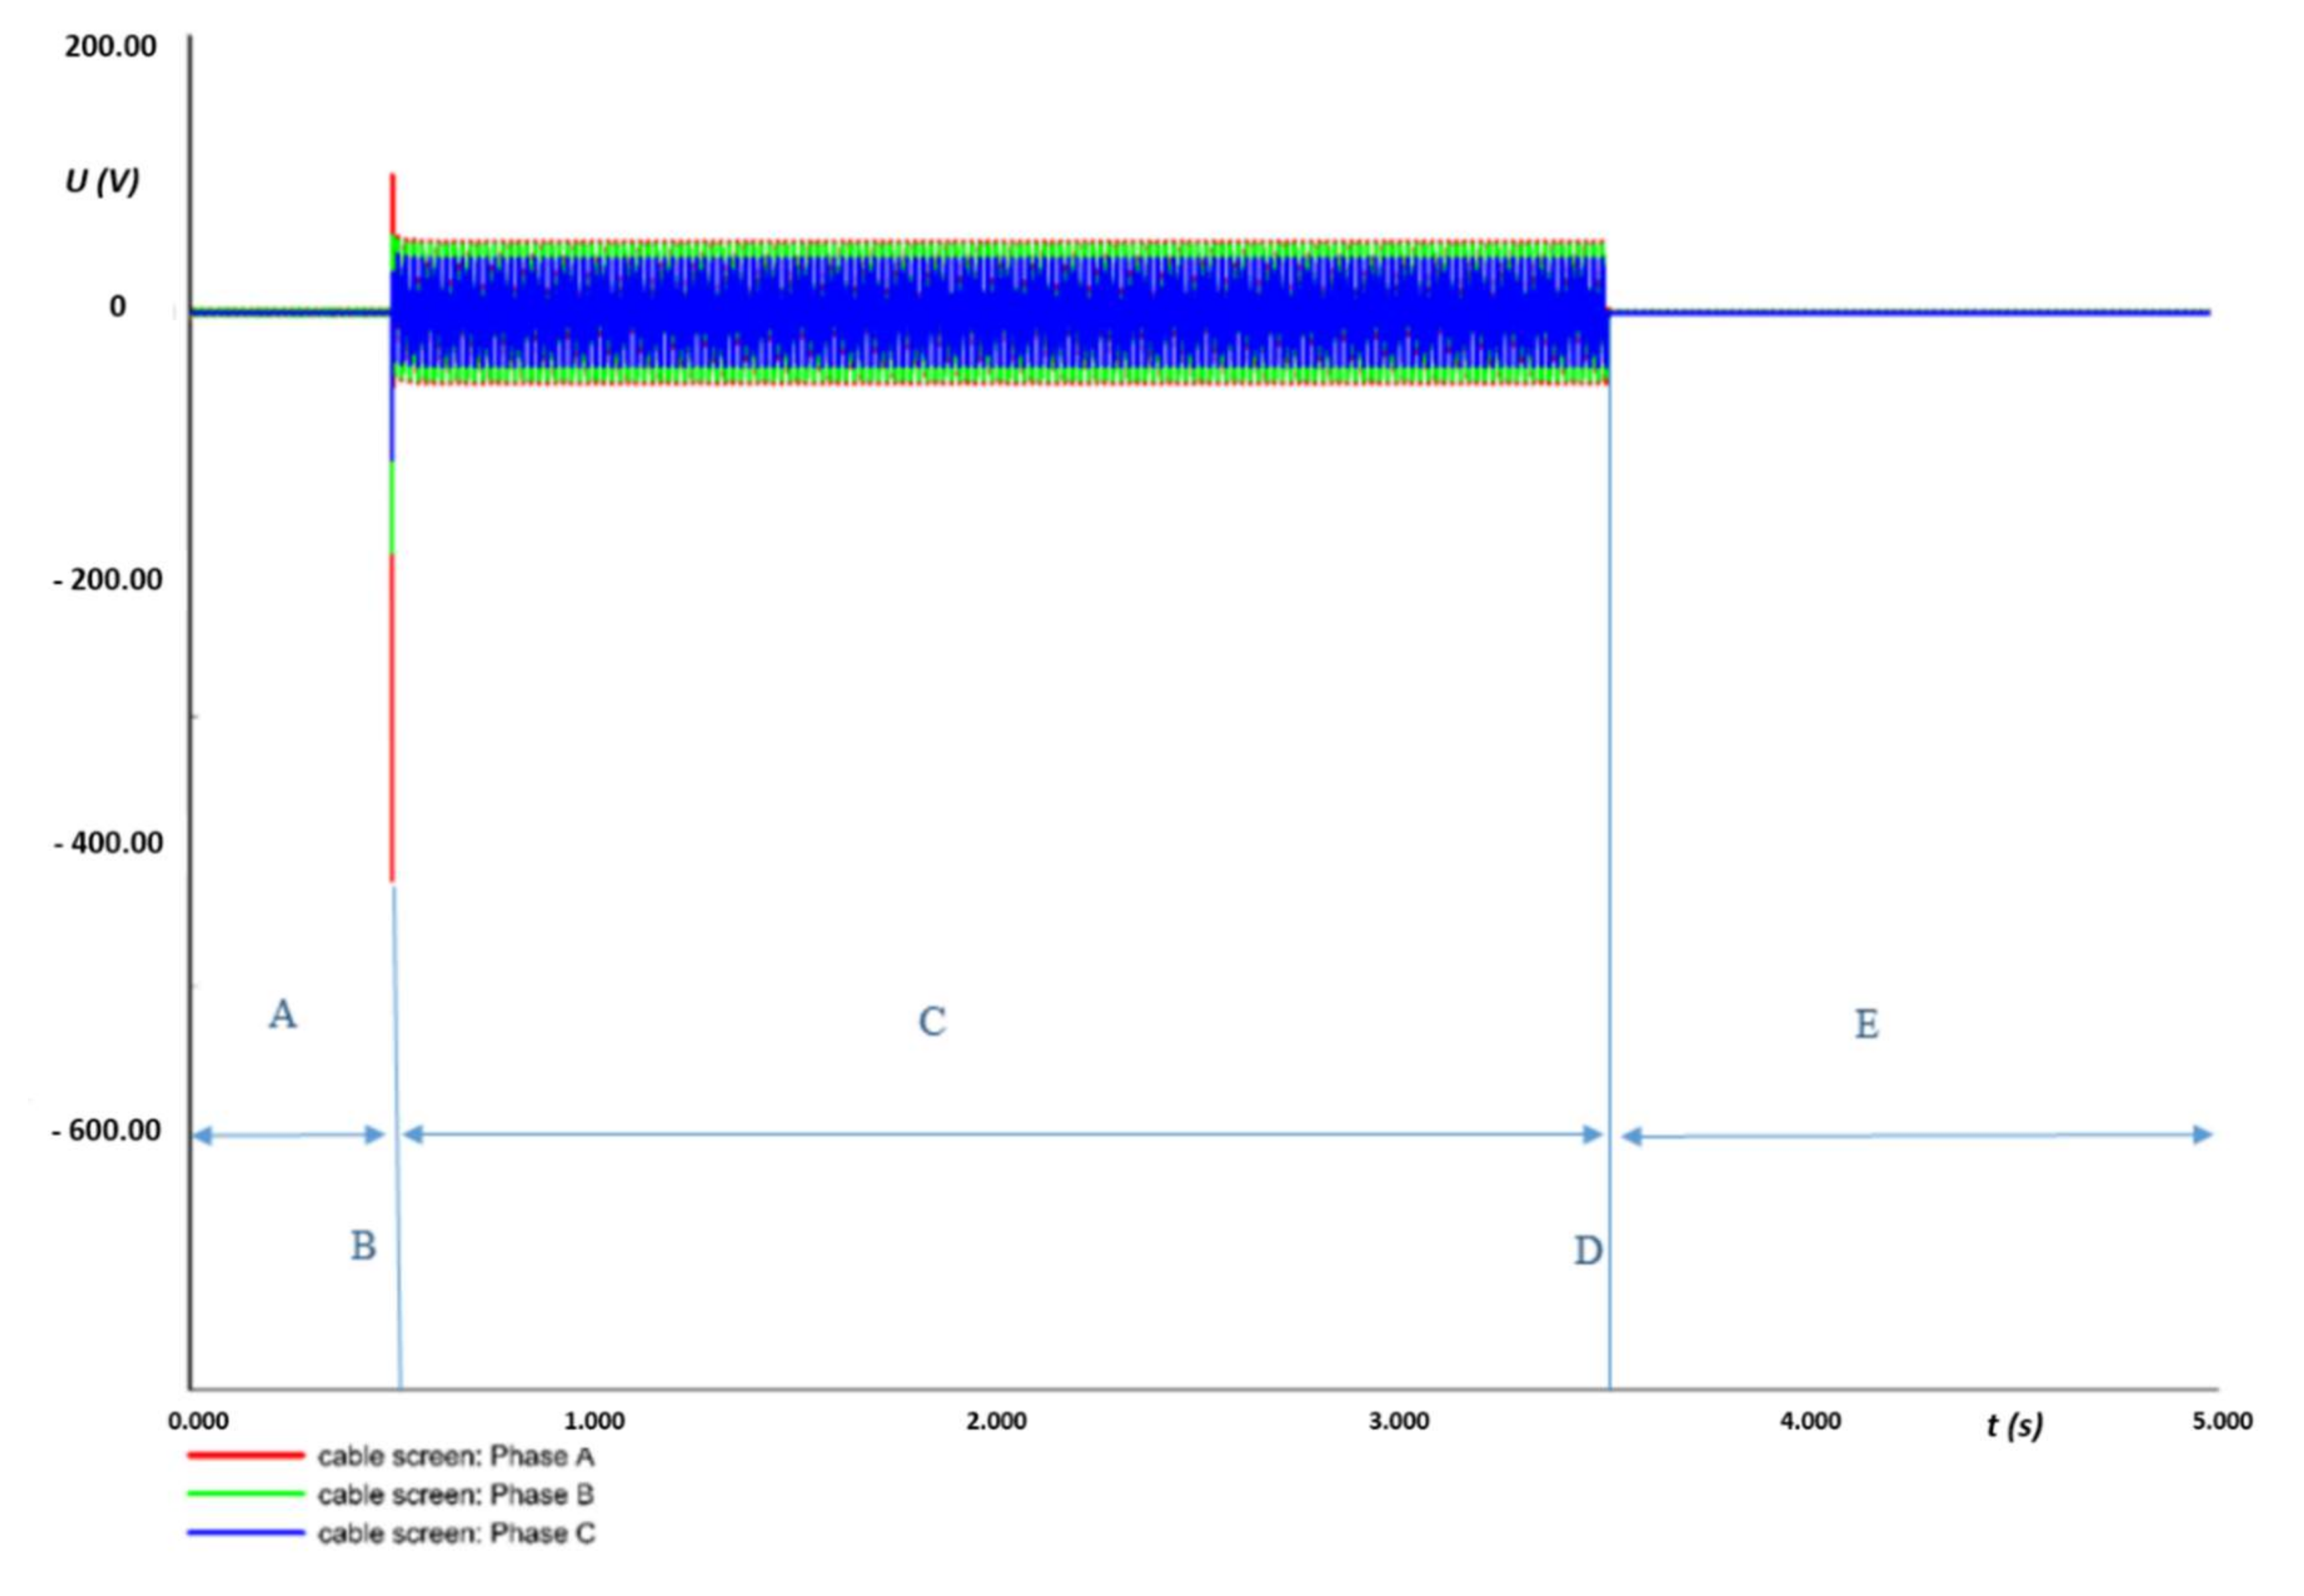
Figure 1). For the selected scenario, as intended, configuration changes were made using switches modelled in the network. The simulation was then performed, as described in
Figure 4.
As shown in
Figure 4, simulation tests required five simulation events:
Normal work, under load (A)
Start of a disturbed state at 1 s (B)
Fault suitable for the case under consideration lasting 3 s (C)
Opening the switch in the overhead line at 3.5 s (D)
State after disruption (E)
The most important phenomena in connection with the considered are the start and duration of the disturbance state, which in all cases lasted for 3 s. In order to reflect the transient nature of the overvoltage phenomena, the EMT method was used, and the fault states were made in the overhead line in a place distant from the pole by 20% of the length of overhead line.
3.1.1. First Scenario
Network configuration in this step required a disconnection from grounding a cable screen of one phase. According to
Table 2, phases B and C were grounded through pole grounding resistance, as in the classic grounding system, while phase A remains disconnected from one side. In this arrangement, the ground fault in the overhead line was modeled in accordance with the order of the simulation events shown in
Figure 4. Below are the waveforms obtained in this process for each phase, and a summary of results collected in
Table 3.
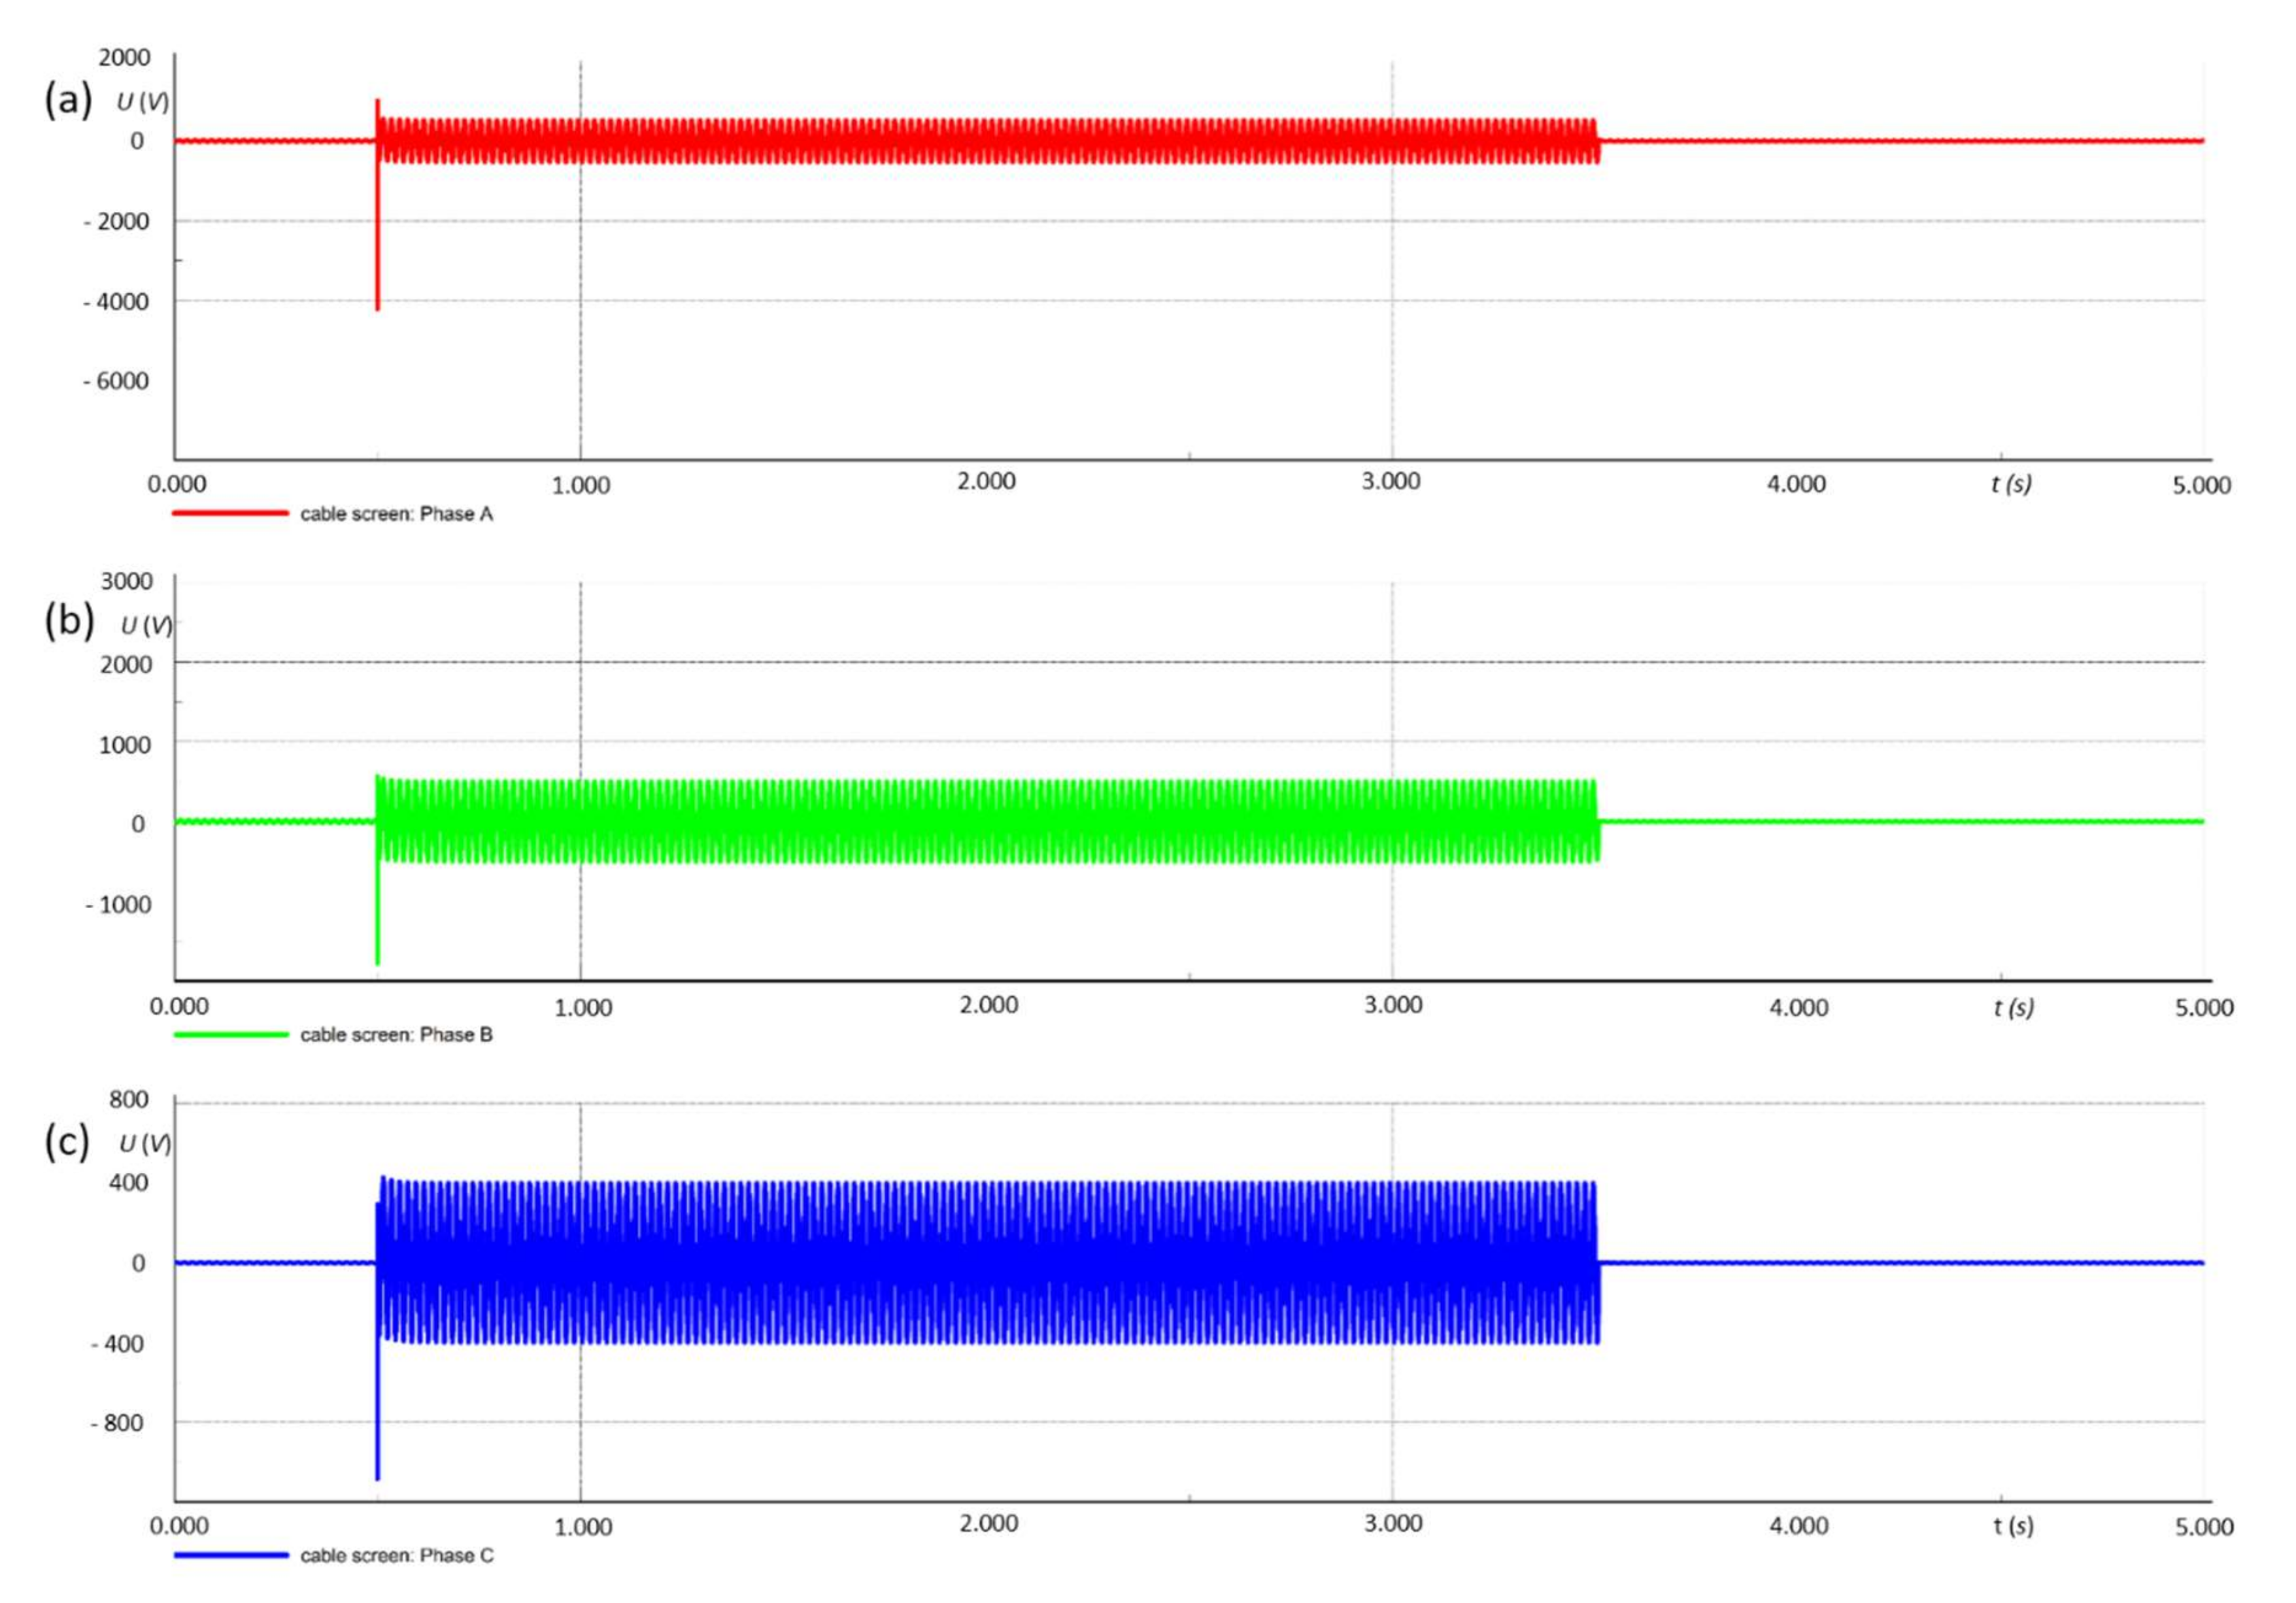
In the
Figure 5 waveforms, the simulation results are presented. In phase A, where the ground fault was performed, the value of overvoltage—as a peak of the waveform—can be identified, and is set at circa 4 kilovolts (kV). The same applies to other two waveforms, although in phases where there is no disturbance, the overvoltage value is much smaller and amounts to circa 650 V (
Table 3). It should be noted that during the fault state, voltage oscillations are visible at the waveforms. This phenomenon is related to the short-circuit current flow, which is responsible for the induction of voltage in the cable screens of the cable line.
3.1.2. Second Scenario
The next step of the simulation tests was to check the values of voltages and overvoltages when two phases of the cable screen in the cable line are disconnected from the ground. From the point of view of cable line losses, this is the most desirable case, where almost half of cable screen losses are reduced [
16]. The situation presented in this section is based on simulation events used in the previous section, and the basic change consists of connecting a cable screen according to a proper scenario.
As it is shown in
Table 4, values of overvoltages are therefore different for phases in which a fault occurs, and phases of cable screens that are not connected to the ground. In phase A, where ground fault is modelled, overvoltage reaches 4.2 kV, while in phase B it is more than two times smaller, at 1.7 kV. In grounded phase C, overvoltage also increased, but it is just over 1 kV. The waveform representation of voltage in cable screens is shown in
Figure 6.
3.1.3. Third Scenario
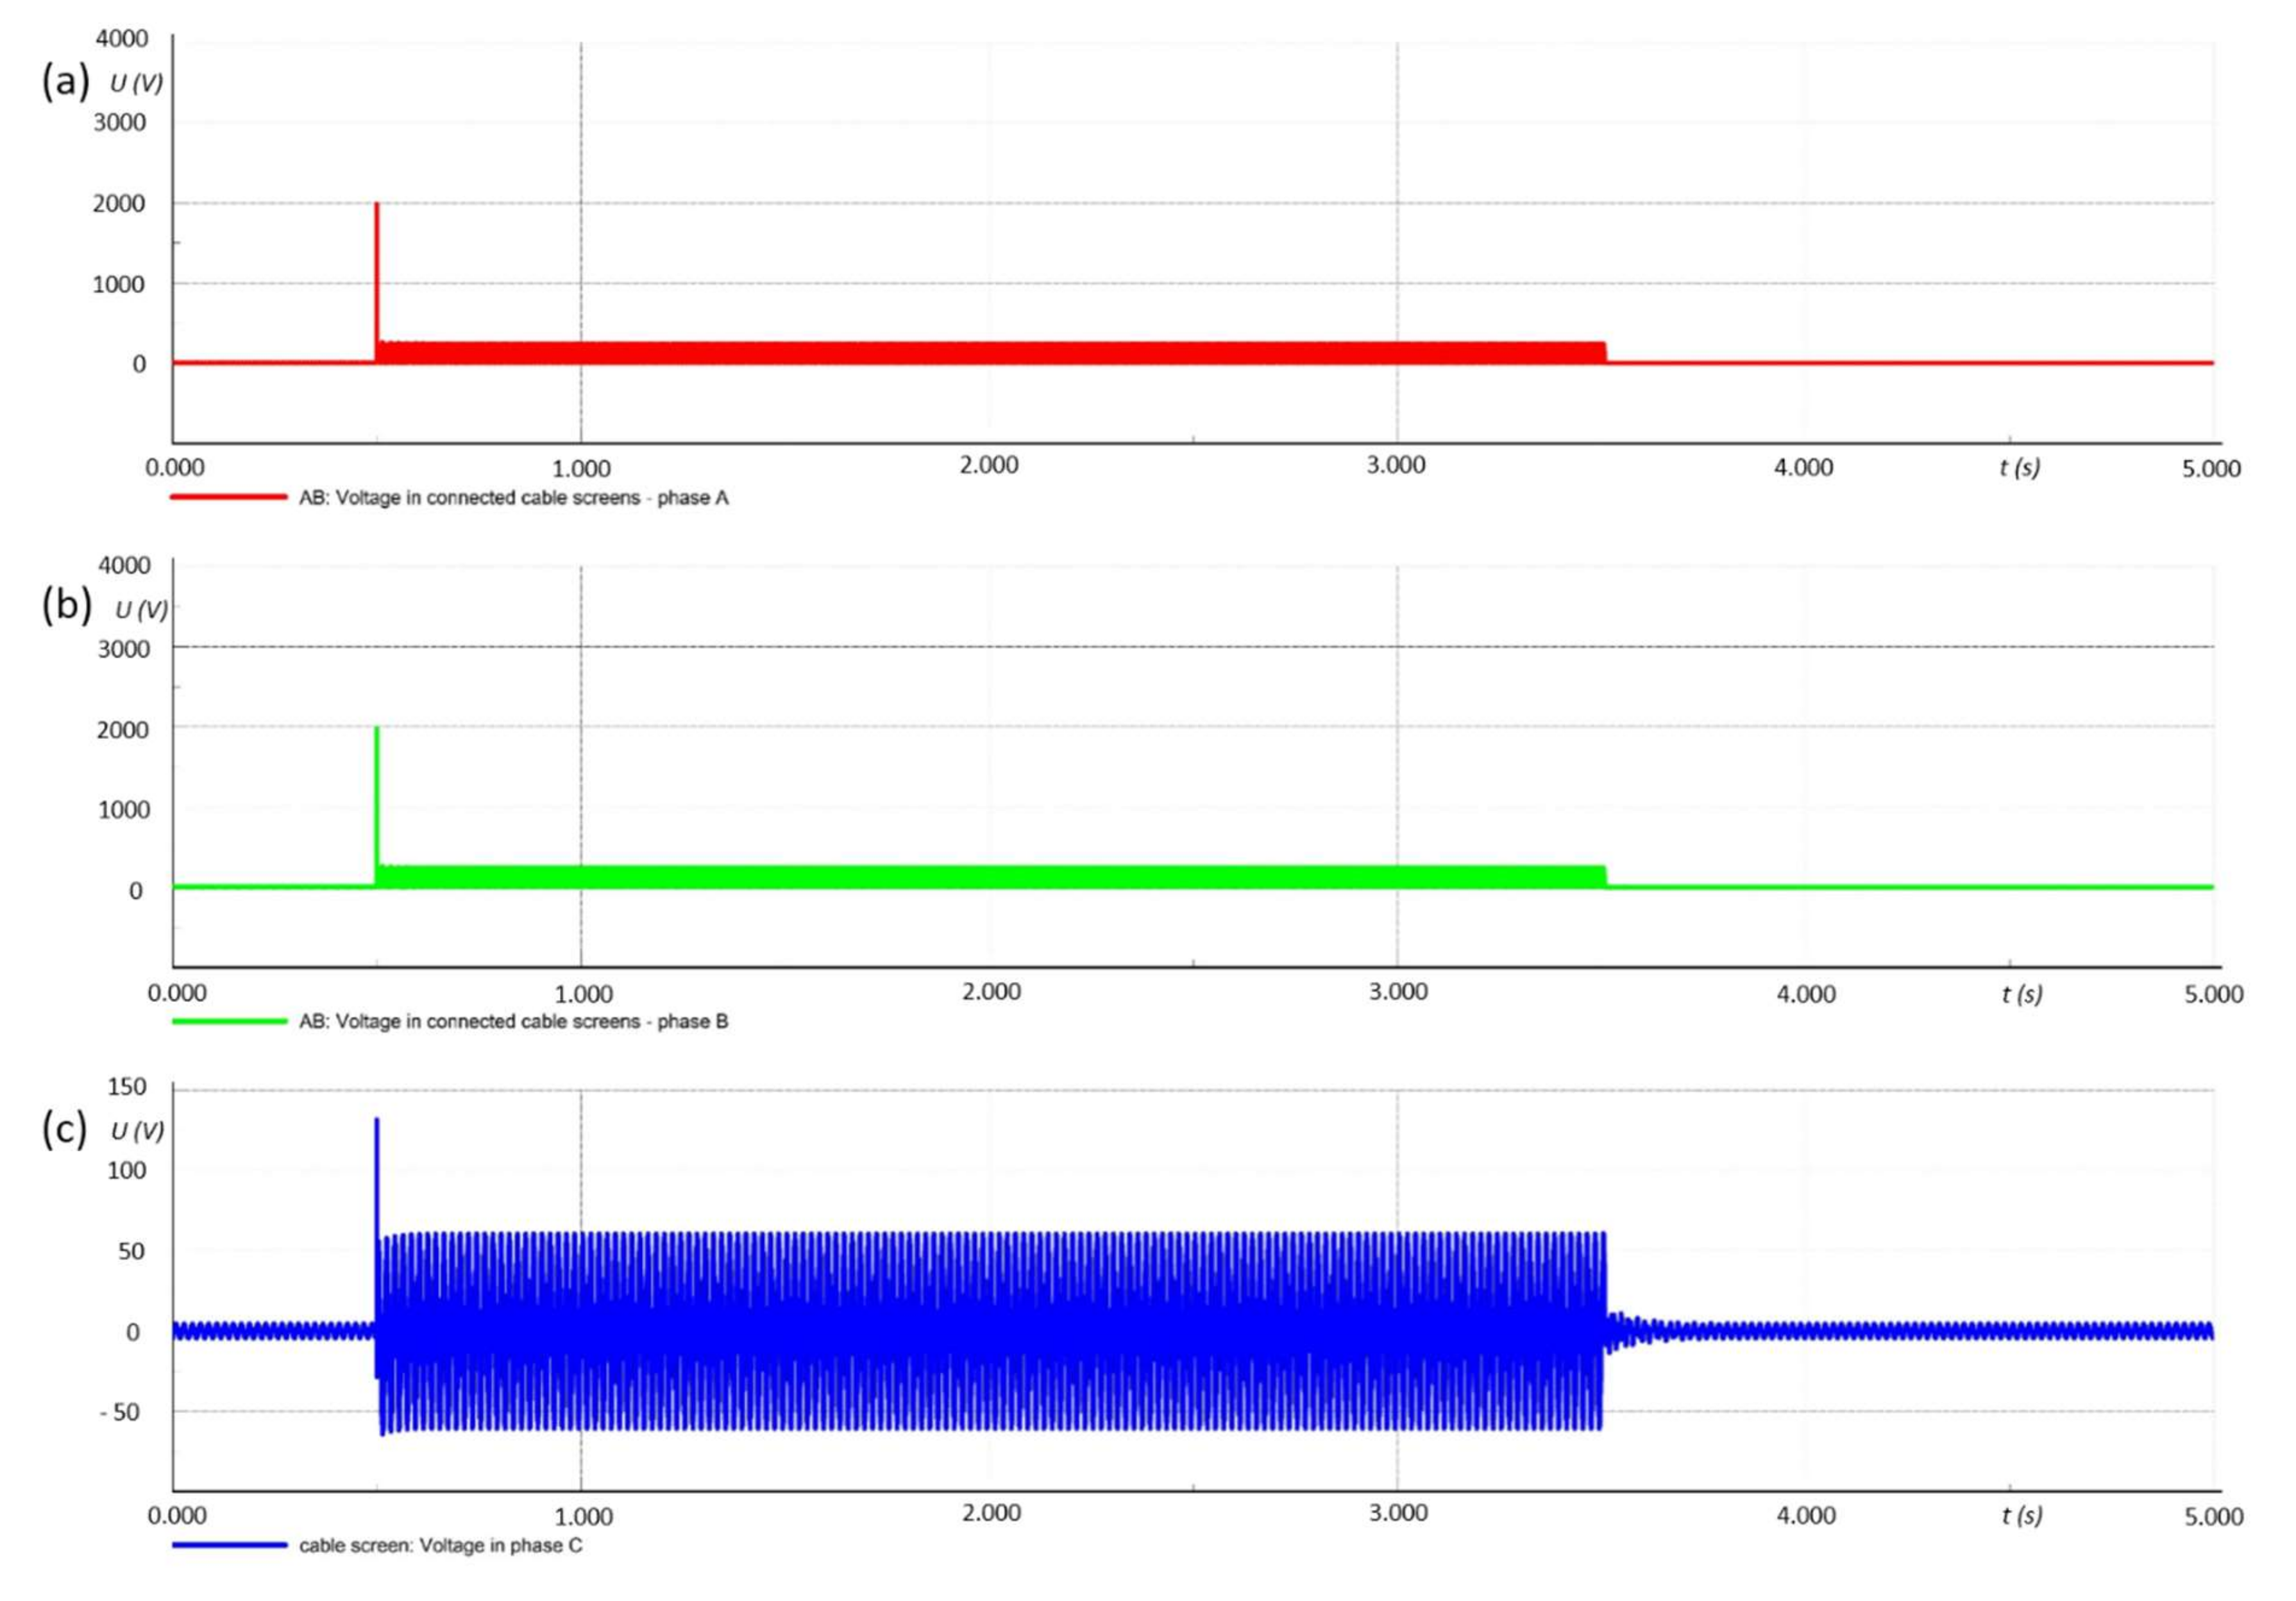
The last simulation test held for this paper relates to the effect of connecting ungrounded cable screens together. In this case, phases A and B of the cable screen were ungrounded and joined through the connector. Single-phase to ground fault was performed again in phase A.
Simulation results are presented in form of
Table 5, where maximum overvoltage values occurring in the cable screen phases were entered. According to this scenario, overvoltages measured for phases A and B on their ends are the same, at about 2 kV. The maximum voltage value in phase C is the lowest from all previous simulations, at 131 V.
In
Figure 7, the waveform representation of voltage in cable screen is shown. In this diagram, only two waveforms are presented. The first represents voltage in the connected cable screens of phases A and B, and the second represents the voltage measured at the end of phase C.
3.2. Field Studies Results
According to research subject, field studies were carried out to verify simulation tests listed in
Section 3.1. Both simulation tests and field studies were performed for cable lines connected with an overhead line, in which the fault states were forced.
The field tests were conducted in a real network. Two test stands and a fault test stand have been prepared for the implementation of research tasks. The first measuring station was located at the medium voltage (MV) switching station. Current and voltage recorders were located in the primary circuits of one of the fields and in the cable screen groundings of the cables. The second measuring stand was organized around the pole, on which termination and connections with an insulated overhead line were installed. On the prepared platform, there are recorders and resistive voltage dividers for recording voltages and currents in the cable screen. The most important measuring device, from the point of view of overvoltage measurement in this system, was the resistive voltage dividers system. This measuring system comprises three dividers that can measure voltage in a three-phase system. By using the appropriate resistance gear, it allows users to select the measuring range necessary for the transient states. Results were recorded using the oscilloscope.
Fault tests were carried out for individual configurations. As a result of the tests, the following registrations were obtained.
3.2.1. First Scenario
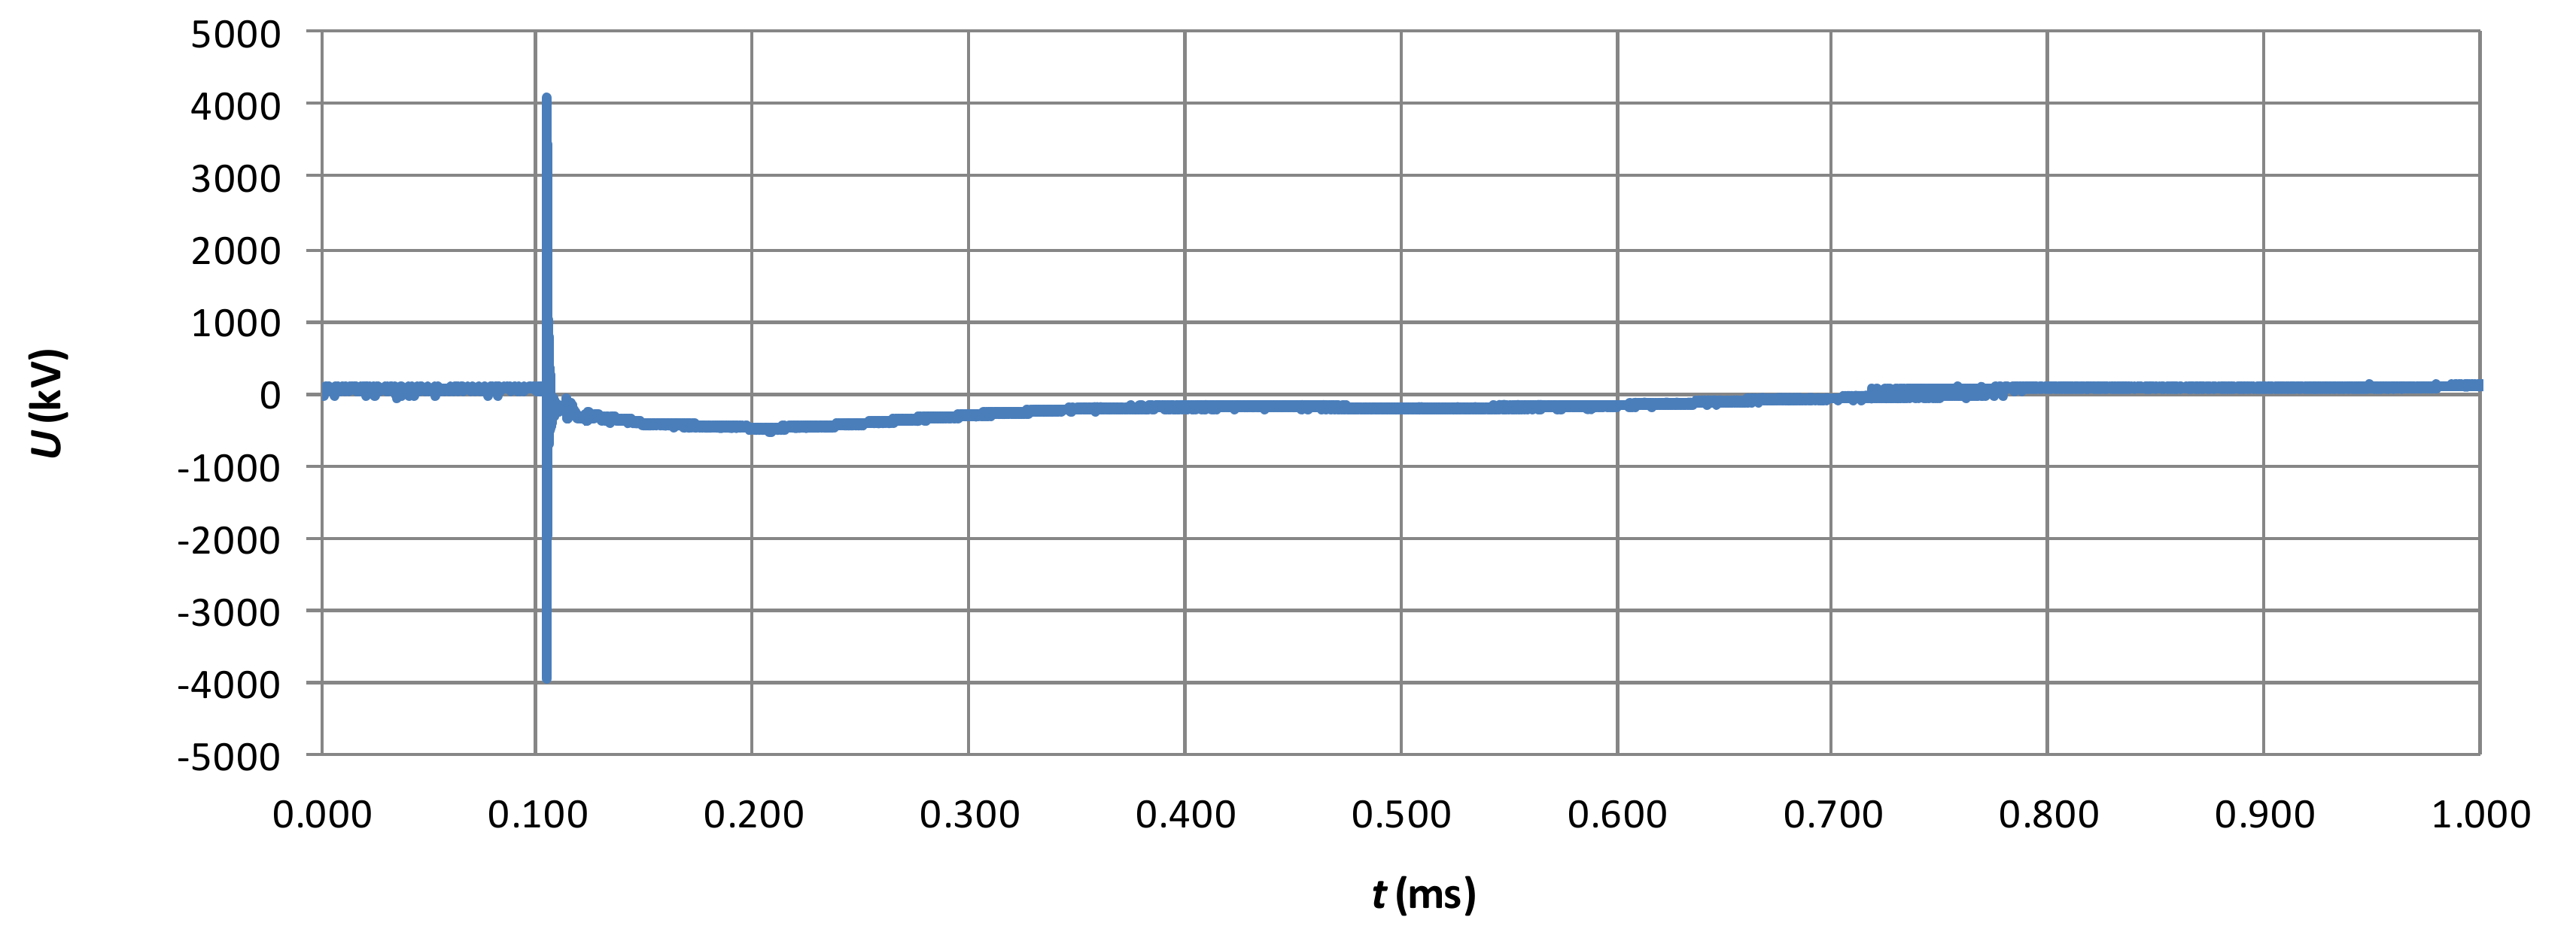
Figure 8 shows the voltage waveform recorded for the cable screen of phase A, during the phase A ground fault test. As shown in the diagram, a steep initial waveform appeared in the cable screen, which disappeared aperiodically over several hundred microseconds. At the climax, the overvoltage reached over 4 kV. Comparing the results obtained from measurements and simulations, one can notice a significant difference, namely the fact that the overvoltage waveform measured in the field tests in its first phase is characterized by some short-term oscillation, while the simulation waveform is aperiodic. This momentary change in signal polarization is most likely due to imperfections of the measuring track elements (e.g., high voltage divider), or also due to the fact that the grounding of the overhead line is made by an interrupter, in which transient vibrations may also occur when the contacts are connected. In all further analyzes, the maximum overvoltage value was consistently adopted as a reference point, which increases in the first phase from the moment of the interrupter launch.
3.2.2. Second Scenario
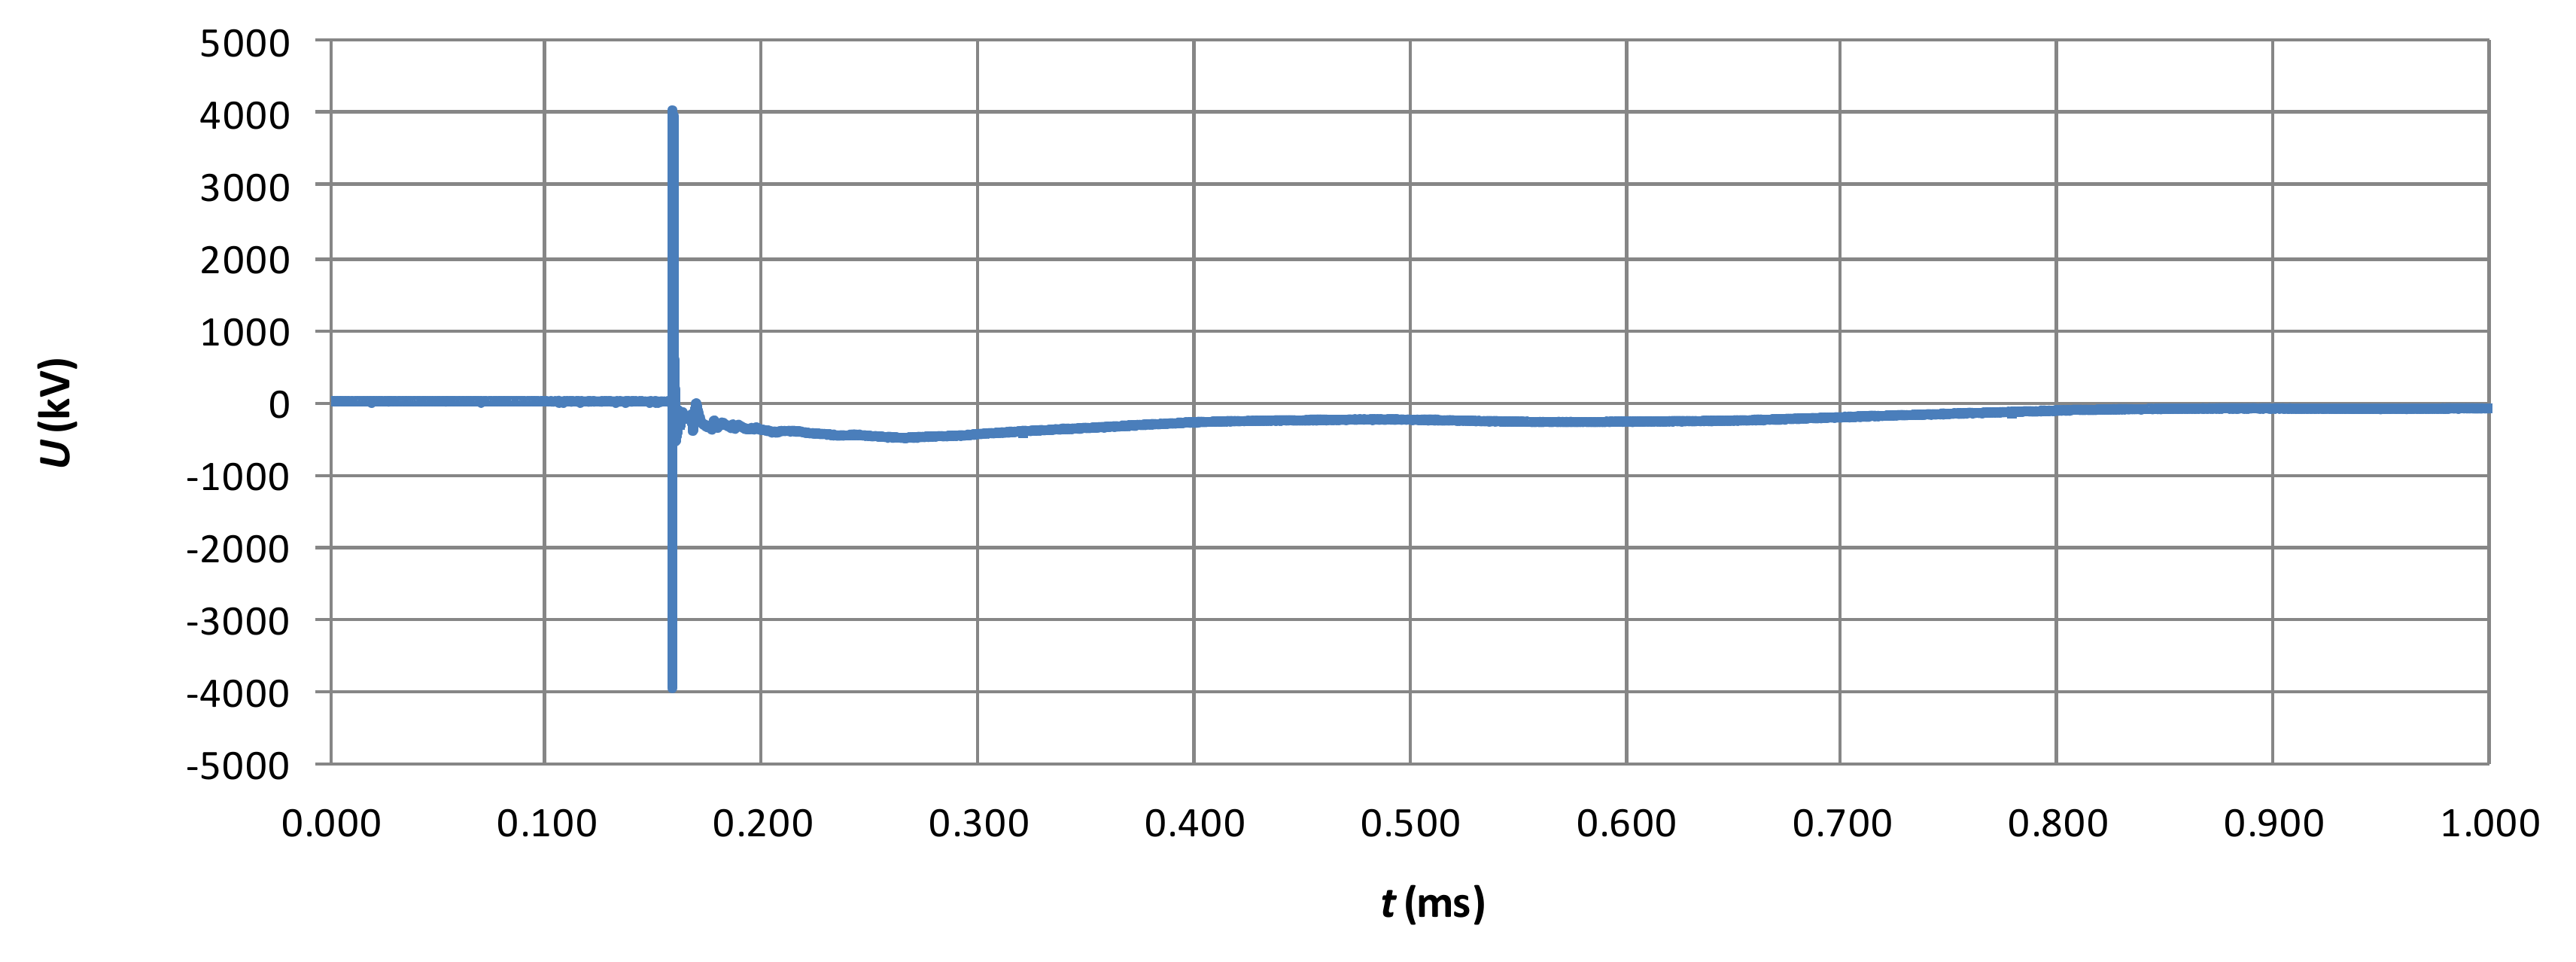
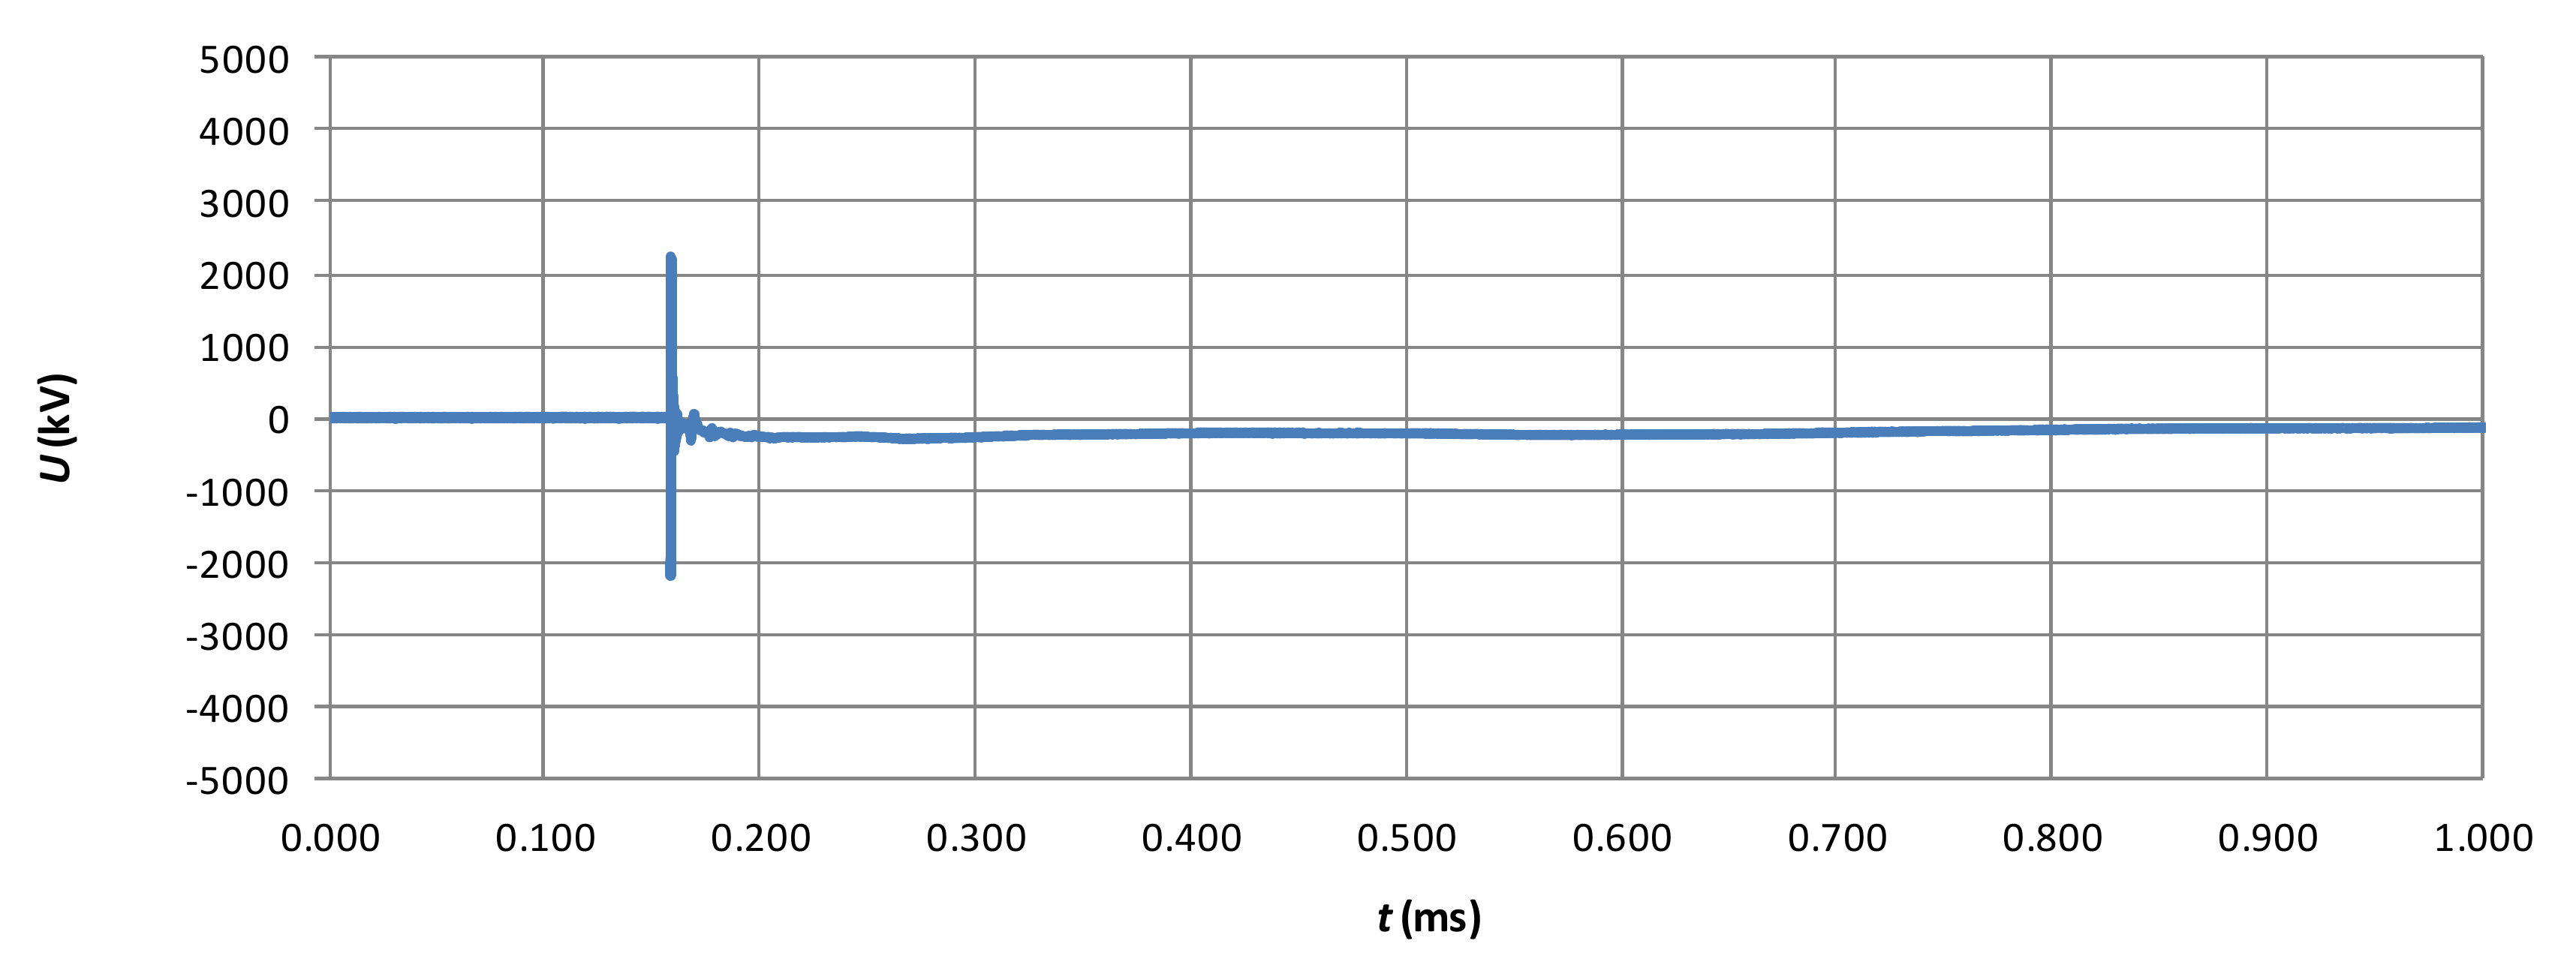
Figure 9 and
Figure 10 show the voltage waveforms recorded on the ungrounded phase A and phase B cable screen during the phase A ground fault test. As shown on the diagram, steep wave overvoltages appeared in the cable screen, similar to those obtained in the first configuration. At the climax, the overvoltage on phase A was over 4 kV. The voltage at the adjacency ungrounded phase B reached over 2 kV—significantly lower than in phase A, which was grounded.
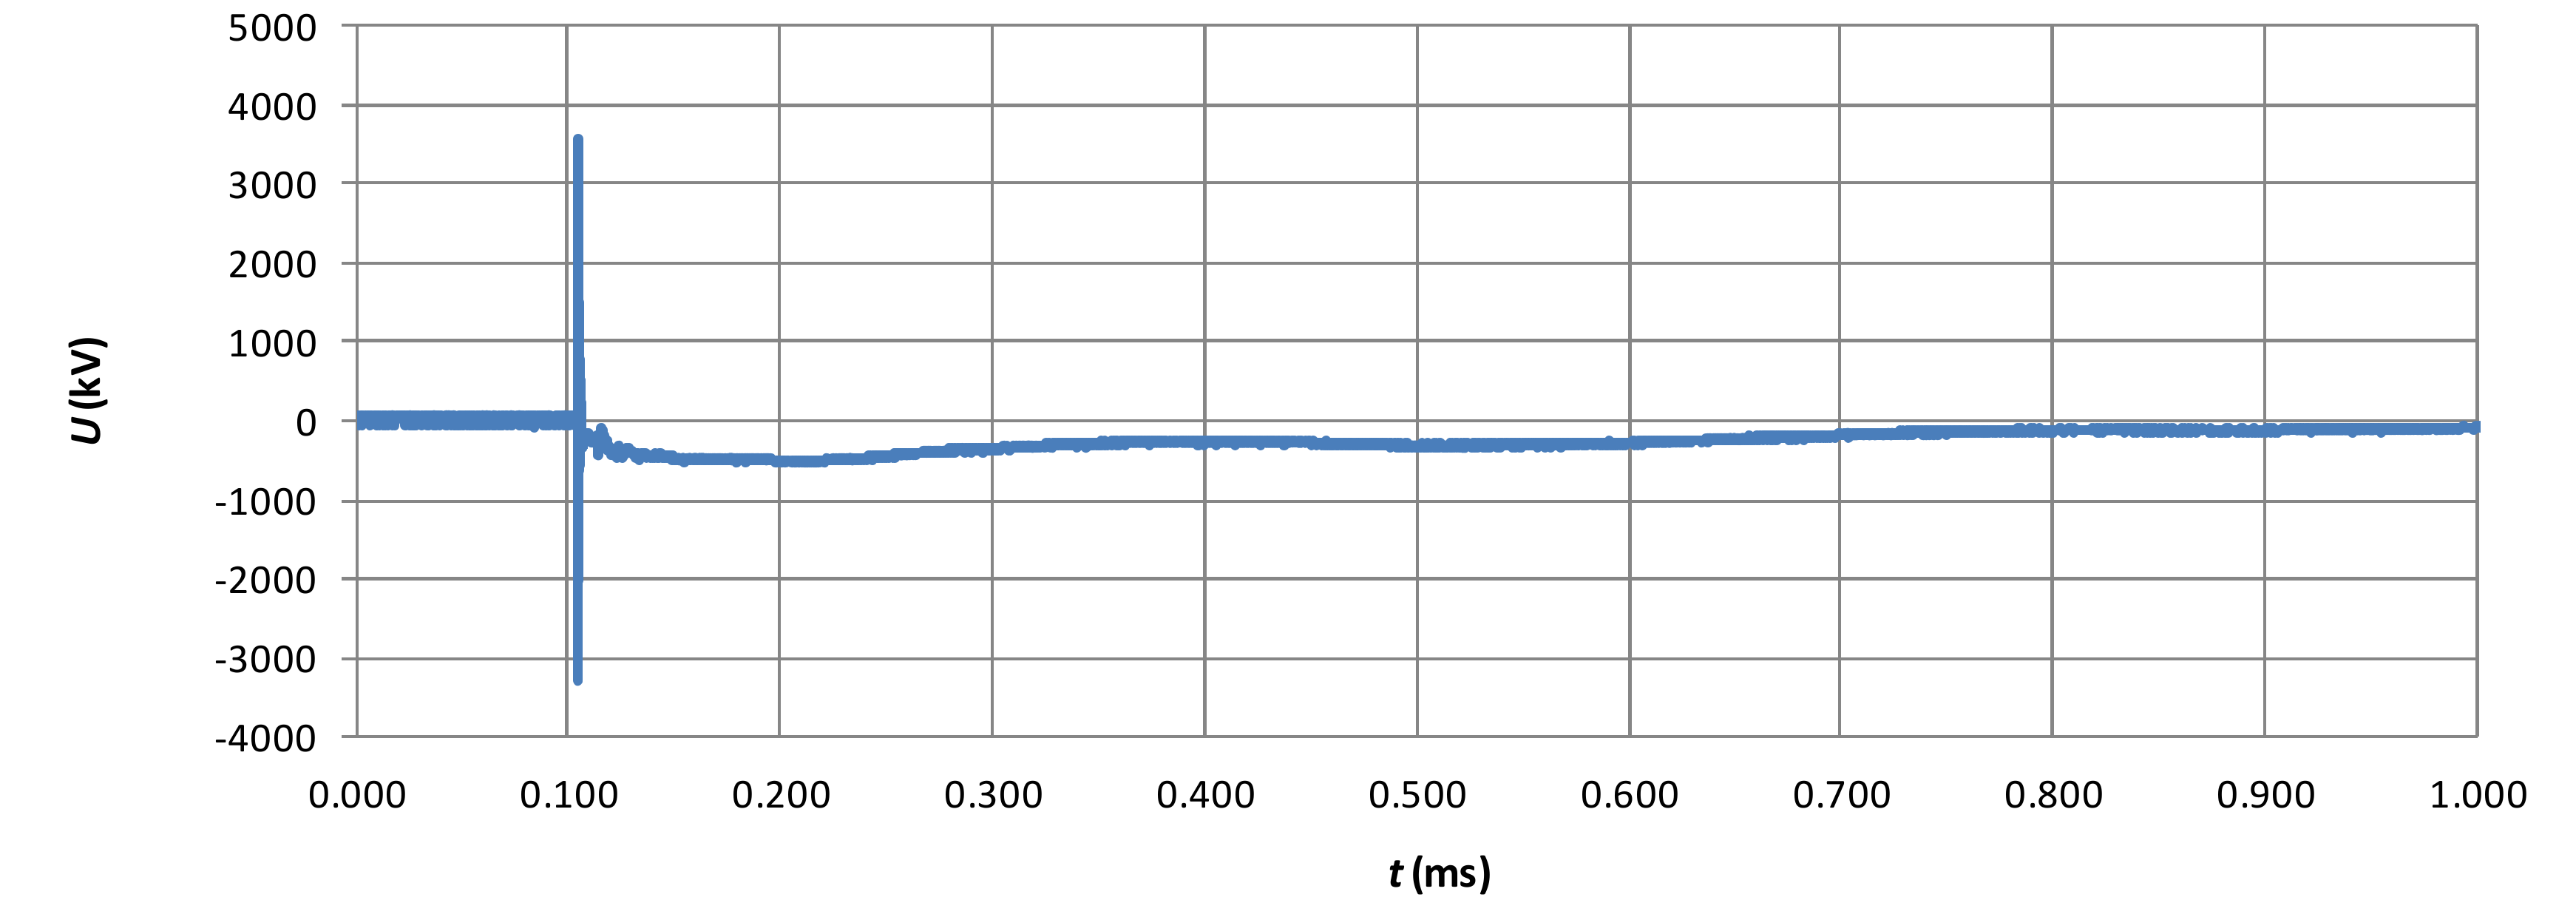
3.2.3. Third Scenario
Figure 11 shows the voltage waveforms on the ungrounded and joined phases A and B of cable screen, recorded during the phase A ground fault test. As shown on the diagram, overvoltage appearing in the cable screen in its peak reached a value of over 3.5 kV.
4. Discussion
In this chapter, differences between performed researches are presented. The maximum voltages measured in the real system and voltages obtained as a result of simulations in the Power Factory program will be compared to verify the computer analysis method. However, the most important result of the research presented above is the actual impact of one-sided ungrounded phases of cable screens on the increase in voltage generated in these screens.
The methodology of the research used for comparative analysis requires describing the basic differences between them, which can affect the reception of the studies’ results. The main difference is in the time domain, which in computer simulations covers the whole simulation comprising three states—a normal state, fault state and state after switch open—while in the case of field studies, only the first few moments of fault states can be seen. This is the reason for the difference in the range of values presented on the horizontal axis, where for the simulation the maximum value is 5 s, while for the waveforms registered during field studies it is only 1 ms. This condition does not affect the possibility of analyzing and comparing these results, as the comparison mainly concerns the peak value of overvoltages, which are presented on both types of waveforms. For the first case, when only phase A of the cable screen was ungrounded, the results for this screen are shown in
Table 6. According to received values, it can be stated that the simulation network model was chosen correctly, as the difference between the peak voltage values is about 5%.
The next part of the papers shows the case of one-sided ungrounded phases A and B of cable screens in this three-phase system. The output data registered with an oscilloscope during a field test are voltages in ungrounded phases A and B. For comparison,
Table 7 shows the results obtained in the computer simulation of such a variant. In this case, differences for phase A are similar to the first scenario, although for phase B the difference is larger. Such a difference may be related to the calculation model used in the program.
The last case concerns the configuration of cable screens as in scenario 2, where phase C was the only grounded phase, with the difference that the ungrounded phases A and B were in this case joined together at the ungrounded end. Therefore, in the real system during field tests, it was possible to connect the measuring divider to the connected ends of cable screens and measure their common voltage. Furthermore, in the simulation program, measured value is a common voltage at the point of contact. The obtained results are presented in the form of
Table 8. For this measurement, the difference in the results obtained is the largest. The probable reason for this phenomenon is that in the model system and in measurement during field tests, ground faults could occur at a different phase angle, which affects the value of overvoltage amplitude. Unfortunately, during the field tests it was not possible to control the moment of the short circuit, as for formal reasons (internal regulations of the energy company) the interrupter was operated remotely. However, by registering voltage and current waveforms in the system, we could observe that the moment of short circuit induction had some effect on the overvoltage amplitude, allowing it to reach even 20–30%.
5. Conclusions
Comparing the results of simulation analyzes and field tests, their high convergence can be noticed, which indicates that the network system has been modelled properly.
Both simulations and field tests indicated the possibility of generating overvoltages at the open ends of cable screens, especially in the phase in which the ground fault occurred. The level of overvoltages for the modelled network system, both in simulation and field tests, was from about 2.5 kilovolts (kV) to over 4 kV. In this specific case, overvoltage does not exceed a safe level, although a change in the cable line parameters could increase these overvoltages. Assuming that the 5 kV voltage is a safe level for the cable coating (tested in the so-called leakage test), it should be assumed that in general, the generated overvoltages may pose a threat to its integrity.
Field studies also showed that two ungrounded cable screen phases connected together may reduce the level of overvoltages generated in a cable line. In conjunction with the conclusion of previous analyses, which showed that configuration allows the further reduction of transmission losses, it may be worth considering such a solution in practice.
It seems that regardless of the configuration of the cable line, it will be required to install a surge arrester or surge arrester in cable screens to reduce the risk of damage to its coating. The issue of selection of overvoltage protection, which will be correlated with the actual strength of the sheath of the medium voltage (MV) cable used, should be the next step in future work concerning this issue.


